Widespread Snow Free Glaciers in Svlabard 8-2024

Most Svalbard glaciers in this Landsat image from 8-8-2024 are snow free. This view is centered on 78 N and 19 E spanning parts of Barentsoya, Edgeøya and Spitsbergen. On Langjokulen (La), Kvitisen (Kv), Bergfonna (Be), Blaisen (Bl) and Storskavlen (St) on Edgeøya snow cover is gone. Bjarmanbreen (Bj), Passfonna (Pa), Hellefonna (He), Sveigbreen (Sv), Nordmannsfonna (No), Isrosa (Is), Kamfonna (Ka), Breitfonna (Br), Rugaasfonna (Ru), Hayesbreen (Hy), Heuglinbreen (Hu) on Spitsbergen all snowcover is lost.There is a small amount of snowcover left in the upper reaches of a few glaciers including Freemanbreen (Fr), Gruvfonna (Gr), Siakbreen (Si), Von Postybreen (VP) and Fimbulisen (Fi).

All the glaciers labelled in the Nathorst Land and Nordenskjold Land region of Svalbard are snow free on 8-11-2024 in this Landsat image. Er=Erdmannbreen, Fr=Fridtjovbreen, Gr=Gronfjorden, Ta=Taviebreen, Ma=Marstranderbreen, Gl=Gleditschfonna in Nordenskjold. HO=Hoegh Omdalbreen, Sn=Snokubreen, Fy=Frysjabreen, In=Instebreen, Ri=Richterbreen, Ri=Ringerbreen, La=Langlibreen, Lo=Loyndebreen, Lu=Lundbreen, Sy=Sysselmannbreen in Nathorst Land.

Warm temperatures across Svalbard in July and early August has resulted in many glaciers losing all of their snowcover. The result will be enhanced and significant thinning of these glaciers. This follows on 2022 which was the warmest summer on record in Svalbard and led to many snow free glaciers (Pelto, 2022). This record was exceeded in summer 2023 (Copernicus Climate Change Service, 2024). Here we look at Landsat images and Sentinel images across several islands from late July and early August illustrating the widespread nature of the extensive glacier snow cover loss.

For ice caps such as Glitnefonna, Langjokulen (La), Kvitisen (Kv), Bergfonna (Be), Blaisen (Bl) and Storskavlen (St), because of their low top elevation and relatively flat slopes their ability to survive is dependent on much of meltwater generated on the higher plateau areas being refreezing within the firn instead of escaping the glacier (Noel et al 2020). In 2020 the snowcover was lost and the firn thickness diminished. In August 2022 the snowcover again was lost and there was little evident firn that could lead to refreezing of meltwater. In August 2024 snowcover loss has again occurred.

For the glaciers of Spitsbergen to maintain .equilibrium requires 50% of the glacier needs to be snowcovered at the end of summer. By early August with a month left of summer melt, the area is below 10% on every glacier noted above. How much more melt will occur. The net result will be extensive mass loss once again (NASA EO, 2024).

Glitnefonna is a 145 km2 ice cap in Gustav Albert Land where snowcover declined from 55% snowcover on 7-22 (purple dots) to 0% snowcover on 8-9-2024 in these Sentinel images. A small area of saturated firn/snow is evident, yellow dots.
Glitnefonna is a 145 km2 ice cap in Gustav Albert Land where snowcover declined from 50% snowcover on 7-18 (yewllow dots) to 0% snowcover on 8-9-2024 in these Landsat images.

Great Glacier Retreat 1965-2023 Leads to formation of “Great Lake”

Great Glacier terminus change from 1986-2022 illustrating lake expansion. Red arrow=1986 terminus location, Yellow arrow=2022 terminus location. Terminus has retreated 2.1 km during this time with the lake growing 15 km2.

Great Glacier is the largest outlet glacier of the Stikine Icefield feeding the Stikine River. The name came from the large expanse of the glacier in the lowlands of the Stikine River during the late 19th and early 20th century, that has now become a large lake. In 2023 I worked on a signage project for the Great Glacier Provincial Park with Hailey Smith, BC Park Ranger, documenting the changes in this glacier particularly since 1914.

The glacier filled what is now a large lake at the terminus of the glacier pushing the Stikine River to the east side of the valley. The Tahltan nation oral history relates when the glacier bridged the Stikine River and meet Choquette Glacier. In 1914 the glacier was easy to ascend from the banks of the Stikine River, the picture above is from the National Railroad Archive. By 1965 the new lake had formed, but the glacier still reached the far side of the lake in several places as indicated by the 1965 Canadian Topographic Map below. R. Patterson (Writer and Canadian Explorer 1898-1984) noted that Great Glacier came down onto the river flats, and displayed a 7 km front visible from the Stikine River.

Map of Great Glacier in 1965 illustrating the fringing lake.
Landsat images from 1990 and 2022, illustrating changes in the glacier and lake. The transient snowline is at ~900 m in both images.

A comparison of 1986, 1990, 2011 and 2022 illustrates the retreat. By 1986 the new lake had largely developed, and the glacier was beginning to retreat into the mountain valley above the lake. Retreat from the moraines of the late 19th century was 3200 m. By 2011 the glacier had retreated further into valley, 900 m retreat from 1986-2011. From 2011 to 2022 the glacier retreated another 1200 m. The lake has expanded to an area of 15 km2

A view of the glacier from across the lake today indicates the distance to the now valley confined glacier, and the trimlines of the former ice surface, yellow arrows in middle image The Great Glacier has one major tributary on the northeast tributary that is very low in elevation with a top elevation of 800 m. Given the regional snowline of 1100-1200 meters in the 1980s (Pelto, 1987) this is too low to retain snowcover through the summer and will lead to rapid progressive thinning. In 2018 and 2019 the highest observed snowlines in the region occurred, the snowline averaged 1500 m, leaving just 10% of the Great Glacier snowcovered. This is instead of the 60% needed to maintain equilibrium. Stikine Icefield outlet glaciers are all undergoing substantial retreats including Sawyer Glacier, Baird Glacier and Dawes Glacier.

Great Glacier snowline end of summer in 2018 and 2019 reached the highest levels observed at 1500-1600 m.

Novosilski Glacier, South Georgia Retreat Causes Separation

Novosilski Glacier in Landsat images from 2020 and 2022. Note the retreat near Point A in particular. The terminus that extended from Point B-C developed an embayment reaching Point A.

Novosilski Glacier is a large tidewater outlet glacier on the west (cloudier) coast of South Georgia terminating in Novosilski Bay It shares a divide with the rapidly retreating Ross and Hindle Glacier on the east coast.  Gordon et al. (2008) observed that larger tidewater and calving outlet glaciers generally remained in relatively advanced positions from the 1950’s until the 1980s. After 1980 most glaciers receded; some of these retreats have been dramatic, such as at Neumayer Glacier. The west coast has featured much less retreat than the east coast.  The change in glacier termini position have been documented by Cook et al (2010) at British Antarctic Survey in a BAS retreat map,  identified that 212 of the Peninsula’s 244 marine glaciers have retreated over the past 50 years and rates of retreat are increasing. Pelto (2017) documented the retreat of 11 of these glaciers during the 1989-2015 period.  NASA Earth  piggy backed on the retreat of some east coast glaciers seen in Landsat images.

Novosilski Glacier in Landsat images from 20o3 and 2022. Note the retreat from Point D  in 2003 to Point A in 2022  ed from Point B-C developed an embayment reaching Point A.

In 2003 Novosilski Glacier terminated in shallow water just east of a small island that acted as a pinning point, Point D.  By 2009 the glacier had retreated only a minor amount from this island into deeper water.  A rapid retreat ensued and by 2016 the glacier had retreated into a narrower fjord reach. The north and south margins featured remnant ice that was based above tidewater, Point B and C.  By 2016 the 2 km wide calving front had retreated 2.5 km from the 2003 position.  There was no significant retreat from 2016 to 2020.  By March of 2022 the glacier has retreated 1 km in the glacier center further leading to separation of the glacier into a northern and southern arm separated by the the Point A rock rib. The retreat also has led to a 6 km2 expansion of Novosilski Bay. The glacier slope at the terminus is steep and active, suggesting retreat may slow again.

Novosilski Glacier in Landsat images from 2016 and 2022. Note the retreat near Point A in particular. The terminus that extended from Point B-C developed an embayment reaching Point A.


Herz Glacier, South Georgia Loses 25% of its Length 1989-2021

Landsat images from 1989-2021 of Herz Glacier.  Red arrow is 1989 terminus location, yellow arrows the 2021 terminus location. I=Iris Bay.

Herz Glacier is on the southeast coast of South Georgia Island, and is adjacent to the Twitcher Glacier. The terminus change of this tidewater glacier ending in Iris Bay was completed by the British Antarctic Survey for the 1960-2011 period, see map below (Gordon et al, 2008). This map indicates the slow retreat from 1960-1988 and a more rapid retreat since. Here we utilize Landsat imagery from 1989-2021 to examine terminus change.

In 1989 the glacier is 10 km long with the terminus located in the east trending arm of Iris Bay at a point where it widens substantially. Point A is the midway point of the glacier.  By 2002 the terminus has retreated ~1.1 km to Point B in a narrower portion of the fjord.  The calving front is 0.9 km wide in 2002.  By 2009 the glacier had retreated 1.8 km on the north side of the fjord and  2.2 km on the south side. The overall 2 km retreat is a rate of 100 meters/year and is 20 % of the total glacier length (Pelto, 2017). By 2015 the terminus has retreated into an even narrower portion of the fjord, which would reduce calving.  The snowline in both 2002 and 2015 is ~1000 m. In 2021 the terminus has continued to recede and could be nearing the head of the fjord. The snowline in 2021 is somewhat above 1000 m in the early March landst image.

The retreat has been 2.5 km in the 32 year period from 1989-2021, a rate of  78 m/year.  The glacier is nearing the inland end of the ridge separating Herz from Twitcher.  As both Twitcher Bay and Iris Bay have expanded there are certainly new locations for both elephant seal and penguin colonies (BAS, 2018). The retreat of this glacier is comparable to that of other South Georgia glaciers noted by NASA Earth Observatory; Neumayer Glacier, Twitcher Glacier and Hindle Glacier.

Landsat images from 2002 and 2015 of Herz Glacier.  Red arrow is 1989 terminus location, yellow arrows the 2021 terminus location. I=Iris Bay.

Map of Herz Glacier area from the British Antarctic Survey, illustraing glacier front changes 1988-2011. Yellow crosses mark elephant seal beaches and purple dots penguin colonies, which can expand to new locations in this opening fjord.

Shafat Glacier Separation and Stagnation, India

Shafat Glacier in 1997 and 2020 Landsat images.  1-6 are different tributaries with the main glacier being #1. A marks the junction of #1 and #6.

Shafat Glacier occupies the northeast flank of Nun Kun Peak in Ladakh India and drains into the Suru valley. The main valley glacier (1) has been fed by a decreasing number of tributaries. Shukla et al (2020) identified an increase in annual temperature has driven a 6% loss in regional glacier area and a 62% expansion in debris cover from 1971-2017. Here we compare Landsat imagery from 1997-2020 to identify this glaciers response to climate change.

In 1997 and 1998 tributary 2 and 3 join and then the debris covered sections connects to the main valley glacier #1. Tributary 4 terminus is the meeting point of two glacier tongues.  The active non-debris covered ice of Tributary #6 reaches to the valley adjacent to Point A where it meets the main valley tongue.  The active clean ice of the main tongue extends beyond Point A.  In 1997-2000 the terminus is heavily debris covered with the main discharge from beneath the glacier at Point B.  The active ice of Tributary 6 extends to within 1.5 km of the terminus, while the active/clean ice of the main tongue extends to within 1.3 km of the terminus. The snowline is at 4900 m in 1997 and 5100 m in 1998. By 2018-2020 the active ice area now ends 2.5  km from the terminus for Tributary 6 and 5.1 km from the terminus for the main glacier.  Debris cover extends 5.3 km from the terminus up the main tongue and 2.7 km from terminus at Point B up Tributary 6. Retreat is hard to discern with the extensive stagnant debris covered area. Tributary 4 has separated into two parts, and tributary 2 and 3 have separated from each other and the main valley glacier. In 2018 the snowline is at 5200 m, while in 2020 it is 5050 m.  The consistent high snowlines have led to glacier thinning, debris cover expansion, and increasing stagnation of the main glacier tongue. The stagnation is indicated by the increasingly concave cross profile and the lack of crevassing in the lower 5 km of the main glacier tongue below 4600 m. The low slope of the glacier from 4250-4400 m, of 4.8% suggests a proglacial lake could form in this reach of the main valley.

The glacier volume loss is more substantial than the area loss, with retreat less than on Kolahoi Glacier, but volume loss similar (Rashid et al 2019). Loss of glacier area leads to summer glacier runoff declines, which impacts irrigation Rashid et al 2019). The Suru River also has a 44 MW run of river Chutak Hydropower plant.

Shafat Glacier in 1998 and 2018 Landsat images.  1-6 are different tributaries with the main glacier being #1. A marks the junction of #1 and #6.

Digital Globe image of the terminus reach in 2000 and 2019. B marks the location of main river exiting from beneath the glacier. A marks the junction of the two glaciers. 1 and 6 indicate the two main glaciers that join 2 km above the Shafat Glacier terminus. Note debris cover spread particularly on main tongue.

Is Harlequin Lake, Alaska the fastest Growing Glacier Lake in North America this Century?

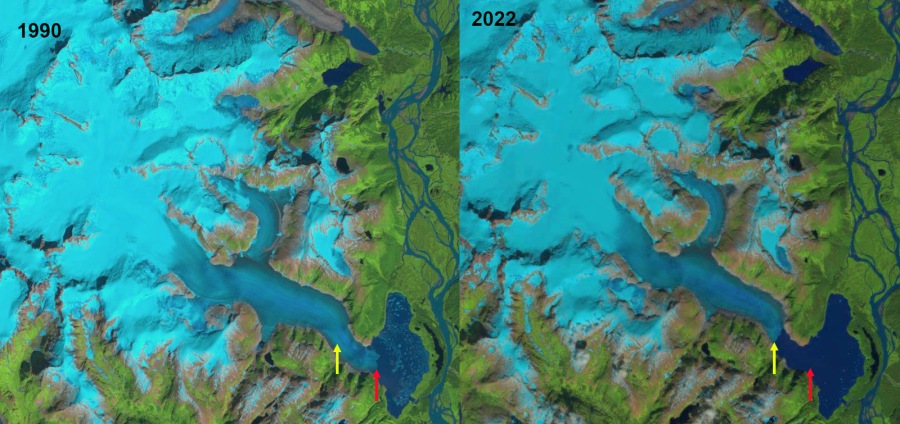
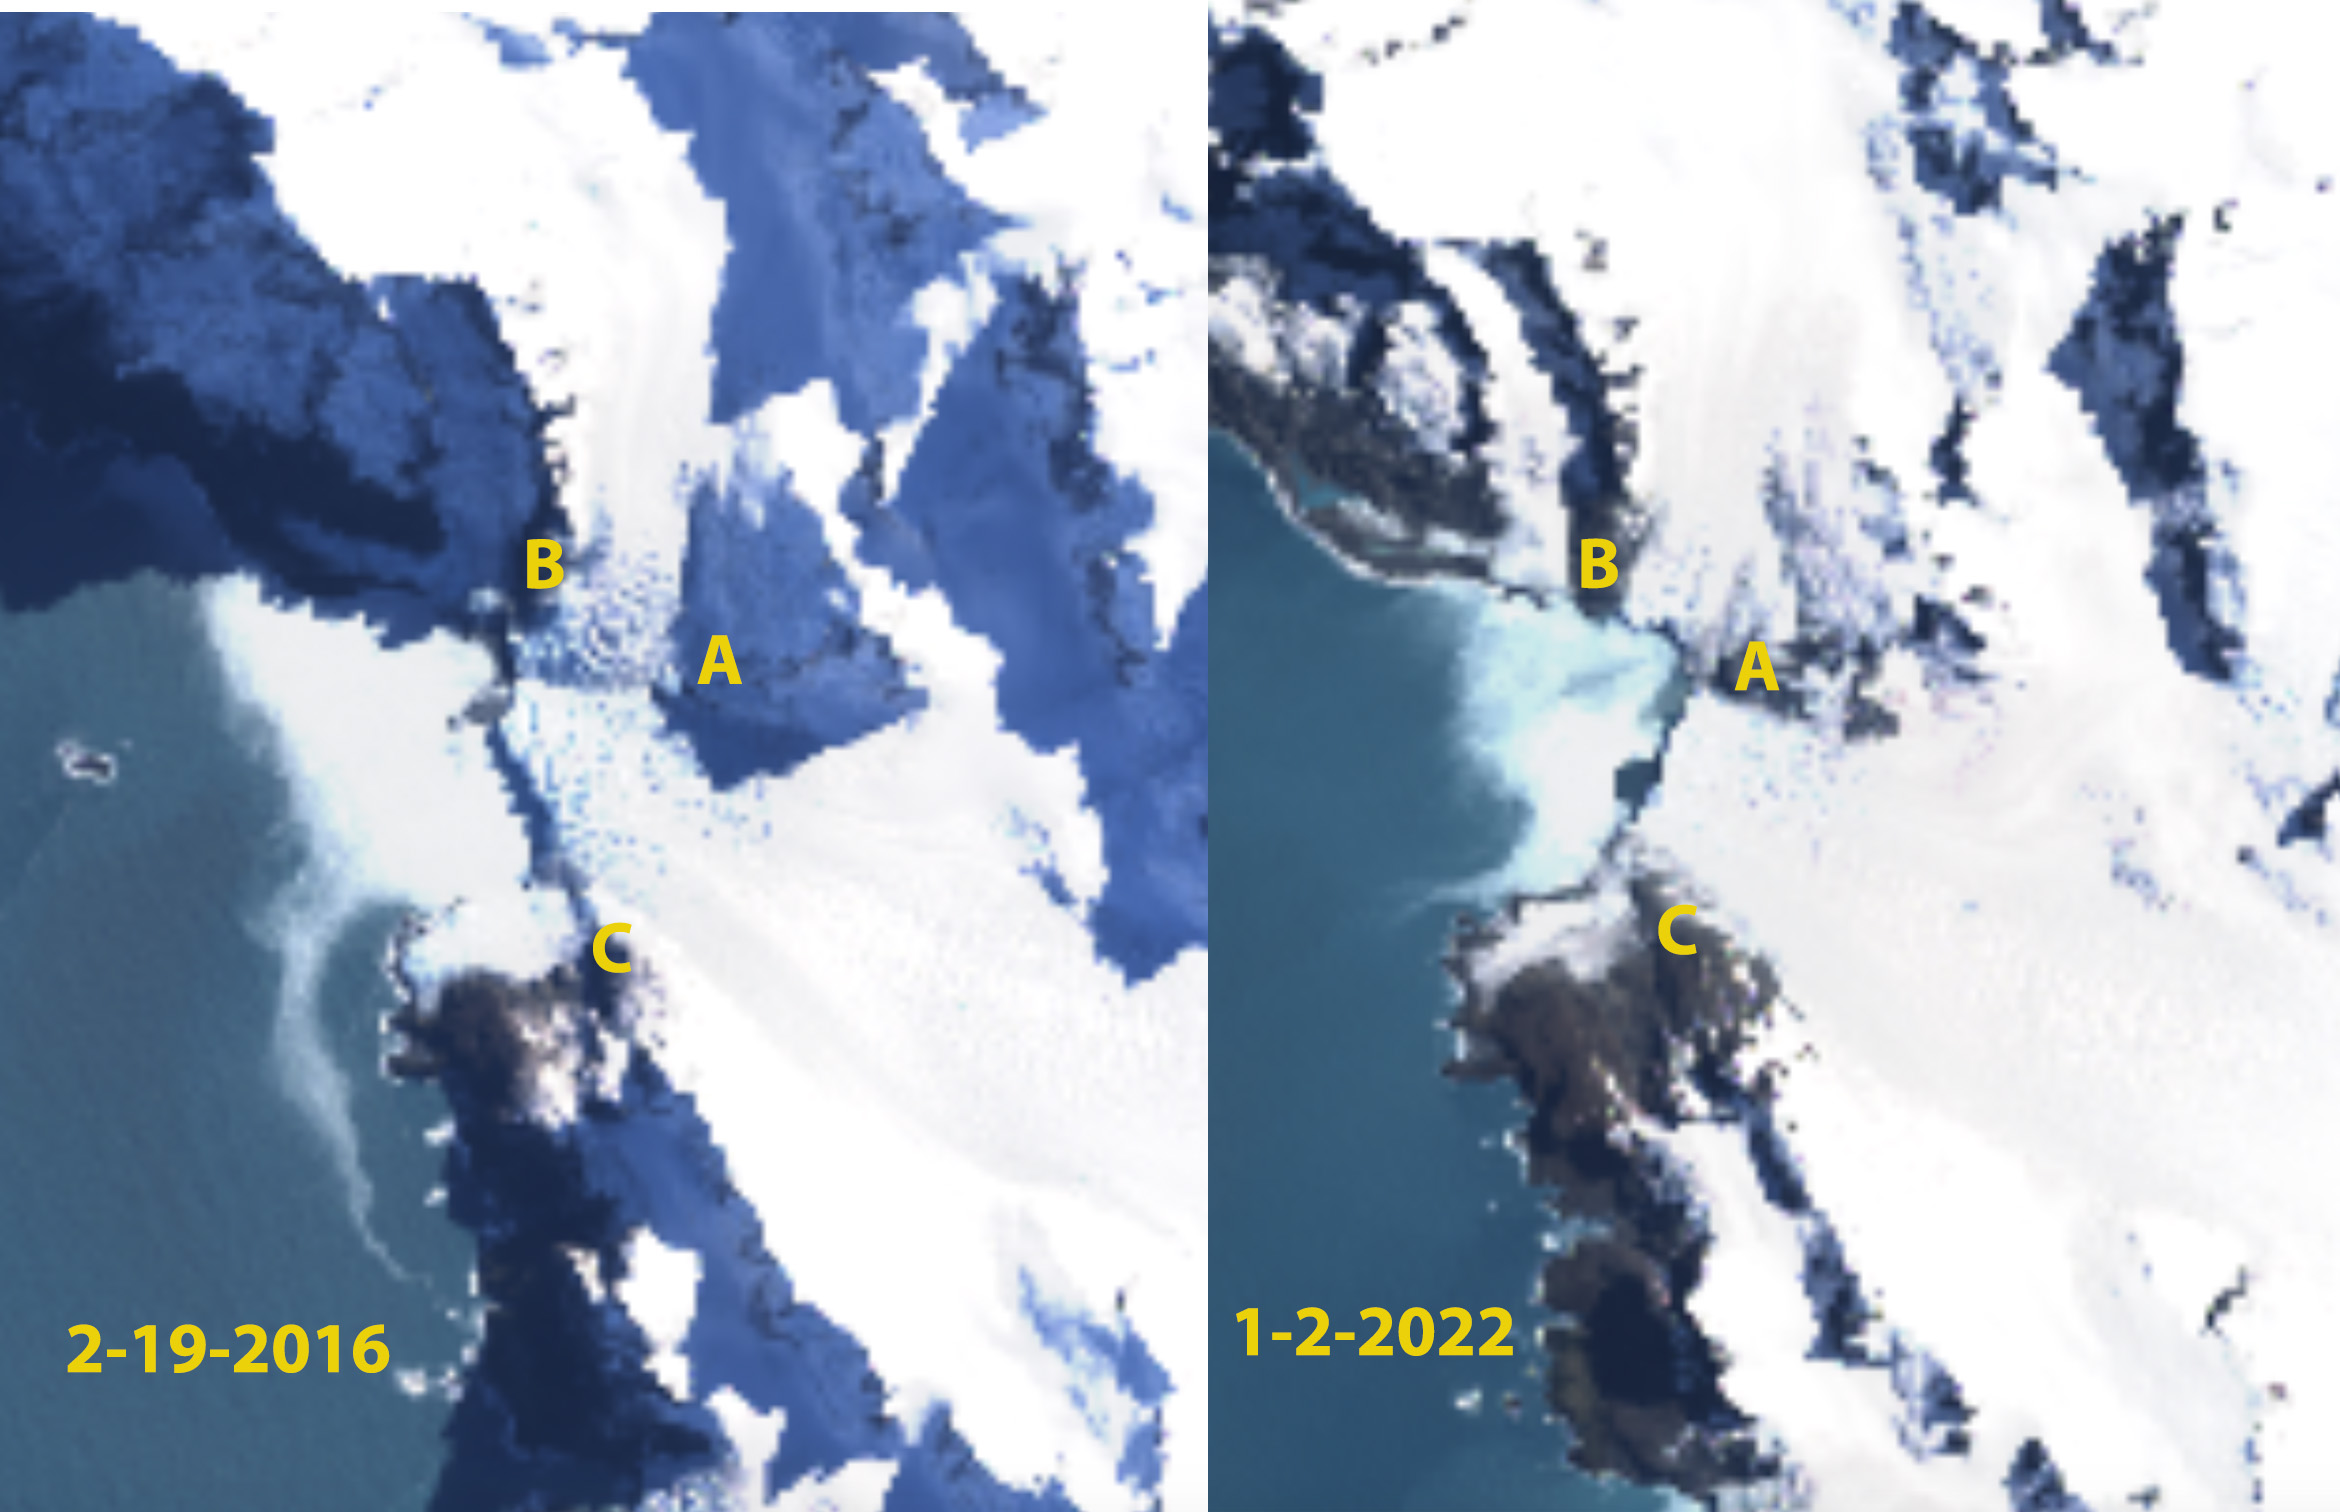
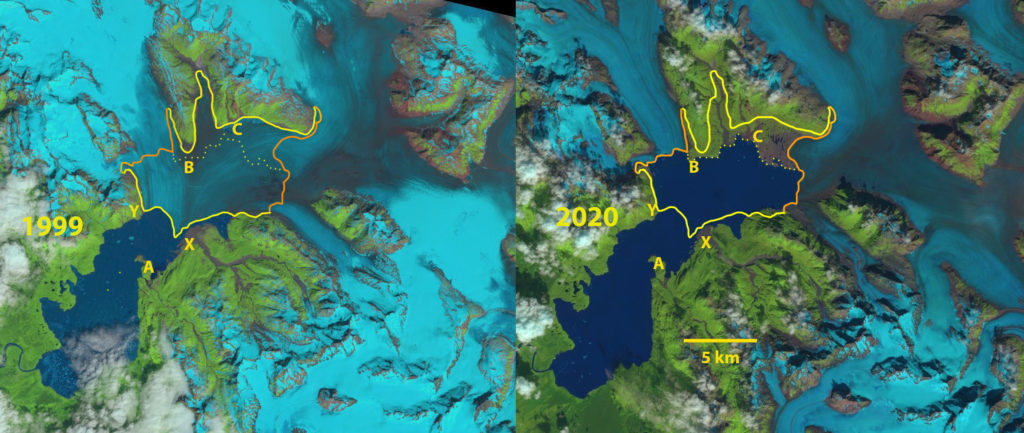
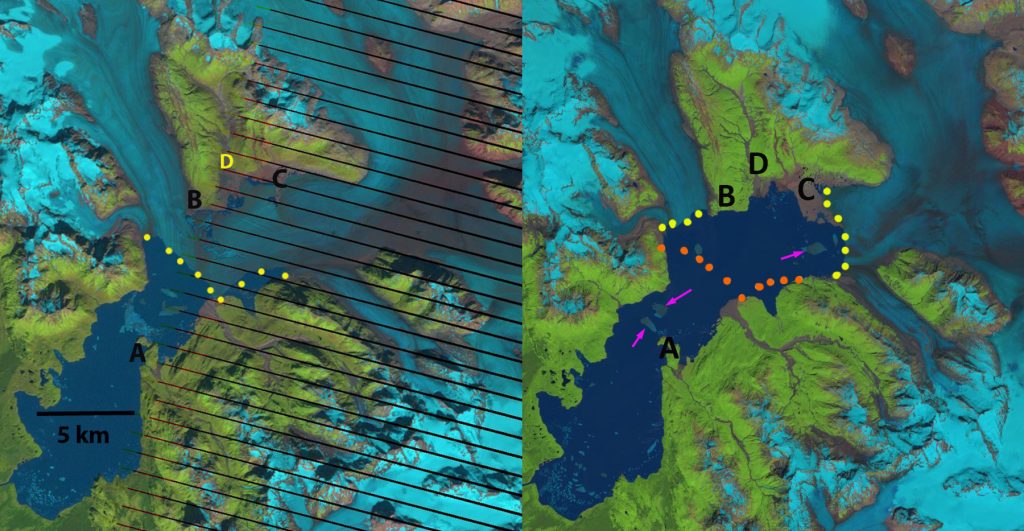
Yakutat Glacier, Alaska in 1999 and 2020 Landsat image illustrating expansion of Harlequin Lake by 40.5 km². Yellow line is the 1999 margin, orange line is the 2020 margin, and yellow dots indicate the margin of the lake shoreline. Point A indicates the 1987 terminus location, Point X and Y the 1999 terminus location. Main terminus now extends south near Point C. Northern terminus extends west from Point B.

Yakutat Glacier, Alaska has experienced a spectacular retreat in the last decade losing 45 km² from 2010-2018 (Pelto, 2018).  During the  1894-1895 Alaskan Boundary Survey Yakutat Glacier ended on a flat coastal outwash plain. A decade later the glacier had retreated from the plain and a new lake was forming, Harlequin Lake.  From 1906-1987 the glacier retreated  ~10.5  km. From 2000-2010 the terminus area thinned ~10 m/year, the glacier retreated ~1200 m losing 5.8 km² of area (Trussel et al 2013).  Here we examine Landsat imagery to quantify the retreat from 1999-2020 to identify Harlequin Lake expansion during this century.

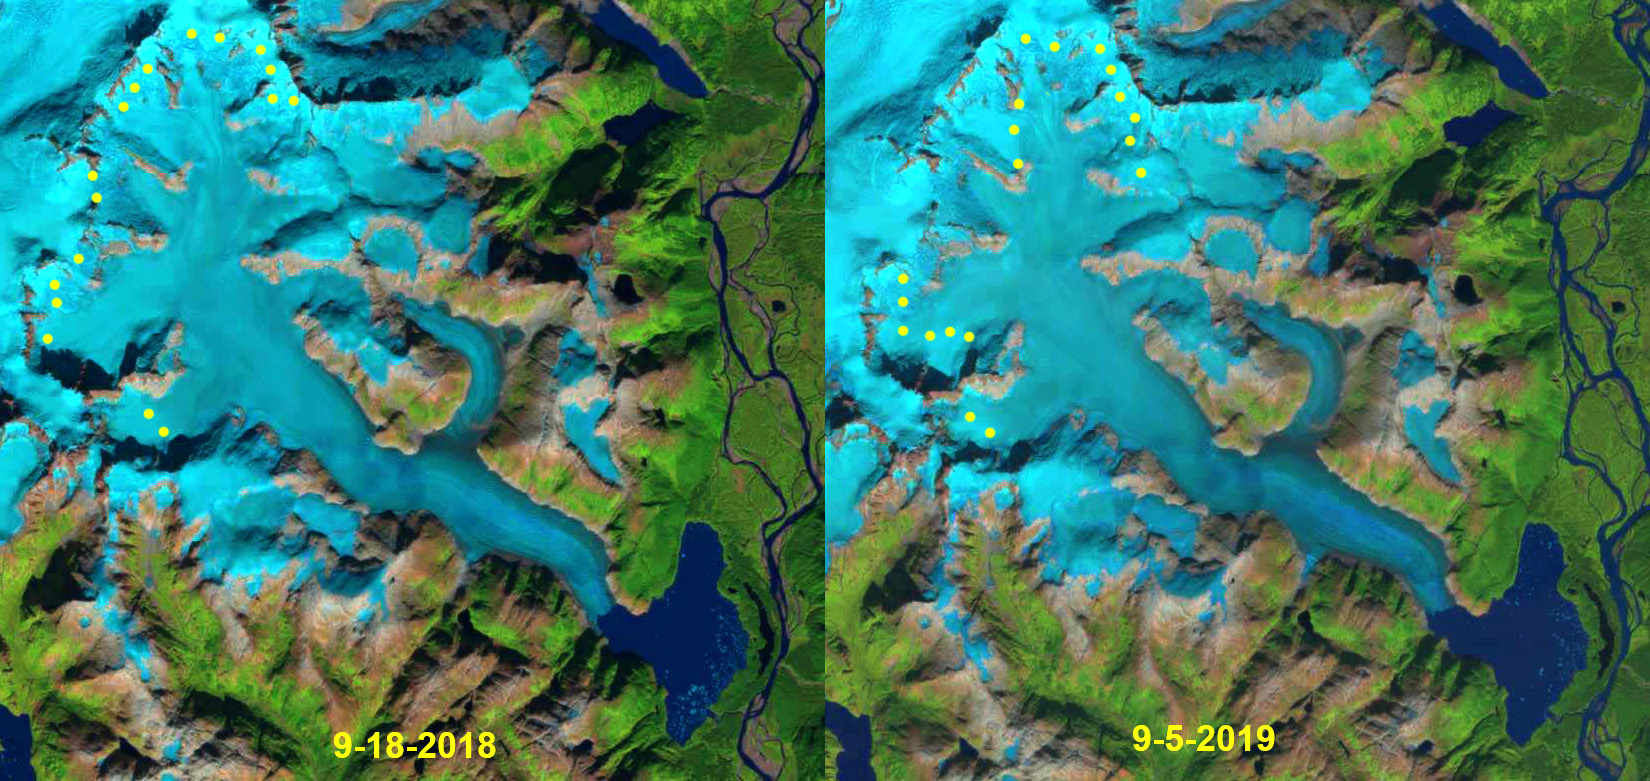
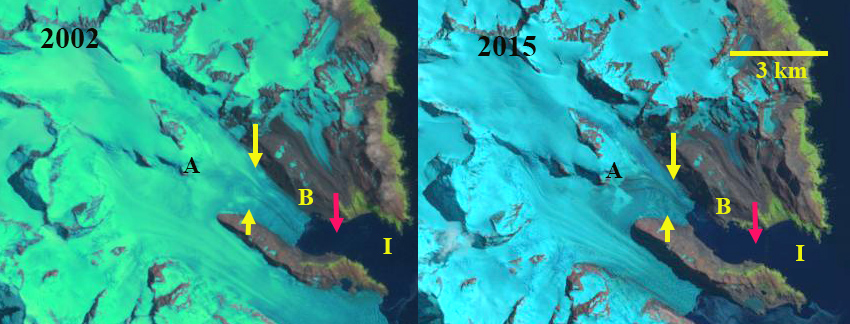
In 1999 the glacier has a single terminus extending 4.1 km across the lake from Point Y to Point X.  Point B is under the glacier near the junction of the tributaries, while Point C is in the midst of the glacier.  A ~1.4 km retreat up to 2010 with faster retreat on the north side and an expansion of the lake along the southern margin led to a 5.7 km long main calving front, and a 4 km long southern margin. An aerial image of the glacier in 2010 indicates significant rifting, blue arrows,  that pre-conditioned the glacier for a substantial 2013 breakup.  The rifts extend through the width of the glacier and typically form when thinning has led to a glacier region reaching approximate flotation (Benn, Warren and Mottram, 2007). In 2013 the glacier has separated into two separate calving fronts. The calving front extending west from Point B is  3 km wide, and the calving front extending south from Point B is  6.5 km long. There is a large area of icebergs and ice melange in front of the terminus, yellow dots in image below, resulting from the collapse.  In 2015 the snowline is quite high at 2200 m, leaving very little of the glacier in the accumulation zone. In 2015 a large iceberg detached pink arrow, that is  ~3.7 km², indicating continued rapid calving retreat. From 2013 to 2018 the glacier retreated from Point B to Point C on the northern side  a distance of 4.6 km in five years 920 m/year. By 2018 the Peninsula extending across the lake from Point C is 2.5 km long. The terminus is resting on this and adjacent shoals across 50% of its width.   The northern terminus extending west from Point B has changed little from 2013-2018. The 2018 image compares the 2010 position (yellow dots) with 2018 (orange dots)  indicating an area of 45 km² lost in eight years, though not all of it is lake (Pelto, 2018; NASA 2018).  The comparison of 1999 to 2020 illustrates the area of lake expansion between the 1999 (yellow) terminus position, 2020 terminus position (orange) and yellow dots along the lake shoreline.  The lake area growth is 40.5 km² since 1999 with an overall area loss of ~56 km².

Landsat images from 2010 and 2018 with terminus indicated by yellow dots in both, the orange dots indicate 2010 margin on 2018 image, and pink arrows indicate icebergs. 

The ability to produce icebergs as large as in 2015 has been lost as the calving front has been restricted by the Peninsula which is now 3 km long, leaving less than a 3 km wide calving front.   The narrower calving front and reduced water depth should in the short term reduce retreat of the main terminus.  The northern terminus is at a narrow point, as it recedes further the embayment widens and the retreat should increase.

The glacier thinned at a rate of ~4 m/year from 2000-2010 indicating how far out of equilibrium the glacier has been (Trussel et al 2013). The Yakutat Glacier does not have a high accumulation zone and the recent increase in the snowline elevation and thinning of the glacier have led to a substantial shrinking of the accumulation zone and thinning of the glacier in the accumulation (Truessel et al 2013). This glacier does not have a persistent significant accumulation zone in 2015, 2016 and 2018 and 2019 cannot survive (Pelto, 2010; NASA 2018).

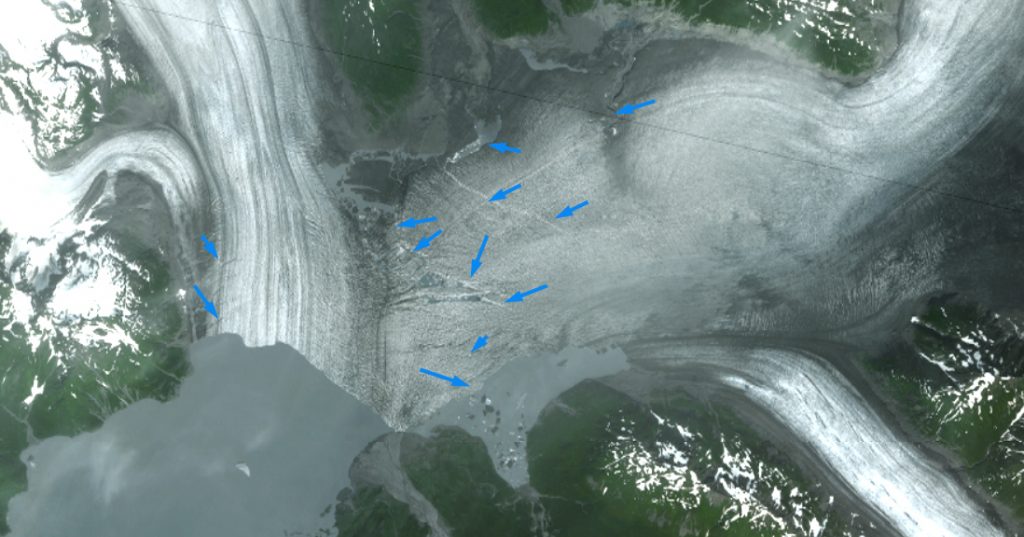
2010 image of the Yakutat Glacier terminus reach with blue arrows indicating rifts.

Yakutat Glacier in 2013 Landsat image.

Yakutat Glacier in 2015 Landsat image.

Gangotri Glacier, India Smallest Observed Accumulation Zone in 2020

Gangotri Glacier snowline averaging 5600 m on Oct. 16, 2020 in Landsat image, magenta dots indicate the snowline.  Yellow line is the Randolph Glacier Inventory margin. Tributaries: K=Kirti; G=Ghanohim, Su=Sumeru, M=Maiandi, S=Swachhand.

Gangotri Glacier, India is in the Bhagirathi River watershed and is the largest glacier in the Garhwal Range of the Himalaya.  Gangotri Glacier supports hydropower as its meltwater runoff passes through three hydropower plants generating 1430 Megawatts including the  Tehri Dam, Maneri Bhali I and II.  From 1968-2006 the glacier retreated 800 meters, ~20 meters/year (Bhambri et al 2011). The glacier has continued to thin and tributary inflow has declined with a tributary (Chaturangi) separating during this period .  Bhambri et al (2011) noted that recession rates have in the region have increased since 1990.  Bhattachaya et al (2016) expanded on this work noting that the velocity of Gangotri Glacier declined during 2006-2014  by 6.7% from 1993-2006, indicating a reduced volume of accumulation flowing downglacier. They also noted an increase in the rate of debris-covered area expansion on the main trunk of Gangotri Glacier from 2006-2015, indicative of an expanding ablation zone. Bhattachaya et al (2016)  report a retreat rate of 9 m/year 2006-2015, which is less than before, but the down-wasting in the same period 2006-2015 was higher than during 1968-2006.

Gangotri Glacier boundary and flow directions on Digital Globe image with GLIMS glacier outline indicated.

Gangotri Glacier is a summer accumulation glacier with the peak ablation period low on the glacier coinciding with peak snowfall high on the glacier during the summer monsoon.  In the post monsoon period of October and November precipitation is low and melt rates decline. Kundu et al (2015) noted that from Sept. 2012 to January 2013 the snowline elevation varied from 5080 m to 5174 m . This contrasts to an ELA of 4875 m reported by (Bhattachaya et al 2016) and 5100 m (Bhushan et al 2017).

On October 9, 2016  the snowline was at 4850 m on the main trunk and on the tributary Ghanohim Glacier, and 4750 m on the tributary Kirti Glacier.  By November 30th a Landsat image indicates the snowline has risen to 5400 m on the main trunk and Ghanohim, the snowline is at 5800-5900 m on the glaciers in the Swachhand tributary valley, at 5600 m on Maiandi Glacier and 5700 m on the last tributary entering from the north. A Landsat image from Dec. 9th indicate that the snowline remains approximately the same as on Nov. 30th. The substantial post monsoon snowline rise in 2016 is illustrated in this article on Gangotri Glacier.

Gangotri Glacier snowline purple dots in Landsat 11-30-16 image, red arrow is terminus.

On October 16, 2020 a warm/dry post monsoon season has led to the snowline rising rapidly on Gangorti Glacier. On Kirti the snowline is at 5500 m, on Ghanohim at 5400 m, on Sumeru at 5500 m, on the main stem 5600-5700 m, on Maiandi at 5700 m and on Swachhand at 5800 m.  The snowline is averages 5600 m the same as in 2016.  Below the snowline there is limited older firn exposed, indicating that limited snow is retained below 5400 m on Gangotri Glacier from year to year. The bare glacier ice has a lower albedo then snow increasing melt and further reducing glacier mass balance.

The accumulation area ratio is the percentage of a glacier in the accumulation zone and is typically above 50% for a glacier in equilibrium.  On Gangotri Glacier in November 30, 2016 the accumulation area ratio was 20-24%, indicating a large mass balance deficit. On October 16, 2020 the AAR of Gangotri Glacier was 23%.  More important the firn line indicates that the AAR is now consistently at ~25%. This will drive continued retreat and will accelerate the retreat. How far upglacier on Gangotri Glacier do you have to travel to reach the snowline?  On the central flow line 29-30 km along the 31-33 km length. The increase in temperature has led to a tendency for snowlines to rise in the post monsoon period and remain high into the winter season on other Himalayan glaciers such as West Rongbuk Glacier and around Mount Everest in 2019.

Central flowline for Gangotri Glacier, 32 km long, with 29.5 km in the ablation zone. Landsat image from 10-26-2020.

Whiting River Headwater Glacier, British Columbia Separates into Four

Whiting River headwaters glaciers in 1984 and 2020 Landsat images.  The red arrows indicate 1984 terminus positions, yellow arrow the 2020 terminus locations, pink arrows locations of glacier detachment and purple dots the snowline.

In Northwest British Columbia on the northeast side of the Stikine Icefield the Whiting Rver drains a series of glaciers, many unnamed.  Here we are focusing on a pair of glaciers just west of Whiting Lake the headwater of Whiting River, which is on the east margin of the Landsat images from 1984-2020. Glacier mass loss in the region has been extensive leading to substantial glacier recession. Melkonian et al (2016) dentified a mass loss for glaciers for Stikine Icefield of ~0.6 m year from 2000-2013 which is driving retreat.

In 1984 the four branches of the westernmost glacier: west (W), main (M), south (S) and east (E) join together at ~900 m and the glacier flows downvalley to approximately 2 km to an elevation of 700 m.  The snowline is at 1250 m on the main branch. By 1999 the east branch has separated both from the south branch but also from the higher icefield at arrow #4. The snowline of the main branch is at 1300 m. By 2018 the west glacier has separated from the main branch at arrow #1, the south branch has also separated from the main branch near arrow #3. The four former tributaries are all separated.  The snowline in 2018 is the highest observed at 1550 m with a very limited accumulation area less than 10%, this year was a record high for the previous 70 years at nearby Taku Glacier. By 2020 the main branch has retreated 2300 m since 1984.  At arrow #2 there is a further detachment occurring from the east side accumulation are to the main branch. The eastern Whiting River Glacier has retreated 1250 m in this same period.

The retreat here is substantial in terms of the overall glacier length, and illustrates detachment as also noted for Farragut River, Alaska near the southwest corner of the Stikine Icefield. The retreat is less than that observed for the large outlet glaciers of Stikine Icefield such as South Sawyer, Dawes and Great Glacier. Whiting River is a remote and wild river that is host to six salmon species.


Whiting River headwaters glaciers in 1999 and 2018 Landsat images.  The red arrows indicate 1984 terminus positions, yellow arrow the 2020 terminus locations, pink arrows locations of glacier detachment and purple dots the snowline.

Leningradskiy Ice Cap Snowcover Vanishes in 2020 More Thinning, Svernaya Zemlya

Leningradskiy Ice Cap  north to south strip in 2000 and 2020 Landsat images illustrating thinning leading to separation of parts of the ice cap at Point 1 and 4 and expansion of bedrock leading to merging bedrock regions at Point 1 and 2. R=snow/firnpack saturated with meltwater and consequent potential refreezing. S=superimposed ice development from surface refreezing.

Leningradskiy Ice Cap is oriented east to west across Bolshevik Island in the Svernaya Zemlya Archipelago of the Russian Arctic. Annual snowfall on the ice caps is limited ~0.4-0.5 m (Sharov and Tyukevina, 2010).  During the brief summer melt season from June-late August, much of the melt is refrozen within the snow/firnpack or as superimposed ice (Bassford et al 2006).  The low snowpack makes the glaciers vulnerable to warm summer conditions. The summer of 2020 has been remarkably warm in the Russian High Arctic leading to high melt rates and surface mass balance loss as shown by Xavier Fettweise MAR model. Here we examine Landsat images from 2000 to 2020 to identify a pattern of thinning on the northern margin of the ice cap.

In 2000 the glacier has a well established glacier runoff stream at yellow arrow. Point 1 is a nunatak amidst a peripheral segment of the ice cap. Point 2 is an area of bedrock separated by a narrow section of ice cap from adjacent bedrock. Point 3 and 4 are locations where the ice cap is thick enough to spillover in to an adjacent basin.  There is little visible snowpack on the ice cap, but a significant area of azure blue indicates snow/firnpack (R) that is saturated with meltwater, some of which will refreeze. There are zones of superimposed ice development(S)  where meltwater is refreezing on top of the cold surface ice. In 2018 there an area of unsaturated snowpack, white area, and saturated snow/firnpack (R) azure blue and areas of superimposed ice development (S).

On August 3, 2020 the ice cap has lost its snowcover with limited areas of firn, limiting the ability of meltwater to refreeze except on the surface as superimposed ice (S).  The lack of snow/firnpack at the surface will lead to a more negative balance as meltwater is not retained. At Point 1 this peripheral glacier area has been cutoff from the main ice cap as thinning has exposed more of the encircling ridge.  At Point 2 bedrock areas have expanded and merged together. At Point 3 there is some spillover still but thinning has led to a reduction and consequent retreat and thinning of this terminus. At Point 4 the ice cap no longer spillovers into the adjacent basin due to thinning. Each location indicates significant thinning that is hard to recover given the slow flow and limited accumulation on these glaciers. On Aug. 22 2020 the surface of the ice cap is frozen, leading to a whiter surface.

The lack of retained snowcover in 2020 was also seen at Hochstetter Ice Cap in Franz Josef Land.  In both cases the high summer temperatures led to more meltwater, and the lack of snowpack to retain leads to more escaping the system. Bassford et al (2006) describe this process “Intense surface melting in the accumulation zone during warm summers prevents the buildup of a thick firn layer by rapid transformation of firn to ice through refreezing and by removing
mass through runoff.”

Leningradskiy Ice Cap  north to south strip in 2018 and 2020 Landsat images illustrating changing distribution of melting (R) and superimposed ice development (S)

Huron Glacier Retreat, Livingston Island, Antarctica 2001-2020

Huron Glacier (H) and Kaliakra Glacier (K) in 2001 and 2020 Landsat images.  Extensive retreat at bedrock locations Point A and B with limited retreat at C and D.

Livingston Island, Antarctica is part of the South Shetland Island chain and is primarily covered by glaciers.  At the eastern end is Huron Glacier. Huron Glacier and the adjacent Kaliakra Glacier are tidewater outlet glaciers terminating in Moon Bay on the east end of Livingston Island. Molina et al (2007) noted that persistent warming had led to mass loss  from 1956-2000 on Johnson and Hurd Glacier further west on the island. Osmanoglu et al (2014) observed the velocity and frontal ablation rates of Livingston Island glaciers.  Frontal ablation includes losses from calving and surface melting of the ice face from contact with the ocean and air.  They observed that frontal ablation losses were the same magnitude as surface ablation. Huron Glacier had the highest frontal ablation by a significant amount from 2007-2011 and the higest location of velocity at 250 m/year.  Here we examine Landsat images from the 2001-2020 period to illustrate the retreat of the glacier fronts in Moon Bay.

In 2001 the icefront is 3 km beyond Point A a bedrock knob at the end of a ridge, 3.5 km beyond Point B also bedrock at the end of a ridge, 1800 m beyond Point C and 1500 m beyond Point D.  Snowcover extends to the ice front.  In 2004 there is not a significant change in the ice front position and snowcover again extends to the ice front.  By 2015 the ice front has retreated to within 1 km of Point A. In March 2018 there is evident ablation in the lowest reaches of Huron Glacier.  In February 2020 the ice front has retreated to the bedrock knob at Point A , a 3000 m retreat since 2004. The ice front is 2 km from the bedrock ridge at Point B, a 1500 m retreat since 2004. The ice front retreat on the north side of Kaliakra at Point C has retreated 400 m since 2004.  Retreat on the south margin of Huron Glacier at Point D has retreated 500 m.  Surface melting is also evident in 2020 from Point B to the ice front, with a lateral moraine exposed as was the case in 2018. The 2020 melt season featured record high temperatures in this region of Antarctica leading to high surface melt, such as at Eagle Island Ice Cap.  Surface melt on Livingston Island is less extensive than on the Warsaw Icefield on King George Island  (Petlicki et al, 2017). Retreat of Huron Glacier has been more rapid than on other glacier fronts on Livingston Island this is reflective of the higher frontal ablation rate, which is significantly due to its high velocity.  Osmanoglu et al (2014) note a significant summer velocity increase on Livingston Island glaciers, will increased melt enhance basal water pressure and velocity or lead to a more mature drainage reducing basal water pressure limiting summer velocity increases? The retreat of the calving front is similar to that of Endurance Glacier on Elephant Island.

Huron Glacier (H) and Kaliakra Glacier (K) in 2004 Landsat image and 2015 Landsat image based contour map from Antarctic REMA Explorer.  

Huron Glacier (H) and Kaliakra Glacier (K) in 2018 Landsat image portrayed in Antarctic REMA, note surface melt and lateral moraine material near Point A and B.

Ongoing Evolution of Fleming Glacier, Antarctica

Fleming Glacier in 2000 and 2019 Landsat images. The 2000 glacier front is marked by red arrows on the north and south margin and red dots along the front. The 2019 glacier front is marked by yellow arrows and yellow dots.

During the 1980’s the glaciologic community was focused on increasing our baseline information and monitoring of Antarctic ice shelves. An understanding that  ice shelves had  a critical role along with a recognition that their specific role was not well understood, resulted in planning for and then having the instrumentation in place to observe the loss of several ice shelves in the next couple of decades. The following is the story of the continuing changes of Fleming Glacier that formerly fed the Wordie Ice Shelf.

Doake and Vaughan (1991) of the British Antarctic Survey reported on the disintegration of the Wordie Ice Shelf resulting from surface crevasses or rifts extending to the bottom of the ice shelf.  The ice shelf disintegrated from an area of 1900 km2  in 1970 and to an area of 100 km2 in 2009. They observed that rift formation that led to retreat of the ice front were enhanced by  a warming trend recorded in mean annual air temperatures in Marguerite Bay.  A few years later Vaughan and Doake (1996) analyzed a 50-year meteorological record that identified significant atmospheric warming on the Antarctic Peninsula and compared that to time-series observations of areal extent of nine ice shelves on the Peninsula.  At that time the five northerly ice shelves had retreated dramatically in the past fifty years, and further south there was no clear trend.

Fleming Glacier on the Antarctic Peninsula which had fed the Wordie Ice Shelf  was observed to be thinning rapidly from 2004-2008 leading to a velocity increase (Wendt et al, 2010). This led to the production of numerous tabular icebergs from the glacier front as seen in Landsat images from 2000-2019.  Freidl et al (2018)   updated this research identifying that acceleration coincided with strong upwelling events of warm circumpolar deep water into Wordie Bay.  They observed a grounding line retreat of ∼ 6–9 km between 1996 and 2011, resulting in flotation of an additional ∼ 56 km2 of the glacier tongue.  This has been driven by thinning of ~3 m/year from 2011-2014.  A greater area of flotation will reduce buttressing and friction, which likely led to the observed speedup of ∼ 1.3 m/day between 2008 and 2011 along the glacier centerline (Freidl et al 2018) .

In 1989, image below, the Wordie Ice Shelf is still tenuously connecting several different outlet glaciers.  The tabular icebergs are elongated perpendicular to ice front. In 2000 the calving front was near the mouth of an embayment.  There is a wide zone of rifted floating ice, with the actual ice front to the south hard to define based on which rift represents full separation. There are two main feeding arms, one between Point A and B, the main Fleming Glacier and the other north of Point A, the Seller Glacier and Airy Glacier.  By 2008 the glacier had lost most of the rifted area of the floating tongue seen in 2000.  In the 2017 Landsat image the northern arm has retreated towards a series of ice rumples indicating the glacier bed is resting on bedrock rises beneath the glacier. The main Fleming Glacier lacks evident rumples suggesting a deeper bed less interrupted by bedrock rises. There remains a series of tabular icebergs beyond the ice front and a single rift inland of the glacier front.  In 2019 there are two rifts near the ice front in February indicating two substantial tabular icebergs will soon be released.  The Fleming Glacier ice front has retreated 9.5 km from 2000 to 2019, o.5 km/year. The retreat of the calving front of Airy and Seller Glacier, north of Point A, is less.  The area extent loss at the front of the three glaciers from 2000-2019 has been ~125 km2.

Freidl et al (2018)  observe that the tongue of Fleming Glacier in 2016 was grounded  between ∼ −400 and −500 m below sea level and that  3–4 km upglacier of the grounding line the bed deepens to over 1000 m below sea level 10 km upglacier of the 2016 grounding line. This would suggest the breakup of Fleming Glacier is poised to increase.  The speedup of glaciers that had fed and been buttressed by the Wordie Ice Shelf continue to experience acceleration two decades after the major part of the ice shelf disintegrated.  This is similar to the pattern seen at Larsen A and Larsen B (Scambos et al 2004). The glaciologic community has more tools and more scientists than 35 years ago to focus on ice shelves.  Our increased understanding also allows a look back at events in the past where thanks to the foresight sufficient data/imagery was gathered, for example the recent work of  Robel and Banwell (2019) .  The ongoing dynamic changes illustrate the glaciologic community was focused on the right place beginning sustained examination of these ice shelves more than 30 years ago.

Fleming Glacier and Wordie Ice Shelf in 1989 Landsat image.  Pink dots mark the approximate ice shelf front in 1989, certainly there are disintegrating tongues.  Red arrows indicate 2000 glacier front location.  Point A and B are same location as in other images. 

Fleming Glacier in a Dec. 2017 Landsat image viewed using the Antarctic REMA . Black dots indicate the approximate calving front and black arrows rifts behind the calving front.

Fleming Glacier in a Dec. 2017 Landsat image viewed using the  Antarctic REMA . Black dots indicate the approximate calving front and black arrows rifts behind the calving front.


Ofhidro Glacier, Chile Retreat 1986-2019

Ofhidro Glacier glacier terminus change an accumulation zone changes from 1986-2019 in Landsat images.  Red arrow=1986 terminus, yellow arrow=2019 terminus change, orange arrows expanding bedrock areas and purple dots snowline. 

Ofhidro Glacier is an outlet glacier on the northwest corner of the Southern Patagonia Icefield (SPI), that has a northern and southern arm terminating in a proglacial lake. Sakakibara and Sugiyama (2014)a examine the terminus change and velocity of SPI glaciers the northern arm retreating 50 m per year from 1985-2011 and the southern arm 100 m/year 1985-2011.  They also noted a decline in velocity Here we examine Landsat imagery from 1986-2019 to identify the change.

In 1986 the southern arm extended across the proglacial lake to the shallows of the western shore. The northern arm had been retreating in a narrower valley with a comparatively consistent width.   In 1998 the southern arm in the broader lake reach had collapsed, a retreat of 1800 m.  The northern arm had a retreat of 200 m.  The snowline was at m.  In 2015 the southern arm has retreated into a narrower valley, and the northern arm has retreated to a turn to the south in the valley.  The orange arrows indicate the expansion of bedrock as the glacier thins.  By 2019 the southern arm has retreated 2800 m (88 m/year) and the northern arm has retreated 1800 m (56 m/year).   Jaber et al (2019)  noted a thinning of 0.5 m/year from 2000-2012 increasing to 1.2 m/year from 2012-2016.  Most of the thinning being in the valley tongues of each arm. There is an area of continuous exposed bedrock more than 3 km long.  This fits the observations of  Willis et al (2012) who observed that between February 2000 and March 2012 that SPI was rapidly losing volume and that thinning extends even to high elevations.   The retreat of this glacier is similar to that of Lucia Glacier and Gabriel Quiroz Glacier to the east.

Ofhidro Glacier glacier terminus change an accumulation zone changes from 1998-2015 in Landsat images.  Red arrow=1986 terminus, yellow arrow=2019 terminus change, orange arrows expanding bedrock areas and purple dots snowline.

Ofhidro Glacier image from 2015. Notice the trimlines and narrowing of both terminus tongues.  Orange arrow indicates new bedrock knob.