Melt Severs Northern Patagonia Icefield Glacier Connections

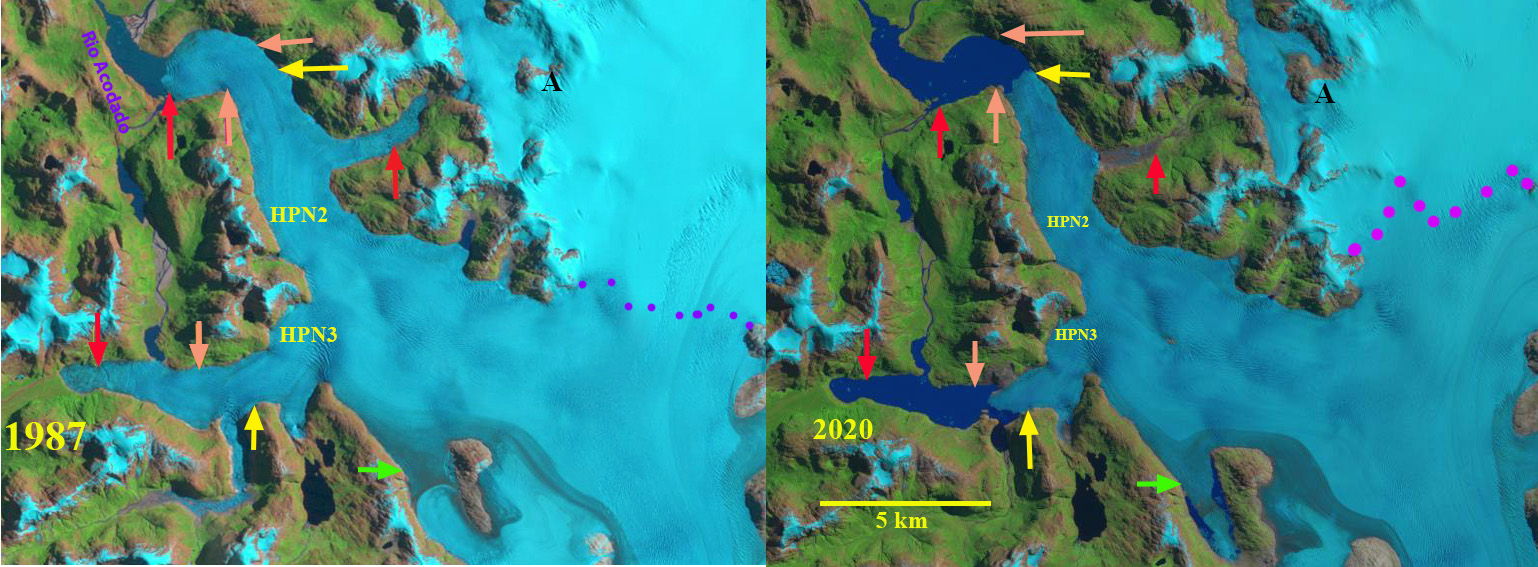
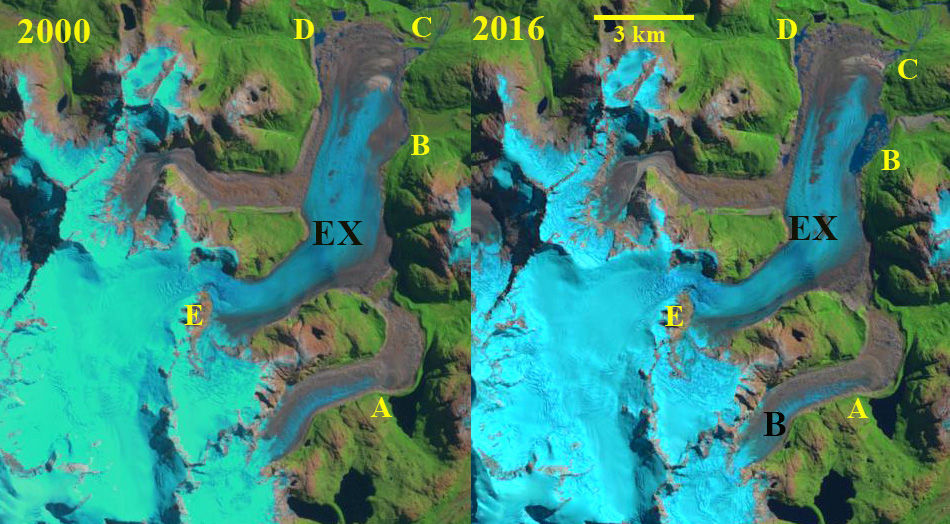
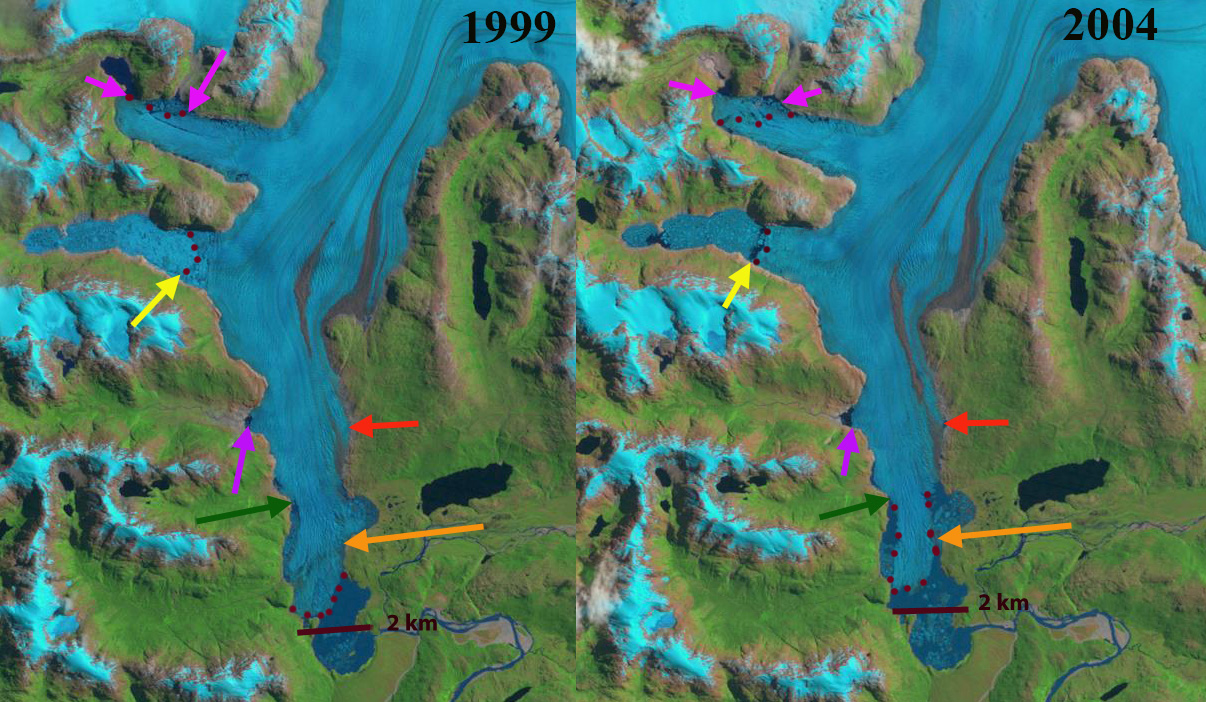
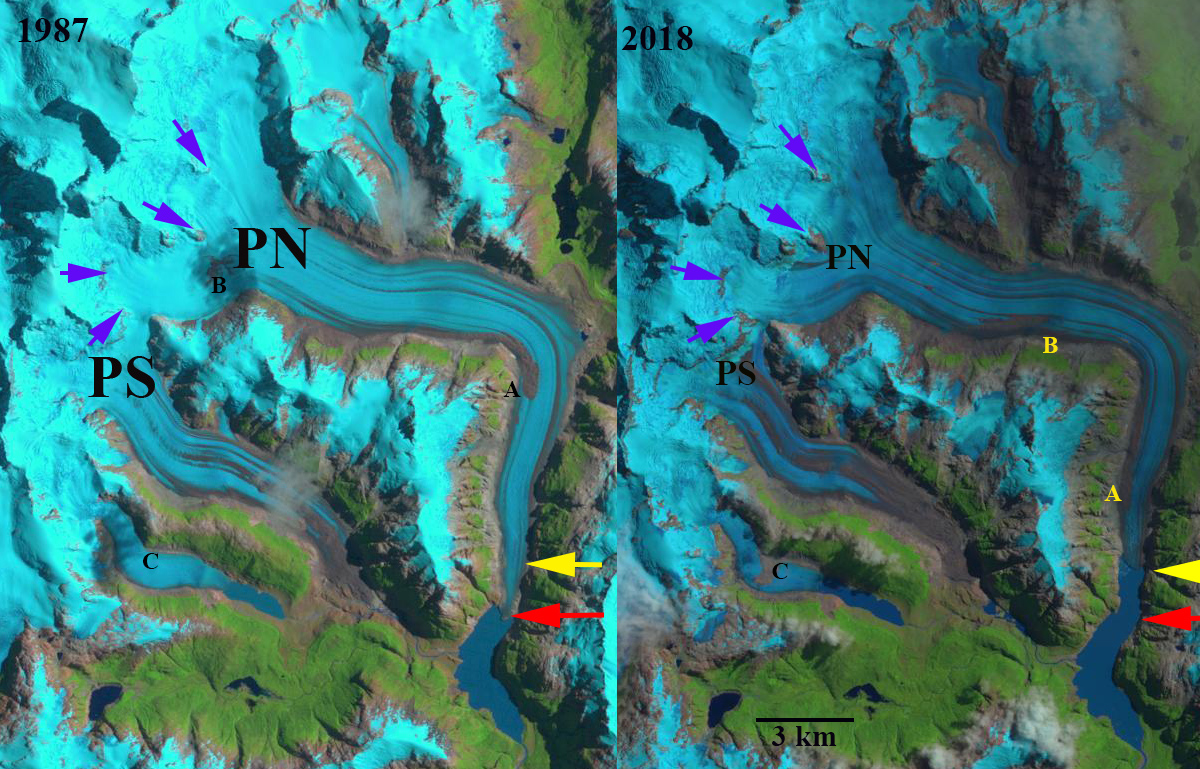
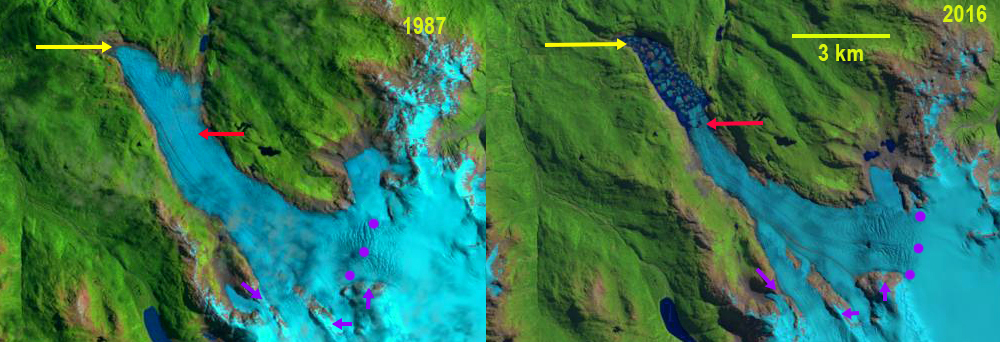
Loss of glacier connection between HPN1 and HPN2 in Landsat images from 2000 and 202o at Point A and B. Glacier tongue retreat at Point A from HPN1 and at Point C from HPN2. Formation of 1.4 km2 lake at HPN1.

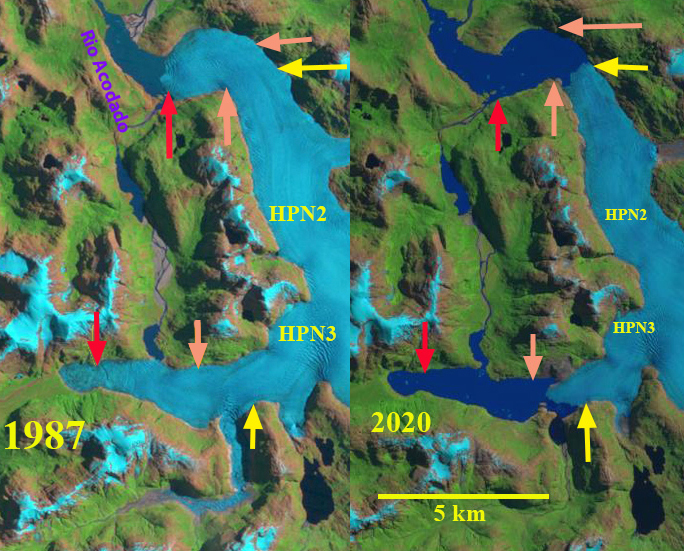
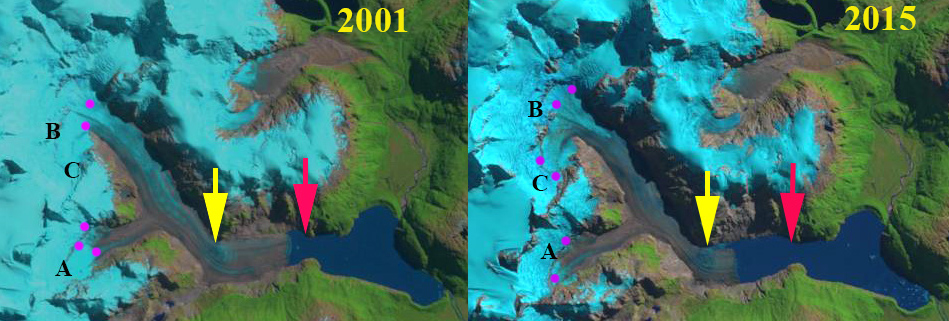
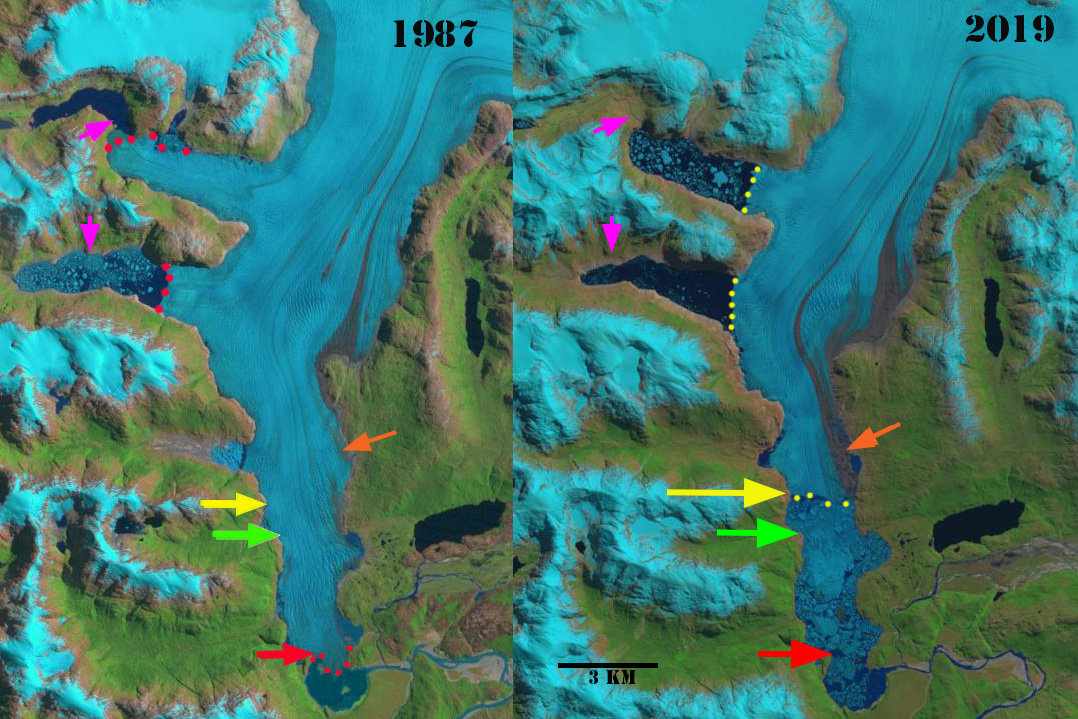
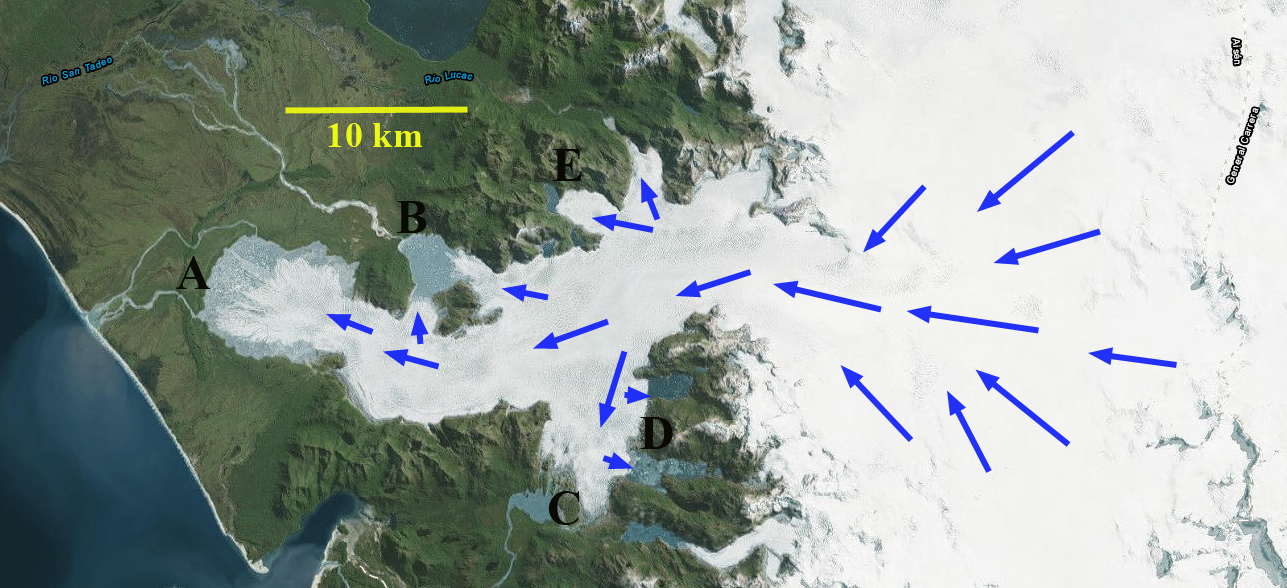
HPN1, HPN2 and HPN3 drain adjacent sections of the the Northern Patagonia Icefield (NPI).  HPN2 and HPN3 comprise the Acodado Glacier, with HPN1 being the next glacier to the north is. The lakes at the terminus of HPN2 and HPN3 were first observed in 1976 and had an area of 2.4 and 5.0 km2 in 2011, while HPN1 had no lake in 2000 (Loriaux and Casassa, 2013).   Davies and Glasser (2012) noted that the Acodado Glacier termini, HPN2 and HPN3, had retreated at a steadily increasing rate from 1870 to 2011. Pelto, 2017 reported a retreat from 1987-2015 of 2100 m for HPN2 and 3200 m for HPN3. From 1987-2020 Acodado Glacier terminus HPN2 has retreated 2700 m and HPN3 has retreated 4100 m.  The result of this retreat is an increase in lake area at HPN2 from 2.1 km2 in 1987 to 7.1 km2 in 2020 (Pelto, 2020). Glasser et al (2016) identified a 40% increase in lake area for the NPI from 1987-2015,  and a 100 m rise in the snowline.  Dussailant et al (2018) identified a mass loss rate of -2–2.4 m/year for HPN1, with thinning of over 4 m/year in the lower reaches in the vicinity of Point A and B. Here we examine the impact of the rising snowline, increased melt and resultant thinning on two glacier tongues that connected HPN1 to the accumulation zone region of HPN2 in 2000 and are now disconnected.

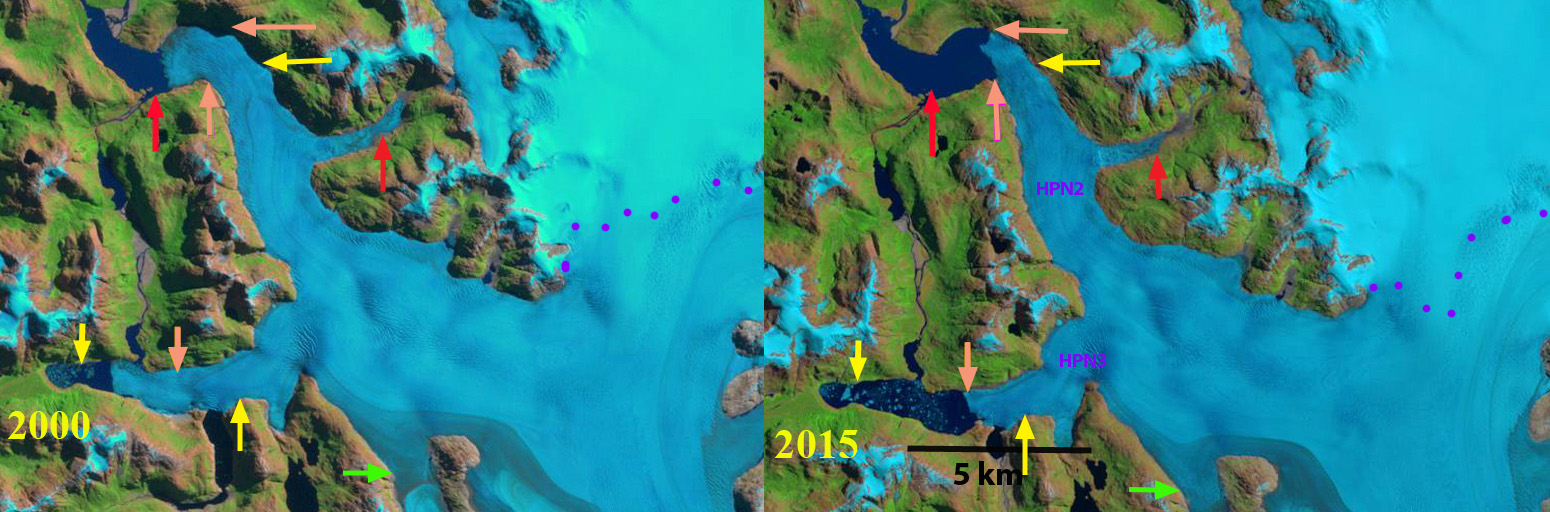
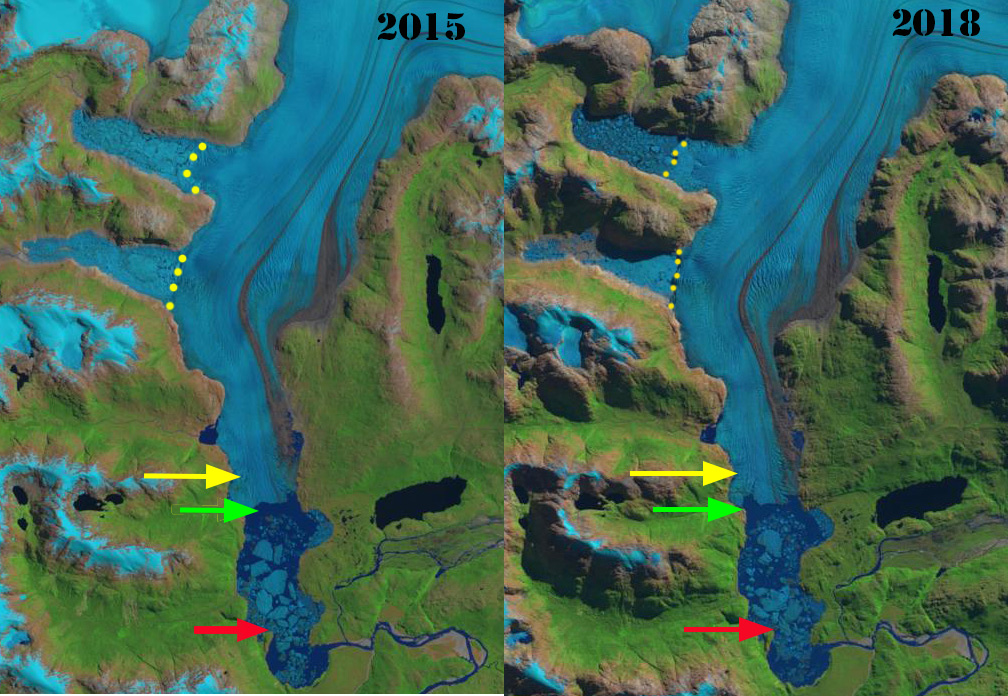
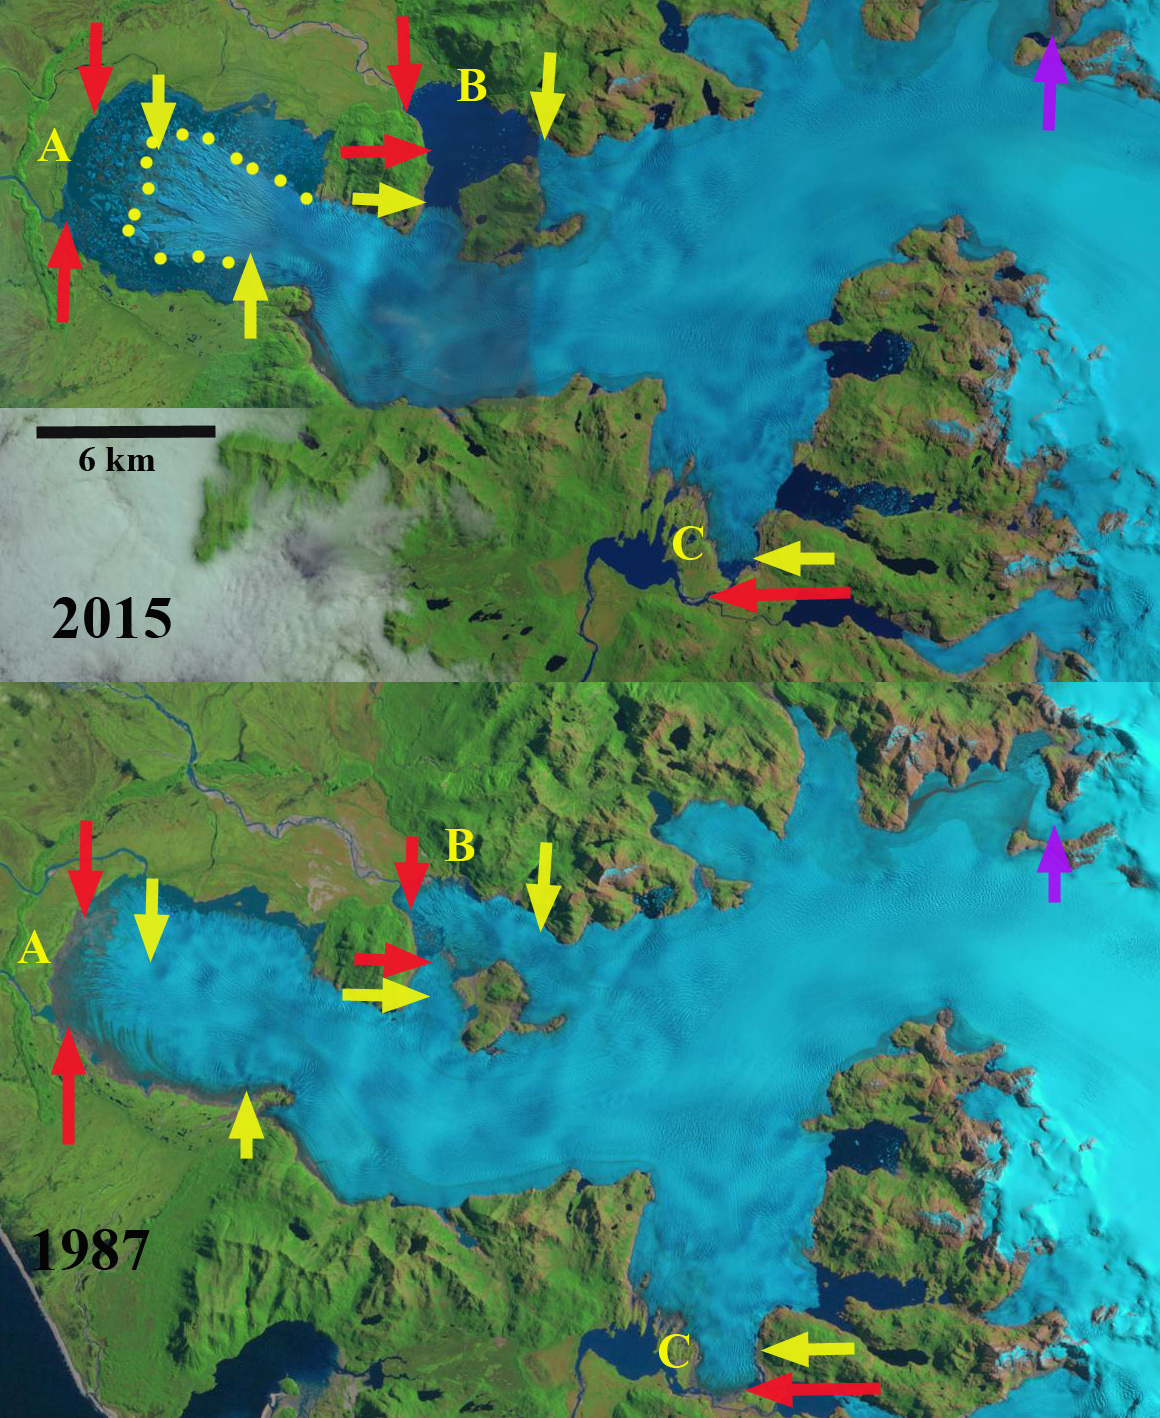
In the 2000 Landsat image glacier tongues extending from the accumulation zone region of HPN2 connect with HPN1 at Point A and Point B. At Point C an ice tongue extends 2.7 km upvalley from HPN2. By 2016 there is a disconnection at Point A with ice flowing south from HPN1 no longer joining the north flowing tongue.  Point B is still connected. At Point C the ice tongue extends 1.8 km upvalley.  By 2020 the connection at Point B has also been severed. At Point A ice no longer flows south into the valley from HPN1 and there is a 3.25 km long deglaciated valley between the two formerly connected ice tongues. At Point C the ice tongue from HPN2 has also been lost, a 2.7 km retreat.  From 2000-2021 HPN1 has retreated 1.8 km leading to the formation of a 1.4 km2 lake. We can anticipate the rapid retreat of the glacier tongue from HPN1 at Point B during this decade.  There is potential of short term formation of glacier dammed lakes at Point A and C now, and Point B in the future.  There is not a hazard from drainage of these lakes that both reach tidewater via Rio Acodado within 15 km.

Loss of glacier connection between HPN1 and HPN2 in Landsat images from 2016 and 2021 at Point B. Glacier tongue retreat at Point A from HPN1 and at Point C from HPN2. Expansion of 1.4 km2 lake at HPN1.

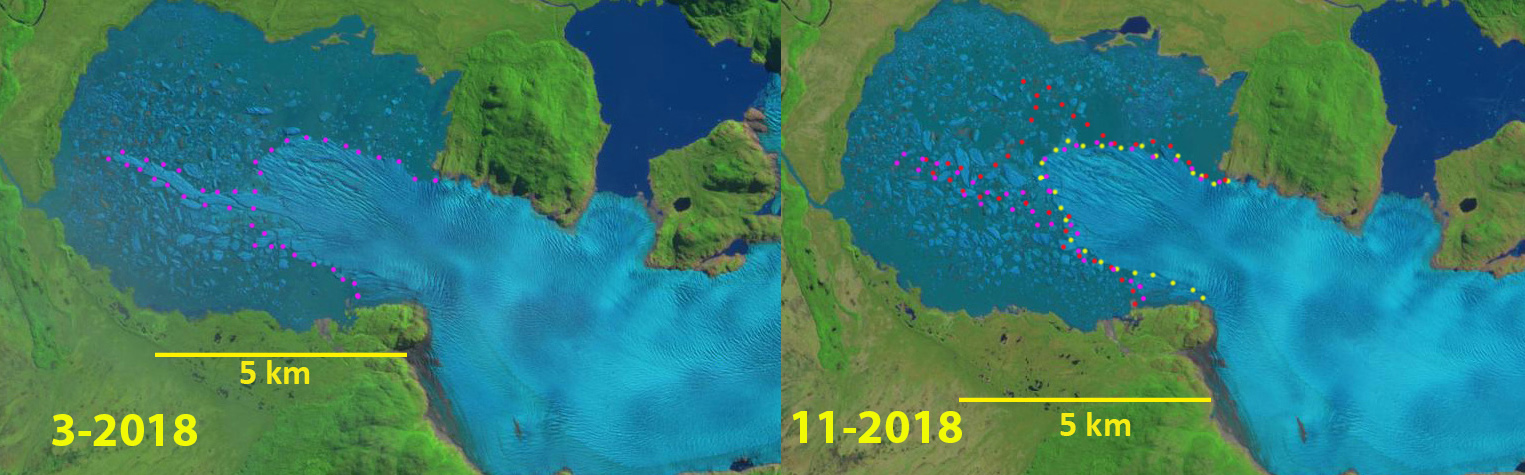
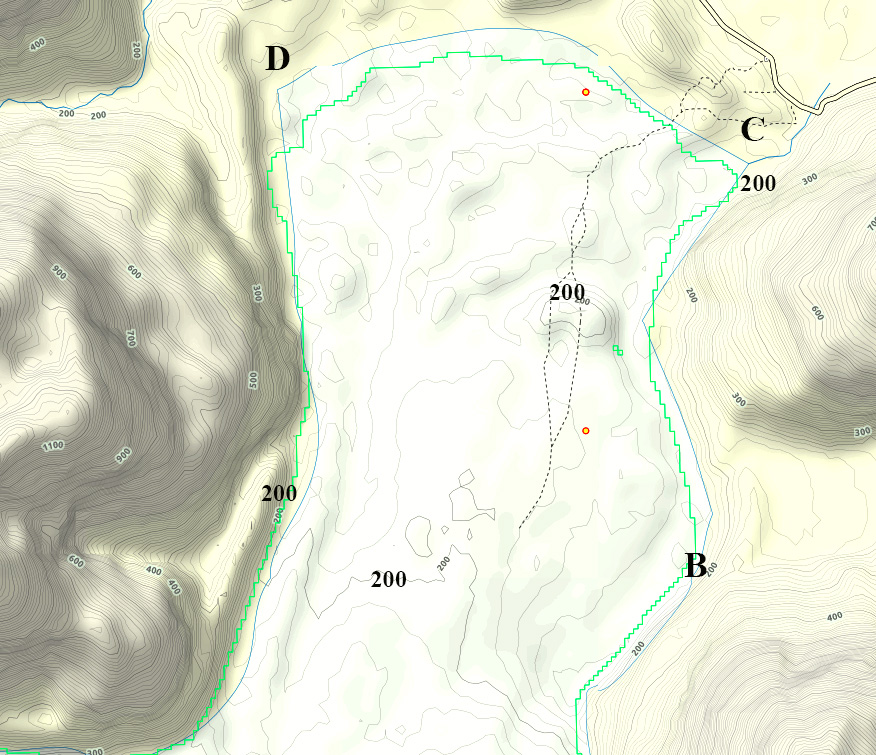
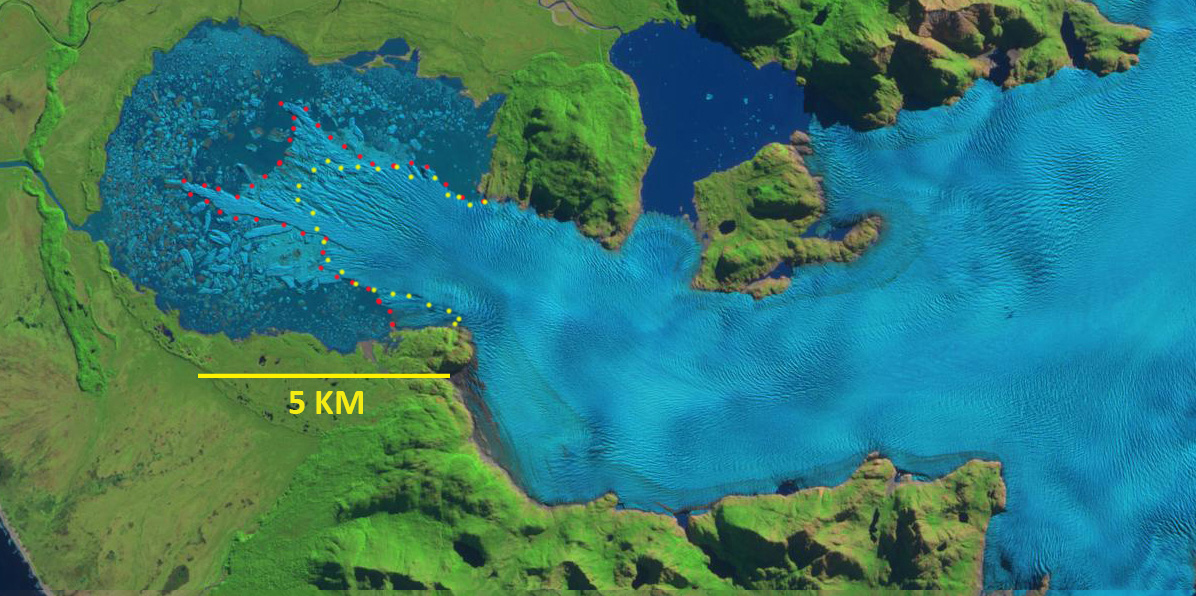
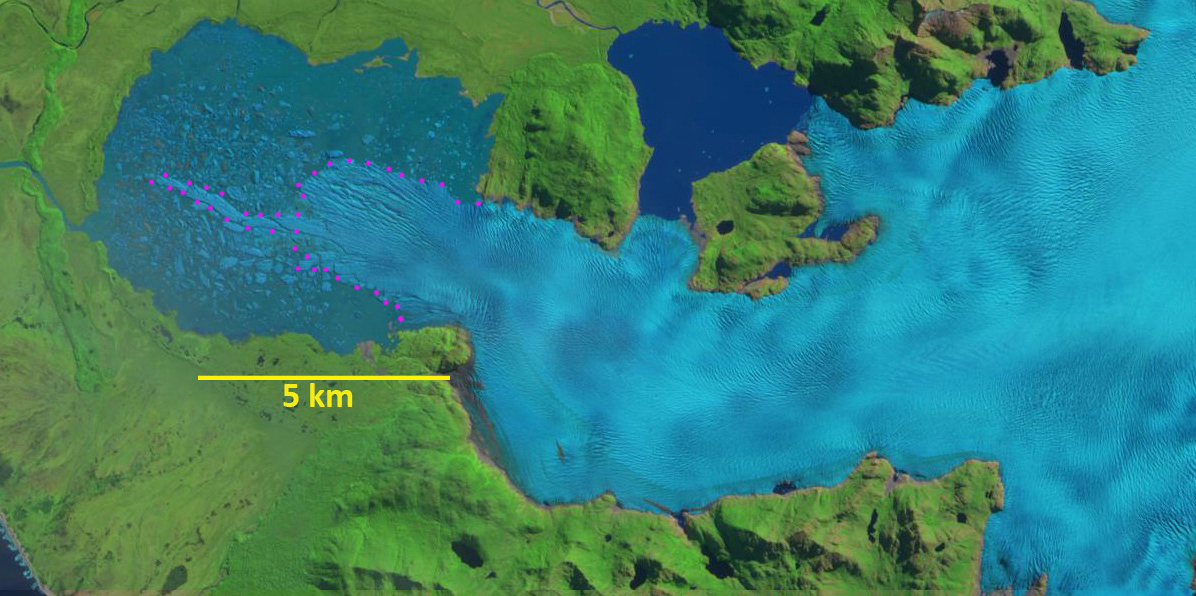
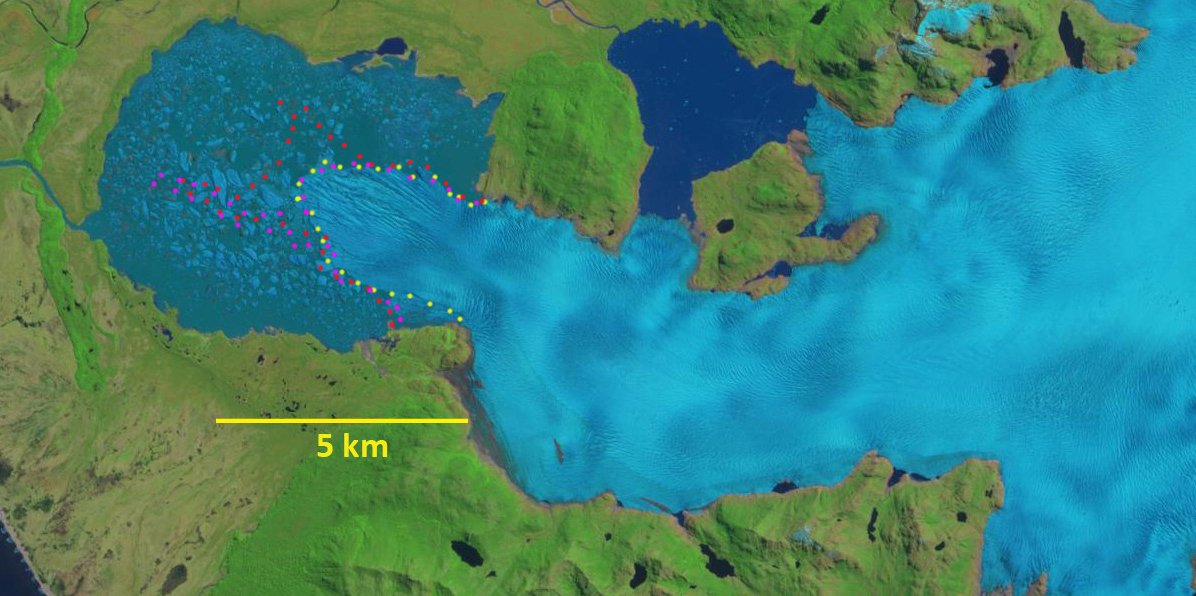
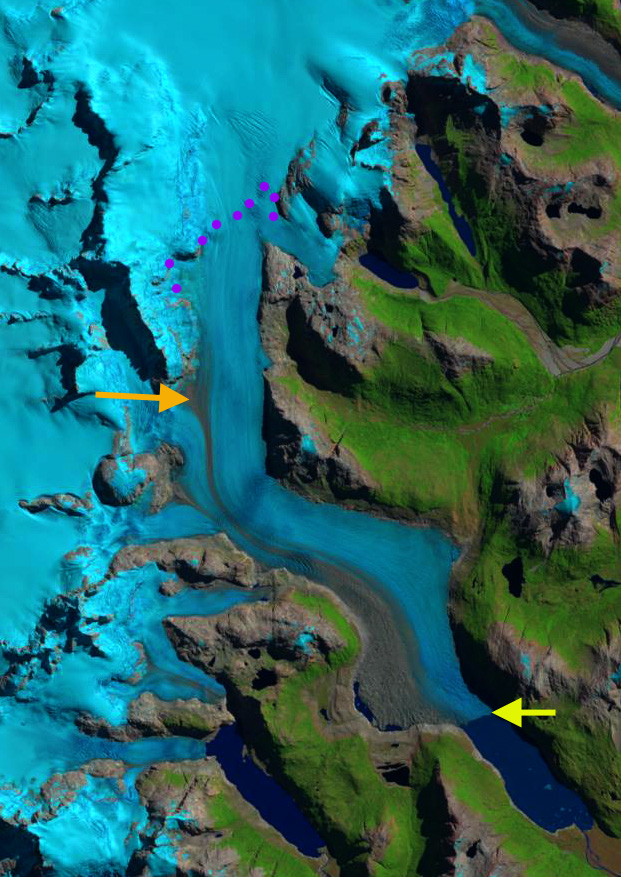
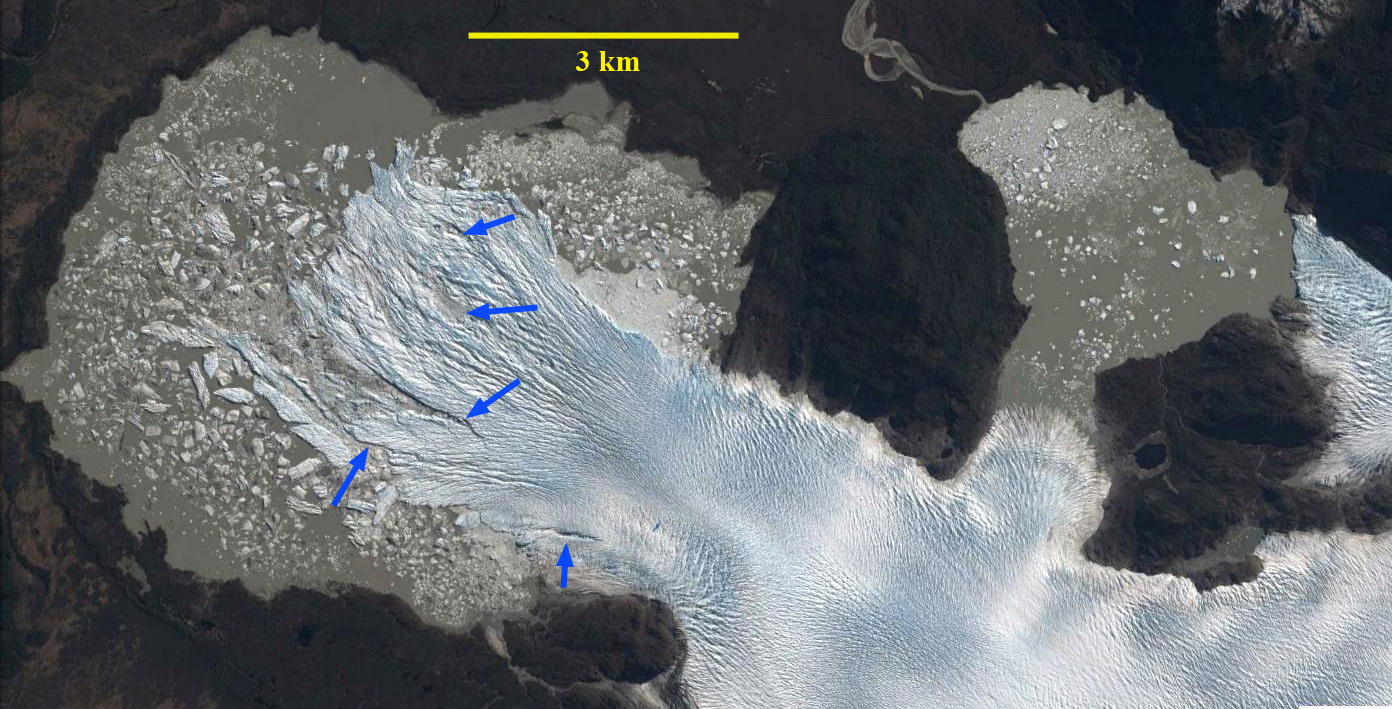
HPN1 in Sentinel 2 image from Nov. 9, 2021 illustrating the 1.4 km2 lake at HPN1 that has formed this century and the deglaciated valley at Point A.

Rio Frio Glacier, Chile Retreat-Lake Formation 1990-2020

Rio Frio Glacier (RF) in 1990 and 2020 Landsat images. Red arrow 1990 terminus, yellow arrow 2020 terminus, orange arrow new lakes formed after 2000, purple dots snow line.

The “Rio Frio” Glacier is at the headwaters of the Rio Frio a tributary to Rio Palena in Parque Nacionale Corcovado of Palena Province of Chile.  Davies and Glasser (2012) noted that overall glaciers in the region lost 14% of their area from 1986 to 2011. Paul and Molg (2014)  assessed changes of glaciers in the Palena district, Chile revealing a  total area loss of 25% from 1985 to 2011.  Area loss below 1000m elevation was 50–100% and the number of proglacial lakes increased from 223 to 327. Carrivick et al (2016) reported the glaciers in the region had an average thickness of 41 m, this is relatively thin allowing for the rapid area loss. Here we examine glacier change from 1990 to 2020 using Landsat imagery.

The Rio Frio Glacier terminated in a proglacial lake in 1990 at 720 m and the snowline is at 1100 m.  The next glacier to the south has two arms terminating at 900 m with no proglacial lakes at the terminus see orange arrows. In 2000 there is limited retreat and Rio Frio Glacier still terminates in the lake, and the snowline is at 1150 m. At the next glaciers south there is no proglacial lakes evident at the terminus. By 2019 Rio Frio Glacier has retreated from the lake and the snow line is at 1100 m at the start of February.  The next glacier south two new proglacial lakes have developed at orange arrows. By 2020 the glacier terminus has retreated 500 m to an elevation of ~880 m.  Rio Frio glacier has lost more than 50% of its area below 1000 m.  The glacier still has maintained an accumulation zone each year indicating that without further warming it can survive. The next glacier south has retreated exposing two new proglacial lakes that now are no longer reached by the glacier.

The large scale loss of these two glaciers is typical for the region as noted by the references above and by the examples of Tic Toc Glacier, Erasmo Glacier and Hornopiren Glacier. In this case the two new proglacial lakes are small and no longer in contact with the glacier, result they pose little glacier outburst flood risk. The lake beyond the terminus of Rio Frio Glacier has neither adjacent significant steep slopes or ice in contact and poses little risk as well.

Rio Frio Glacier in 2000 and 2019 Landsat images. Red arrow 1990 terminus, yellow arrow 2020 terminus, orange arrow new lakes formed after 2000, purple dots snow line.

Is San Quintin Glacier Lake the fastest expanding lake this century in South America?

Landsat images of San Quintin Glacier from 2001 and 2020 indicate the expansion of both Lake A and Lake B due to glacier retreat. The Lake A basin as defined by the transect at the eastern narrow point, yellow line, has a total area of 41 km2 with the lake surface area now comprising 35.1 km2.

San Quintin is the largest glacier of the Northern Patagonia Icefield (NPI) at 790 km2 in 2001, flowing ~50 km west from the ice divide in the center of the ice cap.  San Quintin Glacier terminated largely on land until 1991 (Davies and Glasser, 2012). The velocity at the terminus has increased from 1987 to 2014 as the glacier has retreated rapidly into the expanding proglacial lake (Mouginot and Rignot, 2015).  As Pelto (2016) noted 19 of the 24 main outlet glaciers of the Northern Patagonia Icefield ended in a lake in 2015, all the lake termini retreated significantly in part because of calving losses leading to lake expansion in all cases. Glasser et al (2016) observed that proglacial and ice-proximal lakes of NPI increased from 112 to 198 km2. Loriaux and Cassasa (2013) reported that the combined area of the multiple San Quintin Glacier lakes expanded the most of any NPI from 1945-2011 increasing by 18 km2. The large evident crevasses/rifts perpendicular to the front indicate the terminus tongue has been partially afloat since at least 2014  Here we examine Landsat images from 1987-2020 to illustrate the changes. NASA’s Earth Observatory has high resolution images indicating the terminus in June 2014 and April 2017

In 1987 it is a piedmont lobe with evident minimal marginal proglacial lake development beginning, with an area in Lake A of  3.2 km2 and Lake B of 2.2 km2.  The main lake, Lake A, in 2001 had expanded to an area of 14 km2, while Lake B had expanded to 6.5 km2. The main lake, Point A, had an area of 23.8 km2 in 2011 (Loriaux and Cassasa, 2013) . Lake B developing on the north side of the glacier, due to a 3500 m retreat, by 2015 had an area of 9.2 km2.  For Lake A the main terminus retreat of  2200 m from 1987-2015 and led to lake expansion to 34.3 km2. The southern terminus at Point C, has a narrow fringing lake and a retreat of 1100 meters from 1987-2015.

A narrow terminus tongue extending from the main terminus had an area of 0.6 km2 and extended to within ~1.5 km of  the Lake A western shore in March 2018.   By November 10, 2018 this narrow tongue had disintegrated.   In February 2020 the area of Lake A is 35.1 km2 and Lake B is 9.7 km2, a combined area of 44.8 km2 vs 20.5 km2 in 2001.  Gourlet et al (2015) examined the thickness across sections of the NPI, weather prevented the survey of the terminus area of San Quintin Glacier, but there results do hint that the bed is below sea level between Lake A and B basins, and they should connect. In the Landsat images of 2001 and 2015 a transect across the narrow point at the east end of Lake A indicates an area of 41 km2 if the entire main terminus tongue collapses. The ~24 km2 lake expansion at the two main terminus locations of San Quintin Glacier from 2001-2020 represent the fastest lake expansion from glacier retreat, is it the fastest overall for South America? Steffen Glacier is another example of rapid retreat and lake expansion. The retreat is much less than at HPS-12, but that is an example of fjord expansion.

Landsat images of San Quintin Glacier from 1987 and 2015 indicate the expansion of both Lake A and Lake B due to glacier retreat as well as retreat at Point C.

San Quintin in  March and November 2018 Landsat images indicating loss of narrow terminus tongue pink dots.

Acodado Glacier, Chile Retreat Yields Tripling in Lake Area 1987-2020

Acodado Glacier retreat and lake expansion observed in 1987 and 2020 Landsat images.  Red arrow is the 1987 terminus locations, orange arrows the 2015 terminus and yellow arrows the 2020 terminus location.  

Loriaux and Casassa (2013) examined the expansion of lakes of the Northern Patagonia Ice Cap (NPI). From 1945 to 2011 lake area expanded 65%, 66 km2. Rio Acodado has two large glacier termini at its headwater, HPN2 and HPN3. that are fed by the same accumulation zone and comprise the Acodado Glacier. The glacier separates from Steffen Glacier at 900 m. The lakes at the terminus of each were first observed in 1976 and had an area of 2.4 and 5.0 km2 in 2011 (Loriaux and Casassa, 2013).  Willis et al (2012) noted a 3.5 m thinning per year from 2001-2011 in the ablation zone of the Acodado Glacier, they also note annual velocity is less than 300 m/year in the ablation zone. Davies and Glasser (2012) noted that the Acodado Glacier termini, HPN2 and HPN3, had retreated at a steadily increasing rate from 1870 to 2011. Here we examine the substantial changes in Acodado Glacier from 1987 to 2020 using Landsat imagery.  Pelto, 2017 reported a retreat from 1987-2015 of 2100 m for HPN2 and 3200 m for HPN3.

In HPN2 and HPN3 terminate at the red arrow in 1987 , the snowline is at the purple dots at 1000 m. By 2000 the glacier has retreated from the red and yellow arrow by 400 m and 900 m respectively, and the snowline is at 1100 m.  In 2015 it is apparent that HPN2 has retreated 2100 m from the red arrow to the orange arrow.   The snowline was again at 1100 m. In 2020 the snowline in early February was at 1100 m. From 1987-2020 Acodado Glacier terminus HPN2 has retreated 2700 m and HPN3 has retreated 4100 m.  The result of this retreat is an increase in lake area at HPN2 from 2.1 km2 in 1987 to 7.1 km2 in 2020.  At HPN3 lake area expanded from 1.4 km2 to 4.8 km2 . Glasser et al (2016) identified a 40% increase in lake area for the NPI from 1987-2015, much less than the increase at Acodado Glacier. They also note the recent 100 m rise in snowline elevations for the NPI.  The higher snowline indicates warmer temperatures generating high ablation rates, which will leads to reduced ice flux from the accumulation zone to the terminus, which will drive more retreat. Near Point A there are three locations noted in the accumulation zone image below that indicate the reduced ice flow from the accumulation zone into an adjacent outlet glacier. HPN3 has a sharp rise in elevation ~1.5 km above the terminus, before it joins the main Acodado Glacier, it should retreat rapidly toward this point and then calving will end and retreat will slow.  HPN2 has a more gradual slope indicating substantial potential for lake expansion, with a slope significant increase 3 km above the 2020 terminus ,just beyond the former tributary on the east margin.

The retreat here is synonymous with the pattern observed at other NPI outlet glaciers each with rapid calving retreats in expanding proglacial lakes (Glasser et al 2016); Fraenkel Glacier, Benito Glacier and Reichert Glacier and Steffen Glacier. All the outlet glaciers of NPI have retreated significantly in the last 30 years most leading to expanding proglacial lakes (Loriaux and Casassa, 2013;  Pelto, 2017).

Acodado Glacier retreat and lake expansion observed in 1987 and 2020 Landsat images.  Red arrow is the 1987 terminus locations, orange arrows the 2015 terminus and yellow arrows the 2020 terminus location.  The transient snowline is purple dots, the green arrow marks upglacier proglacial lake and Point A is the area of focus of detailed accumulation image below.

Acodado Glacier retreat and lake expansion observed in 2000 and 2015 Landsat images.  Red arrow is the 1987 terminus locations, orange arrows the 2015 terminus and yellow arrows the 2020 terminus location.  The transient snowline is purple dots, the green arrow marks upglacier proglacial lake and Point A is the area of focus of detailed accumulation image below.

Note the expansion of bedrock at points 1,2 and 3 indicating reduced flow from the accumulation to the ablation zone near Point A

Exploradores Glacier Lake Development, Chile

Exploradores Glacier  (EX) in 1987 Landsat and 2020 Sentinel image.  Points A-E are consistent locations discussed.  B=Bayo Glacier.

Exploradores Glacier is an outlet glacier at the northeast corner fo the Northern Patagonia Icefield (NPI).  Glasser et al (2016) note the recent 100 m rise in snowline elevations for the NPI, which along with landslide transport explains the large increase in debris cover since 1987 on NPI from 168 km2 to 306 km2  On  Exploradores  Glacier debris cover expanded by 5.5 km2 from 1987-2015.   Loriaux and Casassa (2013) examined the expansion of lakes on the Northern Patagonia Ice Cap. From 1945 to 2011 lake area expanded 65%, 66 km2Davies and Glasser (2012) noted the fastest retreat during the 1870-2011 period was from 1975-1986 for Exploradores Glacier. Here we examine the response of the glacier to climate change from 1987 to 2020.

In 1987 Exploradores Glacier has a 12 km2 terminus lobe with a couple of small proglacial pond with a total area under 0.2 km2 near Point D.  The snowline is at 1400 m near Point E.  A small lake is impounded by a lateral moraine of Bayo Glacier at Point A.   In 2000 there is now a single small pond near Point D and a small proglacial pond 0.1 km2 near Point C.  The snowline is at  1400 m near Point E. In 2016 small fringing proglacial ponds exist near Point C and D.  A substantial proglacial lake has developed at Point B with an area of ~1 km2 on the east margin of the glacier.  The impounded lake at Point A has not changed. In 2020 the proglacial ponds have expanded at Point C and D.  At Point B the proglacial lake has expanded to ~1.4 km2.  The snowline is above Point E at 1500 m. At Point A the impounded lake has drained somewhat and is now at a lower lake level.  The lake breached the lateral moraine, which had been increasing in relief from the thinning Bayo Glacier.  The snowline on January 1, in the middle of the melt season is already above Point E at 1500 m. The debris cover has extended 5 km up the middle of the glacier from the terminus.

The terminus lobe of the Exploradores Glacier is now collapsing, this is a process that has already occurred at Steffen Glacier, San Quintin Glacier and Colonia Glacier.  The terminus lobe is relatively stagnant as indicated by the minimal surface slope.  The retreat has been slow compared to adjacent Fiero Glacier. The result will be a new substantial proglacial lake.

Exploradores Glacier  (EX) in 2000 and 2016 Landsat images.  Points A-E are consistent locations discussed.  B=Bayo Glacier.

GLIMS view of the terminus indicating the 200 m contour and Point B-D in same location as on images.


Fiero Glacier, Chile Retreat Lago Fiero Expansion

Fiero Glacier in 1987 Landsat and 2020 Sentinel images.  Red arrow indicates 1987 terminus location, yellow arrow 2020 terminus lcoation, and purple dots the snowline. Point A,B and C represent locations where bedrock has expanded.

Fiero Glacier is an outlet glacier draining the northeast quadrant of the Northern Patagonia Icefield (NPI) terminating in Lago Fiero. Loriaux and Casassa (2013) examined the expansion of lakes of the Northern Patagonia Ice Cap. From 1945 to 2011 lake area expanded 65%, 66 km2Davies and Glasser (2012) noted the fastest retreat during the 1870-2011 period was from 1975-1986 for Fiero Glacier.  They noted that Fiero Glacier proglacial lake had an area of 6.6 km2.  Glasser et al (2016) note the recent 100 m rise in snowline elevations for the NPI, which along with landslide transport explains the large increase in debris cover since 1987 on NPI including Fiero Galcier. Here we examine the response of the glacier to climate change from 1987 to 2020.

In 1987 the glacier terminated at a narrow point in the 4.2 km long Lago Fiero that has an area of 5.6 km2.  By 2001 the glacier had retreated 500 m and the transient snowline is at 1000 m.  At point A there is a narrow rock rib. at Point B there are isolated rock rib and knobs and at Point C the rock rib is limited.  In 2015 the lake has expanded to an area of 7.3 km2, and the debris cover has also expanded. The transient snowline is at 1200-1300 m.  In 2020 the lake has expanded to an area of 9.5 km2 and a length of 6.5 km.  The 2.3 km retreat has led to a near doubling in the area of the Lago Fiero, the retreat since 2011 is the fastest rate observed. At Point A the rock rib is now a prominent separation, at Point B and C the rock rib has become continuous much like at Point A. The snowline on January 1, 2020 is at 1200 m, midway through the melt season.  The glacier slope increases 500-1000 m from the current terminus near a surface elevation of 600 m, which could mark the expansion limit of Lago Fiero (see map below).

The retreat of this glacier is larger than that of Colonia Glacier and Pared Nord Glacier further south and Verde Glacier to the north of the NPI.  All the outlet glaciers of NPI have retreated significantly in the last 30 years most leading to expanding proglacial lakes (Loriaux and Casassa, 2913;  Pelto, 2017).

Fiero Glacier in 2001 and 2015 Landsat images.  Red arrow indicates 1987 terminus location, yellow arrow 2020 terminus lcoation, and purple dots the snowline. Point A,B and C represent locations where bedrock has expanded.

Terminus of Fiero Glacier from the Randolph Glacier Inventory in 2001 (Green) and 2011 (blue).  the 500 m, 600 m and 700 m contour are indicated.  Note the steeper slope near 600 m which likely is beyond the expansion limit of Lago Fiero. Base map from GLIMS

Steffen Glacier, Chile Calving Retreat Acceleration 2019

Steffen Glacier in 1987 and 2019 Landsat images.  Red arrow is 1987 terminus location, green arrow 2015 terminus location, yellow arrow 2019 terminus location, orange arrow an area of expanding debris cover and the pink arrow locations indicating water level decline in proglacial lakes by the northwest and midwest secondary terminus. The terminus locations are also noted by red dots for 1987 and yellow dots for 2019.

Steffen Glacier is the south flowing glacier from the 4000 square kilometer Northern Patagonia Icefield (NPI). Several key research papers have reported on the spectacular retreat of this glacier in recent years. Here we update those results using Landsat imagery from 1987-2019 to fully illustrate the changes. Rivera et al (2007) reported that Glaciar Steffen lost 12 km2 and had an average thinning of 1.5 m in the ablation zone from 1979-2001. A JAXA EORC, 2011 report compared parts of the Glaciar Steffen terminus change from 1987 to 2010. They noted a retreat of approximately 2.1 km of the main stem and 870 m of a western terminus.  Davies and Glasser (2012) in examining changes in Patagonian glaciers that the rate of area loss of the NPI increased dramatically after 2001, and has been 9.4 km2/year.  Glasser et al (2016) report that NPI proglacial lake area expanded from 112 km2 to 198 km2 from 1987 to 2015, debris cover area expanded from 4.1% of the NPI to 7.9% during the same period. After 2003 the snowline was noted to have risen ~100 m.  Dussaillant et al (2018) determined the annual mass loss of NPI at ~-1 m/year for the 2000-2012 period, with Steffen Glacier at -1.2-1.6 m/year.

In 1987 the lake at the terminus of the glacier was 1.3 km long from north to south. There are two substantial proglacial lakes with secondary termini on the west side of the glacier, the northwest extends 4 km west from the main trunk, the midwest tongue extends 1.7 km from the main trunk. In  1999 there is little retreat on the west side of the main terminus, but the east side has retreated 700 m.  The northwest secondary terminus has changed little, but the glacier tongue is showing signs of rifting.  The midwest tongue has retreated to within 0.5 km of the main trunk.  In 2004 the west side of the main terminus has retreated 600 m from a peninsula that had buttressed the terminus.  The entire last 3 km of the terminus tongue is in the proglacial lake with no buttressing by the shore, and is poised for breakup.

By 2015 the unbuttressed portion of the terminus had been lost with a 3.4 km retreat since 1987.  The northwest tongue has collapsed a retreat of 3.8 km, while the midwest termini has retreated 1.3 km since 1987. There are four large icebergs more than 0.2 km2 in the proglacial lake. From 2015-2018 the terminus is relatively stable and extends across the entire lake and on the west side is buttressed by a small peninsula.  In 2018 there are three large icebergs more than 0.2 km2 in the proglacial lake.  In 2019 the terminus has retreated 1 km from the 2018 position with  proglacial lake areas along the lowest 2 km on both the west and east margin.  This suggests this section of the terminus is similar to the main terminus in 1987 and 1999 that was poised for further calving retreat.  The 2019 image is from early in the melt season and the proglacial lake is filled with an extensive melange and one large iceberg. The retreat from 1987-2019 of 4.4 km, ~137 m/year, is driven by the 100 m rise in the snowline, resultant thinning, which then drives calving (Glasser et al 2016). Millan et al (2019) indicate the area of tributary glacier convergence near the northwest terminus and above the glacier is 700 m thick, and that the glacier has been retreating along an area where the glacier bed is below sea level, though the terminus now is close to sea level.  Note the Digital Globe image below with the yellow arrows indicating the end of the main lake basin and potentially end of the lake, the eastern margin of the glacier is fringed by proglacial lake up to that point.  Above this point there is another basin that may or may not connect to the current lake. The high snowline elevation in 2019 that is an indicator of increased melt area has led to an expansion of debris cover as well, note orange arrows for 1987 and 2019.

Steffen Glacier in 1999 and 2004 Landsat images. The red dots indicate terminus position, orange arrow where the terminus was buttressed on the eastern shore in 1999, green arrow where the glacier is buttressed on the western shore, the pink arrow indicates the northwest secondary terminus and yellow arrow the midwest secondary terminus.

Steffen Glacier in 2015 and 2018 Landsat images.  Red arrow is 1987 terminus location, green arrow 2015 terminus location, yellow arrow 2019 terminus location, orange arrow an area of expanding debris cover and the yellow dots the margin of the northwest and midwest secondary terminus.

Digital Globe image of lower reach of Steffen Glacier. Yellow arrows indicate an area where the bed rises as indicated by the increased crevassing and steeper surface slope. Note the extent of detachment of the glacier along the eastern margin up to that point.

San Quintin Glacier High Calving Rate Observations in 2018

San Quintin Glacier in 4-16-2017 Sentinel image, red dots indicate terminus location then. Yellow dots the terminus location  on 11-10-2018.

San Quintin Glacier in 3-20-2018 Sentinel image, pink dots indicate terminus position. 

San Quintin Glacier in 11-10-2018 Sentinel image. Yellow dots the terminus location  on 11-10-2018, pink dots from 3-30-2018 and red dots from 4-16-2017. 

San Quintin is the largest glacier of the NPI at 790 km2 in .  The glacier extends 50 km from the ice divide in the center of the ice cap.  The peak velocity is 1100 m/year near the ELA (Rivera et al 2007), declining below 350 m/year in the terminus region.  San Quintin Glacier terminated largely on land until 1991 (Davies and Glasser, 2012). The velocity at the terminus has increased from 1987 to 2014 as the glacier has retreated into the proglacial lake (Mouginot and Rignot, 2015).  The high velocity zone extends more than 40 km inland an even greater distance than at San Rafael (Mouginot and Rignot, 2015).  Thinning rates in the ablation zone of the glacier are 2.3 m/year (Willis et al, 2012).  The glacier has a low slope rising 700 m in the first 22 km.

In 1987 it is a piedmont lobe with evident minimal marginal proglacial lake development beginning (Pelto, 2016).  Progressive retreat of the glacier into the expanding proglacial lake has led to an increasingly chaotic, disintegrating front of the glacier (Willis et al, 2012).  The large evident crevasses/rifts perpendicular to the front suggest the terminus tongue is largely afloat.  Here we examine Sentinel Images from April 2017 to November 2o18 to identify changes. NASA’s Earth Observatory has high resolution images indicating the terminus in June 2014 and April 2017

On April 16, 2017 there were four icebergs with an area greater than 0.1 kmin the San Quintin Lagoon. The narrow terminus tongue extending from the main terminus had an area of 0.6 km2 and extended to within 3.3 km of the lagoons western shore. On March 20, 2018 this tongue remains tenuously connected to the main terminus, and has extended to within 1.5 km of the western shore.  There are six icebergs with an area greater than 0.1 km2.  By November 10, 2018 this narrow tongue had disintegrated.  There are eight icebergs with an area greater than 0.1 km2.  The icebergs are slow to melt in the lagoon compared to a fjord setting. The overall terminus area loss from April 2017 to November 2018 is 1.8 to 2.0  km2. There has been additional detachment on the southern shore where the glacier enters the main lagoon basin.  This should further destabilize the glacier tongue.  In  the coming years the lagoon will continue to expand to a size of at least 40 square kilometers.

As Pelto (2017) noted 19 of the 24 main outlet glaciers of the Northern Patagonia Icefield ended in a lake in 2015, all the lake termini retreated significantly in part because of calving losses. Glasser et al (2016) observed that proglacial and ice-proximal lakes of NPI increased from 112 to 198 km2. A collapse of the terminus tongue on Steffen, Gualas and Reichert Glacier are examples.

October 31, 2018 Sentinel image indicating extensive rifts that have developed and are areas of weakness for further calving.

Landsat comparison of San Quintin Glacier in 1987 and 2015: red arrow indicates 1987 terminus location, yellow arrow indicates 2015 terminus location of the three main termini, and the purple arrow indicates upglacier thinning.


Pared Nord Glacier, Chile Retreat & Landslide Transport 1987-2018

Pared Nord Glacier, Chile in 1987 and 2018 Landsat images.  The red arrow indicates the 1987 terminus location, yellow arrow the 2018 terminus location and purple arrows areas of expanding rock in the lower accumulation zone.  Point A is the front of a wide debris zone from a former landslide, Point B is the front of another landslide deposited debris zone. Point C is a recent landslide deposit on a an unnamed glacier.  The movement f debirs at Point A and B indicate glacier velocity

Pared Nord (Norte) Glacier is a southeast outlet glacier of the Northern Patagonia Icefield (NPI).  Davies and Glasser, (2012)  identify this region of the icefield as retreating faster from 1975-1986 than during any measured period since 1870, the retreat since 2001 has been relatively rapid.   Loriaux and Casassa (2013) examined the expansion of lakes of the Northern Patagonia Ice Cap. From 1945 to 2011 lake area expanded 65%, 66 square kilometers.   Glasser et al (2016) note on Pared Nord that ice-surface debris was transported and redistributed down-ice by glacier flow merging with marginal supraglacial debris.

In 1987 Pared Nord Glacier terminates at a narrow point in the proglacial lake, red arrow.  The debris band at Point A has just turned the corner south towards the terminus and the debris at Point B is near the snowline at the base of the icefall. By 2001 Point B had shifted 4 km downglacier entering the main glacial valley and Point A had shifted 2.5 km towards the terminus.  The terminus had retreated some but was still at the narrow pinning point of the valley.  In 2015 at Point C a landslide had spread across the unnamed glacier. The debris band at Point B had reached the head of a valley from the south side of  the glacier.  In 2018 the purple arrows indicate substantial expansion of bedrock areas near the snowline indicating a rising snowline and glacier thinning.  Glasser et al (2016) note the recent 100 m rise in snowline elevations for the NPI, which along with landslide transport explains the large increase in debris cover since 1987 on Pared Nord.  The main glacier terminus has retreated 1400-1500 m and is currently one kilometer from a widening of the valley, which should lead to an increased calving retreat. The glacier  in 2013 has numerous glacial drainage features, purple arrow in Google Earth image below and substantial crevassing which will lead to calving at the terminus, green arrow. The movement of Point B has been ~4.8 km in 31 years, and of Point A ~3.3 km in 31 years, a velocity of 160 m/year and ~100 m/year respectively.

The retreat of this glacier is less than that of Colonia Glacier to the north and  more than HPN4 glacier to the west.  All the outlet glaciers of NPI have retreated in the last 30 years most leading to expanding proglacial lakes (Pelto, 2017).

Pared Nord Glacier, Chile in 2001 and 2015 Landsat images.  The red arrow indicates the 1987 terminus location and yellow arrow the 2018 terminus location. Point A is the front of a wide debris zone from a former landslide, Point B is the front of another landslide deposited debris zone. Point C is a recent landslide deposit on a an unnamed glacier.  The movement of debris at Point A and B indicate glacier velocity.

Pared Nord terminus in 2013 Google Earth image.  Purple arrows indicate relict glacial drainage features and green arrow large crevasses near the calving front.

Erasmo Glacier, Chile Terminus Collapse

eerasmo-compare

Erasmo Glacier, Chile, comparison in 1987 and 2016 Landsat images.  The red arrow indicates the 2016 terminus and the yellow arrow the 1987 terminus location.  Purple dots indicate the snowline and purple arrows locations of upglacier thinning.

Cerro Erasmo at 46 degrees South latitude is a short distance north of the Northern Patagonia Icefield and is host to a number of glaciers the largest of which flow northwest from the mountain. This is referred to as Erasmo Glacier with an area of ~40 square kilometers.   Meltwater from this glacier enters Cupquelan Fjord, which is host to farmed salmon. This remote location allows Cooke Aquaculture to protect its farm from environmental contamination. Runoff from Erasmo Glacier is a key input to the fjord, while Rio Exploradores large inflow near the fjord mouth limits inflow from the south.  Davies and Glasser (2012) mapped the area of these glaciers and noted a 7% decline in glacier area from 1986-2011 of Cerro Erasmo. The recent retreat of the largest glacier in the Cerro Erasmo massif indicates this area retreat rate has increased since 2011.   Paul and Molg (2014) observed a more rapid retreat in general of 25% total area lost from glaciers in the Palena district of northern Patagonia from 1985-2011, a region at 43-44 south, north of Cerro Erasmo.

In 1987 Erasmo Glacier had a land based terminus at the end of a 6 km long low sloped valley tongue.  The snowline was at 1100 m.  In 1998 there is thinning, but limited retreat and the snowline is at 1250 m.  In 2001 a lake has still not formed and retreat is less than 500 m since 1987. By 2013 a proglacial lake has formed and there are numerous icebergs visible in the lake.  The snowline is at 1200-1250 m in 2013 at the top of the main icefall. In 2015 a large lake has formed and the snowline is at 1200 m again at the top of the icefall.  By 2016 the terminus has retreated 2.9 km since 1987 generating a lake of the same length.  The collapse is ongoing as indicated by large icebergs in the lake.  The snowline in 2016 is at 1200 m at the top of the icefall  The purple arrows indicate locations of expanded bedrock amidst the glacier since 1987.  Each location is above 1000 m indicating upglacier thinning and reduced retained snow accumulation is driving the retreat.  The west most purple arrow indicates where a glacier formerly was joined to the Erasmo Glacier and is now separated. The retreat is consistent with retreat documented at Reichert GlacierHornopirén Glacier and Cord.illera Lago General Carrera Glacier. The rapid retreat will continue until the head of the developing lake basin is reached.

[ngg_images source=”galleries” container_ids=”12″ display_type=”photocrati-nextgen_basic_imagebrowser” ajax_pagination=”1″ template=”/nas/wp/www/sites/blogsorg/wp-content/plugins/nextgen-gallery/products/photocrati_nextgen/modules/ngglegacy/view/imagebrowser-caption.php” order_by=”sortorder” order_direction=”ASC” returns=”included” maximum_entity_count=”500″]

Glacier Nef, Patagonia, Chile retreat 1987-2016.

nef compare

Comparison of 1987 and 2015 Landsat images of Nef Glacier at right and Cachet Glacier at left.  Indicating retreat of Nef Glacier from red arrows to yellow arrows of 1.8 km and development of a new lake at the terminus. Purple arrows indicate upglacier thinning leading to separation of glacier tributaries. 

Glacier retreat and thinning is particularly strong in the Patagonian icefields of South America. The two largest temperate ice bodies of the Southern Hemisphere are the Northern Patagonia Icefield 4,000 km2 and the Southern Patagonia Icefield, 13,000 km2. It has been estimated that the wastage of the two icefields from 1995–2000 has contributed to sea level rise by 0.105 ± 0.011 mm year,which is double the ice loss calculated for 1975-2000 (Rignot et al. 2003).   Davies and Glasser (2012) work, has an excellent figure indicating two periods of fastest recession since 1870, are 1975-1986 and 2001-2011 for NPI glaciers, which suggests that ice volume loss increased after 2000. They noted the loss was 0.07% from 1870-1986, 0.14% annually from 1986-2001 and 0.22% annually from 2001-2011. Glasser et al (2011) find the recent ice volume rate loss is an order of magnitude faster than at other time intervals since the Little Ice Age. Baker River (Rio Baker) is located to the east of the Northern Patagonia Icefield and is fed mainly by glacier melt water originating from the eastern outlet glaciers of the icefield Leones, Soler, Nef, Colonia. Rio Baker is the most important Chilean river in terms of runoff, with an annual mean discharge of about 1000 m3/s Lopez and Casassa (2009). Glacier Nef is one of the main glaciers feeding Rio Baker. Rio Baker was a proposed critical hydropower resource for Chile. Hidroaysen Project had proposed 5 dams on the Baker and Pascua River generating 2750 MW of power, all three proposed dams on the Rio Baker have been cancelled.

Glacier Nef began to retreat into a moraine dammed proglacial lake in 1945 (Loriaux and Casassa, 2014). By 1987 the lake remained less than 1 km long, with glacier thinning predominating over retreat. From 1987 to 2015 the glacier has retreated 1.8 km calving into the growing lake.  The lake width was essentially uniform during this phase of retreat There is not significant retreat from 2015 to 2016. The lake is currently about 5.4 square kilometers and has a mean depth of ~125 m (Loriaux and Casassa, 2014).  In 2015 Glacier Nef has not reached the head of this proglacial lake and will continue to retreat. The west side of the terminus is debris covered and has a fringing proglacial lake that has developed after 2000 and will aid in the continuing retreat. The terminus is currently at a pinning point, where the valley is constricted providing greater terminus stability. Further retreat will lead to an expansion of the embayment and calving front, leading to a further increase in glacier retreat. The lack of elevation change of the lower glacier and the isolated proglacial lake here suggests the lake will expand laterally as well as in length. The debris cover is slowing the thinning and retreat of the western margin. The purple arrows indicate thinning upglacier in a former tributary glacier. The 2016 Landsat image indicates a high snowline at 1350 m, purple dots.  Willis et al (2011) observed that the thinning rate of NPI glaciers below the equilibrium line has increased substantially from 2000-2012, partly an indication of a higher snowline indicative of greater ablation and a longer snow free period lower in the ablation zone. For example on Nef Glacier by January 8, 2016  the snowline was at 1300 m and remained high up until at least the mid-march image below. The retreat follows the pattern of enhanced calving in a proglacial lake for NPI glaciers such as Gualas GlacierReichert Glacier, Steffen Glacier, and Colonia Glacier.
nef 2016

2016 Landsat image of Nef Glacier indicating terminus yellow arrow and source of the debris for the debris covered terminus. 

nef terminus

Closeup of Nef Terminus from Chile Topographic Application.  Notice the widening valley just above terminus.  Debris cover is insulating ice on west side of terminus.  

San Quintin Glacier, Chile terminus disintegration 1987-2015

san quentin compare

Landsat comparison of San Quintin Glacier in 1987 and 2015: red arrow indicates 1987 terminus location, yellow arrow indicates 2015 terminus location of the three main termini, and the purple arrow indicates upglacier thinning.

San Quintin is the largest glacier of the NPI at 790 km2 in 2001 (Rivera et al, 2007).  The glacier extends 50 km from the ice divide in the center of the ice cap.  The peak velocity is 1100 m/year near the ELA (Rivera et al 2007), declining below 350 m/year in the terminus region.  The velocity at the terminus has increased from 1987 to 2014 as the glacier has retreated into the proglacial lake (Mouginot and Rignot, 2015).  The high velocity zone extends more than 40 km inland an even greater distance than at San Rafael (Mouginot and Rignot, 2015).  Thinning rates in the ablation zone of the glacier are 2.3 m/year (Willis et al, 2012).  The glacier has a low slope rising 700 m in the first 22 km. The low slope, broad piedmont lobe and many distributary terminus lobes is like the Brady Glacier, Alaska.

Davies and Glasser (2012) note that San Quintin Glacier terminated largely on land until 1991. The glacier has lost 15 % of its area in the last century (Davies and Glasser, 2012).  The glacier has a main terminus and many subsidiary termini.  In 1987 it is a piedmont lobe with evident minimal marginal proglacial lake development beginning. There is limited lake development at the main southern and northern terminus Point C and B respectively. Harrison et al (2001) observed that in 1993 the glacier terminus was advancing strongly into vegetated ground, while from 1996 to May 2000 the glacier underwent a transition between advance and retreat.  The high rates of thinning are leading to the retreat not just of main terminus but the distributary terminus areas extending north and south into lake basins from the main glacier. From 1987 to 2015 the main terminus retreated 2200 m, almost all after 2000, largely through a disintegration of the terminus tongue in a proglacial lake.  Extensive rifting of the terminus lobe in 2013 and 2015 is still apparent in imagery below, indicating this rapid area loss is not finished.  The main lake, Point A, had an area of 23.8 square kilometers in 2011 (Loriaux and Cassasa, 2013) . The lake at Point B developing on the north side of the glacier, due to a 3500 m retreat, is now over 8 square kilometers.  The southern terminus at Point C, has a narrow fringing lake and a retreat of 1100 meters from 1987-2015. The retreat here follows the pattern of Fraenkel GlacierAcodado Glacier and Steffen Glacier to the south.

san quintin overview

Digital Globe image of San Quintin Glacier in 2011.

san quintin terminus 2013

2013 Google Earth image, with the large rifts indicating glacier weakness noted with blue arrows. 

san quintin terminus 2015

2015 Landsat image, yellow line indicates terminus. Note the tongue is surrounded on three sides by water.