Benito Glacier, Chile 2021 Calving Event Drives Further Retreat


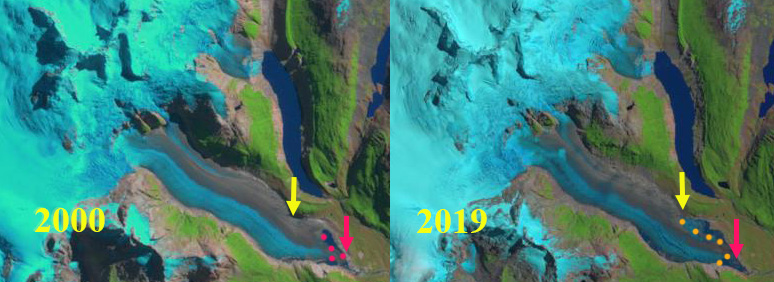
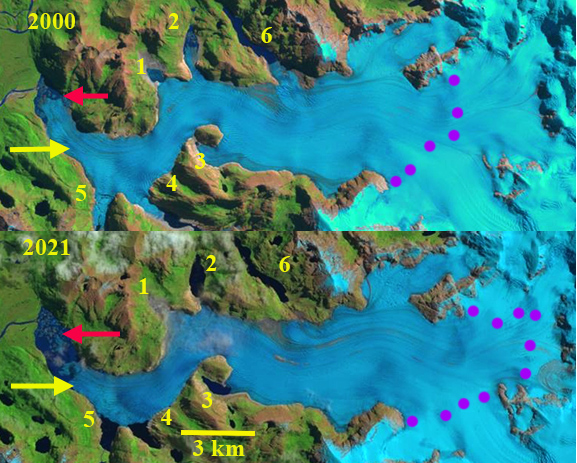
Benito Glacier in 2000 and 2021 Landsat images. Locations 1-6 are current or former distributary terminus locations. Red arrow is the 2000 terminus location and yellow arrow the 2021 terminus location.  A small cloud is obscuring an iceberg near terminus.  Purple dots are the snowline.

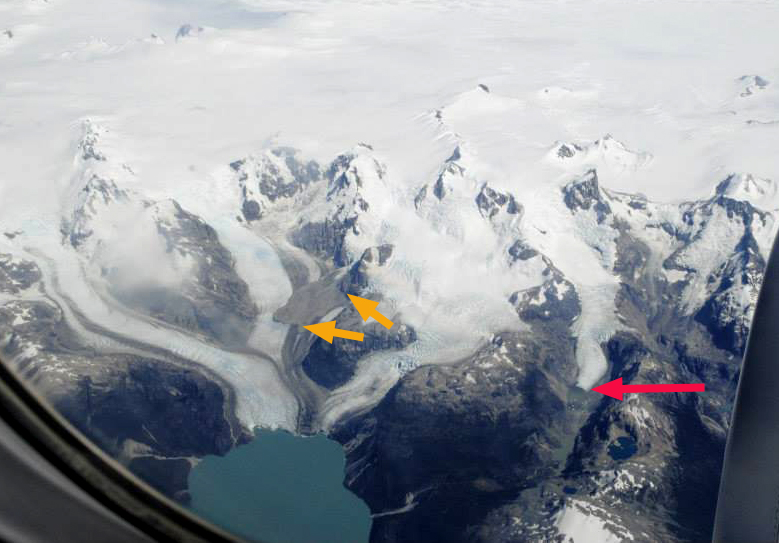
Benito Glacier is a temperate outlet glacier on the west side of the North Patagonian Icefield terminating in an expanding lake. The glacier is south of  San Quintin Glacier and north of Acodado GlacierLoriaux and Casassa (2013) examined the expansion of lakes of the Northern Patagonia Ice Cap. From 1945 to 2011 lake area expanded 65%, 66 square kilometers. Ryan et al (2018) identified thinning of 2.8 m/year in the ablation zone from 2000-2013, and that thinning of over 120 m extended from the terminus to ~750 m from 1973-2017. Mouginot and Rignot (2015)  indicate that the velocity of Benito Glacier is between 200-500 m per year along the center line below the snowline. Glasser et al (2016) note the glacier has limited debris cover and that the average transient snowline in 2013-2016 is at 1000 m, substantially above the ~900 m average from earlier.

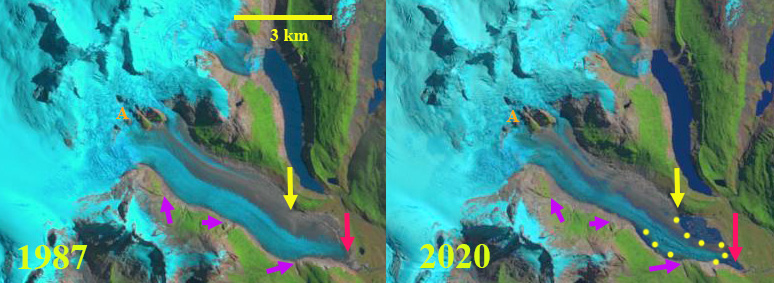
Benito Glacier in 1987 main terminus was on an outwash plain.  The glacier has five distributary termini (1,2,34,5,6) two of which had open proglacial lakes in 1987.  At Point 3 the glacier flows around a nunatak and reconnects. In 2000 a 1 km long proglacial has formed at the main terminus.  Distributary termini 1,2 and 4 all have proglacial lakes.  The snowline in 1987 and 2000 is 800-825 m. By 2015 there are  five ending in lakes, with Lake 6 having retreated out of a lake basin. A lake has formed at the new distributary terminus at Lake 3. The two tributaries to the north indicated with arrows each retreat approximately 1 km from 1987 to 2015 and in both cases are no longer calving termini.  The main glacier terminus has retreated into a proglacial lake, with a retreat of 2 km from 1987 to 2015. The lowest 1.5 km  has a low slope and peripheral lakes suggesting the lake will expand substantially as Benito Glacier retreat continues. The transient snowline in 2015 is at  900 m. In 2021 a significant iceberg 0.4 km2 has calved off the terminus.  The terminus has retreated 2900 m from 1987-2021 with the lake area expanding to 2.8 km2.  The lower 1.5 km of the glacier remains low sloped suggesting significant lake expansion is ongoing. The glacier no longer reaches the former proglacial lake 2 or 6. Proglacial lake 1 has drained. Proglacial lake 2,3, and 4 continue to expand. The snowline on Feb. 6 2021 is at 875-900 m, rising to 925-950 m by March 16, 2021.

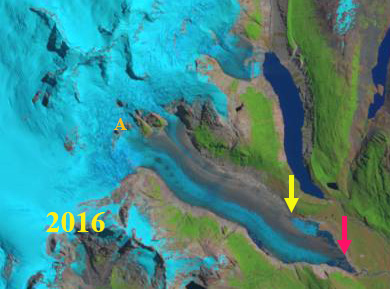
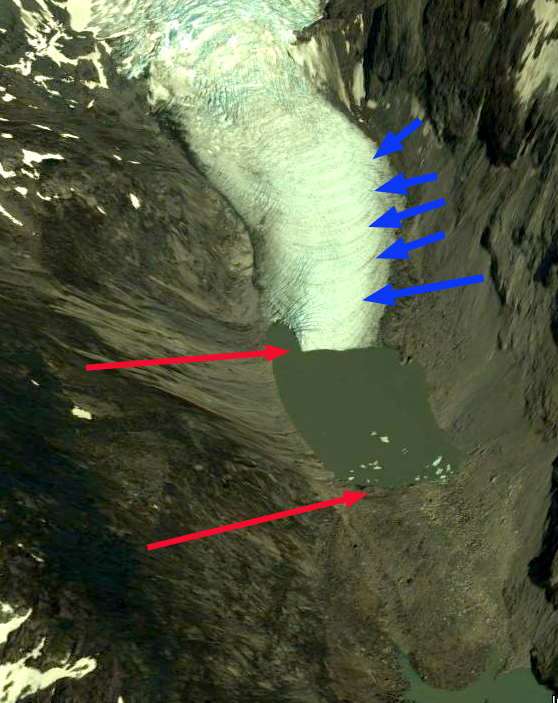
March 17, 2021 Landsat image indicating iceberg located off front of Benito Glacier


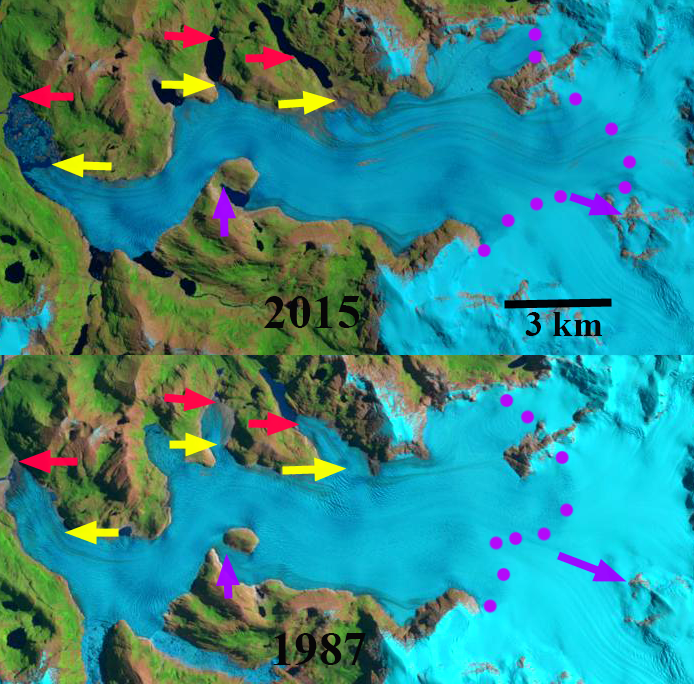
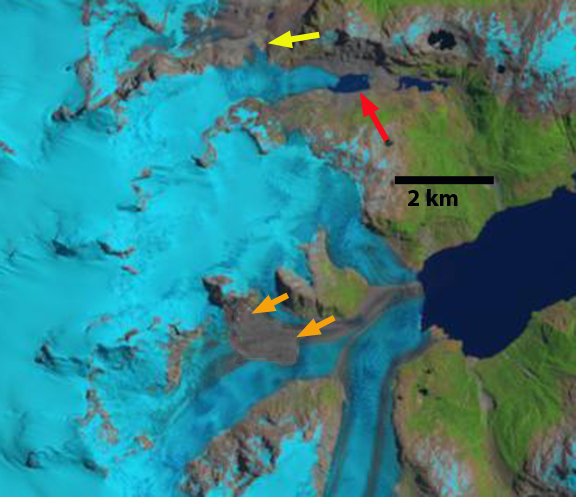
Benito Glacier comparison in Landsat images from 1987 and 2015 indicating the terminus position in 1987 red arrows, yellow arrows the 2015 terminus positions. Locations 1-6 are current or former distributary terminus locations. purple arrows where glacier thinning is expanding bedrock areas. The snowline is indicated by purple dots

Soler Glacier Retreat and Lake Expansion

Soler Glacier in 1987 and 2020 Landsat images.  Red arrow indicates 1987 terminus location, yellow arrow indicates 2020 terminus location on north side of glacier.  Yellow dots indicate margin of lake and purple arrows indicate specific locations where glacier thinning is evident.

Soler Glacier is an outlet glacier on the east side of the Northern Patagonia Icefield (NPI). The terminus response of this glacier has been slower and more limited than on most NPI glaciers.  Aniya and Fujita (1986)  reported a total retreat of 200-350 m from 1944 to 1984.  Glasser et al (2016) note the recent 100 m rise in snowline elevations for the NPI, which along with landslide transport explains the large increase in debris cover since 1987 on NPI from 168 km2 to 306 km2 .  Loriaux and Casassa (2013) examined the expansion of lakes on the Northern Patagonia Ice Cap reporting that from 1945 to 2011 lake area expanded 65%, 66 km2. For Soler Glacier lake formation did not occur until the last decade and debris cover has changed little as well. Willis et al, (2012) identified thinning of ~2 m/year in the ablation zone from 1987-2011. This thinning is now leading to the development of a significant proglacial lake that is examined using Landsat images from 1987-2020.

In 1987 the glacier is still up against the Little Ice Age moraine, though it had thinned considerably resulting in retreat down the slope of this vast moraine. By 2000 a small lake had developed both on the north and south side of the main terminus with a total area of ~0.3 km2, red dots. In 2016 and 2019 this lake had expanded, with the northern arm mostly filled with ice, orange dots.  In October 2020 the lake has an area of ~1 km2 and is mostly open water. The extensive thinning of the terminus tongue continues to drive both retreat and lake expansion.  The thining is evident at Point A where bedrock knobs have emerged from the ice near the snowline.  The three purple arrows on the south side of the glacier indicate thinning as these bedrock features are increasingly distant from the glacier. The terminus has retreated 500 m in the glacier center, 2100 m on the north side and 1300 m on the south side from 1987-2020.  The terminus tongue in its lowest 1.5 km continue to thin and will collapse in the lake in the near future. The end of summer snowline has averaged 1450 m in recent years leading to continued mass loss without calving in the lake (Glasser et al 2016).

Lake development here lags that of other glacier around the NPI such as Exploradores, Nef, Steffen and San Quintin.

Soler Glacier in 2000 and 2019 Landsat images.  Red arrow indicates 1987 terminus location, yellow arrow indicates 2020 terminus location on north side of glacier.  Red dots  and orange dots indicate margin of lake.

Soler Glacier in 2016 Landsat image.  Red arrow indicates 1987 terminus location, yellow arrow indicates 2020 terminus location on north side of glacier.  

Northern Patagonia Icefield High Equilibrium Line Altitude in 2019

Northern Patagonia Icefield Landsat view on 4/6/2019. Transient snowline indicated on individual glaciers with purple dots. Clockwise, L=Leones, So=Soler, N=Nef, Ca=Cachet, Co=Colonia,  PN=Pared Nord, PS=Pared Sur, H4=HPN4, St=Steffen, A=Acodado, B=Benito, H1=HPN1, Sq=San Quintin.

The Northern Patagonia Icefield from 1987-2015 decreased in area, while debris cover area expanded and the size of proglacial lakes expanded (Glasser et al 2016).  The icefield area declined from 4113 to 3887 km2, debris cover increased from 168 to 307  km2 and lake area expanded from 112 to 198 km2 In this paper we also examined the recent rise in the transient snow line (TSL). The TSL is the location of the transition from snow cover to bare glacier ice at a particular time during the ablation season, while the Equilibrium Line Altitude (ELA) is the altitude of the snow line at the end of the ablation season. The TSL at the end of the melt season is the ELA.  In recent years the ELA has been rising, and the highest annually observed TSL in the period 2013-2016 averaged 1215 m (Glasser et al 2016). This is an ELA rise of  at least 103 m compared with the  observed  1979-2003 ELA.  Landsat 8 imagery from April 6, 2019 reveals the TSL for most NPI glaciers, this is typically beyond the end of the melt season, but not in 2019, hence the TSL from this date will be the approximate annual ELA.  How does it compare and what does that mean for icefield mass balance in 2019?

On April 6, 2019 the TSL was highest on glaciers on the east side of the icefield decreasing for the western outlet glaciers. Clockwise from Leones Glacier in the Northeast to San Quintin Glacier on the west side the TSL observed ranged from 1525 m on Leones Glacier and Soler Glacier to a low of 1075 m on San Quintin Glacier.  The mean TSL is 1260 m for the glaciers reported by Glasser et al (2016) and 1300 m for all glaciers.  TSL on April 6, 2019 on glaciers on the east side of the icefield averaged 1425 m, while on the east side of the icefield the average was 1200 m.

Willis et al (2012) noted the ELA of NPI glaciers for the 2001-2011 period, a glacier by glacier comparison to 2019  indicates the ELA is  ~150 m higher in 2019.  This is the highest mean TSL observed for the NPI and suggests a strong negative surface mass balance year for the icefield in 2019.  This does not include the calving losses such as observed at San Quintin Glacier.  Dussaillant et al (2018) reported negative mass balances of NPI glaciers of ~-1 m using two different methods for the 2000-2012 period. TSL observations since indicate the ELA has been higher in recent years driving even more negative balances.  As Pelto (2017) noted 19 of the 24 main outlet glaciers of the Northern Patagonia Icefield ended in a lake in 2015, all the lake termini retreated significantly in part because of calving losses. Surface mass balance losses in 2019 will lead to continued retreat such as observed at San Quintin Glacier, Nef Glacier, and Acodado Glacier. This will also increase the debris covered area, which increases albedo and ablation further.

Northern Patagonia Icefield ELA reported by Willis et al (2012), Glasser et al (2016) and for 2019. 

Gualas Glacier (G) and Reichert Glacier (R) TSL on 4/6/2019 in Landsat image.


Benito Glacier, Chile Retreats 2km 1987-2015

Benito Glacier comparison in 1987 and 2015 indicating the terminus position in 1987 red arrows, yellow arrows the 2015 terminus positions, purple arrows where glacier thinning is expanding bedrock areas, the snowline is indicated by purple dots. 

Glacier Benito is a temperate outlet glacier on the west side of the North Patagonian Icefield the glacier is south of  Fraenkel Glacier and north of Acodado GlacierLoriaux and Casassa (2013) examined the expansion of lakes of the Northern Patagonia Ice Cap. From 1945 to 2011 lake area expanded 65%, 66 square kilometers.  Willis et al (2012) noted a 2.0 m ice thickness loss per year from 2001-2011 in the ablation zone. Mouginot and Rignot (2015)  indicate that the velocity of Benito Glacier is between 200-500 m per year along the center line below the snowline.  Glasser et al (2016) note that this glacier has limited debris cover. In the last two years an expedition organized by Martin Sessions has been examining Benito Glacier and has been reporting from the field this month. 

Benito Glacier in 1987 terminated on an outwash plain.  The glacier has five key distributary termini two of which have open proglacial lakes.  By 2015 there are six tributary termini, five ending in lakes, with one having retreated out of a lake basin. The two tributaries to the north indicated with arrows each retreat approximately 1 km from 1987 to 2015 and in both cases are no longer calving termini.  The main glacier terminus has retreated into a proglacial lake, with a retreat of 2 km from 1987 to 2015. The lowest 1.5 km  has a low slope and peripheral lakes suggesting the terminus lake will expand substantially as Benito Glacier retreat continues. The transient snowline in  the two images 2015 and 2016 is at  900 m. Glasser et al (2016) note that this glacier average transient snowline in 2013-2016 is at 1000 m.  Winchester  et al. (2013) identified thinning of 150 m in the lower ablation zone from 1973-2011, with the most rapid thinning from 2007-2011.

Benito Glacier comparison in 1987 and 2015 indicating the terminus position in 1987 red arrow, yellow arrow the 2015 terminus positions, and the snowline is indicated by purple dots. 

Google Earth image in 2012 of Benito Glacier indicating proglacial lake areas at the green arrows.  


North Leones Glacier Retreat and new Landslide, Patagonia, Chile

Jill Pelto, my daughter returning from fieldwork with UMaine in the Falkland Island took a picture last week out the plane window of Leones Glacier of the northern Patagonia Icefield. The picture illustrated two changes worth further examination, and the fact that if you have a glacier picture that you would like more information on let me know. The picture indicates outlet glaciers of the Northern Patagonia icefield fed by the snowcovered expanse.  Also evident is a large landslide that is both fresh and that I knew had not been there before, orange arrow,and it showed a new lake had formed due to retreat of the glacier north of Leones Glacier, red arrow, hereafter designated North Leones Glacier. The landslide extends 2 km across the glacier and is 3 km from the terminus. Here we use 1985 to 2014 Landsat imagery to identify changes in North Leones Glacier and the landslide appearance.

npi tri glacier
Jill Pelto took this picture on March 13th, 2015

In 1985 there are medial moraines on the glacier surface, but no large landslide deposit. The Northern Leones Glacier terminates on land, red arrow. A distributary terminus almost connects with another glacier to the north at the yellow arrow. In 1987 there is little evident change from 1985. By 2002 a small lake is beginning to form at the terminus of Northern Leones Glacier. By Feb. 2014 a substantial lake has formed at the end of the North Leones Glacier. There is considerable separation between the distributary terminus at the yellow arrow and the next glacier. There is no landslide deposit either. Google Earth imagery indicates the lack of a landslide deposit as well. A closeup of the terminus of North Leones Glacier in 2013, with Google Earth imagery, indicates ogives (blue arrows), which are annually formed due to seasonal velocity changes through an icefall. In January 2015 the landslide deposit is evident, extending about 2 km across Leones Glacier and 3 km from the terminus. The North Leones Glacier has retreated 700 meters from 1985-2015. The retreat of the distributary terminus indicates thinning upglacier of the icefall on North Leones Glacier. The landslide adds mass to Leones Glacier, which will lead to a velocity increase. The debris is thick enough to reduce melting in this portion of the ablation zone. The velocity of this glacier is indicated by (Mouginot and Rignot, 2015) as 200-400 meters per year, indicating that for the next decade at least this landslide will impact the lower Leones Glacier. (Willis et al, 2012) identify thinning of the Leones Glacier area around 1 m per year, which will be reduced on the landslide arm of the glacier.
(Davies and Glasser, 2012), indicate that this region experienced increased area loss from 1986-2011.  Lago Leones feeds the Leones River which is also fed by the retreating General Lago Carerra Glacier.

leones glacier 1985
Landsat image 1985

leones glacier 1987
Landsat image 1987

leones galcier 2002
Landsat image 2002

leones glacier 2014
Landsat image 2014

leones north ge
Google Earth Image 2010

leones landslide
Google Earth image 2013

Leones Glacier 2015
Landsat image 2015

Verde Glacier Retreat, Chile

Verde Glacier is adjacent to Reichert Glacier and drains the north side of the Northern Patagonia Icefield. It is a small glacier compare to many outlet glaciers of the icefield that have been examined in previous posts, Reichert Glacier, Steffen Glacier, Nef Glacier, and Colonia Glacier. Here we examine Landsat imagery during the 1998-2014 period to identify the response of the glacier. The glacier flows from a pair of peaks at 1800 m to terminate at the edge of a proglacial lake. There is a significant icefall at 800-1250 m and a significant avalanche fan at the base of this icefall that is spills from a disconnected portion of the glacier west of the terminus and just northwest of the icefall. Davies and Glasser (2012) Figure 2d indicates the glacier nearly filling the entire lake in 1975. In Figure 8a they indicate the fastest retreat for the glacier being from 1998-2014. Rivera et al (2007) indicate the ELA for the glacier at the top of the icefall 1250 m. npi north ge
The yellow arrow in each image is the 2014 terminus and the red arrow the 1998 terminus. In 1998 the glacier terminates at the red arrow just beyond the northeast bend in the lake. The lake is 1.6 km long. By 2001 the glacier has retreated 300 m and is at this bend. Notice that the lowest lone kilometer of the glacier is quite debris covered. By 2014 the glacier has retreated to the yellow arrow, this is a further 600 m retreat since 2011. The lake is 2.5 km long measured along its center line. The 900 meter retreat in 16 years is substantial for a glacier that is only 5 km long. A cloe up view of the terminus in a Goggle Earth image indicates that the lowest 300 m is debris coverered ice, notice the wetness of some of the debris, pink arrow. This looks more like ice cored moraine than active glacier ice covered by debris. If this is the case the active terminus is 300 m from the shore of the lake, at the yellow terminus where calving begins. It is certain the lake will expand further as the buried ice melts, but it is nearing its southwestern limit. The steep slope of the icefall and the rock slope to the right of the icefall is evident. This will lead to continued avalanching onto the terminus area, that will make that lowest region above the yellow arrow more difficult to melt out. One observation that is striking is the number of narrow alpine lakes that have formed and expanded as the Northern Patagonia Icefield outlet glaciers have receded. npi n 1998
1998 Landsat image

npi n2001
2001 Landsat image

npi n 2014
2014 Landsat image

verde icefall
Google Earth image