Soler Glacier, Chile Terminus Tongue Breakup in 2023

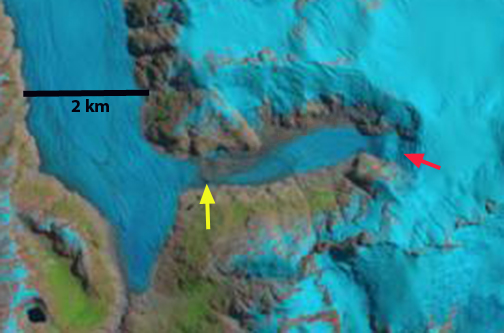
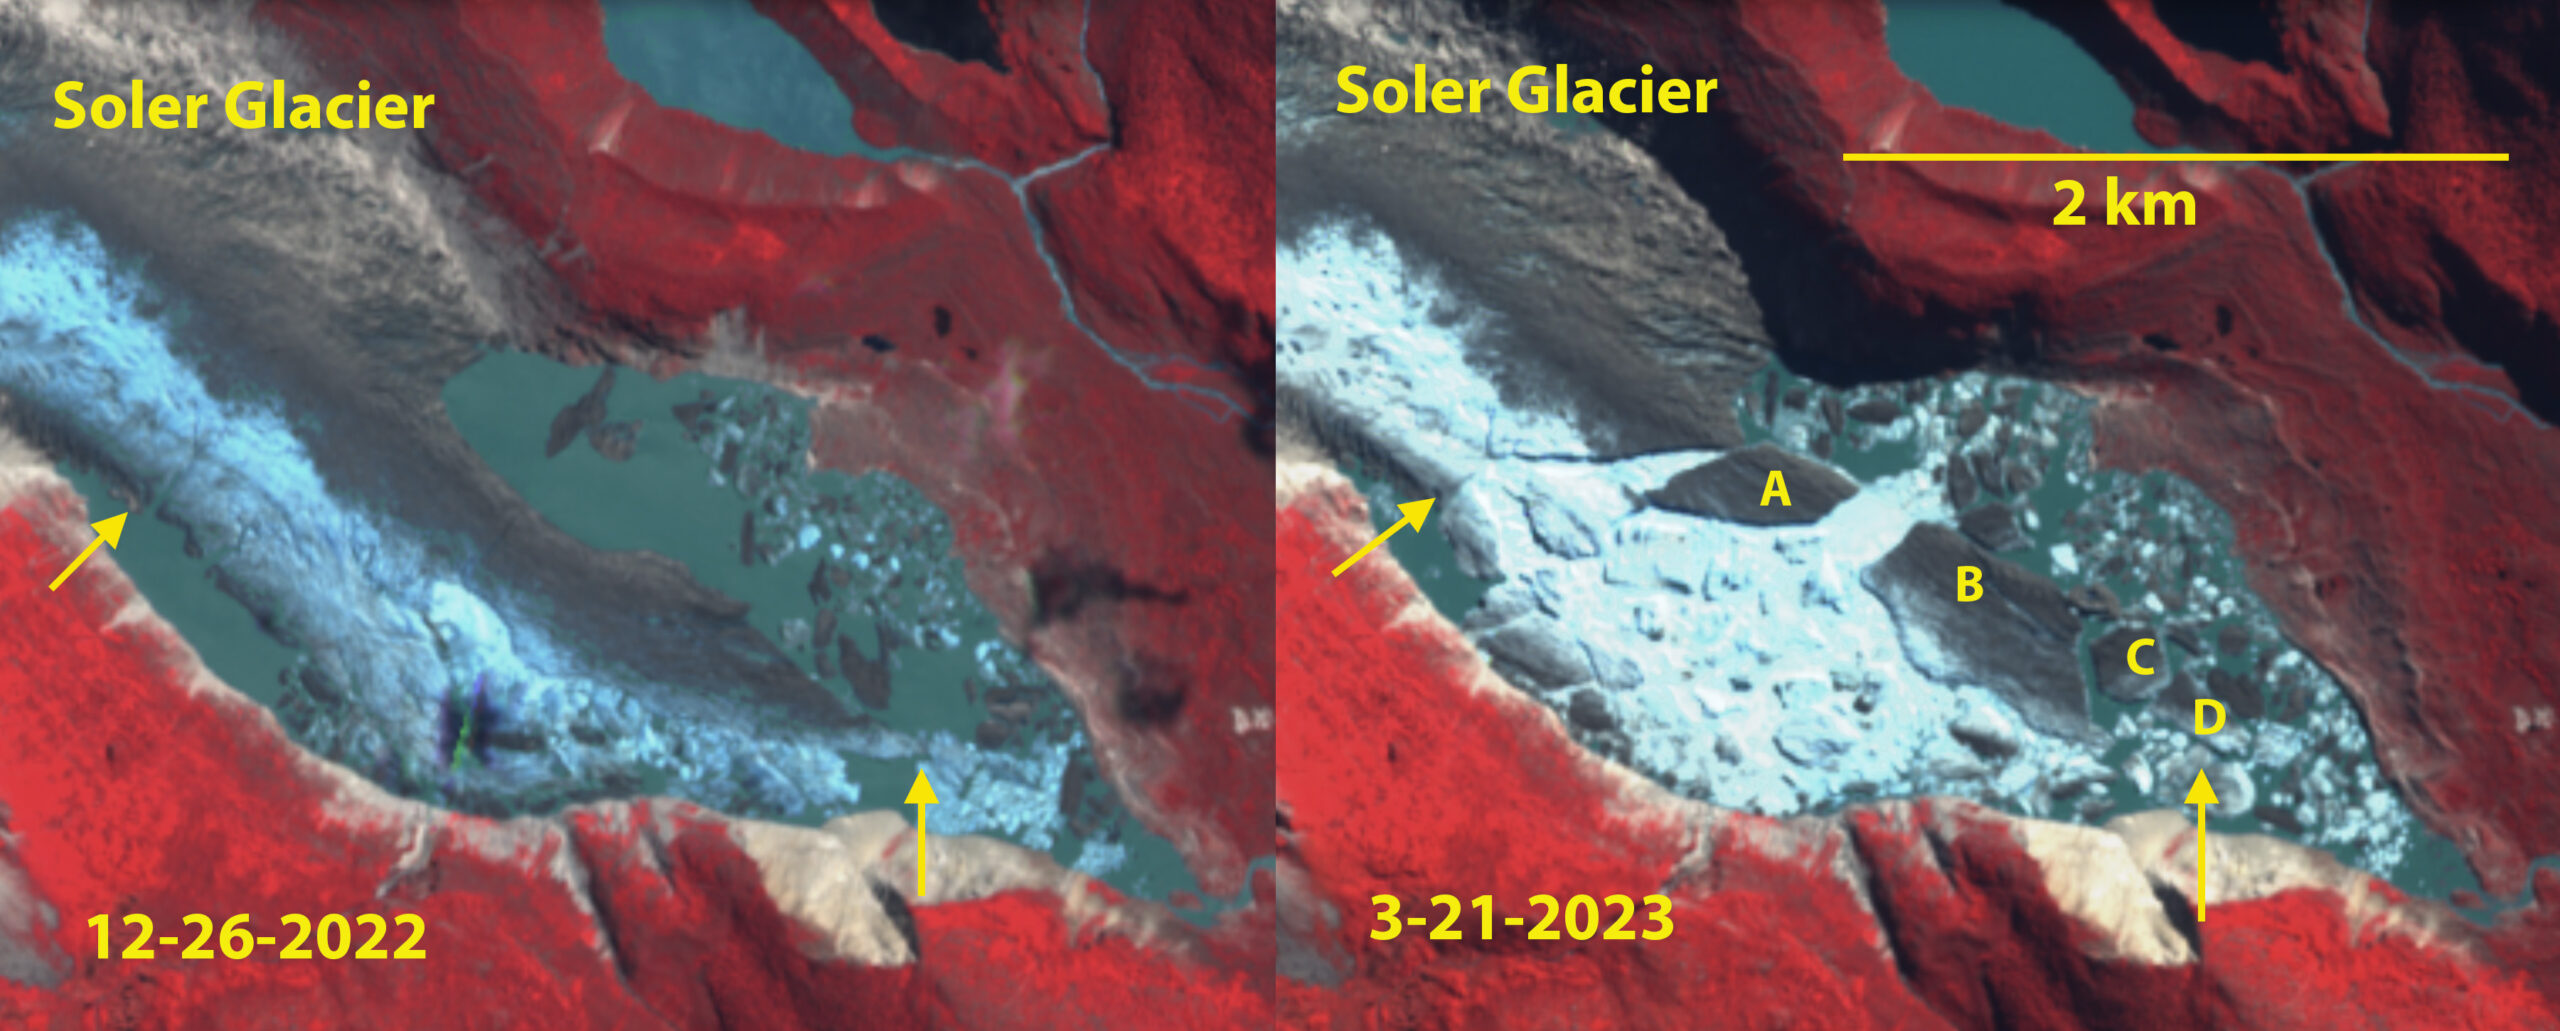
Soler Glacier, Chile terminus tongues is 1.9 km long on 12-26-2022 and by 3-21-2023 it has broken up, with four larger bergs A-D. False color Sentinel images.

In 2020 I noted that the Soler Glacier “terminus tongue in its lowest 1.5 km continue to thin and will collapse in the lake in the near future.” Here the breakup of this tongue in 2023 is reported. Soler Glacier is an outlet glacier on the east side of the Northern Patagonia Icefield (NPI). The terminus response of this glacier was slower and more limited than on most NPI glaciers, just 200-350 from 1944 to 1984 (Aniya and Fujita 1986).  Glasser et al (2016) note the recent 100 m rise in snowline elevations for the NPI, which leads to the 2 m thinning per year identified by Willis et al, (2012)  in the ablation zone from 1987-2011.  Loriaux and Casassa (2013) examined the expansion of lakes on the Northern Patagonia Ice Cap reporting that from 1945 to 2011 lake area expanded 65%, 66 km2.

Soler Glacier had no proglacial lake in 1987. By 2000 a small lake had developed both on the north and south side of the main terminus with a total area of ~0.3 km2 see Mike Hambrey image below. In 2016  lake had expanded, with the northern arm mostly filled with ice.For Soler Glacier lake formation did not occur until the last decade reaching an area of 1 km² by 2020. As the 2022/23 melt season began the glacier had a 1.9 km long central tongue extending down the middle of the lake, that had an area of 1.4 km², as evidenced on Dec. 26, 2022. By early March the tongue had broken up as revelaed by the Sentinel image on March 21, 2023. On this date the lake surface has refrozen on the south side and has some new snow on it. The lake has expanded to 2.75 km², with the largest iceberg B, occupying 10% of the lake. The lake expansion is small compared to Steffen Glacier or San Quintin Glacier, but just as significant for this smaller glacier.

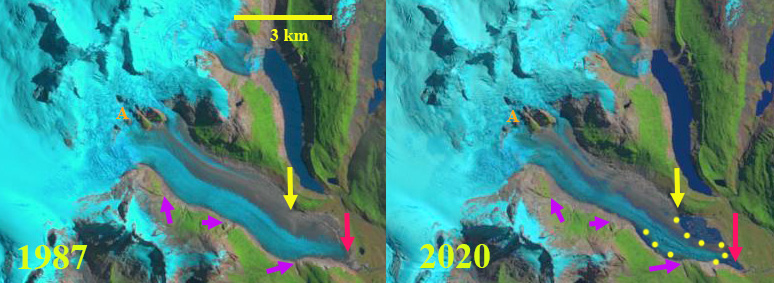
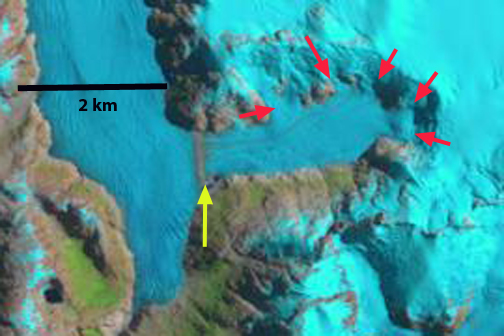
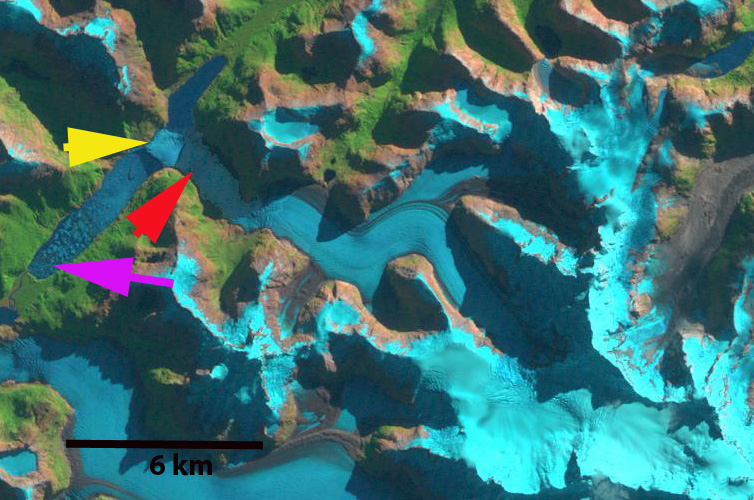
Soler Glacier in 1987 and 2020 Landsat images.  Red arrow indicates 1987 terminus location, yellow arrow indicates 2020 terminus location on north side of glacier.  Yellow dots indicate margin of lake and purple arrows indicate specific locations where glacier thinning is evident.

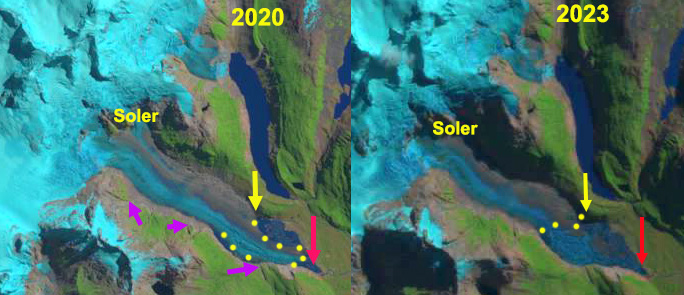
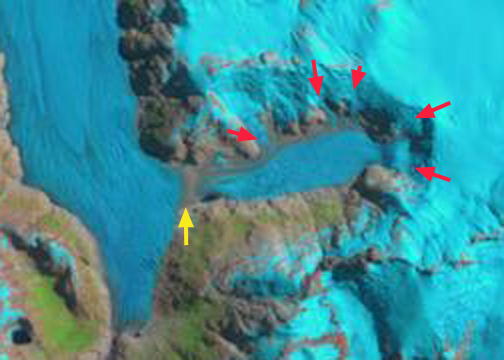
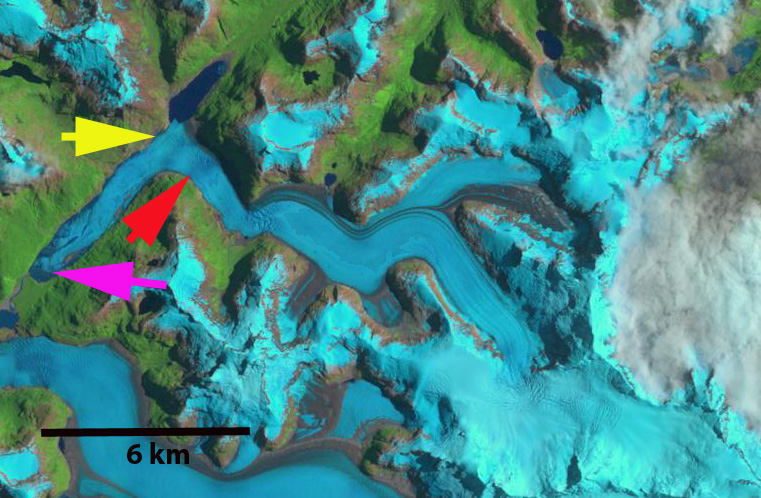
Soler Glacier in 2020 and 2023 Landsat images.  Red arrow indicates 1987 terminus location, yellow arrow indicates 2020 terminus location on north side of glacier.  Yellow dots indicate margin of lake and purple arrows indicate specific locations where glacier thinning is evident in 2020.

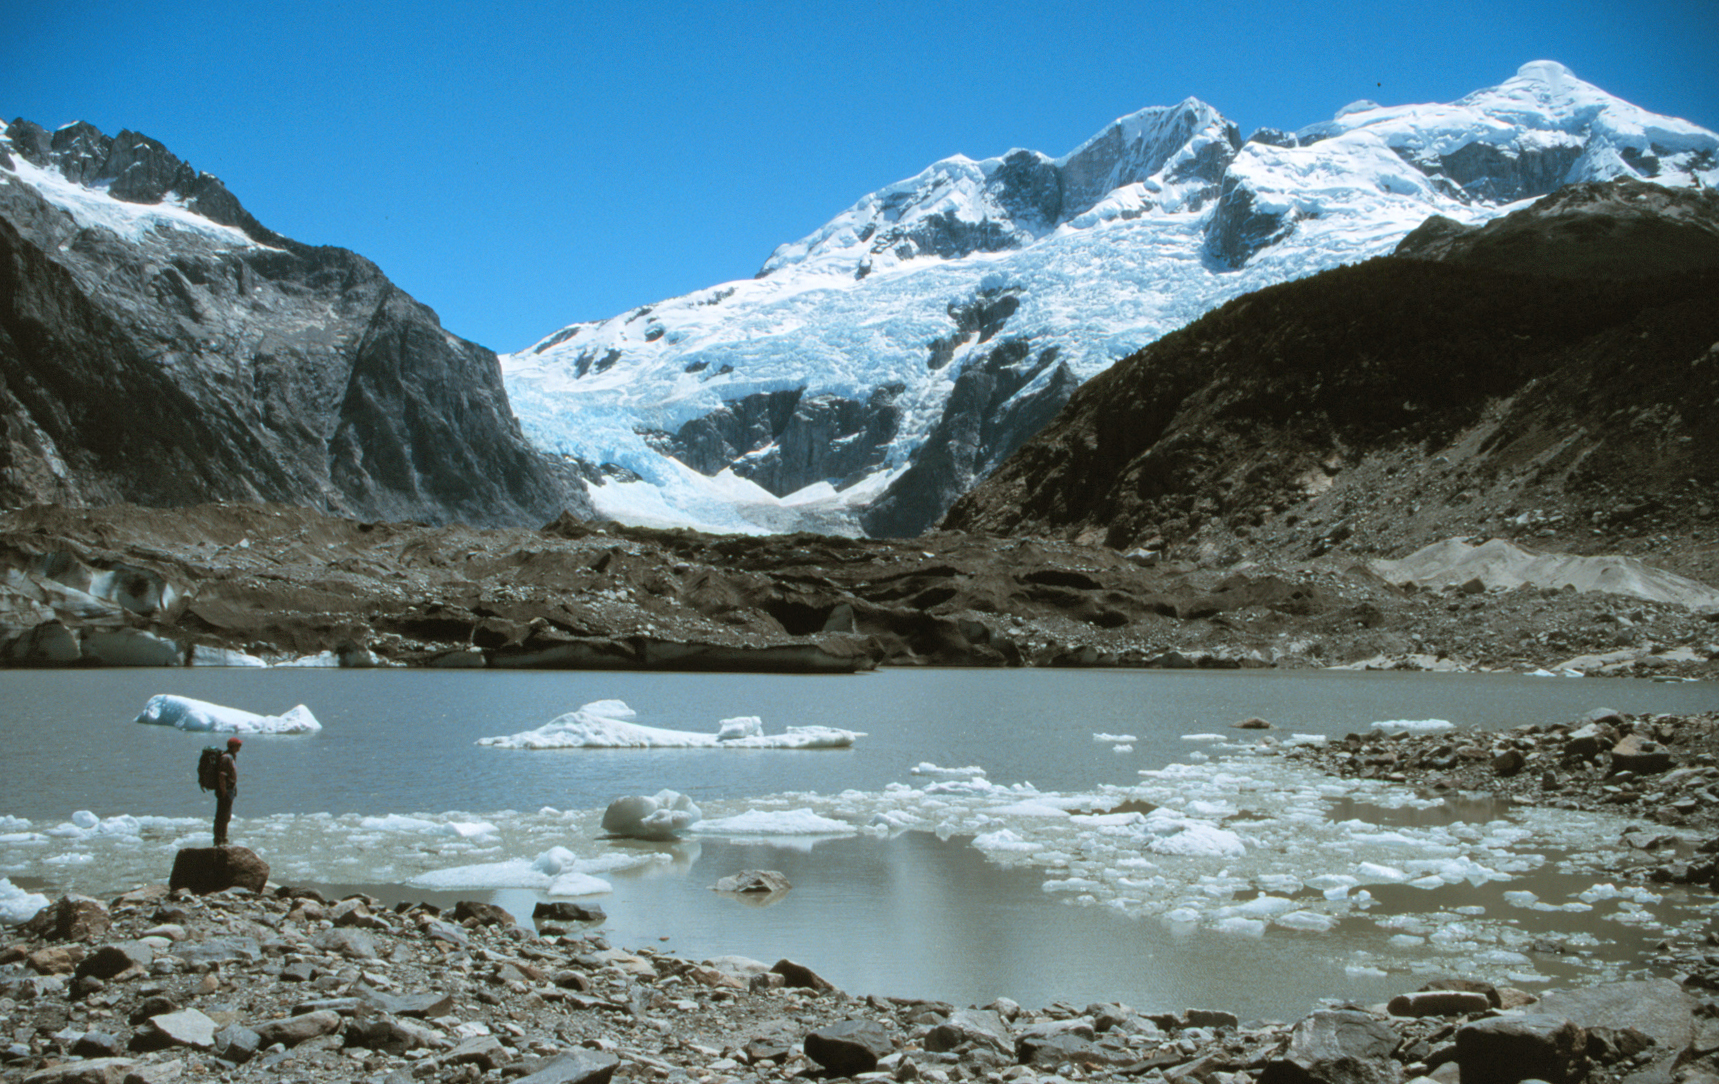
Mike Hambrey Photograph of Soler Glacier in  2000, illustrating narrow nature of the proglacial lake.


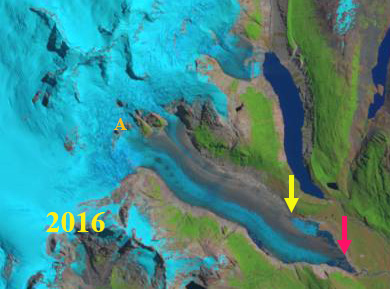
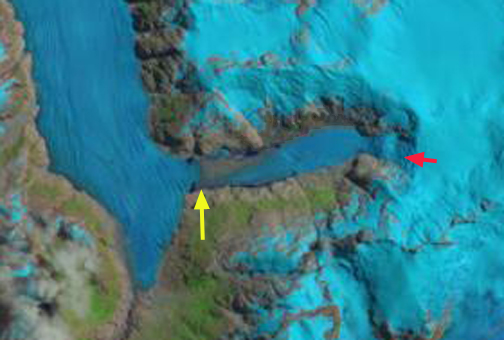
Soler Glacier in 2016 Landsat image.  Red arrow indicates 1987 terminus location, yellow arrow indicates 2020 terminus location on north side of glacier. Lake area is still limited.


Downwasting Tributary-Glacier Dammed Lake Formation at HPN4 Glacier, Patagonia, Chile

We often are more concerned with what is happening at the terminus of a glacier; however, often key changes are happening up glacier some distance. This is the case with the following example. The Northern Patagonia Icefield (Hielo Patagónico Norte, HPN) is one of the two main icefields in Patagonia.  The remoteness of the region is evidenced by the number of significant lakes and glaciers that remain unnamed.  This remoteness has led to several valuable detailed recent studies utilizing satellite imagery on glacier extent (Davies and Glasser, 2012), glacier thickness change (Willis et al, 2012) and glacier velocity (Mouginot and Rignot, 2015)  Here we focus on a downwasting tributary to an unnamed glacier listed as HPN4 Glacier  in the aforementioned studies. Davies and Glasser, (2012)  identify this region of the icefield as retreating faster from 2001-2011 than during any measured period since 1870.    Willis et al, (2012) in their Figure 2, seen below,  identify this an area of pronounced thinning, approximately 5 m/year from 2000 to 2011. Why such rapid thinning in an area without calving?   Mouginot and Rignot, (2015) indicate that this area is not an area of rapid flow, and given the thinning it should be an area of diminishing flow.  Here we examine changes from 1987 to 2014 using Landsat imagery.

HPN4-map

Digital Globe image of southern section of Northern Patagonia Icefield, with black arrow indicating downwasting tributary from the east flowing into HPN4 Glacier.

npi thinning

Figure 2 from Willis et al (2012) indicating thinning of NPI glaciers from 2000-2011, the blue arrow indicates the downwasting tributary of interest flowing into HPN4 Glacier from the east.

hpn4 flow

Ice Flow direction for HPN4 Glacier and the downwasting tributary (DT).   The flow diagram above indicates the converging flow of the downwasting tributary and HPN4, that meet at the medial moraine.

In 1987 there are five contributing glacier tongues to the downwasting tributary, each indicated with a red arrow.  It is like a bathtub being filled with five taps at once.  The yellow arrow indicates a medial moraine at the mouth of the valley, signalling the lack of current contribution of the downwasting tributary to HPN4 Glacier.  By 2004 only three of the contributing glacier tongues still merged with the downwasting tributary, and two of these are much more tentative.  The medial moraine has shifted east indicating that the main HPN4 Glacier is now flowing into the valley instead of the downwasting tributary being a contributing tributary to HPN4.  By 2014 there is only one contributing glacier tongue to the downwasting tributary, only one tap for this draining bathtub, the other four contributing tongues have retreated from contact with the downwasting tributary.  The medial moraine has spread eastward and some fringing proglacial/subglacial lakes are evident.  In 2015 the only change is that the rifting near the medial moraine is more pronounced.  A closeup 2013 Digital Globe image indicates both fringing ponds-blue arrows, rifts caused by varying flotation-green arrows and expanding supraglacial ponds, red arrows.  The rifts are a sign of instability and typically lead to break up of  this portion of the terminus. The downwasting tributary continues to demise faster than HPN4 Glacier, which crosses the valley mouth, hence it is likely that a glacier dammed lake will form and that HPN4 Glacier will continue to flow further east up this valley, which could offset some of the downwasting and lake development.  In either case this redirected flow of HPN4 into a high ablation valley, will help encourage a faster retreat of the main terminus. How large the lakes gets and how much of the time it is filled are difficult to speculate upon.  Analogs for this type of lake are seen at. Allemania Glacier (Lago Martinic) and Baird Glacier (Witches Cauldron) .  Schaefer et al (2013) discuss the HPN4 Glacier because the main terminus has changed little given its modelled mass balance, and the modelled mass balance to the east appears too negative, which they suggest indicates wind redistribution from the HPN4 to the Pared Sud Glacier just east.  That is a challenge to sort out without some ground truth.

hpn-4 1987

1987 Landsat image

hpn-4 2004

2004 Landsat image

hpn-4 2014

2014 Landsat image-not the fringing blue indicating trapped sub-glacial/proglacial lake.

hpn-4 2015

2015 Landsat image

hpn4-ge


Google Earth image 2013

Reichert Glacier Rapid Retreat, Northern Patagonia Icefield, Chile

Reichert Glacier (Reicher) is at the northwest corner of the North Patagonia Icefield (NPI) and flows west from the Mont Saint Valentin region and ends in the expanding Reicher Lake. Rivera et al (2007) notes that the glacier was named for French geologist Federico Reichert, but that Reicher has ended up as the established spelling. They further note that the glacier lost 4.2 square kilometers of area from 1979 to 2001 and had an ELA of 1330 m. The glacier has two main icefalls, one at the first bend in the glacier above the terminus at 400 m, the second at the ELA from 1100-1600 m. Davies and Glasser (2012) identify the most rapid area loss of -0.77% per year to the 1986-2001 period. The glacier retreated rapidly from 1987-1997, but the terminus was stabilized from 1997-2001, before retreating again to near the 2014 terminus by 2002.
reicher glacier ge 2013
2013 Google Earth image
Here we examine Landsat imagery from 1986, 1997 and 2014 to document the changes. The pink arrow indicates the 1987, terminus, the yellow arrow the 1998 terminus and the red arrow the 2014 terminus. In 1987 the glacier terminates close to the southern end of Reicher Lake, pink arrow. By 1998 the glacier has retreated to the yellow arrow and is terminating on the west side of Reicher Lake across the lake from the main glacier valley. By 2014 the glacier has retreated into the main glacier valley and Reicher Lake extends 8.8 km from the northeast to southwest. A new lake has developed in 2014 above the first icefall, orange arrow. This lake indicates a potential second lake basin beginning to develop in the glacier reach above the first icefall. If this is the case another rapid retreat will ensue, though not in the immediate future. The glacier retreated 6.7 km from 1987 to 2014, with 90% of the retreat occuring by 2002. Area extent loss is 8-9 square kilometers. The lower icefall is 1.5 km from the current terminus, and indicates the maximum extent of Reicher lake and the retreat that can be enhanced by calving into that lake. This glacier has followed the pattern of the neighboring Gualas Glacier just to its south. WHOI-Oceanus recently published an interesting article on this glacier. The retreat is emblematic of the entire NPI as noted by both Rivera et al (2007) and Davies and Glasser (2012) work, the latter had an excellent Figure 8 indicating two periods of fastest recession since 1870, are 1975-1986 and 2001-2011 for NPI glaciers. This retreat includes that of Steffen Glacier, Nef Glacier, and Colonia Glacier.

reicher  glacier 1897
1987 Landsat image

reicher glacier 1998
1998 Landsat image

reicher glacier 2014
2014 Landsat image

Glaciar Gualas Retreat lake expansion, Patagonia, Chile

Glaciar Gualas drains from the northwest portion of the Northern Patagonia Icefield (NPI) into a rapidly expanding new lake Laguna Gualas. There is a spectacular icefall (I) where the glacier descends from the main NPI from 1600 m to 900 m, which is below the equilibrium line. Below this point the Gualas has a 2 km wide, 15 km long valley reach extending to the terminus which currently has a substantial calving face into Laguna Gualas (A-B). Point M inidcates an area of substantial moraine cover on the ice, that will with continued retreat be a likely location for a new lake to form, much as the periodic lake at Point C. Lopez and Cassasa (2011) have documented a 1.8 km retreat from 2001-2011 of this glacier, updating and expanding on the work of Rivera et al (2007). This is part of the ongoing inventory of Chilean glacier and the NPI, that is being undetaken by the Laboratory of Glaciology at the Centre for Engineering Innovation CECS (CIN), Valdivia, Chile. This project has built on initial joint work with Glacier and Cryospheric Environment Research Laboratory in Japan and now with NASA-JPL as well. The Japan Aerospace Exploration Agency with Glacier and Cryospheric Environment Research Laboratory published a comparison of selected NPI glacier retreats. Here we compare Landsat satellite images of the glacier from 1987, 2001, 2005 and 2011 illustrating the retreat that Lopez and Casassa (2011) have chronicled. They have further noted an average thinning of the valley tongue of 2.1 meters per year from 1975-2005 and a doubling in the rate of area lost, 2.8 square kilometers, from 2001-2011 versus 1975-2001. In 1987 the glacier essentially fills the lake basin, margin is indicated with pink dots. By 2001 an evident fringe of water separates the glacier from the lake margin on all but the eastern side of the lake. In 2005 the margin is hard to discern given the extensive floating icebergs in the lake. By 2011 the lake is evident and the glacier has retreated 2.2 km from its 1987 position. There is little additional change from 2011 to 2014. This retreat is like those of other NPI glaciers such as, Reichert Glacier, Steffen Glacier, Nef Glacier, and Colonia Glacier.
1987 Landsat image

2001 Landsat image

2005 Landsat image
gualas glacier 2014
2014 Landsat image

The glacier surface is steep in the first kilometer behind the terminus, indicating a rising bedrock under the glacier. Then the glacier has a very modest slope for the next 14 km. As long as the glacier can calve into a lake, this will enhance retreat. The current lake may not end at the bedrock step just behind the current terminus. However, even if this occurs the low slope above that point indicates another basin that will have sufficient depth to form a second lake basin. It is unlikely that the calving retreat of this glacier will have more than a temporary interruption. In the annotated Google Earth view below the approximate elevations along the glacier are listed. What is of particular interest is the 2.1 meter per year thinning on the lower glacier has occurred while on the upper glacier there is a small amount thickening (Rivera et al;, 2007). This implies the retreat is driven by enhanced melting due to warming, since the only way to thicken the glacier in the accumulation zone is via increased snowfall.