Chako Glacier, Tibet Retreats From Proglacial Lake

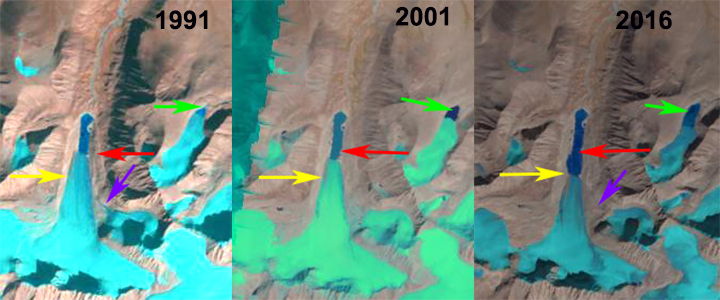
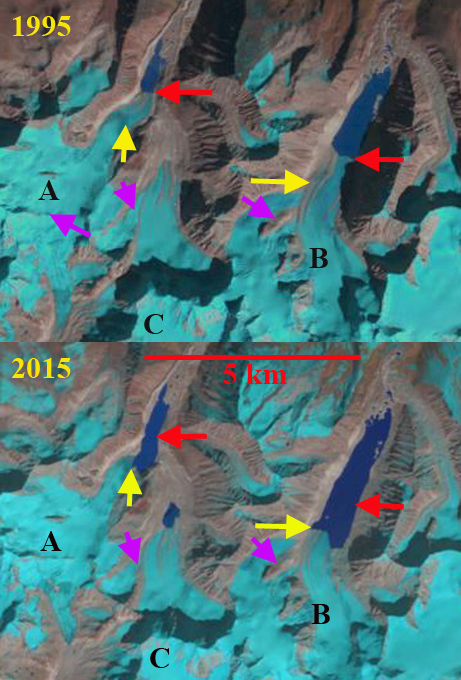
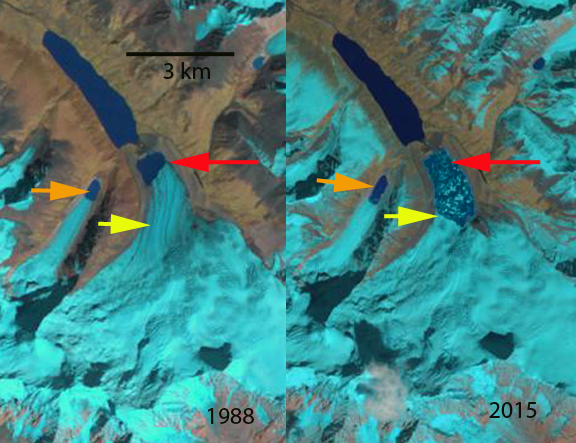
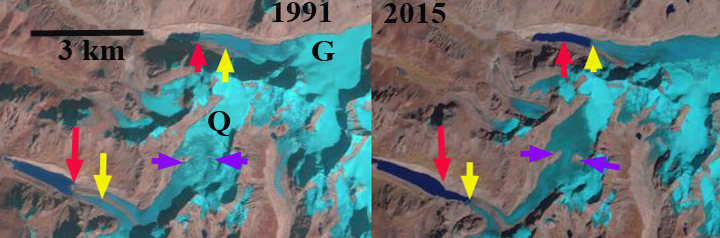
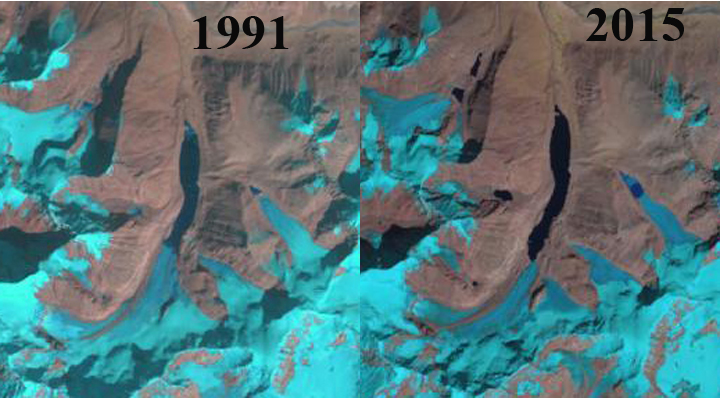
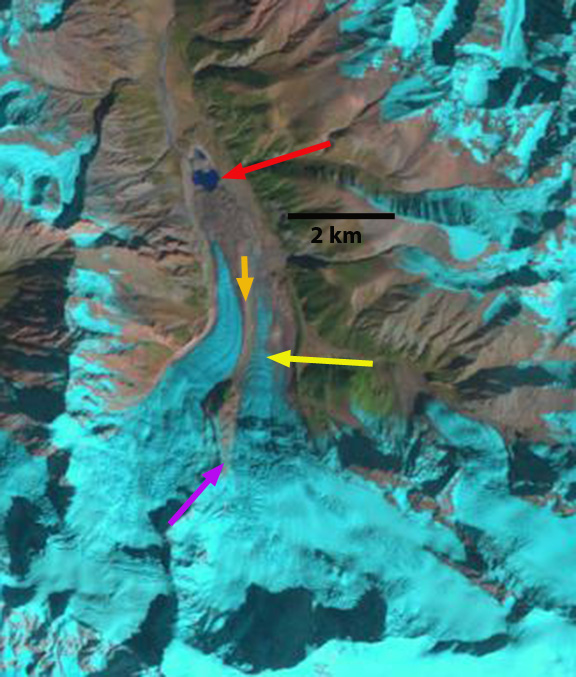
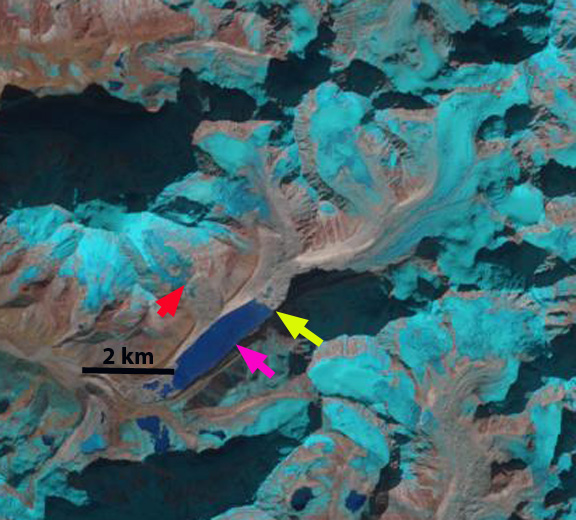
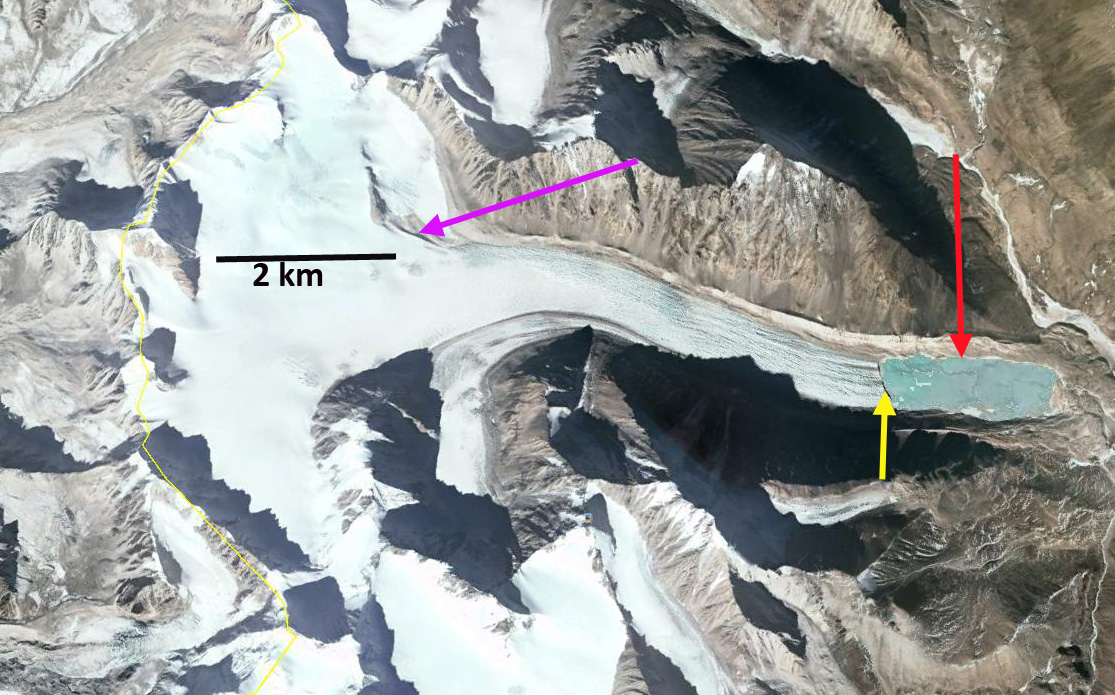
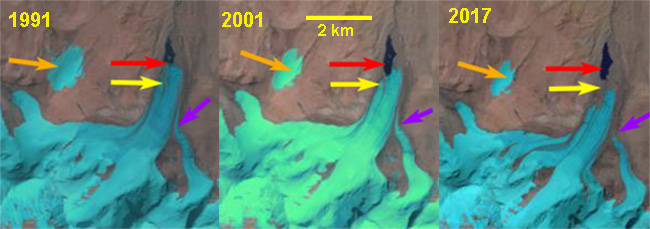
Chako Glacier, Tibet in Landsat images from 1991, 2001 and 2017.  Red arrow indicates 1991 terminus, yellow arrow 2017 terminus, purple tributary glacier connection and orange arrow nearby icecap.

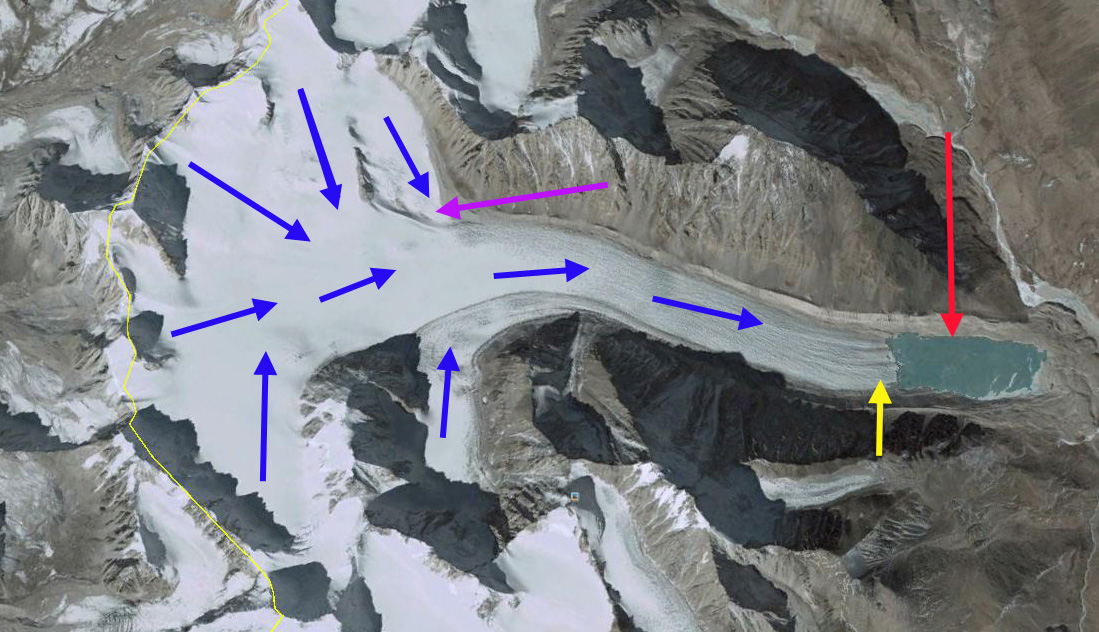
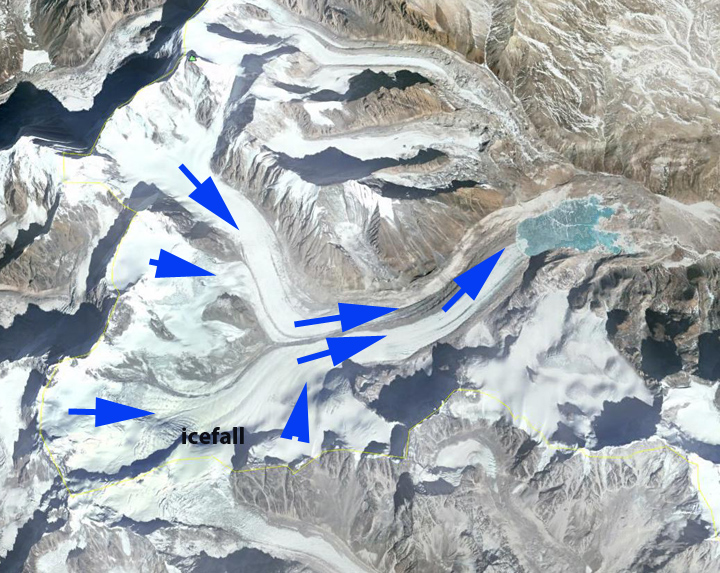
Chako Glacier flows north from Chako Peak on the Nepal-Tibet, China border, in the Lugula Himal.  Glacier runoff eventually reaches the Yarlung Tsangpo and then the Brahmaputra River. Gardelle et al, (2013) identified this glacier as part of their West Nepal region, which experienced mass loss averaging -0.32 m/year from 1999-2011. This mass loss has driven wide spread retreat of glaciers along the border ranges between India/Nepal and Tibet.  In Tibet west and east of Chako Glacier are the retreating Menlung Glacier, West Ganglung Glacier and Chutenjima Glacier.

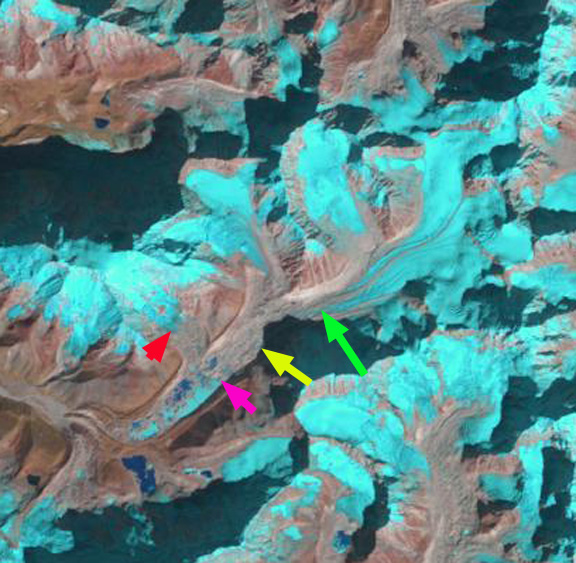
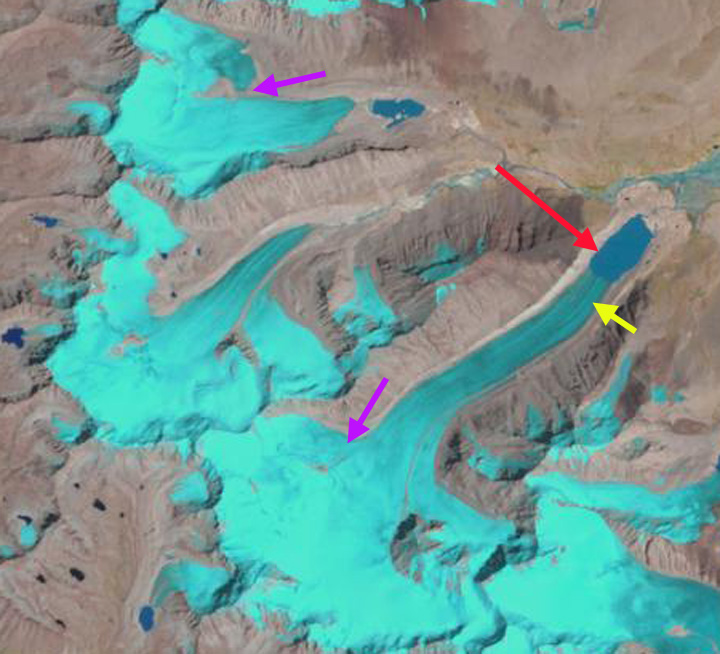
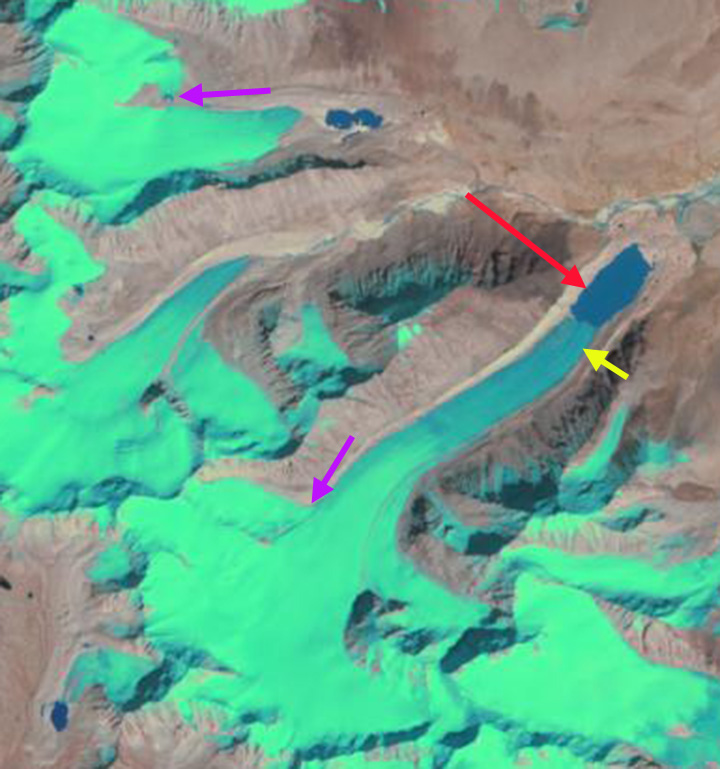
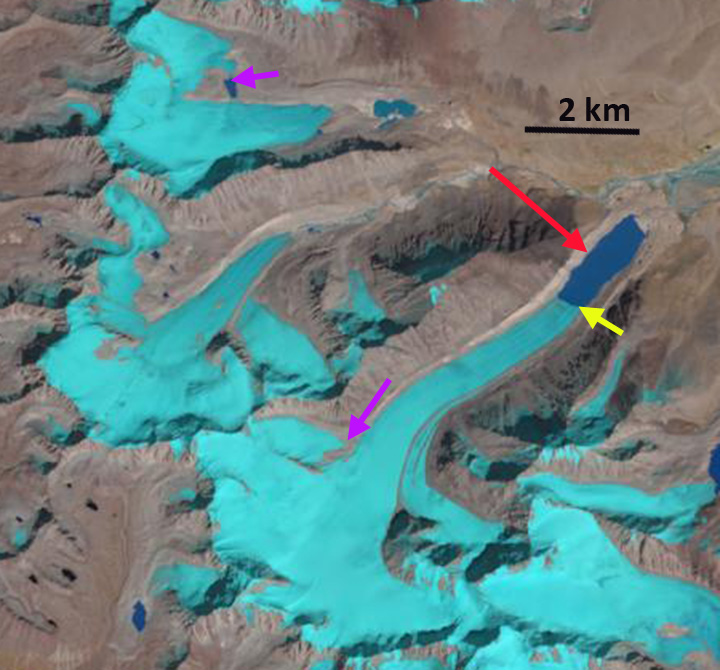
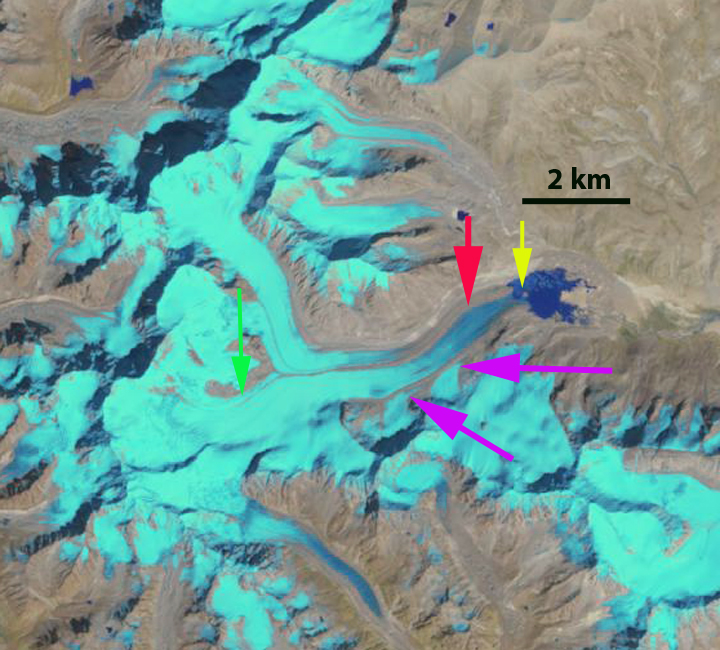
In 1991 the glacier terminated in a proglacial lake at 5450 m red arrow, with a key tributary entering from the east, purple arrow. An ice cap just west of the glacier has a width of 700 m. In 1994 there is little evident change. By 2001 the glacier has retreated to the southern end of the lake basin, with the eastern tributary still connected.  In 2005 the terminus remains heavily crevassed and still in contact with the lake.  By 2016 the eastern tributary no longer connected with Chako Glacier and the glacier no longer reaches the lake.  In 2017 the glacier has retreated 600-700 m since 1991 with limited crevassing at the terminus.  The terminus is notably thinner as well.  The loss of crevassing and connection with the tributary from the east indicates retreat is ongoing. The icecap to the west has been reduced in area, the width being 450 m in 2017. The images are typically from September-November and do not show the snowline at the highest elevation. The expansion of three bedrock areas separating tributaries and generating lateral moraines indicate upglacier thinning as well.


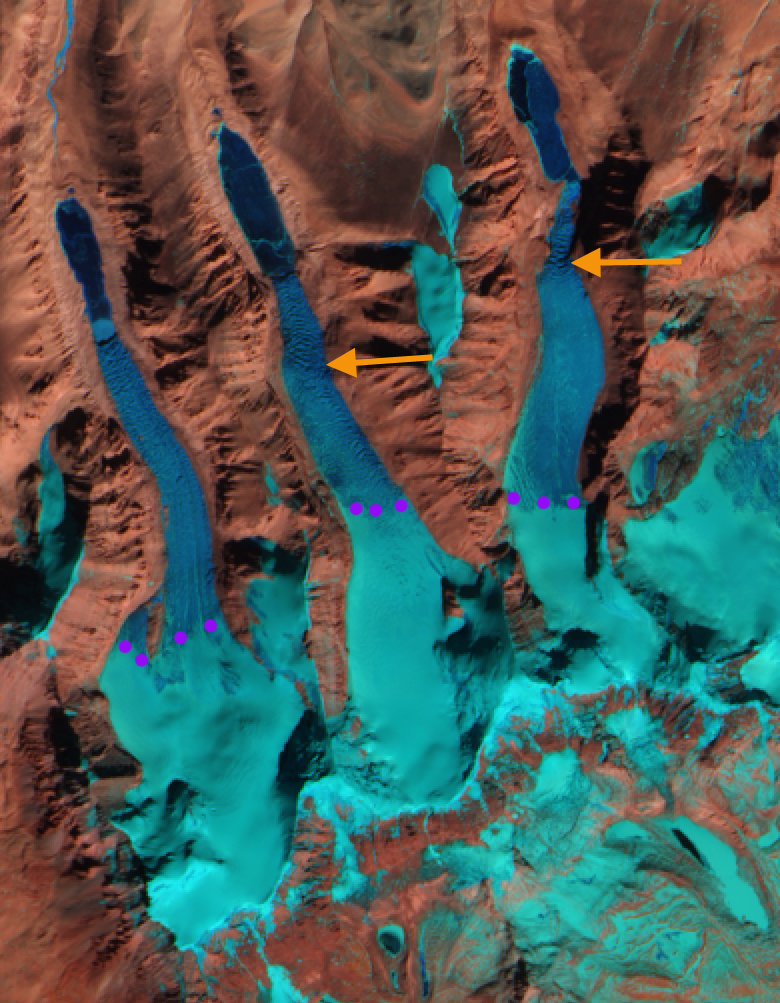
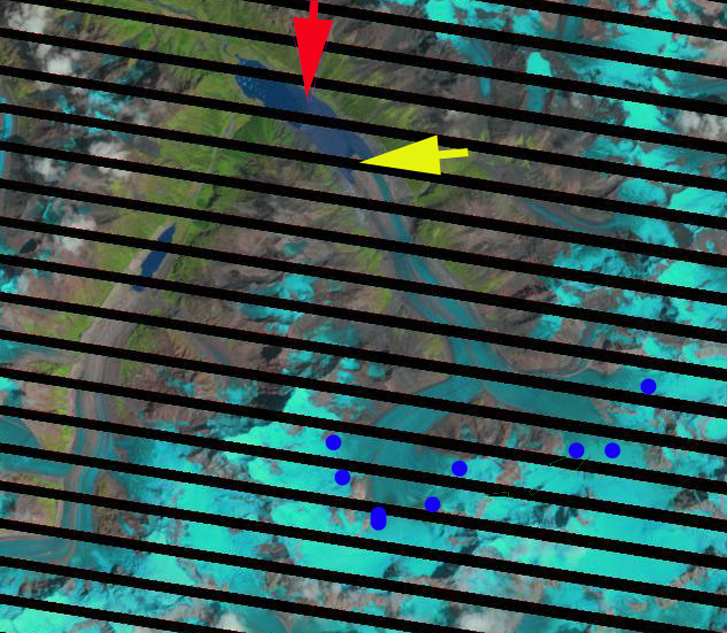
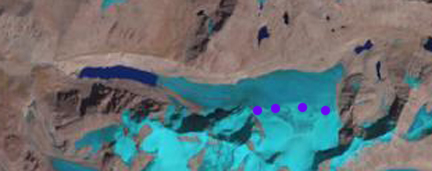
Chako Glacier, Tibet in Landsat images from 1994 and 2016.  Red arrow indicates 1991 terminus, yellow arrow 2017 terminus, purple tributary glacier connection and orange arrow nearby icecap.

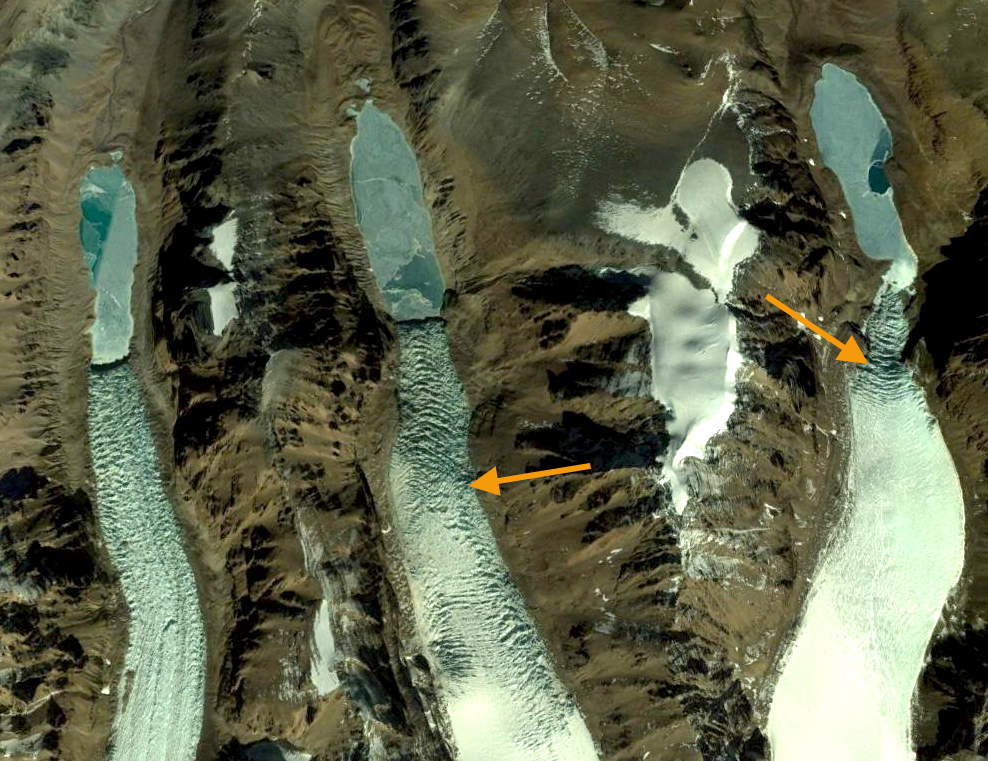
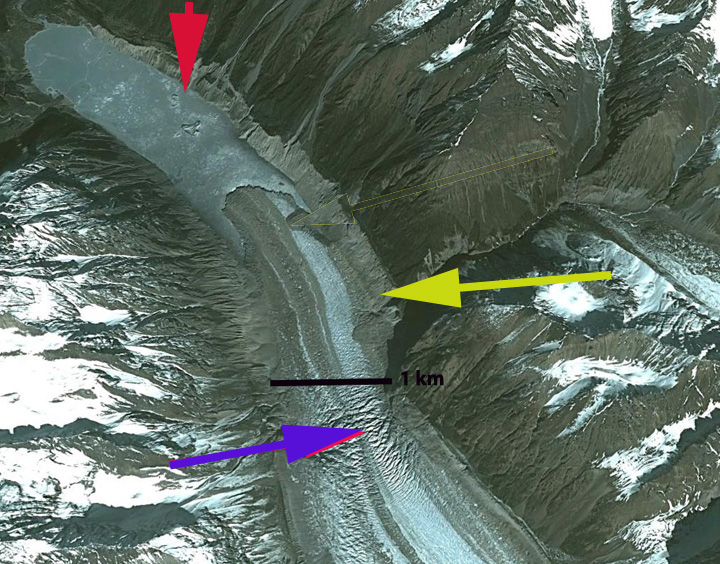
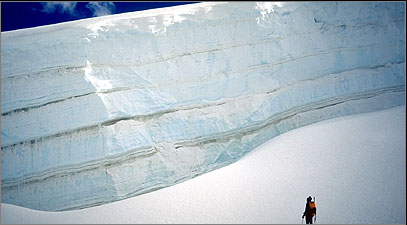
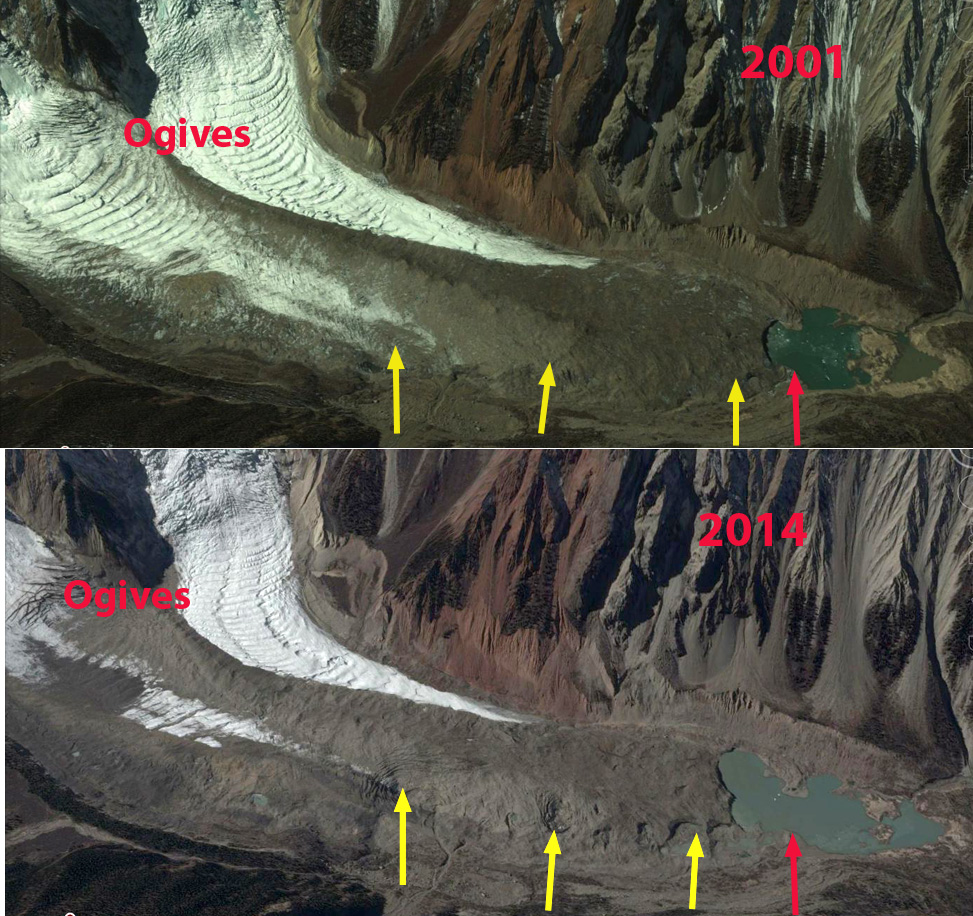
Google Earth image of Chako Galcier terminus in 2005 and 2017.  Note difference in crevassing.  red arrow 2005 terminus and yellow arrow 2017 terminus.

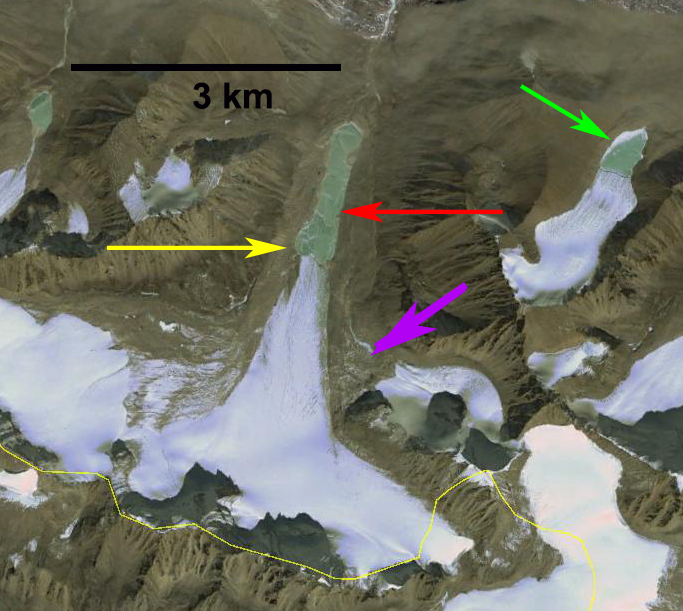
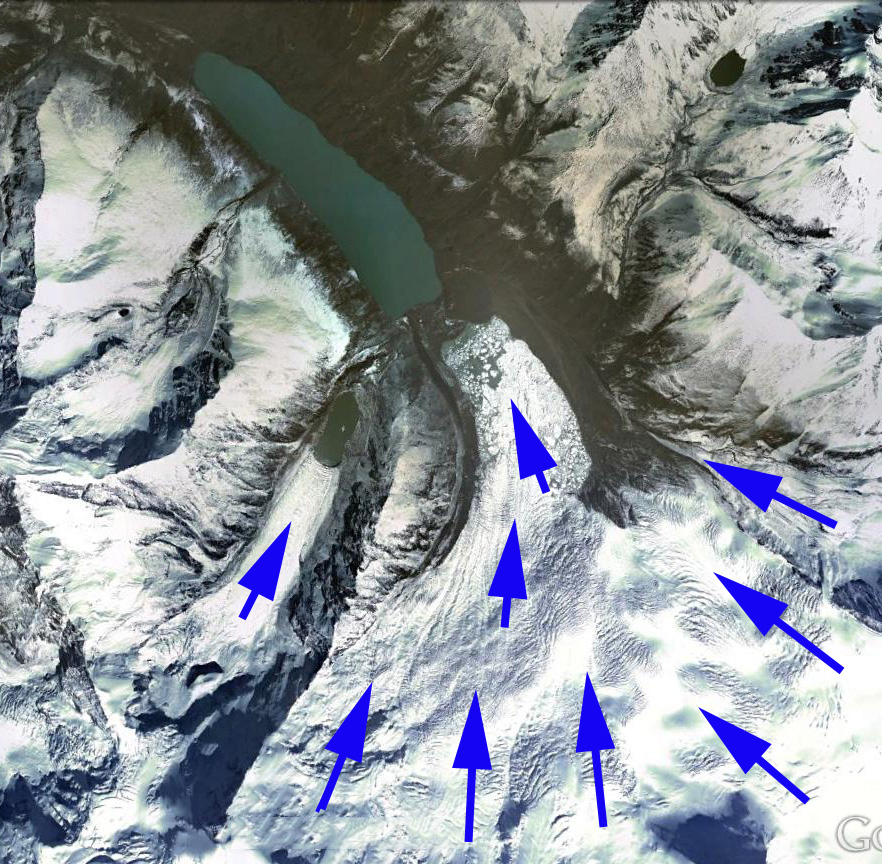
Chako Glacier, with Chako Peak indicated by green triangle.

West Ganglung Glacier, Tibet Glacier Loses 20% of Length

Landsat image comparison from 1991, 2001 and 2016 of West Ganglung Glacier, red arrow is the 1991 terminus, yellow arrow the 2016 terminus, green arrow the eastern glacier proglacial terminus lake and purple arrow expanding zone between a former tributary and West Ganglung Glacier

West Ganglung Glacier is on the China-India border 6 km west of Ganglun Grangri Peak meltwater enters the Sultej River and then Mapam Tso.  the glacier terminates in a proglacial lake at 5200 m with its head on the border at 5750 m. This region is part of the Indus Basin, the second China glacier inventory noted a 23% decline in glacier area from 1970 to 2007 (Guo et al 2015) Assessing the sensitivity of the Sutlej River basin to climate change Miller et al (2012) noted that with a warmer climate melt contributions from lower parts are reduced because of decreased snow cover and a shorter melting season.  Significant glacier area loss will also lead to less runoff despite an increase in rate. Singh et al (2012) noted a decline in runoff from the Sutlej basin after 2000, whereas there had been a rise before that. 

Here we examine teh unnamed West Ganglung Glacier change from 1991 to 2016 in a series of Landsat images. In 1991 the glacier terminates at the red arrow, and the lake is 1050 m long. At the glacier just to the east there is a small proglacial lake 200 m long. By 2001 glacier retreat had led to lake expansion to 1400 m long. The proglacial lake at the end of the eastern glacier is now 350 m long. By 2016 the proglacial lake at the terminus had expanded to a length of 1850 m, a retreat of 800 m in 27 years.  The proglacial lake at the terminus of the eastern glacier in 2016 is 650 m long, indicating a retreat of 450 m.  In both case the retreat is a significant loss of overall glacier length, ~20%.  The purple arrow indicates the increasing separation between a tributary and the West Ganglung Glacier glacier.

Google Earth image of West Ganglung Glacier, red arrow is the 1991 terminus, yellow arrow the 2016 terminus, green arrow the eastern glacier proglacil terminus lake and purple arrow expanding zone between a former tributary and West Ganglung Glacier


Landsat image from2014 of West Ganglung Glacier, red arrow is the 1991 terminus, yellow arrow the 2016 terminus, and green arrow the eastern glacier proglacial terminus lake.

Chutanjima Glacier Retreat & High Snowline, Tibet, China 1991-2015

mugunong glacier tibet compare

A comparison of three Tibet glaciers in 1988, 1991 and 2015 Landsat images. Red arrows are the 1988 terminus position, yellow arrow the 2015 terminus location and purple dots the snowline in late October 2015.  U=unnamed, CH=Chutanjima Glacier and MO=Mogunong Glacier: which did not retreat significantly and lacks a red arrow.

A recent European Space Agency Sentinel-2A image of southern Tibet, China and Sikkim illustrated three very similar glaciers extending north from the Himalayan divide on the China-India Border. We examine these three glacier in this post. The three glaciers all drain into the Pumqu River basin, which becomes the Arun River. The largest is unnamed the two easternmost are Chutanjima and Mogunong Glacier.The glaciers all have similar top elevations of 6100 -6200 m and terminus elevations of 5260-5280 m.  All three are summer accumulation type glaciers with most of the snow accumulating during the summer monsoon, though this is also the dominant melt period on the lower glacier.  Wang et al (2015) examined moraine dammed glacier lakes in Tibet and those that posed a hazard, none of the three here were identified as hazardous.  The number of glacier lakes in the Pumqu Basin has increased from 199 to 254 since the 1970’s with less than 10% deemed dangerous, but that still leaves a substantial and growing number (Che et al, 2014). Here we compare Landsat images from 1988, 1992  and 2015 to identify their response to climate change.   The second Chinese Glacier inventory (Wei et al. 2014) indicated a 21% loss in glacier area in this region from 1970 to 2009.The pattern of retreat and lake expansion is quite common as is evidenced by other area glaciers, such as Gelhaipuco, Thong Wuk, Baillang Glacier and Longbashaba Glacier.

In the 1988 image all three glaciers terminate at the southern end of a proglacial lake with seasonal lake ice cover, red arrows.  In 1991 the lakes are ice free and have some icebergs in them.  By 2015 the retreat has been 500 m for the easternmost glacier, 400 m for Chutanjima Glacier and 100 m at most for Mogunong Glacier. Each glacier has remained extensively crevassed to the terminus indicating they remain vigorous.  The retreat is greatest for the two ending in expanding lakes.  Mogunong Glacier appears to be near the upper limit of the lake, and is not calving, which likely led to less retreat. An icefall is apparent 700 m from the front of Mogunong Glacier.  The width of the glacier below this point has diminished considerably from 1988 to 2015, though retreat has been minor, indicating a negative mass balance.  There is an icefall 1 km from the icefront of Chutanjima, indicating the maximum length the lake would reach.

The Sentinel image indicates an important characteristic and trend in the region.  This is an early February image and the snowline is quite high on the glacier in the midst of winter.  The snowline is at 5850-5900 m nearly the same elevation as in late October of 2015 seen above. This illustrates the lack of winter accumulation that occurs on these summer accumulation glaciers.  It also indicates a trend toward ablation processes remaining active, though limited from November-February.  The lack of snowcover on the lower glaciers as the melt season begins hastens ablation zone thinning, mass balance loss and retreat.

mugunong glacier 2016

Europenan Space Agency, Sentinel-2A image from 1 February 2016. Orange arrow indicates icefalls and purple dots the snowline.

mogunong ge
2014 Google Earth image of the region. Orange arrows indicate icefalls, note the crevassing extending to glacier front.

Bailang Glacier and Angge Glacier Retreat, China 1995-2015

bailang compare

Comparison of 1995 and 2015 Landsat image illustrating 1995 (red arrows) and 2015 terminus locations (yellow arrows) of Bailang Glacier (B) and Angge Glacier (A).  Purple arrows indicate areas upglacier of expanding bedrock due to glacier thinning. Head of Chubda Glacier (C), Bhutan indicated. 

Bailang Glacier and Angge Glacier, China are adjacent to the Chubda Glacier, Bhutan.  Despite being in a different nation on a different side of the Himalaya, the behavior is the same. These are both summer accumulation type glaciers that end in proglacial lakes.  Both lakes are impounded by broad moraines that show no sign of instability for a potential glacier lake outburst flood. The number of glacier lakes in the adjacent Pumqu Basin to the west has increased from 199 to 254 since the 1970’s with less than 10% deemed dangerous  (Che et al, 2014) Here we compare Landsat images from 1995 and 2015 to identify their response to climate change.   The second Chinese Glacier inventory (Wei et al. 2014) indicated a 21% loss in glacier area in this region from 1970 to 2009.

Bailang Glacier in 1995 terminated in a proglacial lake that was 2.1 km long at an elevation of ~5170 m, red arrow. Angge Glacier terminated in a lake that was 1 km long at an elevation of ~5020 m.  By 2001 both glaciers had experienced minor retreat of less than 250 m.  By 2014 both lakes had expanded considerably due to retreat, no significant change in water level had occurred. By 2015 Bailang Glacier had retreated  800-900 m and the lake was now 3 km long.  A key tributary on the west side near the yellow arrow had also detached. There is no significant slope change in the lower 1 km of the glacier indicating retreat should continue enhanced by melting in and calving in the proglacial lake.  For Angge Glacier retreat from 1995 to 2015 was 700 to 800 m, with the glacier retreating to a westward bend in the lake basin.  The glacier has an icefall just above the current terminus suggesting the lake basin will soon end, which should slow retreat. The pattern of retreat and lake expansion is quite common as is evidence by Gelhaipuco, Thong Wuk and Longbashaba Glacier.

bailang glacier 2001

2001 Landsat image illustrating 1995 (red arrows) and 2015 terminus locations (yellow arrows) of Bailang Glacier (B) and Angge Glacier (A).  Head of Chubda Glacier (C), Bhutan indicated. 

bailang glacier 2014

2014 Landsat image illustrating 1995 (red arrows) and 2015 terminus locations (yellow arrows) of Bailang Glacier (B) and Angge Glacier (A).  Head of Chubda Glacier (C), Bhutan indicated. 


Jiongla Glacier, China Rapid Retreat 1988-2015

jionla compare

Jiongla Glacier retreat right and Jiangyegong Glacier left retreat from 1988 to 2015 in Landsat images.  The red arrow is the 1988 terminus and the yellow arrow the 2015 terminus. Jiongla Glacier retreated 3200 m and Jiangyegong Glacier 800 m. 

Jiongla Glacier is at the northern boundary of the Brahmaputra River Basin at the east end of the Nyainqentanglha Shan. The glacier drains the western slopes of Koma Kangri Peak and ends in a lake before feeding into the Parlung Zangbo and then Yarlung Tsanpo. his glacier feeds the Parlung Zangbo which is the site of numerous planned hydropower projects, last image, before joining the Yarlung Tsanpo which becomes the Brahmaputra River. The Zangmu Dam went online in 2015, this hydropower facility will produce 2.5 billion kilowatt-hours of electricity a year. In a study by Tobias Bolch et al (2010) in the western Nyainqêntanglha Mountains glacier area decreased by 6% between 1976 and 2001 and continued to shrink from 2001–2009. Li et al (2010) examined glacier change over the last several decades in China and found ubiquitous glacier retreat and commonly lake formation as glaciers retreated. Ninglian and Shichang (2014) in the China National Report on Cryospheric Sciences noted a loss in glacier area of 15 to 17 % in the region. Here we examine satellite imagery from 1988, 2000, 2009, 2010, 2011 and 2015. The red arrow denotes the 1988 terminus and the yellow arrow the 2011 terminus.

In 1988 the lake where Jiongla Glacier ends is at 2 km long. By 2000 the glacier has retreated 1300 meters. In the 2003 terminus closeup that indicates vigorous flow through an icefall, purple arrow, 2 km behind the terminus. This indicates the lake will end before this point and the glacier does not have a substantial stagnant terminus tongue. By 2011 the lake is 4 km long, a 2 km retreat in 20 years. There are icebergs visible in the lake particularly in the 2003, 2009 and 2011 images indicating that this one a key reason for rapid recent retreat. In reviewing the satellite images for the region cloud cover made it difficult to find imagery near the end of the melt season. By 2015 the lake is 5200 m long indicating a 3200 m retreat from 1988-2015.  The terminus is now within 500 of the increase in surface slope that suggests the end of the lake, and likely the end of the current rapid retreat. The 2011 image is from near the end of the melt season and indicates a snowline at 5150 m, blue dots, this is too high for equilibrium, with limited glacier area above 5500 m and the terminus at 4000 meters. This suggests that retreat will continue.   The retreat here is similar to that of Thong Wuk Glacier and Requiang Glacier.

The neighboring Jiangyegong Glacier has experienced an 800 m retreat from 1988 to 2015.  This terminus remains low slopes and heavily debris covered. The debris will slow the retreat, while the low slope indicates the lake can continue to expand enhancing retreat.  This also suggests the rate of retreat will soon slow.T
jiongla2000

Landsat image 2000 with the yellow arrow indicating the 2011 terminus position and the red arrow the 1988 terminus position.

jiongla terminus2003 Google Earth Image

jiongla 2011

Landsat image 2011 with the yellow arrow indicating the 2011 terminus position and the red arrow the 1988 terminus position.


Yarlung Tsangpo HPP

Hydropower dams completed, under construction and proposed. 


Thong Wuk Glacier Terminus Tongue Collapse, China

sepu compare

Thong Wuk Glacier  comparison in 1988 and 2015 Landsat image.  Red arrow is the 1988 terminus location, yellow arrow the 2015 terminus location and orange arrow indicates expanding lake of Yanglang Glacier. 

There are two glaciers that drain the north side of Sepu Kangri Peak in the Eastern Nyainqêntanglha Mountains of Tibet in China. Thong Wuk to the east and Yanglang Galcier to the west. Most of the peaks in East Nyainqêntanglha Mountains are unclimbed, Sepu Kangri the highest peak was not climbed until 2002. The Sepu Kangri glaciers drain into the Salween River. In a study by Tobias Bolch et al (2010) in the western Nyainqêntanglha Mountains glacier area decreased by 6% between 1976 and 2001 and continued to shrink during the period 2001–2009. Li et al (2010) examined glacier change over the last several decades in China and found ubiquitous glacier retreat and commonly lake formation as glaciers retreated.

In this case we compare Landsat images from 1988, 2003, 2010 and 2015 and Google Earth images from 2011. In 1988 the lake at the end of the two glaciers are both 500-700 m long.  By 2003 there is limited terminus change for the eastern side of the Thong Wuk terminus and the western side of the terminus has retreated 200 meters. By 2010 the terminus tongue is breaking up with many icebergs filling the lake. In 2011 the lake has expanded from a length of 600 meters in 1988 to 1300 meters.  A closeup view in Google Earth of the eastern tongue indicates that this narrow tongue is not stable and the lake will lake quickly develop to an area of 1.7 km long and 0.8 km wide.  In 2015 the glacier has retreated 1050 m since 1988, and the lake has an area of 2.4 square kilometers. Based on an increase in surface slope 500 m from the current terminus the lake will not expand more than this. This glacier remains heavily crevassed and has a vigorous accumulation zone indicating that it is not in danger of disappearing with current climate. In fact images from the first ascent of Sepu Kangri in 2002 indicate the annual layering in a crevasse, illustrating the considerable accumulation. The formation of lakes at the end of the glaciers as they retreat is quite common, including in the Tibetan glaciers.

sepu 2003-2010

Thong Wuk Glacier  comparison in 2003 and 2010 Landsat image.  Red arrow is the 2003 terminus location and orange arrow indicates expanding lake of Yanglang Glacier. 

sepu kangri 2011

2011 Google Earth image.  Note the heavy crevassing indicating considerable accumulation and flow.

sepu kangri tongue

2011 Google Earth image indicatint narrow tongue that has broken up by 2015.

sepu stratigraphy

Crevasse with annual layers on upper Thong Wuk Glacier from the Sepu Kangri Expedition in 2002.


Glacier Retreat expands Gelhaipuco Lake

gelhaipuco compare

Fig. H. Gelhaipuco Glacier (G) and Qangzonkco Glacier (Q) change from 1991 to 2015, red arrow indicates 1991 terminus, yellow arrow 2015 terminus and purple arrow indicates areas of thinning.

Gelhaipuco is a glacier moraine dammed lake at the headwaters of the Natangqu River in the Pumqu Basin, Tibet, China. In 1964 the lake had an outburst flood that resulted in severe damage and economic losses in the Chinese Tibet and downstream in the Arun valley in Nepal. The flood occurred after a heavy rainstorm with the rising lake overtopping and eroding the moraine dam significantly.  Today the water level is lower than the 1964 pre-flood water level. The glacier that ends in it is unnamed, but is referred to here as Gelhaipuco Glacier. Che et al (2014) reports that glaciers in the basin lost 19% of total area since the 1970’s and that the retreat rate increased in the 2001-2013 period.  The number of glacier lakes has increased from 199 to 254 since the 1970’s.  Of these 19 are deemed dangerous including Gelhaipuco (Che et al, 2014) . The lake has an estimated volume of ~25 million cubic meters and is a risk for a glacier outburst flood.The Arun River has a proposed 900 MW hydropower plant under development in Nepal.  In 1991 the glacier terminates at the red arrow in the lake, which was 750 m long. By 2015 glacier retreat had expanded the lake to 1500 m. The glacier retreat of 800 m is occurring in a lake that is maintaining consistent width.  The retreat is fueled by high snowlines such as in 2015, the snowline was at 5800 m, with no retained snowpack across the glacier divide to a separate terminus that flows east.  The terminus reach of the glacier has crevassing within 250 m calving front, indicating the role of iceberg calving.  The glacier lacks crevasses above this point for a kilometer, indicating the limited velocity to support the current level of melting and calving.  retreat will continue and the lake volume will continue to increase in the next decade.  The upvalley lake limit will likely be reached within the next kilometer of retreat.

gelhaipuco dam

Gelhaipuco lake and its unconsolidated moraine dammed lake.  Note the elevation listed near the former shoreline and the current outlet stream.

gelhaipuco 2015

Snowline on Gelhaipuco Glacier in 2015 at purple dots-5800 m.  Note there is no retained accumulation across the glacier divide from the east to west terminus.


Zhizhai Glacier Retreat, Lake Expansion, China

zhishai compare

Fig. H. Zhizhai Glacier change from 1991 to 2015, red arrow indicates 1991 terminus, yellow arrow 2015 terminus and purple arrow indicates areas of thinning. Green arrow indicates another lake growing with glacier retreat.

Located between Longbashaba Glacier and Jimi Glacier, this glacier extends 4.75 km north from the Nepal-China border in the southeast region of the Pumqu River basin.  The moraine dammed glacier lake, Zhuxico Lake, poses some risk to the 23 villages downstream of the lake and the Rongkong Hydropower station. This risk has been examined for another lake in the basin Longashaba by Yao et al (2012). Che et al (2014) report on an inventory of glaciers and glacier lakes in the Pumqu Basin, and note that lake expansion is higher from 2001-2013 than for the 1970-2000 period, posing greater threats for a glacier lake outburst flood. They report that there are 254 glaciers lakes in the basin currently 55 of which have formed since 1970. In 1991 the glacier terminated in a proglacial lake that was 2.25 km long. A tributary flowed around a ridge and rejoined the main glacier, purple arrow.   By 2000 the glacier had retreated 200 m, the tributary at the purple arrow remains connected to the main glacier.  By 2015 the glacier had retreated 600 m and the lake is 2.9 km long and remains 300 m wide.  The tributary at the purple arrow no longer rejoins the main glacier. Just east of Zhizhai Glacier an unnamed glacier also features an expanding lake due to glacier retreat (green arrow).  The retreat follows the pattern of other glaciers in the region that are retreating and having glacier moraine dammed lakes expanding such as Longbashaba Glacier and Lhonak Glacier.

zhizhai glacier 2000

Landsat image 2000

zhizhai 2014

Google Earth Image indicating the flow of the glacier, blue arrows and areas of upglacier thinning, purple arrows. 

1991 to 2015 Comparison
zhizhai change

Midui Glacier, Tibet, China: Retreat and Terminus Collapse 1995-2014

Midui Glacier is 7 km from the G318 National Highway in China and 2 km from Midui village, hence the lake near the terminus is often visited. The glacier is near the headwaters of Yarlung Tsangpo. Glaciers in this region have experienced significant retreat and area loss as noted by the second China Glacier inventory. This compared glacier area from the 1950’s, 2002 and 2010, Liu et al (2013) noted that glacier area has declined 13%. The Midui Glacier was advancing as recently as 1964 when it emplaced an advance moraine (Xu et al, 2012).  This is a region where Li et al (2011) noted that increasing temperature, especially at altitude, the fronts of 32 glaciers have retreated, mass losses of 10 glaciers have been considerable, glacial lakes in six regions have expanded and melt water discharge of four basins has also increased. This is further documented by an inventory of 308 glaciers in the Nam Co Basin, Tibet, where an increased loss of area for the 2001-2009 period, 6% area loss (Bolch et al., 2010) was observed. The nearby Yemayundrung Glacier retreat is similar. Here we examine changes in this glacier using Landsat imagery and Google Earth from 1995-2014.

midui glacier 1995
1995 Landsat image

midui glacier 2014 landsat
2014 Landsat image

In the Landsat images above in 1995 the glacier terminates in a proglacial lake at the red arrow. A ridge separates two tributaries each with an icefall creating ogives, purple arrow. There are ogives below a pair of icefalls at the yellow arrow. The tributaries are separated by a medial moraine orange arrow. By 2014 retreat has led to expansion of the lake at the terminus. The retreat is 300 meters during this 20 year period. The icefall on the right, east side of the glacier, is no longer producing significant ogives and the bare glacier ice has been replaced with extensive debris cover, yellow arrow. Both the ridge and medial moraine separating the tributaries have expanded in width as the glacier has thinned.

A series of comparison images from Google Earth in 2001 and 2014 further illustrate the changes noted above.

In the first pair the terminus change and lake expansion is evident at the red arrow. Debris cover expansion at the lateral moraine area with thinning of the eastern tributary is notable at the yellow arrow.

The second pair is the terminus reach. A series of depressions are noted with each yellow arrow, indicated by concentric crevassing. This indicates collapse due to a subglacial basin/lake. Further this indicates a stagnant collapsing terminus area in the lower 1.5 km of the glacier.

The last pair is the icefall region indicating reduced crevassing below the lefthand icefall, pink arrow and the expanding medial moraine yellow arrow. It is clear that this glacier is going to continue to retreat in the coming decades, and the rate is going to increase in the near future as the collapsing sections of the terminus melt away. There is still considerable glacier area that remains snowcovered each year, and it can survive current climate and some additional warming. The snowline on the glacier is at 5000-5100 m and the head of the glacier is at 6100 m.
midui glacier comp
Midui Glacier comparison from Google Earth

midui terminus comp
Midui Terminus comparison from Google Earth

midui icefall
Midui Icefall comparison from Google Earth

Menlung Glacier Rapid Retreat & Lake Expansion, Tibet, China 1992-2014

Menlung Glacier is one valley north of the China/Tibet border with Nepal and on the south side of Menlungste Peak. Menlung Glacier has a glacier lake at its terminus that is dammed by the glacier’s moraine. The glacier began to withdraw from the moraine and the lake began to develop after the 1951 expedition to the area. The glacier lake is at 5050 meters, the glacier descends from 7000 meters with the snowline recently around 5500 meters. The lower section of the glacier is heavily debris covered, which when the debris is more than several centimeters thick as in most areas here, reduces the rate of glacier melt. Melt is highest around the supraglacial lakes (shallow lakes on glacier surface), which can lead to the lakes expanding and coalescing. Benn (2001) examined the process on nearby Ngozumpa Glacier, Nepal. This region has experienced significant mass loss of -0.25 m/year from 2000-2010 (Gardelle et al, 2013). The Japanese Aerospace Exploration Agency has a side by side 1996 and 2007 satellite imagery that indicates the Menlung Glacier Lake developing in 1996 that still has remnant glacier ice in it, that is melted by 2007. Here we use Landsat imagery and Google Earth imagery to identify the changes from 1992-2014.

menlung glacier 1992
1992 Landsat image: In each image the pink arrow is the 1992 terminus, the yellow arrow the 2014 terminus, the green arrow the furthest downglacier extend of clean glacier ice and the red arrow the lower margin of a tributary glacier in 2014.

In Landsat imagery from 1992 the lake is still developing from a system of supraglacial lakes interspersed with debris covered stagnant glacier sections. In 1994 there is little change, other than some of the lakes are frozen. In 2001 a contiguous lake has formed that is 500 m long and 600 m wide, though the main glacier front has changed little. The lake rapidly expanded to a length of 1900 meters by 2009. The glacier retreat is 500 meters, the other 300 meters of lake expansion is a continued growth at the moraine end of the lake as ice cored moraine continues to melt. By 2013 the lake has extended to a length of 2250 m, due solely to further glacier retreat. In 2014 has experienced a further 50-100 m of retreat from 2013. The lake is now 2300 m long, and is turning a darker blue color as the amount of glacier flour in it diminishes. A comparison of the terminus and lake using Google Earth images from 2005 and 2014 indicate the rapid lake growth in the last decade. The lower portion of the glacier remains debris covered, and appears stagnant, but has significant supraglacial lakes only with 400 meters of the 2014 terminus, suggesting the period of rapid retreat is nearly over. The region above the terminus in 2014 is dissected by a significant surface glacier stream that extends 2.5 km upglacier to the beginning of the first sections of debris free ice. That the river stays on the surface so long indicates the lack of crevassing and the stagnant nature of the ice. From 1992 to 2014 the area of clean glacier ice has also migrated 1 km upglacier, green arrows. The red arrows indicate a smaller glacier that has retreated further from the lake and has developed some substantial bedrock areas amidst the lower glacier between 1992 and 2014. The retreat and lake expansion parallels that seen at Longbasba, Reqiang, Sepu Kangri and Ngozumpa Glacier.

menlung glacier 1994
1994 Landsat image

menlung glacier 2001
2001 Landsat image

menlung glacier 2009
2009 Landsat image

menlung glacier 2013
2013 Landsat image

menlung glacier 2014
2014 Landsat image

menlung glacier compare
2005 and 2014 Google Earth image comparison
menlung terminus 2014
2014 Google Earth images. Black arrows indicate supraglacial stream.

Ribuktse Glacier Retreat, Tibet, China 1991-2014

Ribuktse Glacier drains east from 6200 m peaks along the Nepal-China border. The glacier ends in a lake that drains into Ribuktse Tso, the Yarlung Tsangpo (Zangbo), which becomes the Brahmaputra River. The Zangmu hydropower project is being constructed on the river, it is a 510 MW project. Here we examine Landsat and Google Earth imagery from the 1991-2014 period. This is a region where Li et al (2011) noted that increasing temperature, especially at altitude, the fronts of 32 glaciers have retreated, mass losses of 10 glaciers have been considerable, glacial lakes in six regions have expanded and melt water discharge of four basins has also increased. Neckel et al (2014) examined changes in surface elevation of the glaciers and found this region lost 0.44 m/year from 2003 to 2009.

ribuktse 2005
Google Earth image

In 1991 the glacier ends in a proglacial lake at the red arrow, the yellow arrow is the 201 terminus. The lake at an elevation of 5050 m is 1.1 km long and 600 m wide. The purple arrow indicates two tributaries that connect to the larger valley glaciers. By 1998 the lake has expanded. The tributary to the glacier to the north of Ribuktse has separated from the main glacier. In 2000 and 2001 the tributary to the Ribuktse Glacier is still connected to the main glacier. The terminus continues to retreat with lake expansion. By 2005 the lake is 1.8 km long and the tributary is no longer visibly in contact with the main glacier at the purple arrow. In 2014 the terminus has retreated 800 m since 1991, the lake is 1.9 to 2 km long and the tributary has significantly separated form the main glacier. At the glacier just to the north the tributary separation from the valley glacier has led to a new glacier lake developing by 2011. There is little evidence of calving from Ribuktse Glacier. The retreat of the low slope glacier tongue in the proglacial lake lacking calving will continue at a slow rate. The high elevation of the glacier terminus area limits the magnitude of ablation on the glacier tongue. The retreat follows the pattern of the Yemayndrung Glacier just to the south, Durung Drung Glacier, India, Reqiang Glacier, China and Matsang Tsanpo Glacier, China which are in a similar climate setting. This area did get an unusual heavy October snowfall from Cyclone Hudhud this week.

ribukste 1991
1991 Landsat image

ribuktse 1998
1998 Landsat image
ribukste 2000
2000 Landsat image
ribuktse 2001
2001 Landsat image

ribuktsege
2005 Google Earth image
ribukste 2014
2014 Landsat image

ribuktse north 2011
2011 Google Earth image

Yemayundrung Glacier Retreat, Tibet, China

The Yemayundrung Glacier flows northeast from the Nepal-China border to end in lake at the headwaters of the Khugpi Chu River. This river is one of the source rivers of the Yarlung Tsangpo (Zangbo) in China which becomes the Brahmaputra in India. This is a region where Li et al (2011) noted that increasing temperature, especially at altitude, the fronts of 32 glaciers have retreated, mass losses of 10 glaciers have been considerable, glacial lakes in six regions have expanded and melt water discharge of four basins has also increased. This is further documented by an inventory of 308 glaciers in the Nam Co Basin, Tibet, where an increased loss of area for the 2001-2009 period, 6% area loss (Bolch et al., 2010) was observed. Here we examine Landsat imagery of changes in this glacier from 1998 to 2014.

yemaundrung ge

In each image the yellow arrow indicates the 1998 terminus and the red arrow the 2014 terminus. The purple arrows indicate a pair of tributary glaciers from the south and the green arrow a tributary after it has joined the main glacier separated by a lateral moraine. In 1998 the glacier terminates at the yellow arrow and the maximum length of the proglacial lake at the terminus is 1 km. The two tributaries from the south join the main glacier. The tributary at the green arrow has a blue ice tongue that extends down glacier to the main glacier junction. In 2000 the terminus has retreated a short distance, but there is little change in the tributaries. By 2013 the lake has lengthened to 1.8 km with glacier retreat. In 2014 the two southern tributaries at the purples arrows no longer connect to the main glacier. The tributary at the green arrow no longer has blue glacier ice extending past the arrow to the main glacier junction. The glacier has retreated 750 m from 1998-2014. The thinning of several tributaries is indicative of less volume flux toward the terminus, which will lead to continued retreat of this glacier and lake expansion. The retreat is similar to that of Durung Drung Glacier, India, Reqiang Glacier, China and Matsang Tsanpo Glacier, China and Ribuktse Glacier, China, which are in a similar climate setting. This area did get an unusual heavy October snowfall from Cyclone Hudhud this week.

yemaundrung 1998
1998 Landsat image
yematundrung  2000
2000 Landsat image
yemaundrung 2013
2013 Landsat imageyemayundrung 2014
2014 Landsat image