Steenstrup Glacier, NW Greenland Releases New Island in 2017

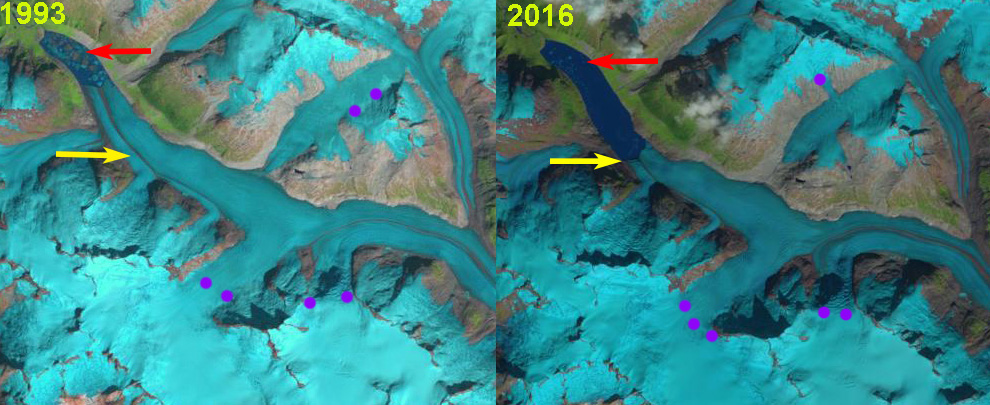
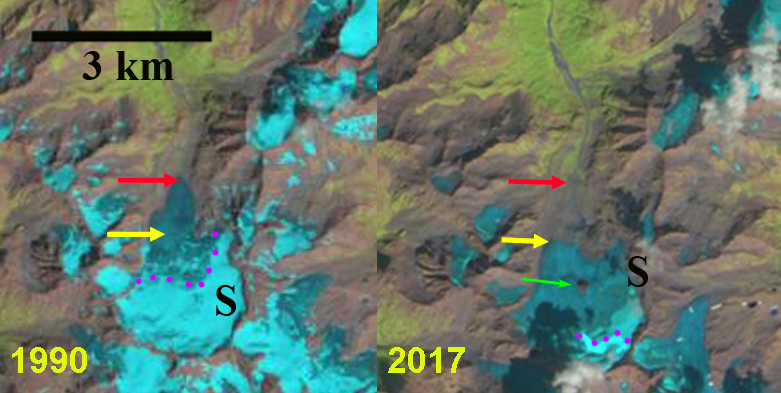
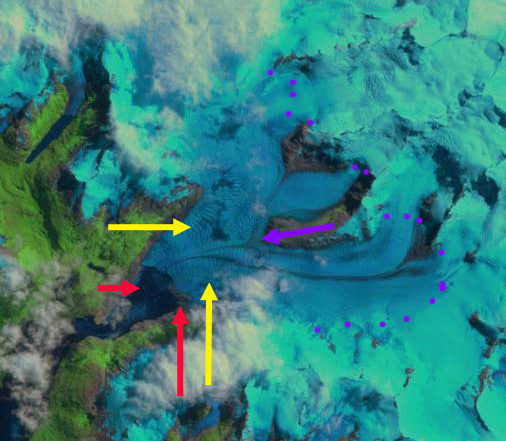
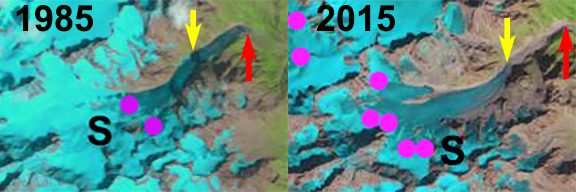
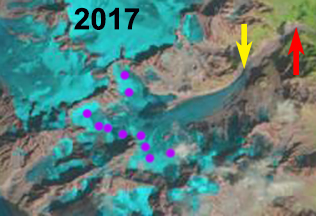
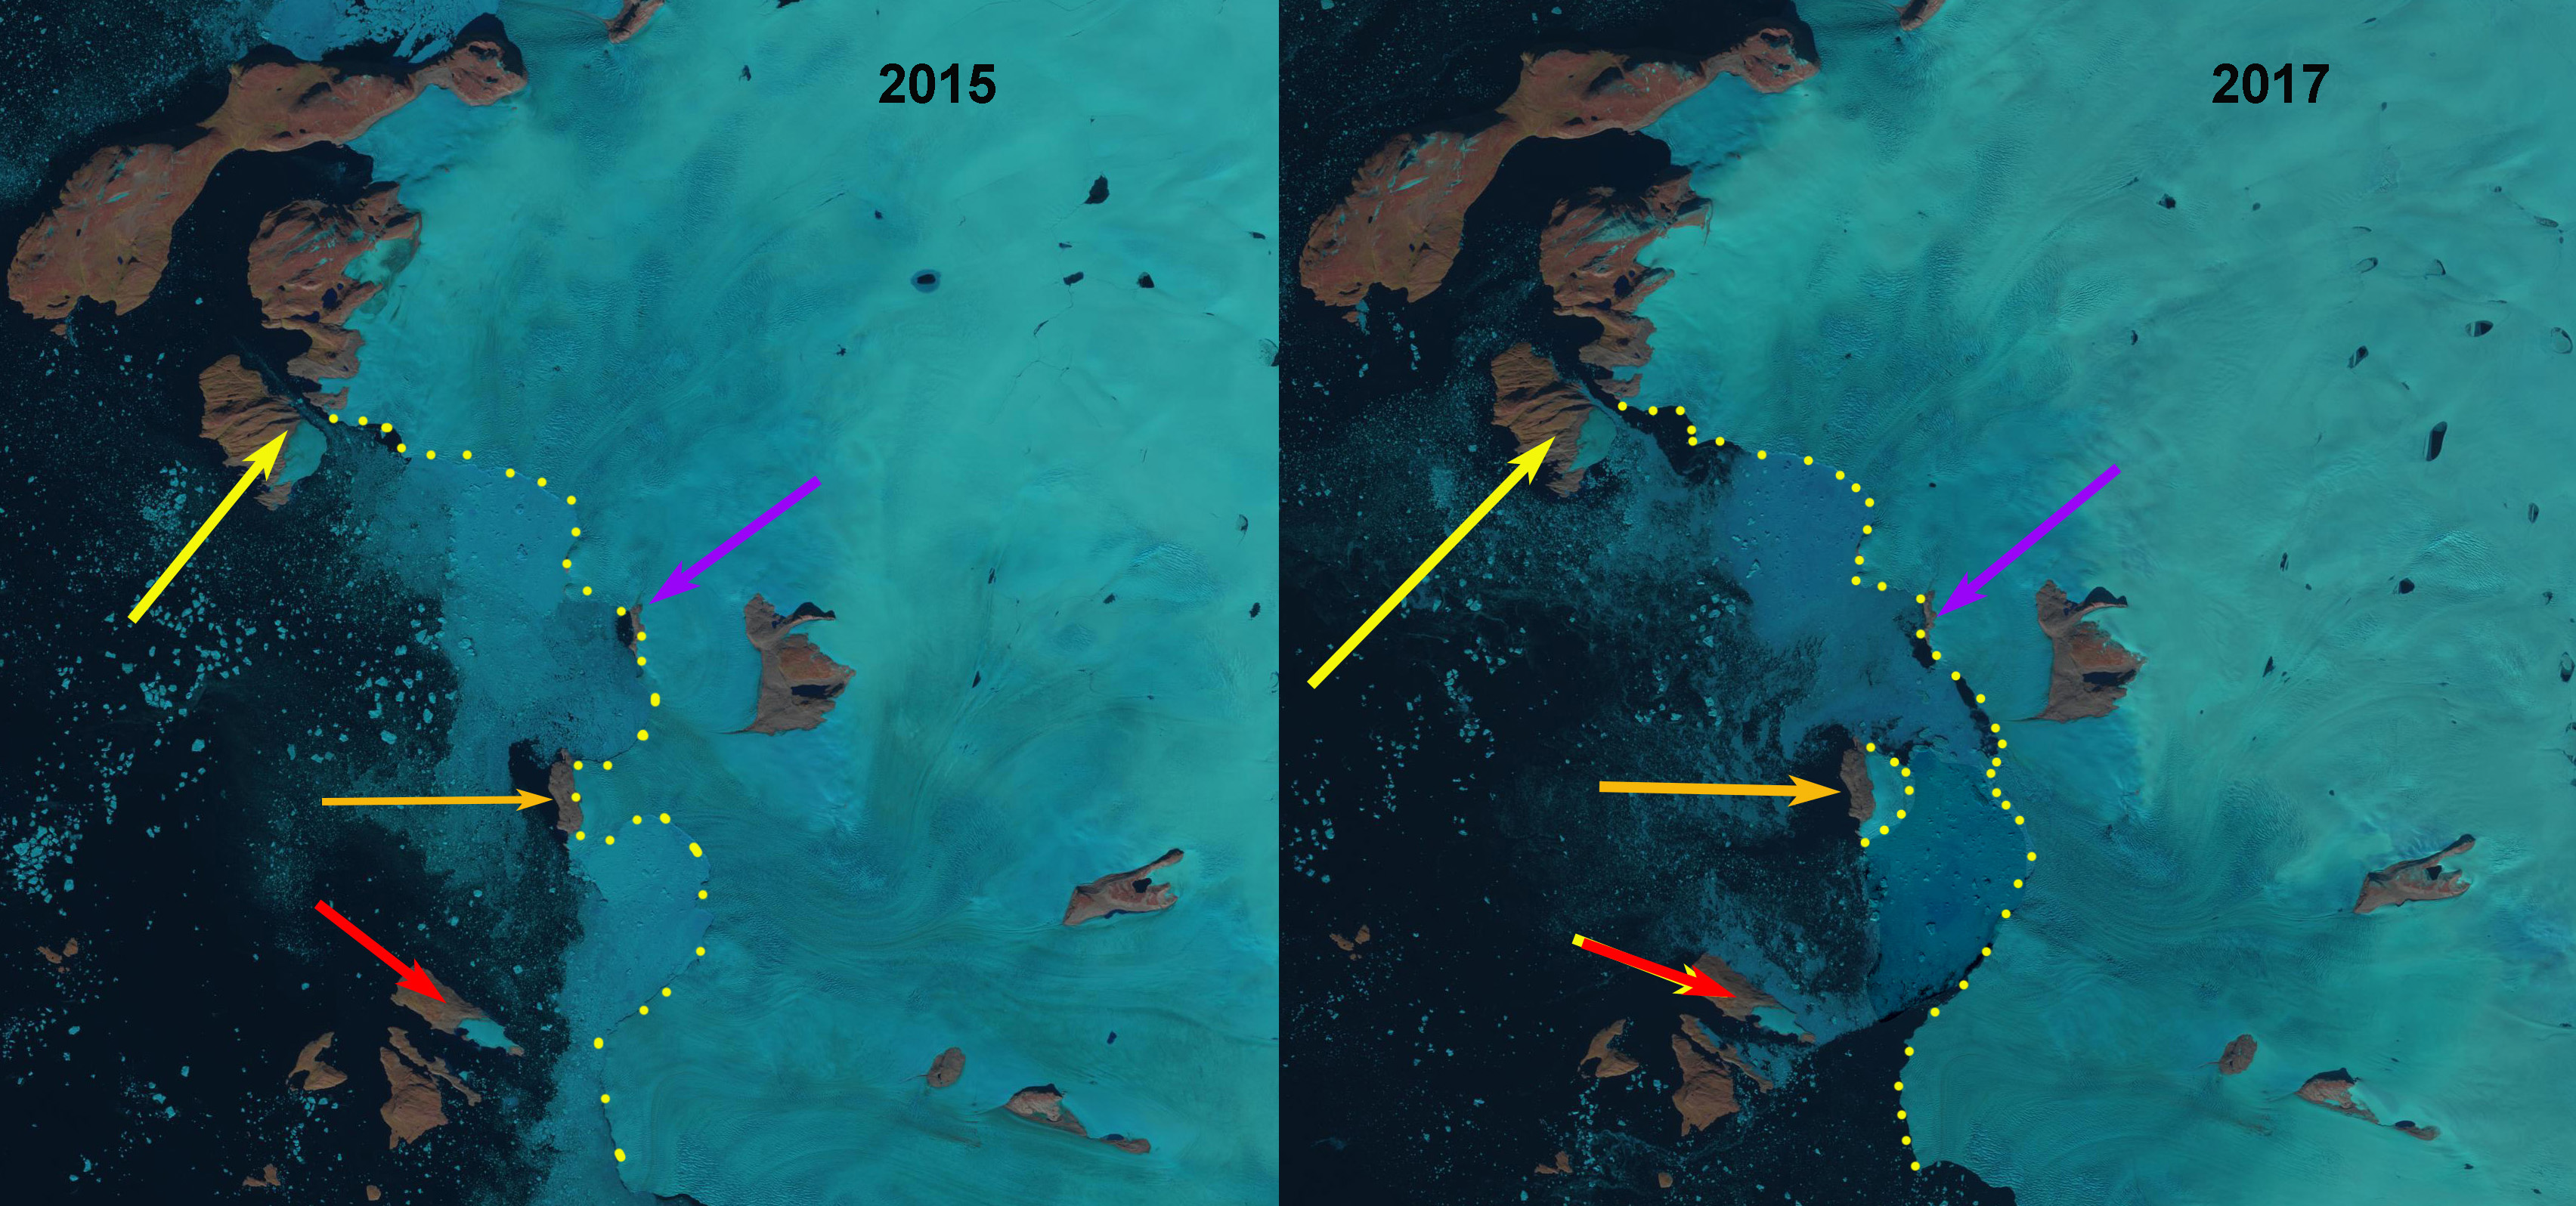
Steenstrup Glacier front in 2015 and 2017 illustrating location with respect to the new islands at: Red Head-red arrow, Tugtuligssup Sarqardlerssuua at yellow arrow , and the 2017 new island at orange arrow.  Yellow dots indicate icefront and purple arrow another future island to be released from the glacier.  

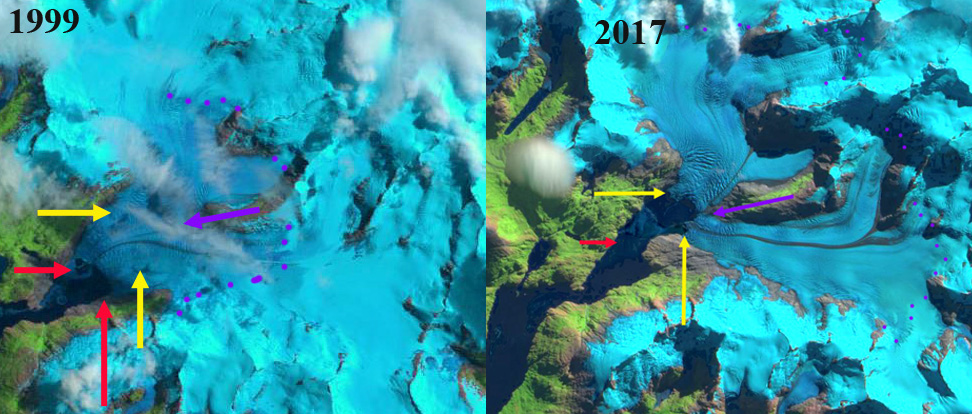
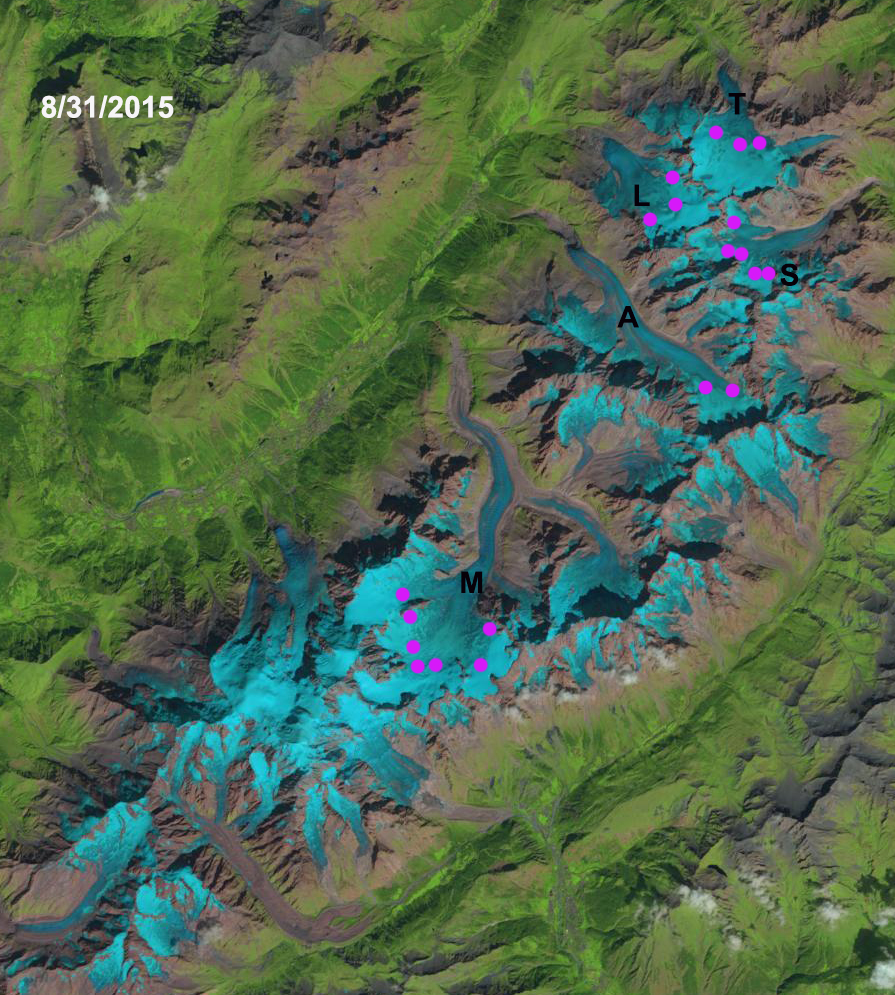
Steenstrup Glacier is located at 75.2 N in Northwest Greeland terminating in Melville Bay. The glacier terminates on a series of headlands and islands, the glacier immediately to the south is Kjer Glacier. The boundary between Steenstrup Gletscher and Kjer Glacier is Red Head and Steenstrup Glacier’s northern margin is at Cape Seddon. A previous post examined changes in the terminus position of Steenstrup and Kjer Glacier from 1999 to 2013 including formation of a new island at Red Head.  Another post in 2014 examined the formation of an additional island at Tugtuligssup Sarqardlerssuua.  Here we report formation of another new island at the glacier front in 2017 that is southwest of the Kloftet Nunatak.  The islands act as pinning points stabilizing the front, when a connection is lost there is typically a significant retreat of the glacier in the vicinity of the new island. 

In 1999 the Front of Steenstrup was pinned on three headlands at the yellow, orange and red arrows.  By 2005 the glacier had retreated from Red Head (Van As, 2010).  By 2013 the connection of ice at the yellow arrow at Tugtuligssup Sarqardlerssuua was thin and on the verge of failure which did occur in 2014.  In 2015 the connection to the pinning point at the orange arrow was thinning, this continued in 2016 and failed in 2017 creating a new island.  Retreat from Red Head 2005 to 2017 is 6 km, retreat from the orange arrow pinning point from 2016 to 2017 is 4 km and retreat at Tugtuligssup Sarqardlerssuua from 1999-2017 is 3 km.  The ice front is approaching Kloftet Nuntak just south of the purple arrow. McFadden et al (2011) noted several glaciers in Northwest Greenland Sverdrups, Steenstrup, Upernavik, and Umiamako that had similar thinning patterns. Each glacier also had a coincident speed-up with a 20% acceleration for Steenstrup Glacier (McFadden et al, 2011). This is a familiar pattern with thinning there is less friction at the calving front from the fjord walls, pinning points and the fjord base, leading to greater flow. The enhanced flow leads to retreat and further thinning, resulting in the thinning and the acceleration spreading inland.  Changes in the position of the ice front can also be viewed at  the Polar Portal.

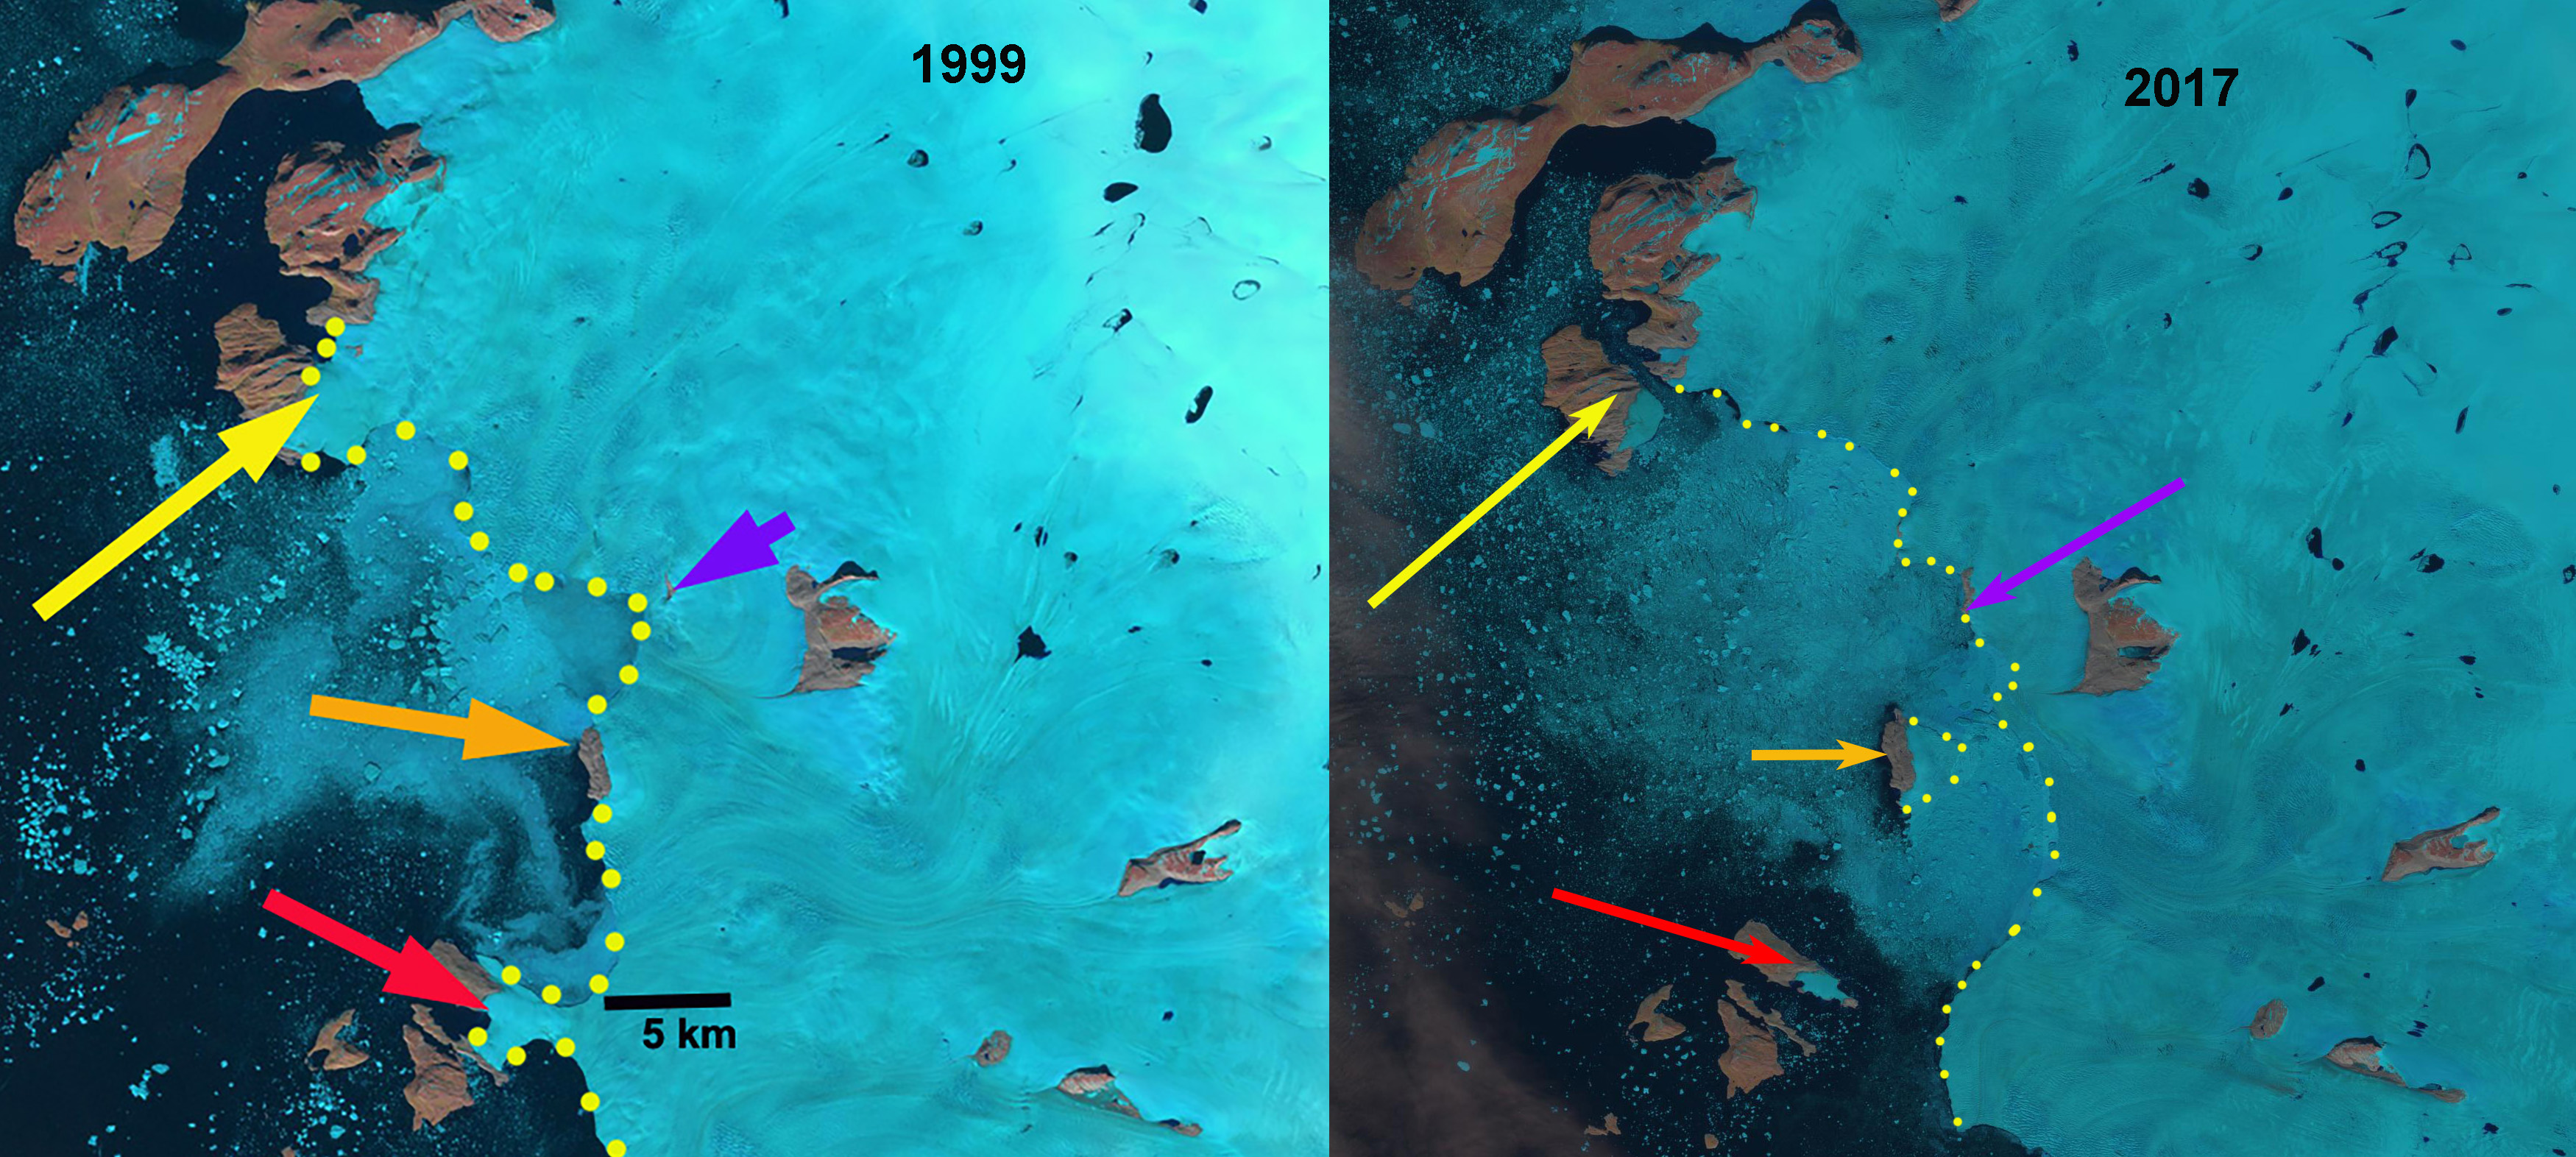
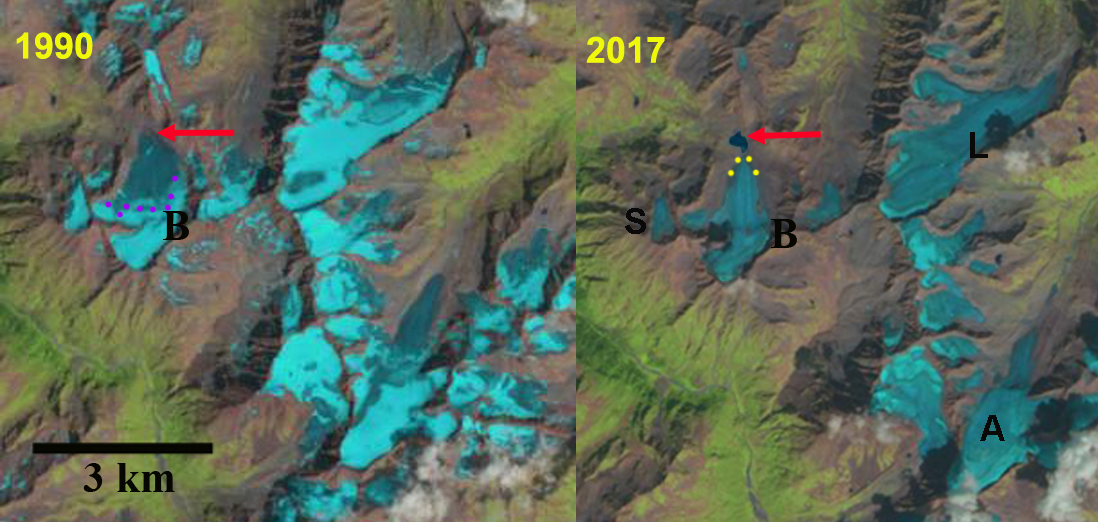
Steenstrup Glacier front in 1999 and 2017 illustrating location with respect to the new islands at: Red Head-red arrow, Tugtuligssup Sarqardlerssuua at yellow arrow , and the 2017 new island at orange arrow.  Yellow dots indicate icefront and purple arrow another future island to be released from the glacier.  

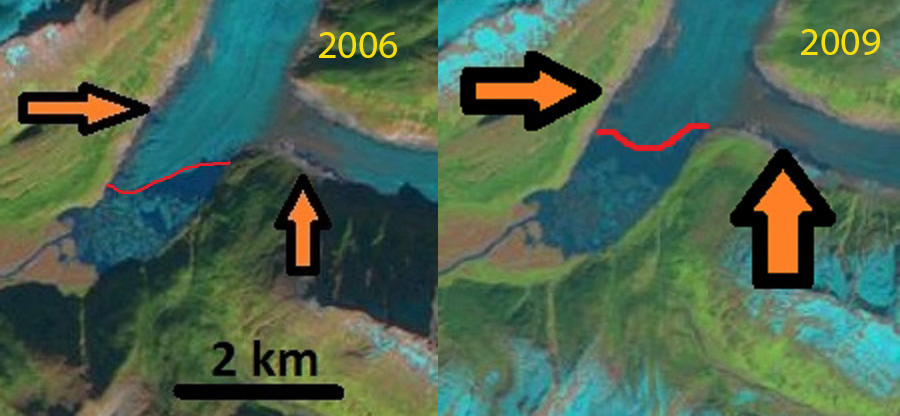
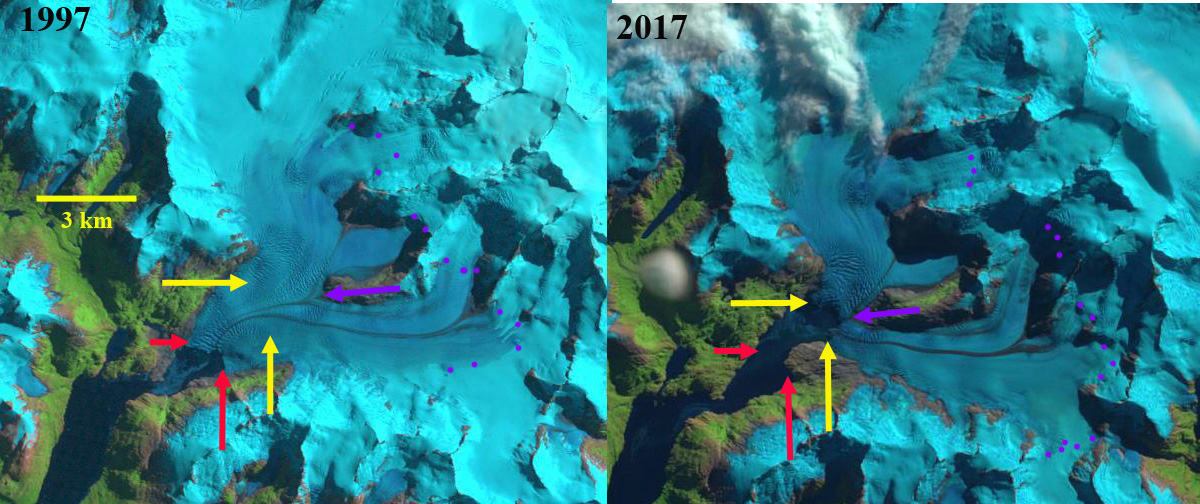
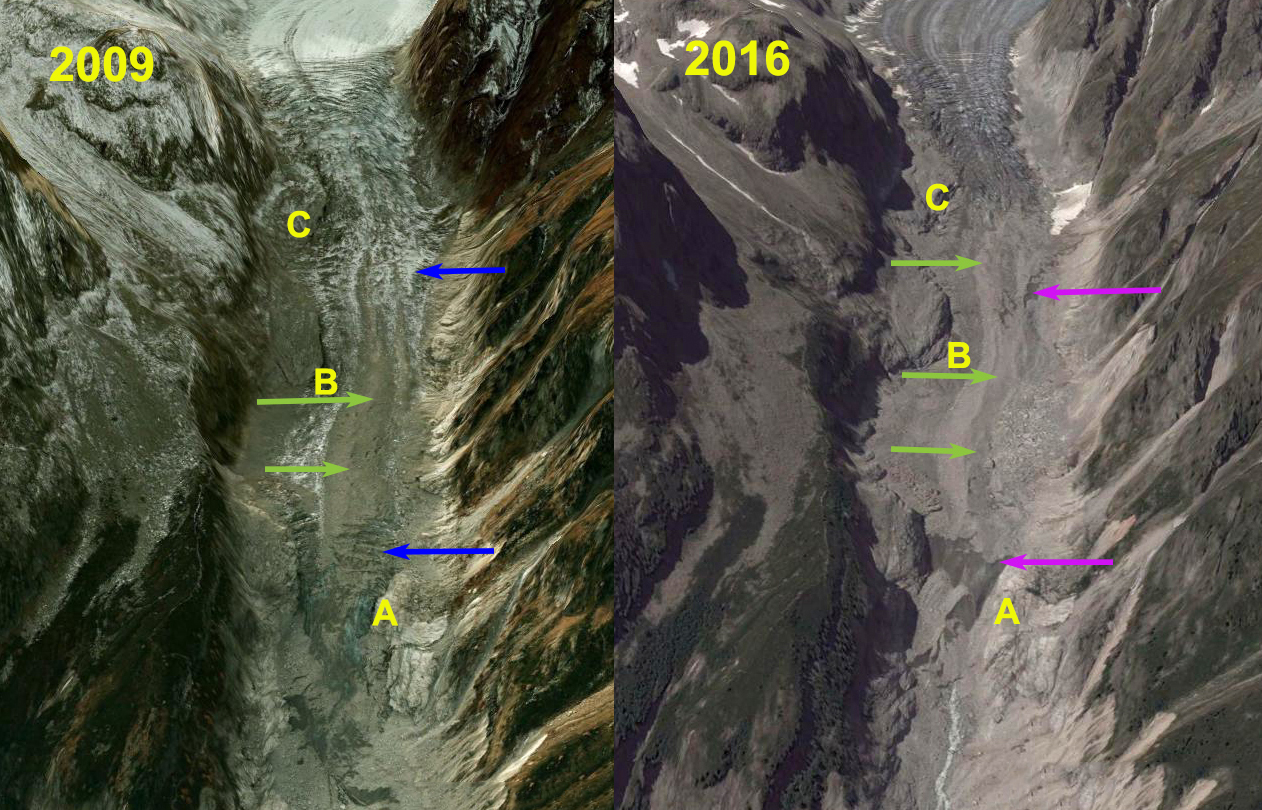
Steenstrup Glacier front in 2016 indicating connection still to the pinning point that becomes an island in 2017, orange arrow.

Klinaklini Glacier, British Columbia Retreat Generates Large Icebergs

Klinaklini Glacier comparison in Landsat images from 1987 and 2017.  Red arrow 1987 terminus, yellow arrow 2017 terminus and snowline at purple dots.

Klinaklini Glacier is the largest glacier in the Coast Mountains of British Columbia between Vancouver and Prince Rupert.  The glaier drains west and south from Mt. Silverthrone.  There is significant accumulation area above 2500 m and the glacier terminates at 300 m.  GLIMS noted the area in 2004 as ~470 km2.  Glaciers in this region are retreating and losing volume, Schiefer et al (2007) noted that the rate of volume loss had doubled in  the most recent decade.  Clarke et al (2015) modeled a 70% loss in volume of all glacier in western BC by 2100. Here we examine Landsat imagery from 1987-2017, to identify changes.  In particular examining the area of large icebergs in 2015-2017 generated from a rapid calving retreat that has occurred since 2010. The glacier drains in to Knight Inlet a famous area for salmon fishing. 

I first saw this glacier in 1982 and at that time it ended on an outwash plain with a narrow lake/wide river leading from the terminus.  In 1987 the terminus was at this same location, red arrow, with no significant lake at the terminus.  The snowline in 1987 is at 1500 m.  By 1995 a lake had formed across the width of the terminus.  The lake was than 600 m long and the snowline was at 1600 m. In 2010 the glacier had retreated more than 1 km across its entire 1.3  km width.  The lake at the terminus had a surface area greater than 1.5 km2 and was largely filled with icebergs.  The snowline in 2010 is at 1500 m.  By 2013 the main proglacial lake has expanded to a length of over 2 km and remained largely filled with icebergs.  Retreat from 2010-2013 was as great as the retreat from 1995 to 2010.  The snowline in 2013 was at 1600 m.  From 2013 to 2014 there was no real change in the terminus position and the largest iceberg remained the same, pink (1).  In 2015 the snowline is at 1600 m and is at 1700 m in 2016.  In the side by side comparison of the terminus in 2015, 2016 and 2017 it is apparent that there was limited retreat from 2013, and a large calving event in 2017 generating an iceberg with an area of 0.7-0.9 square kilometers, pink (2), along with other smaller icebergs.  The lake is now 4 km long, yielding a retreat rate of 130 m/year from 1987-2017.  Nearly 50% of the retreat occurred in 2017.  In 2017 the snowline is at 1700 m as well.  The high snowlines each year are leading to mass loss, which leads to reduced flow through the ablation zone.  The thinning terminus due to higher ablation and less flux from above is then more prone to breakup.  The Klinaklini Glacier wins the prize for the largest observed iceberg produced by a glacier in Western Canada. The retreat is similar to other valley glaciers in the region Bishop GlacierJacobsen Glacier, Bridge Glacier and  Klippi Glacier.

Comparison of the terminus, pink dots in 2015, 2016 and 2017.  The red arrow is the 1987 terminus, yellow arrow the 2017 terminus and the largest icebe

rgs also labelled. 


34th Annual, 2017 North Cascade Glacier Climate Project Field Season

2017 Field Season Video

For the thirty fourth consecutive summer we headed into the field to monitor the continued response of North Cascade glaciers to climate change.  In 1984 when I began this program we selected 10 key glaciers to monitor.  Two of these have now disappeared.  All the glaciers have retreated extensively and lost considerable volume.  The mass balance loss is 19 m of water equivalent thickness, which is over 20 m of ice thickness loss on glaciers that averaged less than 75 m thick. This is significant with 25-30% of their entire volume lost. This project continues to monitor glacier loss and the runoff they provide.  We also complete an annual inventory of ice worms on Sholes Glacier and mountain goats on Ptarmigan Ridge region.  In 2017 our key project was a continue partnership with the Nooksack Indian Tribe monitoring glacier melt and runoff in the North Fork Nooksack River basin.  We have not yet had the chance to determine the daily glacier discharge and the resultant contribution to the North Fork Nooksack River. The dry conditions of August certainly will lead to many days with  more than 40% of the flow coming from glacier melt as was the case in 2015. 

The snowpack on April 1st snowpack was 110% of normal, by June 1st, the snowpack was trending down steeply, but
remained well above the last four years and similar to 2012. Summer turned out to be the driest on record in Seattle and

June 1 snowpack comparison

tied for the warmest for the June 21-Sept. 22nd period (KOMONews).  In the mountains the overall melt season temperatures for May 1 through Sept. 30th was 0.15 C cooler than 2015 values, due to a cooler spring.  The most striking feature of the field season was the forest fire smoke largely from British Columbia that obscured views most days. 

Of the glaciers observed one had a significant positive balance, one a slight positive balance-essentially equilibrium and seven had negative mass balances.  The two glaciers with the most positive balance were the Sholes and Rainbow Glacier, adjacent glacier on the north side of Mount Baker.  The nearby Mount Baker ski area reported 860 inches of snow in 2017, significantly above average.  Compared to other locations in the range this winter snowfall was a positive anomaly, that also was observed on the nearby glaciers. The snow water equivalent in multiple crevasses on Rainbow Glacier at 2000 m in early August was 3.8-4.1 m.  On both Easton and Rainbow Glacier the mass balance gradient was steeper than usual.  On Rainbow Glacier the mass balance was -3 m at 1500 m, 0 at 1700 m and +2.5 m at 200 m as summer ended. We also observed terminus retreat on every glacier.   Retreat averaged 12 m in 2017, lower than in 2015 or 2016.  More striking than retreat in some cases is thinning that reduces slope and frontal thickness.  On Lower Curtis Glacier the terminus seracs are 15 m shorter than two years ago.  On Columbia Glacier the lowest 200 m of the glacier has a slope that has declined by 5 degrees in the last three years and the glacier terminus has retreated 60 m in two years. 


Bishop Glacier Retreat, British Columbia Generates Substantial Alpine Lake

Bishop Glacier retreat in Landsat images from 1985 and 2017, 3000 m retreat. Red arrow is the 1985 terminus, yellow arrow is the 2017 terminus, purple dots is the snowline. B=Bishop, R=Ring, L=Lillooet.

Bishop Glacier is a 10.5  km long western outlet glacier of the Lillooet Icefield in British Columbia. The glacier shares a divide with the eastern outlet Lillooet Glacier at 1750 m.  The glacier from 1985-2017 has ended in a rapidly expanding glacial lake.  Here we examine the retreat using Landsat imagery from 1985-2017.  Bridge Glacier drains east from the same icefield and after a period of sustained retreat, 30 m per year from 1981-2005 (Allen and Smith, 2007), calving enhanced the retreat from 2004-2016 averaging 250 m/year (Pelto, 2017).  Chernos (2016) observed that as Bridge Glacier neared the upglacier end of the developing lake basin retreat would slow. 

In 1985 Bishop Glacier terminated in a 1 km long proglacial lake at 1300 m. Ring Glacier was the main tributary, joining from the north.  The snowline averaged 2000 m. By 1993 the lake had expanded to a length of 2.25 km, the snowline was at 2150 m and Ring Glacier was barely connected to the main glacier.  From 1993-2002 retreat was slower with the lake expanding to 2.5 km in length, the snowline was at 1950 m and Ring Glacier had detached from Bishop Glacier.  In 2016 the snowline was at 2300 m and the lake was relatively free of icebergs.  In 2017 the proglacial lake is 4 km with a glacier retreat of 3000 m in 32 years.  Ring Glacier has retreated 800 m from Bishop Glacier. The lake is relatively free of icebergs in 2017 as well, suggesting a reduced calving rate in recent years.  There is an increase in slope 1 km above the terminus, pink arrow in Google Earth image suggesting this is the maximum distance the lake will extend upvalley.   Retreat should slow due to reduced calving, but will continue as indicated by the Ring Glacier and others retreating that are not calving glaciers. The snowline in 2017 despite a snowy winter is quite high at 2300 m.   The retreat is similar to other valley glaciers in the region Jacobsen Glacier  Klippi Glacier.

Bishop Glacier retreat in Landsat images from 1993 and 2016. Red arrow is the 1985 terminus, yellow arrow is the 2017 terminus, purple dots is the snowline.


Google Earth image of Bishop and Ring Glacier, pink arrow shows the change in slope.

Bishop Glacier retreat in Landsat images from 2002. Red arrow is the 1985 terminus, yellow arrow is the 2017 terminus, purple dots is the snowline.


Field Glacier, Alaska Retreat, Leads to Glacier Separation

Field Glacier in Landsat images from 1984, 2013 and 2017.  The red arrow indicates the 1984 terminus, the yellow arrows the 2013 terminus and the yellow dots the 2017 terminus.  The purple arrows indicate developing lateral margin lakes in 2013 and purple dots the transient snowline.

The Field Glacier flows from the northwest side of the Juneau Icefield, and is named for Alaskan glaciologist and American Geographical Society leader William O. Field. Bill also helped initiate the Juneau Icefield Research Program, which Maynard Miller then ably managed for more than 50 years. The JIRP program is still thriving today. In 1981, as a part of JIRP, I had my first experience on this glacier. It was early August and there was new snowfall everyday that week. Jabe Blumenthal, Dan Byrne and myself undertook a ski journey to examine the geology on several of the exposed ridges and peaks, note the burgundy line and X’s on image below. This was truly a remote area. The glacier begins from the high ice region above 1800 meters, there are several icefalls near the snowline at 1350 meters, and then it descends the valley ending at 100 meters. The runoff descends the Lace River into Berners Bay.This post focuses on the significant changes occurring at the front of the Field Glacier. The development of a proglacial lake at the terminus is accelerating and spreading into the main southern tributary of the glacier.  In 2013 it was observed that the lake was going to quickly expand and develop a second arm in that valley, as the two main tributaries separate.

The USGS map from 1948 imagery and the 1984 imagery indicate little change in the terminus position, with only a small lake at the terminus in 1984 with most of the margin resting on the outwash plain.  The Field Glacier by 2006 had developed a proglacial lake at the terminus that averaged 1.6 km in length, with the east side being longer. There are several small incipient lakes forming at the margin of the glacier above the main lake, each lake indicated by black and orange arrow. In 2009 the lake had expanded to 2.0 km long and was beginning to incorporate the incipient lake on the west side of the main glacier tongue. There was also a lake on the north side of this tributary. This lake was noted as being poised to soon fill the valley of the south tributary and fully merge with the main, as yet unnamed lake at the terminus, maybe this should be Field Lake.   In 2013 Google Earth imagery indicates the fragile nature of the terminus tongue that is about to further disintegrate. From 1984 to 2017 Field Glacier has experienced a retreat of 5300 m of the southern branch and 4050 m of the northern branch. This glacier is experiencing retreat and lake expansion like several other glaciers on the Juneau Icefield, Gilkey GlacierEagle Glacier, and Antler Glacier.

.

Development of proglacial lakes from 2006 to 2009.

Terminus noted for 1984 and 2011 and the snowline in 2011.  JIRP camp locations noted by X’s.

2013 Google Earth image of the terminus. Many small icebergs already separating.


Aneto Glacier, Pyrenees Area Loss & 2017 Snowcover Loss

Landsat and Sentinel 2 image from 8/24/2017 indicating the lack of retained snowcover on Aneto Glacier.  The bare glacier ice ablates faster than snow. 

Aneto Glacier in the Pyrenees of Spain is listed as its largest glacier in a 1984 inventory. In 1984 the glacier had an area of 1.32 square kilometers and a length of 1.6 km (Serrat and Ventura, 2005). The glacier is located on the northeast side of Aneto Peak. The glacier is just a few kilometers from the rapidly retreating Maladeta Glacier. From 1984 to 2016, 20 of the 39 Pyrenean glaciers  have disappeared, resulting in a loss of glacier surface area from 805 hectares in 1984 to 242 hectares in 2016, a 70% loss in 32 years (Rico et al, 2017 is in press Pireneos).  The reduction since the Little Ice Age maximum is even greater, not figure below from Eñaut Izagirre.

Aneto Glacier is a steep north facing slope glacier that receives limited avalanche accumulation.   In 2017 Aneto Glacier has suffered from an intense melt season that has seen the loss of essentially all snowcover and consequent volume/area losses from ice ablation.  This is apparent in both Landsat and Sentinel images from Aug. 24th.  At the start of August the glacier was ~50% snowcovered and by Sept. 13th a snowstorm had at least briefly covered much of the glacier with a thin blanket of snow. In 2015 and 2016 retained snowcover was also limited.  There was less snowcover in early August of 2015 than in 2017, and by the end of the month in hazy imagery the snowpack is very limited.  In early September of 2016 there is less than 10% retained snowcover.  Satellite and Google Earth imagery reveal a frequent lack of retained snowcover in the last decade.  This indicates the lack of a consistent accumulation zone, which is a necessary feature for a glacier to survive  (Pelto, 2010). This is revealed by the annual horizons exposed in the 2007 Google Earth image.  

Landsat images of Aneto glacier from 8/3/2015 and 9/6/2016 illustrating limited snowcover near the end of the summer in 2016 and with a month of peak melt in 2015 snowcover is less than 50% of the glacier. 

Rico et al (2017) figure indicating LIA area to 2016 for Maladeta and Aneto Glacier, image provided by Eñaut Izagirre @Ernatio

2007 Google Earth image of Aneto Glacier illustrating lack of retained snowcover and the many annual layers exposed by the lack of an accumulation zone.

Sentinel 2 images of Aneto Glacier area in 2017 indicating there is significant remaining snowcover on 8/4 and again by 9/13.

Sulztalferner Retreat, Austria Bedrock Expansion Mid-Glacier

Sulztalferner in Landsat images from 1990 and 2017.  Red arrow is the 1990 terminus, yellow arrow the 2017 terminus, purple dots the snowline and the green arrow an area of emergent bedrock amidst the glacier. 

Sulztalferner is a glacier in the Subaier Alps of Austria. The glacier begins at 3200 m below Daunkogel Peak and descends north from the peak.  Schlicker (2006) identified that between 1969 and 2003, 14 of the 88 glaciers in this range disappeared. The area of the glaciers was to 54.1 km2 in 1969, increased slightly to 54.4 km2 in 1985, decreased to 47.2 km2 in 1997 and the a rpaid decline to 36.9 km2 in 2003. Schlicker (2006) observed that the area of Sulztalferner, one of the largest glaciers in the region, decreased from 4.16 km2 in 1969 to 3.51 km2 in 2003. This fits the pattern of all Austrian glaciers  Fischer et al (2015).    Fischer and Kuhn (2012) measured the thickness of the glacier finding the average was 42 m and the maximum was 131 m.  The glacier terminus fluctuations are examined annually and reported by the Austrian Alpine Club  Fischer (2016) and Fischer (2017), with all 11 glacier in the Stubaier area retreating in 2015 and 2016 and Sulztalferner retreating 14 m each year.

In 1990 the glacier descended a steep icefall at the yellow arrow and terminated at 2430 m at the red arrow, the glacier was 3050 m long.  By 1999 the glacier retreat and thinning made the icefall more pronounced.  By 2015 the glacier terminated near the top of the a steep bedrock step that had caused the icefall to exist. An area of bedrock had also emerged just below the snowline. In 2017 the glacier is 2100 m long extending from an elevation of 3200 m to 2730 m.  Retreat from 1990-2017 has been 950 m, a mean of 35 m/a.  That is more than 1% of the glacier length lost per year. In 2017 in late August only 10% of the glacier has retained any snowcover indicating substantial volume losses will occur in 2017, which will drive further retreat.  This glacier is following the pattern of Bachenfallenferner just to the north. This glacier is just to the west of the Stubai Glacier and the Stubai ski area that has utilized a protective by blanket on the glacier The Stubai Glacier Ski Area opens for the 2017/18 season this Saturday 9/16 after a couple of snowstorms that have blanketed Sulztalferner and Stubai Glacier with some fresh snow.


Sulztalferner in Landsat images from 1990 and 2017.  Red arrow is the 1990 terminus, yellow arrow the 2017 terminus, and purple dots the snowline.

Digital Globe image from 2015 indicating the bedrock exposed in the midst of Sulztalferner.  It measures 250 m long and 150 m wide.  Note  the thin nature of the retreating terminus.


Sulztalferner Digital Globe image from 2015.  Note adjacent ski area and deglaciated icefall reach.


Bachfallenferner, Austria: 2017 Illustrates Why Glacier is Forecast to Not Survive

Comparison of Bachfallenferner (B) in Landsat images from 1990 and 2017.  The red arrow indicates the 1990 terminus position and yellow dots the 2017 terminus.  Note there is no retained snowcover in 2017 and a new lake has formed due to retreat. Other glaciers that lost all snowcover in 2017  L=Lisenser, A=Alpeiner and S=Sauischbachferner

Bachfallenferner is in the Stubaier Alpen, Austria.  The glacier terminus fluctuations are examined annually and reported by the Austrian Alpine Club  Fischer (2016) and Fischer (2017), with all 11 glacier in the Stubaier area retreating in 2015 and 2016.  Fischer and Kuhn (2012) surveyed the thickness of 64 alpine glaciers in Austria including Bachfallenferner, with a goal of determining volume.  They found in 2000 the glacier had an area of 2.08 square kilometers, with an average thickness of 41 m yielding a volume of .085 cubic kilometers.  

In 1990 Bachfallenferner ended on an outwash Plain at 2700 m.  The glacier was 2350 m long in 1990 with a width of 1100 m at its mid-point.  By 1999 a small sublacial lake has formed at the terminus, the lower 0.8 kilometer of the glacier is uncrevassed and relatively stagnant. In 1999 the snowcover the retained snowcover in late August covers 30% of the glacier.  In 2015 the glacier retreat has led to the formation of a proglacial lake that is 275 m across.  The glacier in late August is only 10-15% snowcovered.  By 2017 the glacier has retreated 400 m from its 1990 location including 60 m in 2015 and 2016.  More importantly the glacier by late August has lost all of its snowcover, as essentially have some of its neighbors: L=Lisenser, A=Alpeiner and S=Sauischbachferner.  A glacier that does not consistently retain snowcover cannot survive (Pelto, 2010). The glacier is now less than 2 km long and at the 1990 mid-point is 800 m wide.  Lateral recession in the lower 1 km of the glacier is similar to the rate of terminus recession.  The maximum ice thickness in 2000 was 97 m Fischer and Kuhn (2012), which is likely to have lost no more than a meter per year, hence there is still some comparatively thick ice.   The Stubaier Alpen has experienced substantial retreat in the last 30 years as have all Austrian Glaciers (Fischer et al.,2015).  Bachfallenferner is larger than most of the Austrian glaciers that are currently disappearing such as Mittlerer Guslarferner.

Comparison of Bachfallenferner in Landsat images from 1999 and 2015.  The red arrow indicates the 1990 terminus position and yellow dots the 2017 terminus.  Purple dots indicate snowline, not lake formed at red arrow due to glacier retreat after 1999.

Digital Globe image of Bachfallenferner in 2015. Note the lack of retained snowcover and the new lake that formed.


Ventisquero Grande Glacier, Chile Retreats; Not so Grande in 2017

Ventisquero Grande Glacier comparison in Landsat images from 1997 and 2017.  Red arrows mark the 1997 terminus, yellow arrows the 2017 terminus, purple dots the snowline and purple arrow the junction of the tributaries. 

Ventisquero Grande Glacier is at the head of Ventisquero Seno in the Cordillera Darwin of Tierra del Fuego.  The fjord is just west of Garibladi Fjord and opens into Darwin Channel.  Melkonian et al (2013) note widespread thinning of four large glaciers in the Cordillera Darwin Range from 2000-2011; Ventisquero Grande (CDI-08), Marinelli, Darwin and Roncagli, while the Garibaldi Glacier increased in volume.  Here we examine changes in the glacier using Landsat and Sentinel Images from 1997 to 2017.

In 1997 two tributaries merged 3.2 km upglacier of the terminus, purple arrow, terminating in a 1.8 km wide calving front, red arrows.  In 1999 there is limited retreat and the calving front has extended to 2 km in length.  The transient snowline is at 700 m in 1997 and at 550 m in 1999, purple dots.  By 2002 the southern end of the terminus has retreated exposing a shoal.  By 2017 the  two tributaries have separated, purple arrow.  Retreat of the glacier has been 2100 m on the north side, 2800 m in the center and 2000 m on the south side. Both of the termini are still calving and extensive crevassing immediately upglacier of the terminus indicates significant glacier velocities.  The calving front is 2.1 km wide in 2017.  As Simon Gascoin has noted the addition of Sentinel imagery has helped expand the potential for images that are relatively cloud free. Melkonian et al (2013) note velocities of less than 2 m/day until right near the terminus. The transient snowline in 2017 is at 800 m on March 28, 2017. 

Ventisquero Grande Glacier comparison in Landsat image from 1999 and Sentinel 2 image from 2017.  Red arrows mark the 1997 terminus, yellow arrows the 2017 terminus, purple dots the snowline and purple arrow the junction of the tributaries. 

Ventisquero Grande Glacier  in 2002 Landsat image. Red arrows mark the 1997 terminus, yellow arrows the 2017 terminus, purple dots the snowline and purple arrow the junction of the tributaries. 


Ventisquero Grande Glacier in Sentinel 2 image from 2017.  Red arrows mark the 1997 terminus, yellow arrows the 2017 terminus,  and purple arrow the junction of the tributaries. 

Blackfoot Glacier, Glacier National Park Slow Recession Indicates Persistence

Comparison of Blackfoot Glacier in August Landsat images from 1998, 2015 and 2017

Blackfoot Glacier is the second largest glacier in Glacier National Park in Montana.  The glacier is on the north side of Mount Blackfoot and is close to two other glaciers Harrison and Jackson.  Glacier National Park over the last decade has initiated and maintained an extensive glacier monitoring program led by Dan Fagre.  This program has led to consistent mass balance observations on Sperry Glacier, repeat photography and repeat mapping.  The repeat mapping indicates the area lost from 1966 to 2015 (Fagre et al, 2017).  They identified that all glaciers lost substantial area, with Blackfoot Glacier falling into a small category of  seven glaciers that lost less than 20% of their total area in the last 50 years.  The glacier currently has an area of 1.5 square kilometers, a reduction of 18% since 1966 (USGS, 2017).  NASA (2016) provides a comparison of the glacier in 1984 and 2016. Here we examine Landsat and Google Earth imagery to better understand the slower change observed on this glacier.  The area lost to retreat on Blackfoot Glacier is similar to that on Harrison and Rainbow Glacier

In 1998 glacier volume losses were significant in the region, but in mid-August Blackfoot Glacier was still more than 60 % snowcovered, a significant area of accumulation.  In 2005 another year of minimum mass balance in the region the glacier had more than 60% snowcover in mid-August. In 2015 glacier volume losses in the region were again large, with Sperry Glacier having a loss of -1.22 m. Blackfoot Glacier still retained a significant area of accumulation, with more than 60% snowcover.  In 2017 the glacier is more than 90% snow covered on 8/12/2017 indicating that the glacier continues to maintain a significant accumulation zone.  This indicates the glacier is not as vulnerable to warming and will allow the glacier to continue to persist until 2050 at least. The key to retention of snowpack is high accumulation rates on the glacier, this allows snowpack to persist. Glaciers that lack a persistent accumulation zone, cannot survive current conditions (Pelto, 2010).

Blackfoot Glacier in 2005 Google Earth imagery, with margin in orange.

Blackfoot Glacier in 2015 Google Earth imagery, with 2005 margin in orange.  Note the limited retreat in this period. 


Saleina Glacier, Switzerland Terminus Separation

Saleina Glacier comparison in 1985 and 2015 Landsat images.  The red arrow is the 1985 terminus, the yellow arrow the 2015 terminus and the purple dots the transient snow line in these August images. 

Saleina Glacier is south of Trient Glacier descending a steep eastward oriented valley from Aiguille d’Argentiere on the northern end of the Mount Blanc Range.  The Swiss Monitoring Network has maintained annual observations of the glacier front since 1878.  After a sustained retreat during the first half of the 20th century, the glacier advanced 215 m from 1964-1988.  From 1990 to 2015 the glacier retreated 640 m. 

Here we use Landsat imagery from 1985-2017 and Google Earth images to identify ongoing changes. In 1985 the glacier extended down valley to an elevation of 1850 m, just before the valley turns east.  After 2000 the lower 800 m of the glacier became debris covered, but up to at least 2009 remained crevassed indicating activity.  By 2015 this section of the glacier no longer has crevassing or glacier ice exposed at the surface and has essentially collapsed and is no longer part of the main glacier.  This is illustrated in a comparison of Google Earth images from 2011 and 2015.  Points A,B and C represent the same bedrock locations adjacent to the glacier.  The green arrows indicate a medial moraine on active ice in 2009 and what has become an ice cored moraine ridge without adjacent active ice in 2015.  In 2009 the blue arrows indicate areas of crevassing indicating active ice.  In 2015 the purple arrows indicate buried ice cored moraine as indicated by meltwater wetting the sediments.  The total retreat of the active front from 1985 to 2015 is 1250 m, with the active front at 2300 m.  The retreat has been driven by a rise in the end of melt season snowline. This amount of retreat is similar to that of adjacent Glacier du Tour

In 1985 the snow line in mid-August was at 2900 m, in 2015 in late August the snowline was at 3075 m and in late August of 2017 the snowline is at 3150 m.  The summer of 2003 is when the highest snowlines were reported across the western Alps  (Rabatel et al 2013). That summer of 2003 in mid-August the snowline on Saleina Glacier was at 3050 m in an August snowline comparison of Mont Blanc glaciers. This years snowline will likely end the year as high or higher than 2003, the extensive negative mass balance will drive further retreat.

The 2016 inventory of Swiss glaciers noted several with significant retreats due to separation of stagnant ice areas and active ice.  Saleina Glacier warrants being in this category.


Saleina Glacier in 2017 Landsat image.  The red arrow is the 1985 terminus, the yellow arrow the 2015 terminus and the purple dots the transient snow line on 8/26/2017.


Points A,B and C represent the same bedrock locations adjacent to the glacier in the 2009 and 2015 Google Earth images.  The green arrows indicate a medial moraine on active ice in 2009 and an ice cored moraine ridge without adjacent active ice in 2015.  In 2009 the blue arrows indicate areas of crevassing.  In 2015 the purple arrows indicate buried ice cored moraine as indicated by meltwater wetting the sediments.


Yellow arrows mark the end of the active ice in 2015 on Saleina Glacier. 


Record High Mont Blanc, France Glacier August Snow Lines 2017

Landsat image of the transient snow line on Mont Blanc Glaciers, France on 8/19/2017.  The average snow line (Purple dots) is at 3100 m.  Glaciers on Mer de Glace (M), Argentiere (A), Tour Glacier (L), Trient Glacier (T) and Saleina Glacier (S). 

This has been a warmer summer in the Alps with reports emerging of various summer ski areas that take advantage of glaciers closing early or adding snow guns to stay open, Molltal Glacier, Les2Alpes,, Stelvio Glacier  Here we compare in Landsat images the transient snow line on five Mont Blanc glaciers from 1985, 1988, 2003, 2014, 2015 and 2017.  The transient snow line is indicated with purple dots in each image.  A comparison of the transient snow line on Mont Blanc glaciers on 8/19/2017 to other years indicates it is already higher than all other years examined, but a month remains in the melt season. 

Rabatel et al (2013)  examined the equilibrium line altitude (ELA) of glaciers in the region from 1984-2010.  The ELA is the snowline at the end of the summer melt season.  The transient snow line is simply the snow line altitude on a specific day during the melt season. Rabatel et al (2013) found the average snow line of 3000 m on Trient Glacier, 2900 m on Tour Glacier, 2800 m on Argentiere Glacier and 2975 m on Saleina Glacier.  They also observed the maximum snowline occurred in the western Alps in 2003 with an average of ~3250 m, this average is higher than for just the Mont Blanc glaciers. 

On August 11, 1985 the snow line averages 2800 m on the five glaciers.  In 1988 on Sept. 12 the snowline averages 2900 m.  On August 5, 2003 the average snow line is at 3025 m.  On Sept. 12 2014 the average snow line is at 2850 m.  On Aug. 31, 2015 the average snow line is at 3050 m.  On Aug. 19th 2017 the average snow line is at 3100 m.  This is the highest observed August snow line on Mont Blanc. With several weeks to go the snow line is competition with 2003 for the highest snow lines on Mont Blanc glaciers in the last 50 years by the end of the melt season. 

Six and Vincent (2014) noted for Argentiere Glacier that for each 1 C rise in temperature the ELA rises 50 m.  The higher snow line in 2017 indicates a year of significant negative mass balance, which will further enhance retreat of the the Mont Blanc glaciers, such as Mer de Glace and Tour Glacier. 

Landsat image of the transient snow line on Mont Blanc Glaciers, France on 8/5/2003.  The average snow line (Purple dots) is at 3000 m.  Glaciers on Mer de Glace (M), Argentiere (A), Tour Glacier (L), Trient Glacier (T) and Saleina Glacier (S).

Landsat image of the transient snow line on Mont Blanc Glaciers, France on 8/11/1985.  The average snow line (Purple dots) is at 2800 m.  Glaciers on Mer de Glace (M), Argentiere (A), Tour Glacier (L), Trient Glacier (T) and Saleina Glacier (S).


Landsat image of the transient snow line on Mont Blanc Glaciers, France on 9/12/1988.  The average snow line (Purple dots) is at 2900 m.  Glaciers on Mer de Glace (M), Argentiere (A), Tour Glacier (L), Trient Glacier (T) and Saleina Glacier (S). 

Landsat image of the transient snow line on Mont Blanc Glaciers, France on 9/12/2014.  The average snow line (Purple dots) is at 2850 m.  Glaciers on Mer de Glace (M), Argentiere (A), Tour Glacier (L), Trient Glacier (T) and Saleina Glacier (S). 

Landsat image of the transient snow line on Mont Blanc Glaciers, France on 8/31/2015.  The average snow line (Purple dots) is at 3050 m.  Glaciers on Mer de Glace (M), Argentiere (A), Tour Glacier (L), Trient Glacier (T) and Saleina Glacier (S).