Calbuco Volcano Glaciers, Chile

Calbuco Volcano in Chile erupted this week.  It has been noted that significant pyroclastic flows/lahars have been observed travelling down the Rio Blanco fed in part by glacier melt.  Here we examine the glaciers on Calbuco.  We start with a 2012 Google Earth image that provides the clearest view.  There are three primary glaciers, the main summit ice cap , a glacier below the western rim, that is not significantly connected to the main ice cap in 2012 and a glacier descending the southwest flank.  There are numerous wind sculpted features observed from north-northeast to south-south west that also align with the flank glacier, blue arrows.  

The extent of retained snowcover in 2012 is quite poor, purple dots which would lead to significant mass balance loss and thinning. There are two locations of expanding bedrock exposure with glacier thinning, red arrows.  A review of available satellite imagery indicates that most years the summit ice cap retains good snow pack, but not in recent years with  2012, 2014 and 2015 having limited snowpack. The 2015 image is from March 26th just four weeks before the eruption. As in 2012 the glacier had lost almost all of its snowpack and was experiencing a large volume loss in 2015. This post will be updated with post eruption Landsat imagery when clear view is available. The last image in the post is from 4/27/2015 with the eruption ongoing, whether the glacier is completely gone or buried in ash impossible to discern.

calbuco glacier ge

2012 Google Earth image of Calbuco Volcano glaciers.

An examination of satellite imagery from 1985, 1998 and 2000 indicate this.  Since the majority of the glacier is right at the summit the eruption will lead to the loss of this glacier. Given the size of the main summit ice cap glacier, area of 0.95-1.05 square kilometers, a range of volume scaling method provides a volume estimate of 0.02 cubic kilometers of ice (Grinsted, 2013). The volume of glaciers has likely been limited by the frequency of eruptions in the last two centuries,; however, the volume has not been sustainable with current climate. The two main rivers draining the southwest flank glacier and summit ice cap drain south to Lago Chapo, yellow arrows. The volume of water is limited and since it is early fall snowpack on the mountain was limited as well. The lahars from glacier melt cannot match those frequently seen in Iceland such as with Eyjafjallajökull.

calbuco 2015
March 26, 2015 satellite image.

calbuco 1985

1985 Landsat image
calbuco 1998
1998 Landsat image

calbuco 2000
2000 Landsat image

calbuco 2014
2014

calbuco lago chapo
Google Earth image

calbuco4272105
Landsat image 4/27/2015

North Leones Glacier Retreat and new Landslide, Patagonia, Chile

Jill Pelto, my daughter returning from fieldwork with UMaine in the Falkland Island took a picture last week out the plane window of Leones Glacier of the northern Patagonia Icefield. The picture illustrated two changes worth further examination, and the fact that if you have a glacier picture that you would like more information on let me know. The picture indicates outlet glaciers of the Northern Patagonia icefield fed by the snowcovered expanse.  Also evident is a large landslide that is both fresh and that I knew had not been there before, orange arrow,and it showed a new lake had formed due to retreat of the glacier north of Leones Glacier, red arrow, hereafter designated North Leones Glacier. The landslide extends 2 km across the glacier and is 3 km from the terminus. Here we use 1985 to 2014 Landsat imagery to identify changes in North Leones Glacier and the landslide appearance.

npi tri glacier
Jill Pelto took this picture on March 13th, 2015

In 1985 there are medial moraines on the glacier surface, but no large landslide deposit. The Northern Leones Glacier terminates on land, red arrow. A distributary terminus almost connects with another glacier to the north at the yellow arrow. In 1987 there is little evident change from 1985. By 2002 a small lake is beginning to form at the terminus of Northern Leones Glacier. By Feb. 2014 a substantial lake has formed at the end of the North Leones Glacier. There is considerable separation between the distributary terminus at the yellow arrow and the next glacier. There is no landslide deposit either. Google Earth imagery indicates the lack of a landslide deposit as well. A closeup of the terminus of North Leones Glacier in 2013, with Google Earth imagery, indicates ogives (blue arrows), which are annually formed due to seasonal velocity changes through an icefall. In January 2015 the landslide deposit is evident, extending about 2 km across Leones Glacier and 3 km from the terminus. The North Leones Glacier has retreated 700 meters from 1985-2015. The retreat of the distributary terminus indicates thinning upglacier of the icefall on North Leones Glacier. The landslide adds mass to Leones Glacier, which will lead to a velocity increase. The debris is thick enough to reduce melting in this portion of the ablation zone. The velocity of this glacier is indicated by (Mouginot and Rignot, 2015) as 200-400 meters per year, indicating that for the next decade at least this landslide will impact the lower Leones Glacier. (Willis et al, 2012) identify thinning of the Leones Glacier area around 1 m per year, which will be reduced on the landslide arm of the glacier.
(Davies and Glasser, 2012), indicate that this region experienced increased area loss from 1986-2011.  Lago Leones feeds the Leones River which is also fed by the retreating General Lago Carerra Glacier.

leones glacier 1985
Landsat image 1985

leones glacier 1987
Landsat image 1987

leones galcier 2002
Landsat image 2002

leones glacier 2014
Landsat image 2014

leones north ge
Google Earth Image 2010

leones landslide
Google Earth image 2013

Leones Glacier 2015
Landsat image 2015

Downwasting Tributary-Glacier Dammed Lake Formation at HPN4 Glacier, Patagonia, Chile

We often are more concerned with what is happening at the terminus of a glacier; however, often key changes are happening up glacier some distance. This is the case with the following example. The Northern Patagonia Icefield (Hielo Patagónico Norte, HPN) is one of the two main icefields in Patagonia.  The remoteness of the region is evidenced by the number of significant lakes and glaciers that remain unnamed.  This remoteness has led to several valuable detailed recent studies utilizing satellite imagery on glacier extent (Davies and Glasser, 2012), glacier thickness change (Willis et al, 2012) and glacier velocity (Mouginot and Rignot, 2015)  Here we focus on a downwasting tributary to an unnamed glacier listed as HPN4 Glacier  in the aforementioned studies. Davies and Glasser, (2012)  identify this region of the icefield as retreating faster from 2001-2011 than during any measured period since 1870.    Willis et al, (2012) in their Figure 2, seen below,  identify this an area of pronounced thinning, approximately 5 m/year from 2000 to 2011. Why such rapid thinning in an area without calving?   Mouginot and Rignot, (2015) indicate that this area is not an area of rapid flow, and given the thinning it should be an area of diminishing flow.  Here we examine changes from 1987 to 2014 using Landsat imagery.

HPN4-map

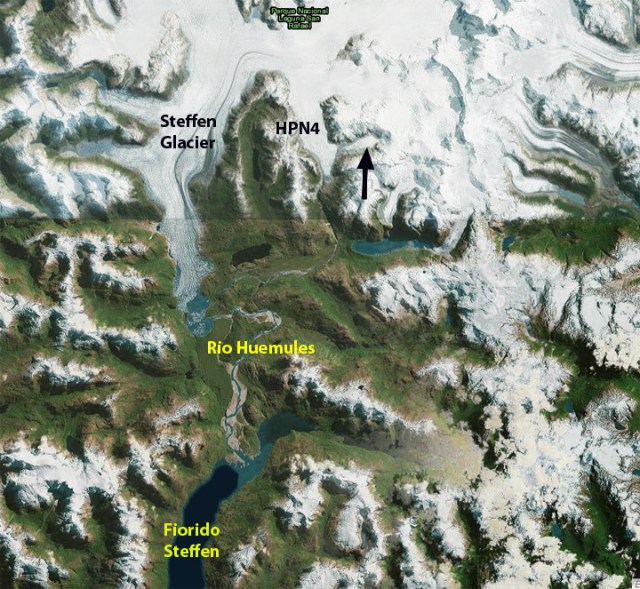
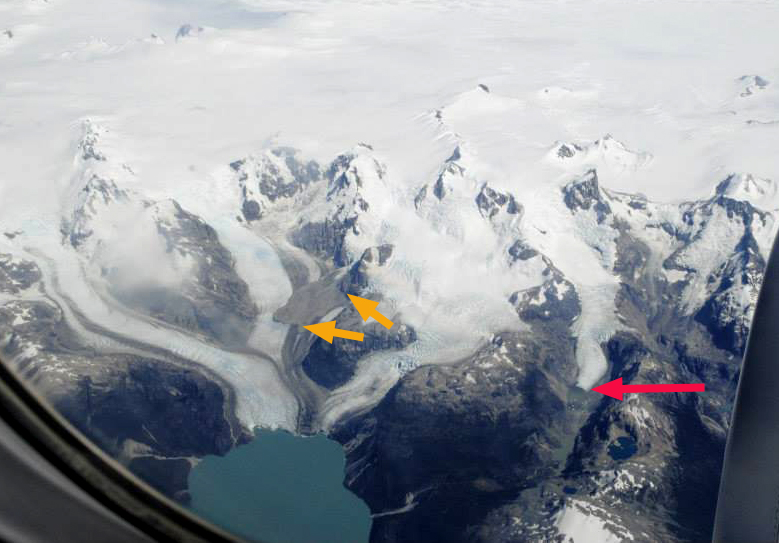
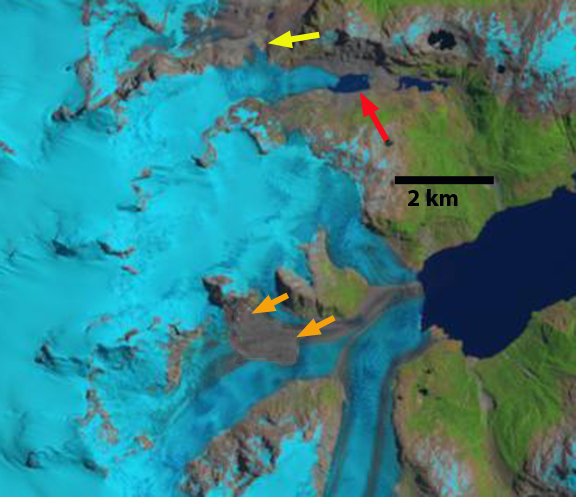
Digital Globe image of southern section of Northern Patagonia Icefield, with black arrow indicating downwasting tributary from the east flowing into HPN4 Glacier.

npi thinning

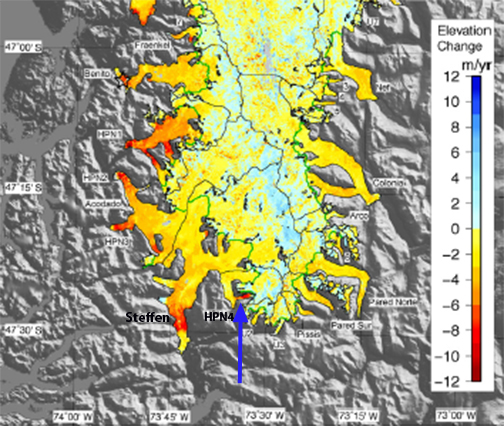
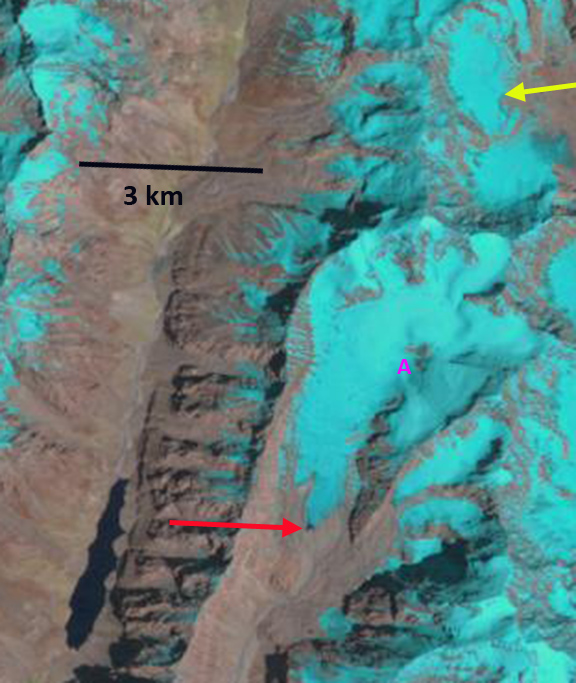
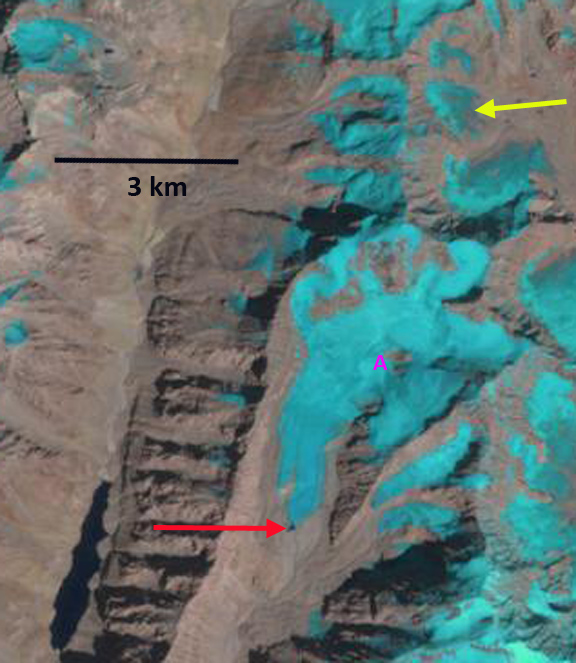
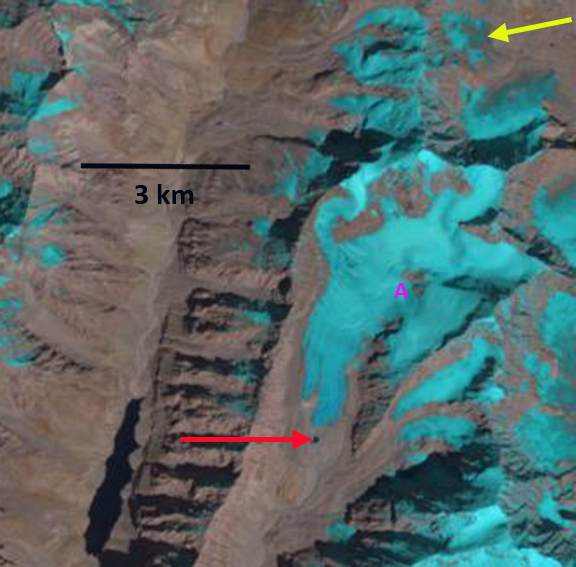
Figure 2 from Willis et al (2012) indicating thinning of NPI glaciers from 2000-2011, the blue arrow indicates the downwasting tributary of interest flowing into HPN4 Glacier from the east.

hpn4 flow

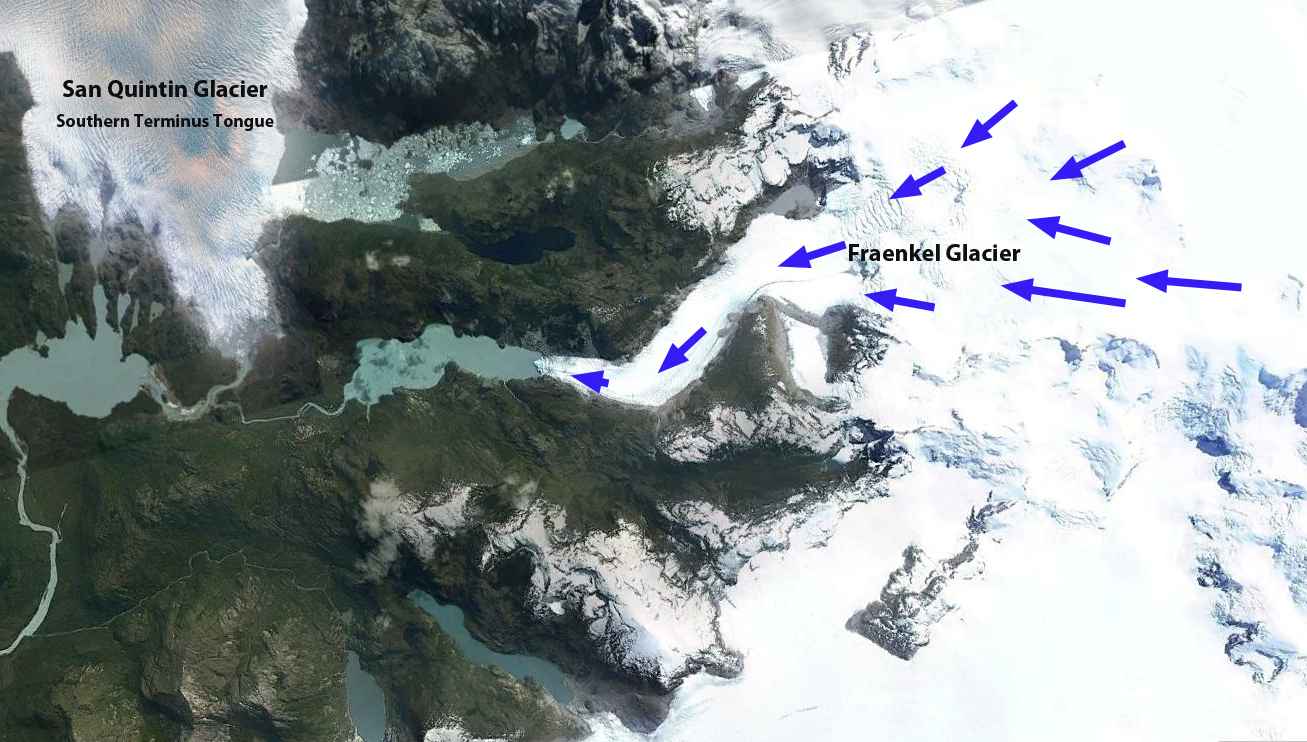
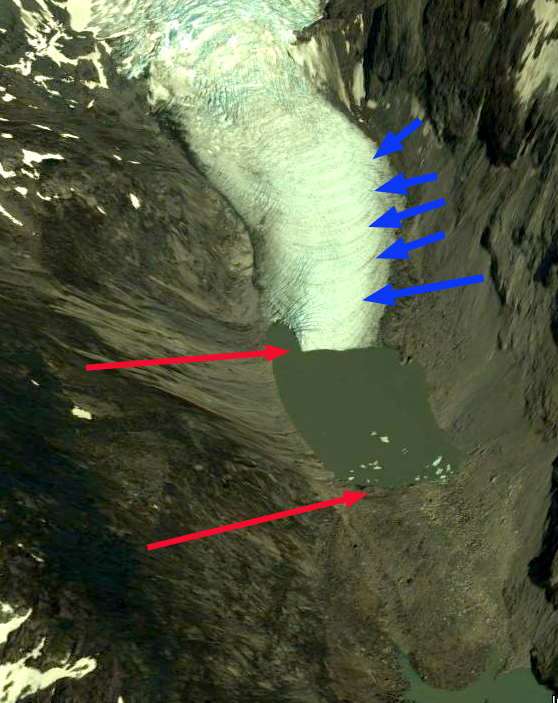
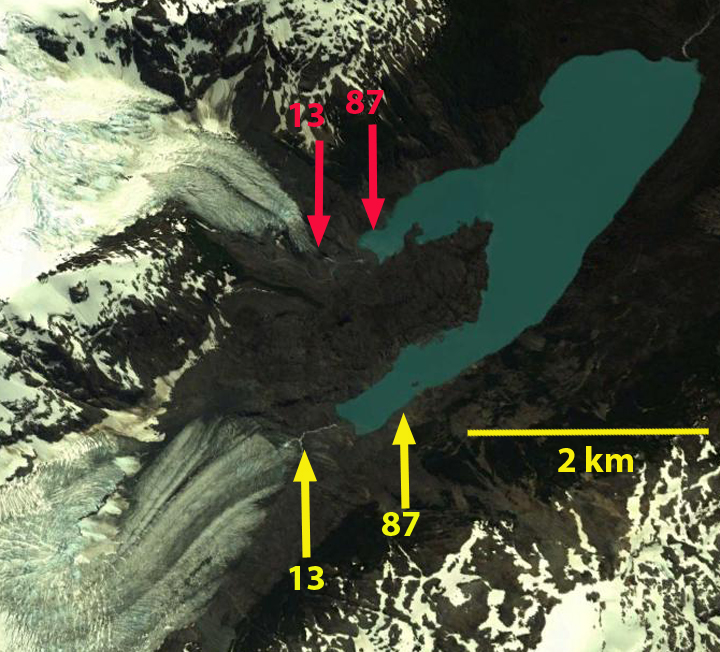
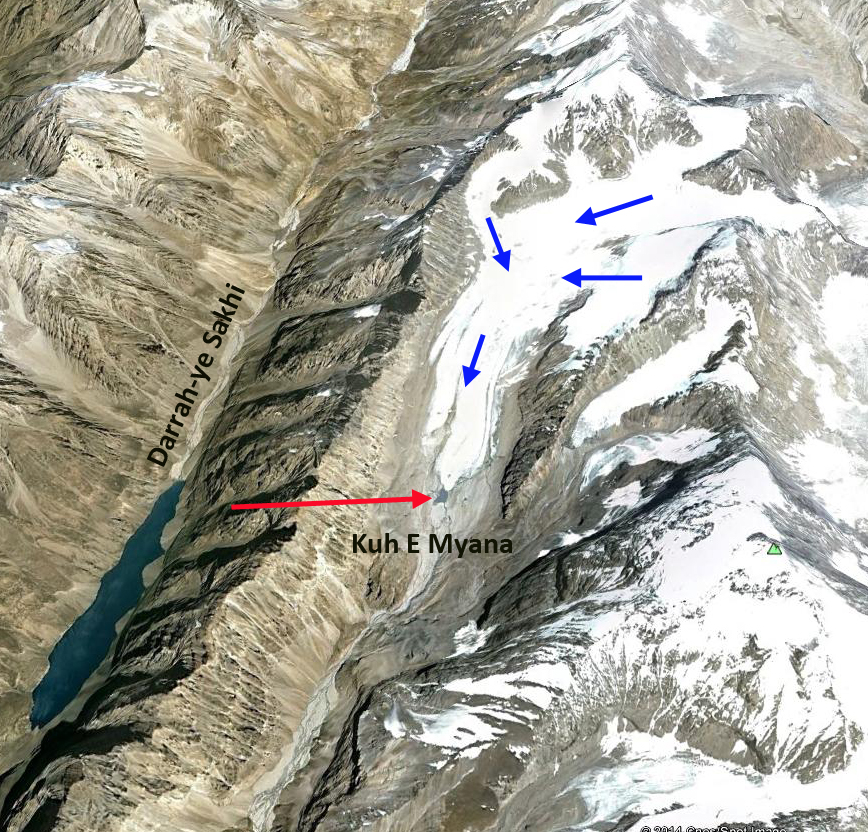
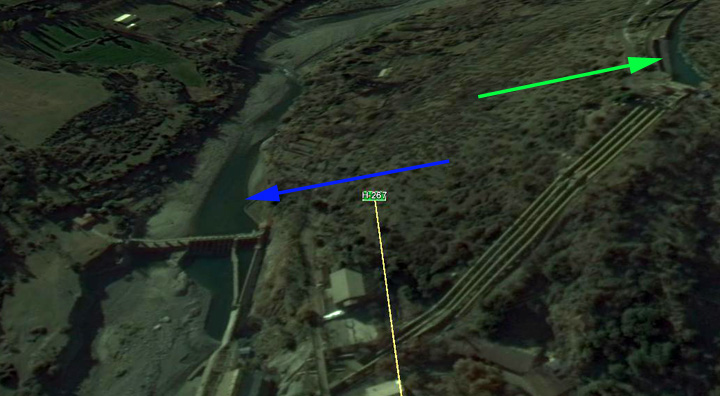
Ice Flow direction for HPN4 Glacier and the downwasting tributary (DT).   The flow diagram above indicates the converging flow of the downwasting tributary and HPN4, that meet at the medial moraine.

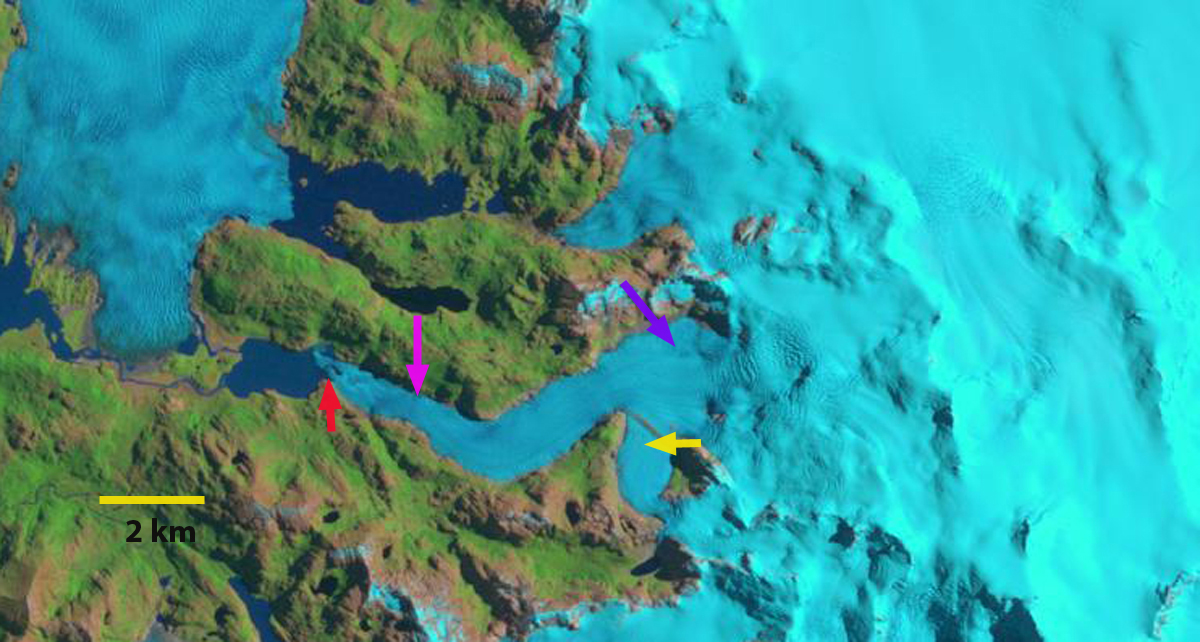
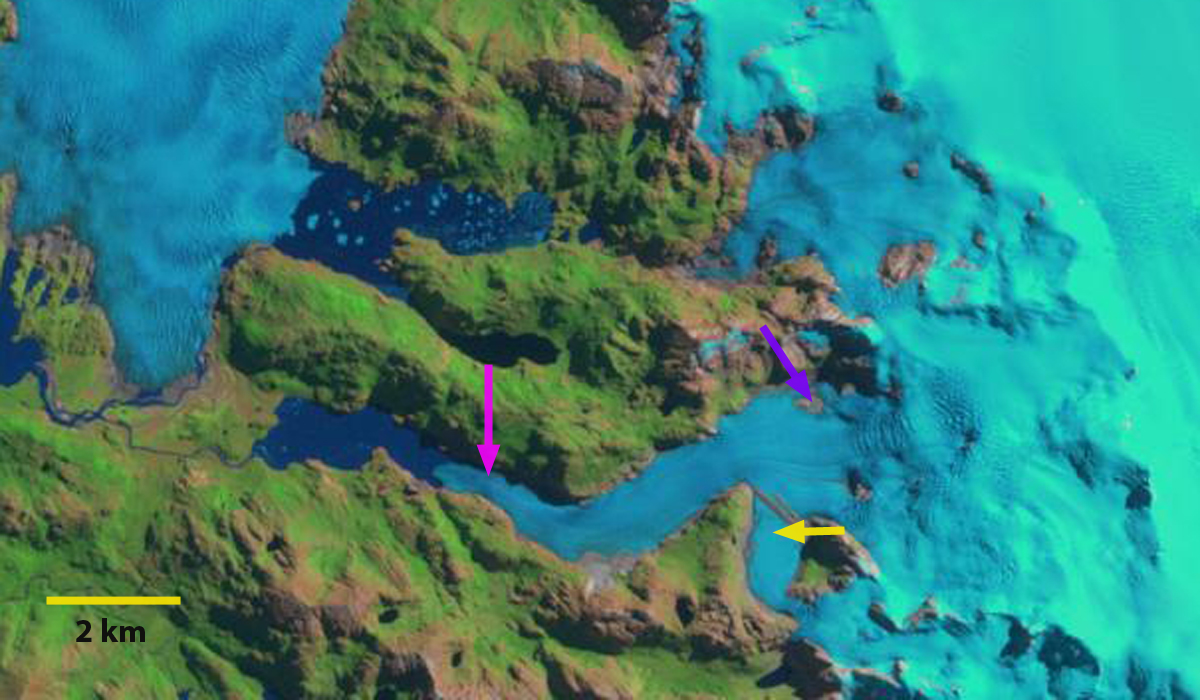
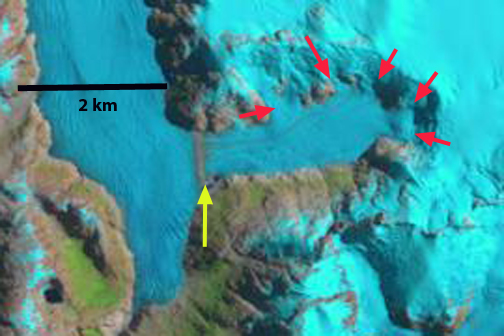
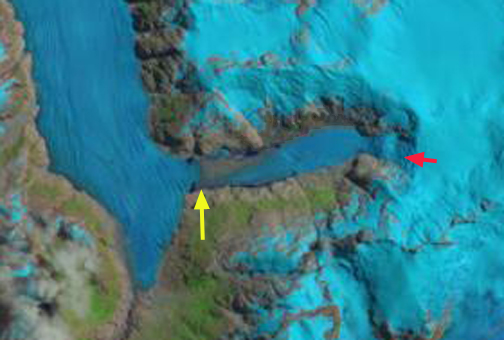
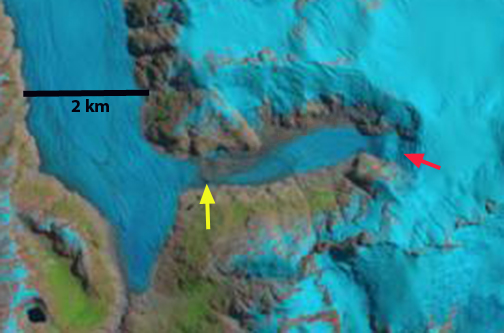
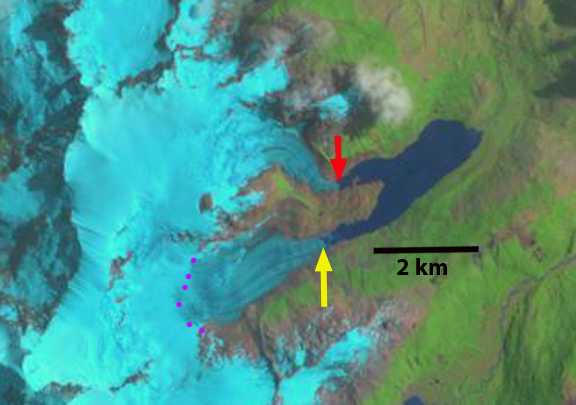
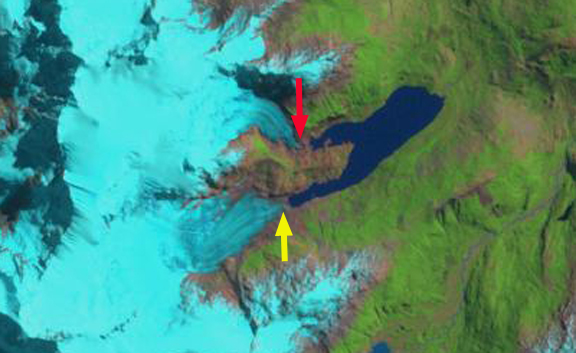
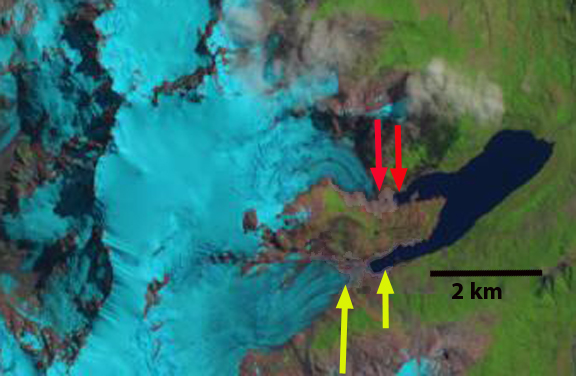
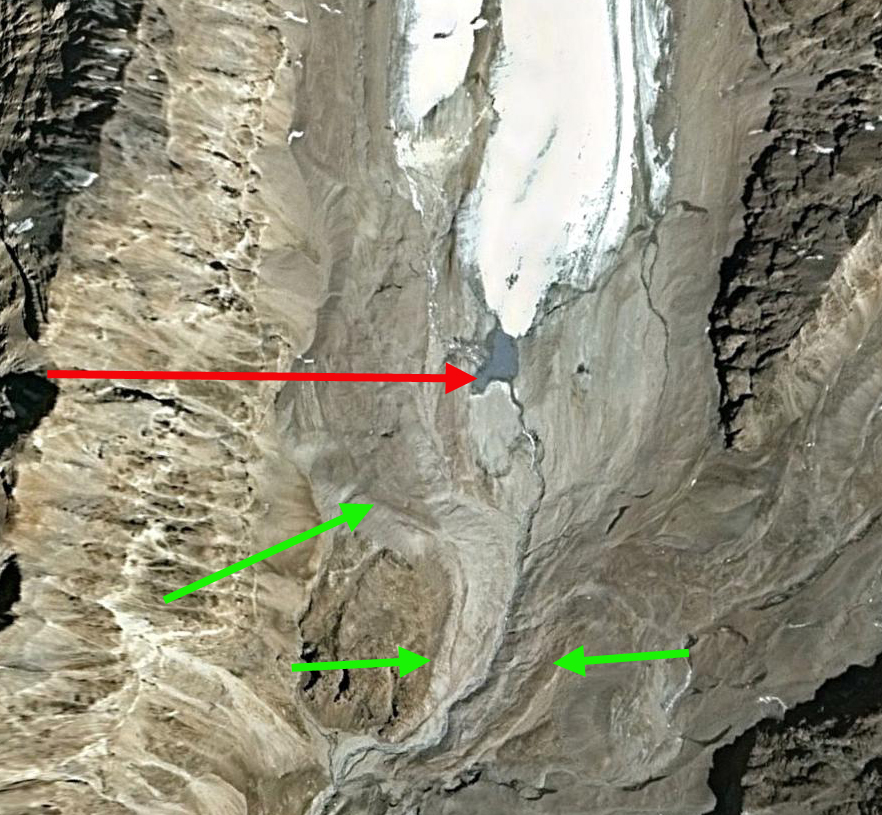
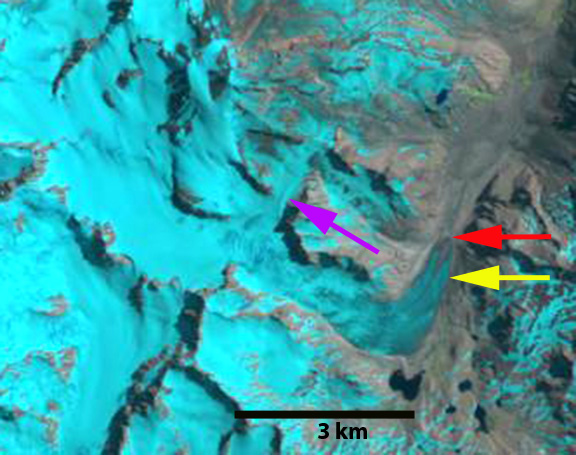
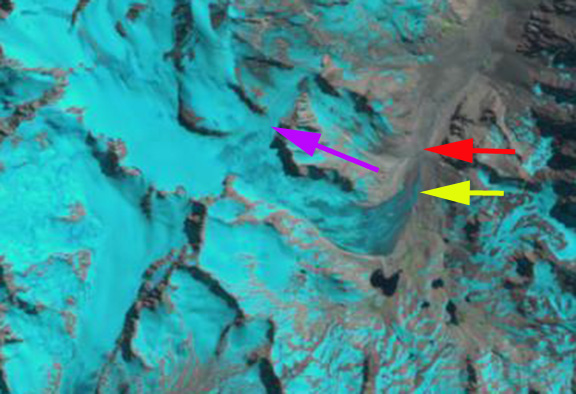
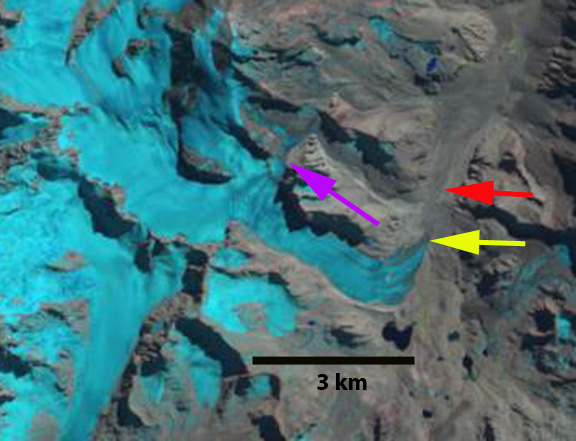
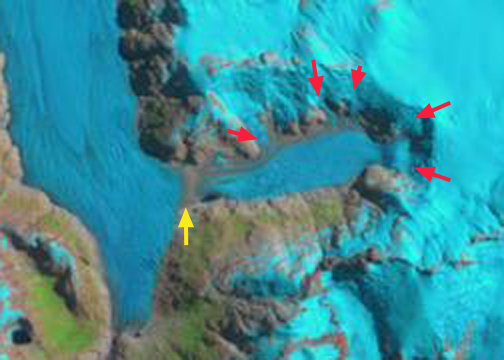
In 1987 there are five contributing glacier tongues to the downwasting tributary, each indicated with a red arrow.  It is like a bathtub being filled with five taps at once.  The yellow arrow indicates a medial moraine at the mouth of the valley, signalling the lack of current contribution of the downwasting tributary to HPN4 Glacier.  By 2004 only three of the contributing glacier tongues still merged with the downwasting tributary, and two of these are much more tentative.  The medial moraine has shifted east indicating that the main HPN4 Glacier is now flowing into the valley instead of the downwasting tributary being a contributing tributary to HPN4.  By 2014 there is only one contributing glacier tongue to the downwasting tributary, only one tap for this draining bathtub, the other four contributing tongues have retreated from contact with the downwasting tributary.  The medial moraine has spread eastward and some fringing proglacial/subglacial lakes are evident.  In 2015 the only change is that the rifting near the medial moraine is more pronounced.  A closeup 2013 Digital Globe image indicates both fringing ponds-blue arrows, rifts caused by varying flotation-green arrows and expanding supraglacial ponds, red arrows.  The rifts are a sign of instability and typically lead to break up of  this portion of the terminus. The downwasting tributary continues to demise faster than HPN4 Glacier, which crosses the valley mouth, hence it is likely that a glacier dammed lake will form and that HPN4 Glacier will continue to flow further east up this valley, which could offset some of the downwasting and lake development.  In either case this redirected flow of HPN4 into a high ablation valley, will help encourage a faster retreat of the main terminus. How large the lakes gets and how much of the time it is filled are difficult to speculate upon.  Analogs for this type of lake are seen at. Allemania Glacier (Lago Martinic) and Baird Glacier (Witches Cauldron) .  Schaefer et al (2013) discuss the HPN4 Glacier because the main terminus has changed little given its modelled mass balance, and the modelled mass balance to the east appears too negative, which they suggest indicates wind redistribution from the HPN4 to the Pared Sud Glacier just east.  That is a challenge to sort out without some ground truth.

hpn-4 1987

1987 Landsat image

hpn-4 2004

2004 Landsat image

hpn-4 2014

2014 Landsat image-not the fringing blue indicating trapped sub-glacial/proglacial lake.

hpn-4 2015

2015 Landsat image

hpn4-ge


Google Earth image 2013

Cordillera Lago General Carrera Glacier Retreat, Chile

You know southern Chile has lots of glaciers when an icefield with an area of 132 square kilometers has no named glaciers.  Davies and Glasser (2012) referred to this icefield as Cordillera Lago General Carrera, since it drains into that lake, the icefield is just east of the Northern Patagonia Icefield.   Davies and Glasser (2012)  noted that the icefield has a mean elevation of 1670 m and has declined from an area of 190 square kilometers in 1870, to 139 square kilometers in 1986, and 132 square kilometers in 2011.  They further noted that the area loss of Patagonia glaciers has been most rapid from 2001 to 2011.  Paul and Molg (2014) observed a more rapid retreat of 25% total area lost from glaciers in northern Patagonia from 1985-2011, the study area was north of the Northern Patagonia Icefield. Lago General Carrera drains into the Baker River, which is fed by most glaciers on the east side of the Northern Patagonia Icefield.  This river had a series of proposed hydropower projects that have now been cancelled by the Chilean government.

clcg

Here we examine Landsat imagery from 1987 to 2014 to identify the changes in a pair of outlet glaciers that drain the eastern side of the icefield, images below. In 1987 both outlet glaciers terminated in an unnamed lake that drains into the Leones River. The southern glacier is 5.5 km long beginning at 2400 m and terminates at the yellow arrow, with the snowline marked by purple dots, in the images below.  The northern glacier is 5.0 km long beginning at 2200 m with the terminus at the red arrow. In 1987 the glaciers were in shallow enough water  that calving was limited and no icebergs are evident. By 2001 both glaciers are no longer terminating in the lake.  The retreat can no longer be enhanced by calving into the lake.  By 2014 both glaciers have retreated several hundred meters from the lake.  It is easier to measure the retreat in the 2013 Google Earth image.  The retreat from the 1987 to 2013 position are indicated by the pair of arrows.  The northern glacier has retreated 400 m and the southern glacier 600 m from 1987 to 2013.  In both cases this is approximately 10% of the glacier length.  The beautiful green color of the lake is indicative of the contribution of glacier flour from actively moving and eroding glaciers.  This glaciers retreat is similar to that of the nearby Nef Glacier and Verde Glacier.

clgc 1987
1987 Landsat image
clgc icefield 2001

2001 Landsat image
clgc 2014

2014 Landsat image

clgc ge 2013
2013 Google Earth image.  With arrows indicating terminus change from 1987 to 2013.

Kuh-E Myana Glacier Retreat, Afghanistan

Kuh-E Myana Glacier is in Hindu Kush Range in Badakhshan Province of northeast Afghanistan.  This region of the Hindu Kush has not been the focus of detailed glacier study. Northeast of Takhar Province in the Wakhan Corridor a group of glaciers was examined by Umesh Haritashya and others (2009) and found 28 of thirty had retreated. Examples are Zemestan Glacier and Tchap Dara Valley. The Hindu Kush follows the pattern of the high mountains of central Asia including the Himalaya
Kuh E Myana map
kuhemyana ge
2004 Google Earth image
Here we examine the changes of the glacier from 1998-2014 using Landsat imagery.  In 1998 the glacier ended in a small proglacial lake, red arrow.  A nunatak is at Point A. In 2002 the glacier still reaches the edge of the proglacial lake.  A small niche glacier is indicated by the yellow arrow.  The 2004 Google Earth image indicates an expansion of the proglacial lake, and that the glacier terminus is quite thin.  By 2014 the glacier has retreated 250 from the proglacial lake, red arrow. The majority of this retreat has occurred in the last decade. The glacier has retreated 1200 m from the Little Ice Age moraines to the 2004 terminus, green arrows on 2004 terminus image.  The retreat since 2004 is much faster than the overall retreat. The nunatak at Point A has expanded.  The niche glacier at the yellow arrow has developed a pair of substantial bedrock gaps as the thinning glacier disappears. kuhemyana 1998
1998 Landsat image
kuhemyana 2002
2002 Landsat image
kuhemyana terminus
2004 Google Earth Image
kuhemyana 2014
2014 Landsat image

Cortaderal Glacier Retreat, Chile

Cortaderal Glacier is in central Chile on the south slope of Paloma a stratovolcano. The glacier feeds the Cortaderal River which joins the Cachapoal River. Pacific Hydro has opened a new hydropower plant at Chacayes that is fed by this and other glaciers. It is a 111 MW run of river project with water taken out at a small dam run through a canal a small reservoir and back into the river. There is an older Coya Hydropower Plant a short distance downstream. Pacific Hydro plans to add several more plants in the area.  Continued glacier retreat in the regions will lead to further glacier runoff declines during the melt season.cortaderal ge 2007
Cortaderal Glacier Google Earth image

chacayes intake
Chacayes Hydropower intake and canal

chacayes canal
Chacayes Hydropower Canal and Reservoir

coya hydro
Coya Hydropower Plant
La Quesne et al (2009) reported a that Cortaderal Glacier retreated 110 m from 1970-2000 and 450 m from 2000-2007. Here we use satellite imagery from 1990-2014 to observe this retreat and more recent changes. In each image the red arrow is the 1990 terminus the 2014 is marked by a yellow arrow and the purple arrow a smaller side glacier feeding a secondary terminus. In 1990 the glacier after descending turned north in the main river valley and extended 1 km north. The side glacier has a significant width of 300 m. By 2000 the glacier had retreated 300 m and with a high snowline the connection to the secondary terminus at the purple arrow is narrowing but still significant. In 2003 further change is hard to discern. In 2013 substantial further retreat has occurred, the snowline is high at 3800 m and the secondary terminus connection is nearly gone. By 2014 the retreat since 1990 is 800 to 900 m, the snowline is at 3700 m and the secondary terminus connection is to narrow to actually feed glacier ice.  The retreat here is similar to that of nearby Glaciar del Humo, Argentina.  The Laboratorio de Glaciologia in Valdivia, Chile, Rivera et al (2002), has noted the extensive retreat of the Central Chile glaciers over the last four decades.
cortaderal 1990
1990 Landsat image
cortaderal 2000
2000 Landsat image
cortaderal 2003
2003 Landsat image
cortaderal 2013
2013 Landsat image
cortaderal 2014 2014 Landsat image