San Quintin Glacier, Chile terminus disintegration 1987-2015

san quentin compare

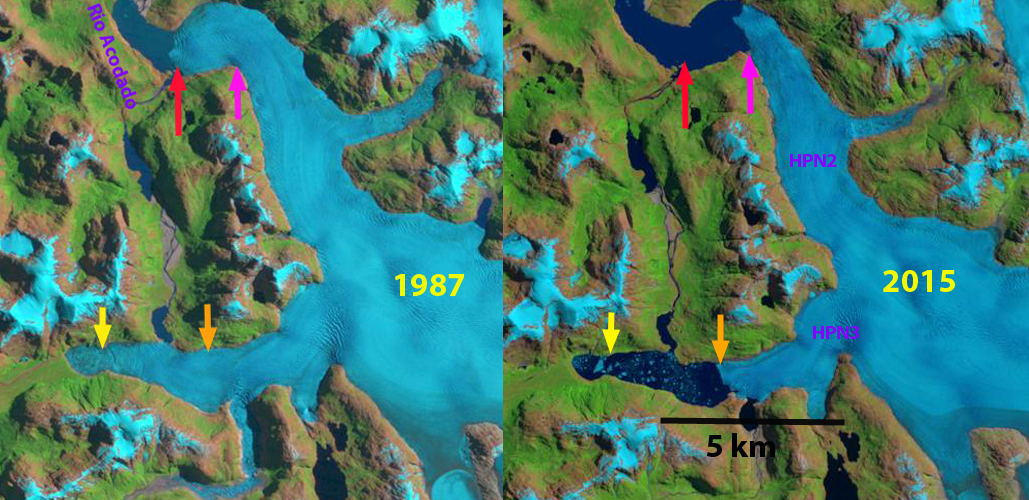
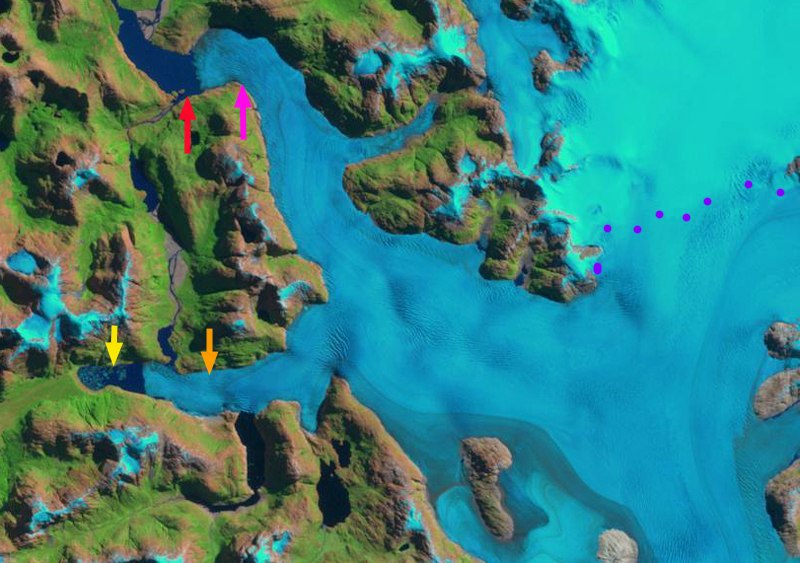
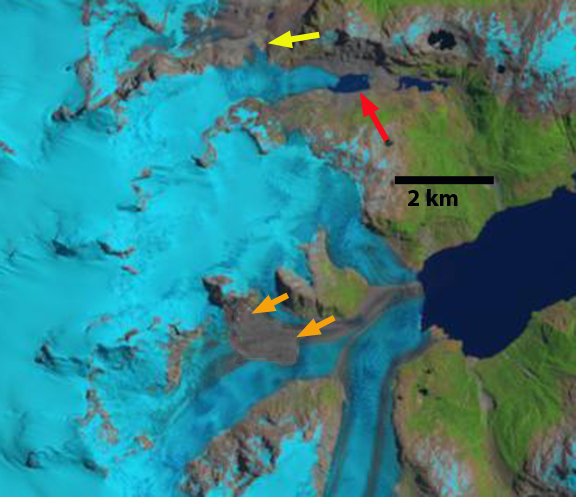
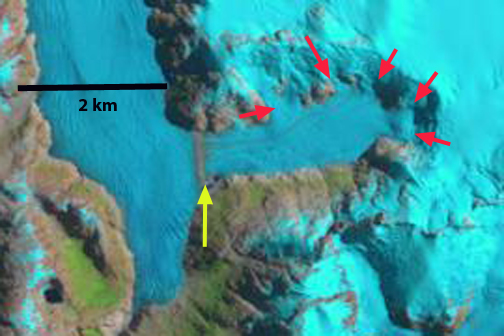
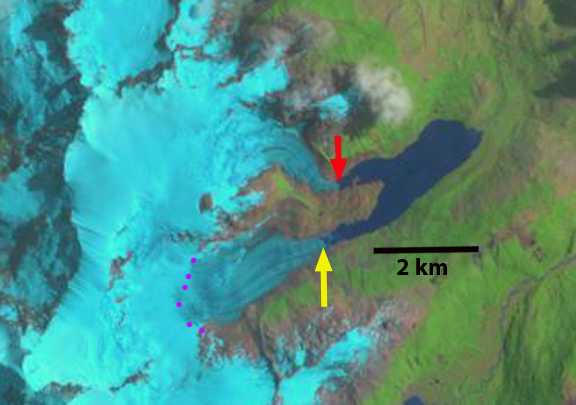
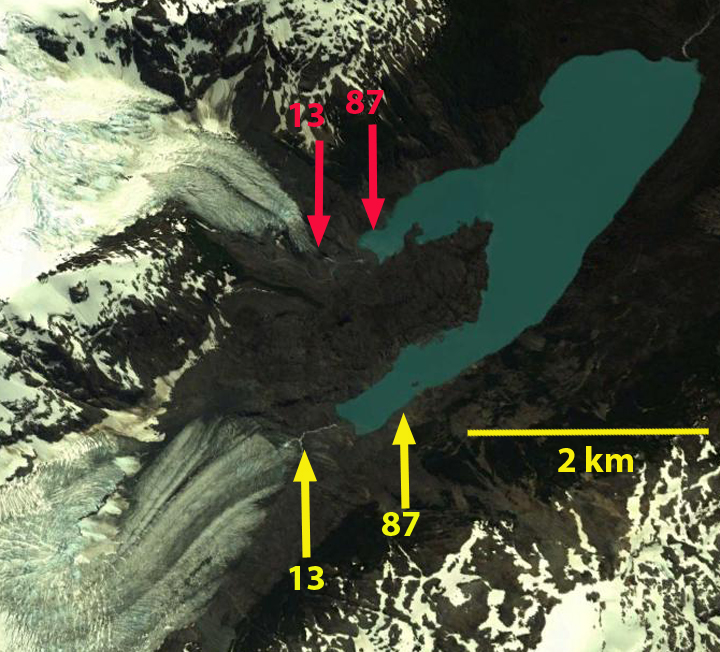
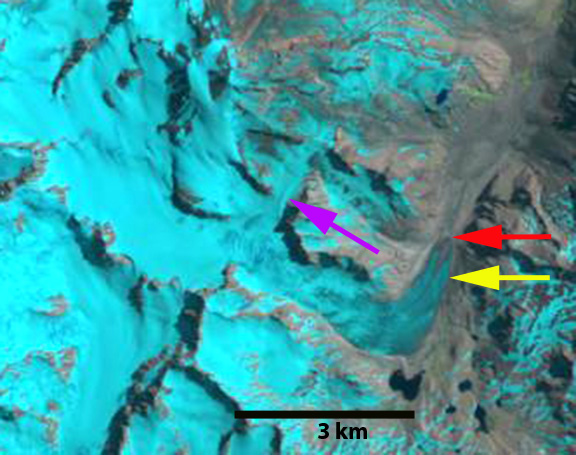
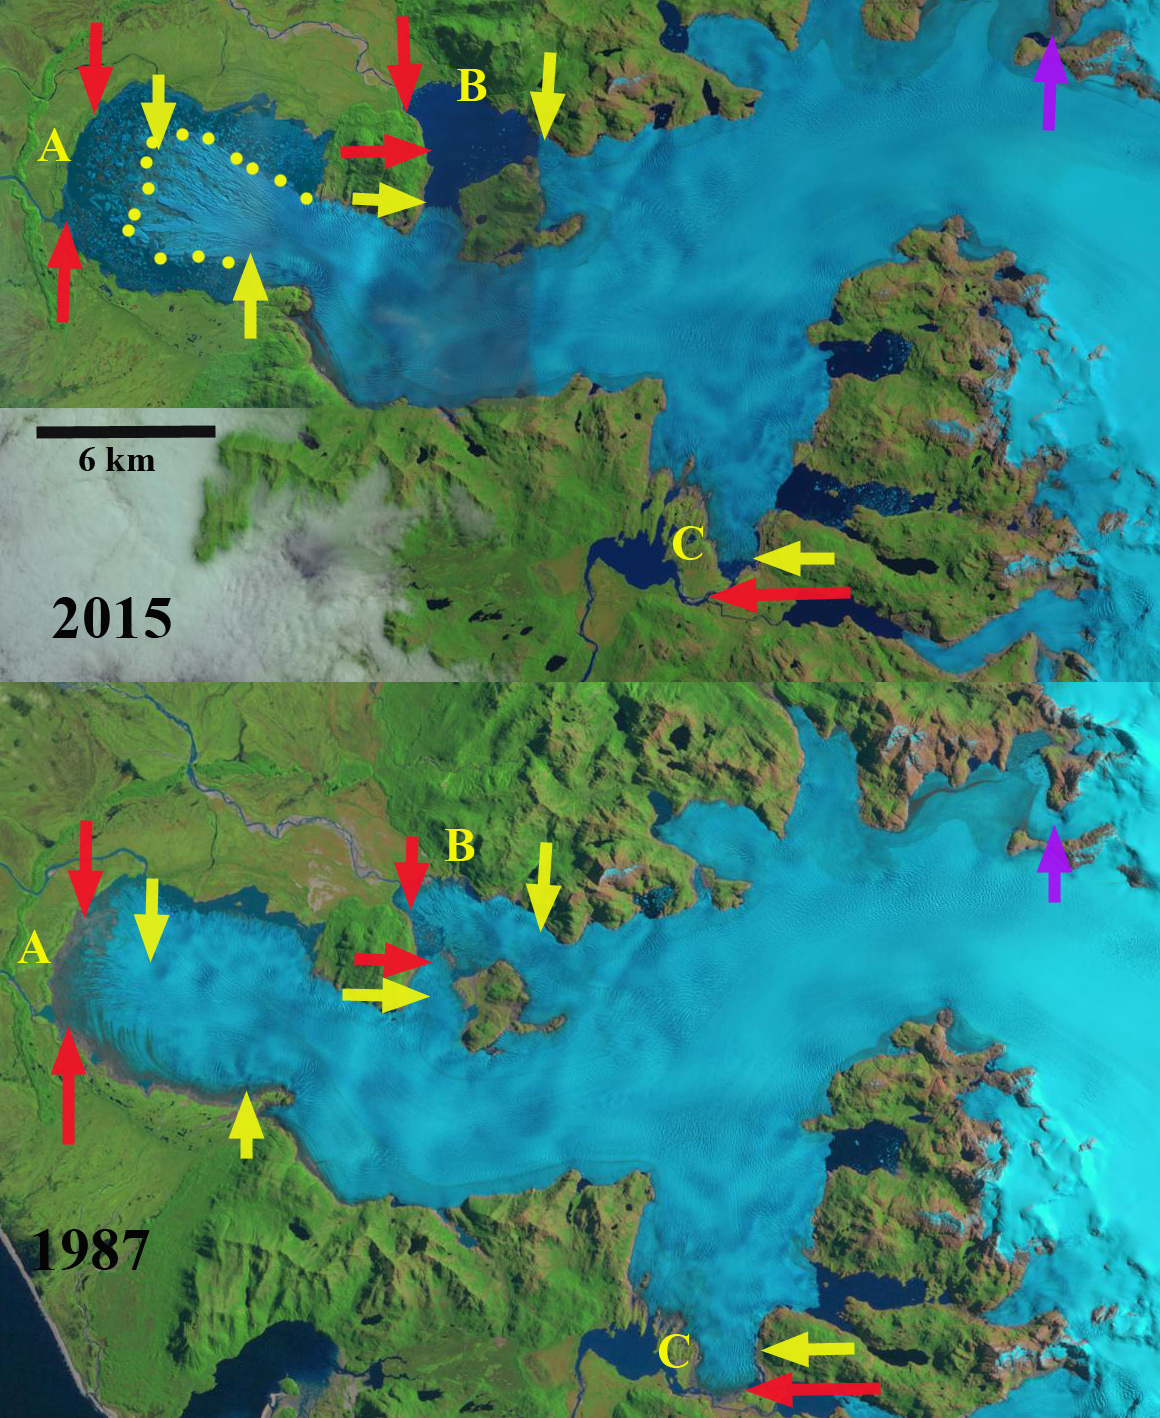
Landsat comparison of San Quintin Glacier in 1987 and 2015: red arrow indicates 1987 terminus location, yellow arrow indicates 2015 terminus location of the three main termini, and the purple arrow indicates upglacier thinning.

San Quintin is the largest glacier of the NPI at 790 km2 in 2001 (Rivera et al, 2007).  The glacier extends 50 km from the ice divide in the center of the ice cap.  The peak velocity is 1100 m/year near the ELA (Rivera et al 2007), declining below 350 m/year in the terminus region.  The velocity at the terminus has increased from 1987 to 2014 as the glacier has retreated into the proglacial lake (Mouginot and Rignot, 2015).  The high velocity zone extends more than 40 km inland an even greater distance than at San Rafael (Mouginot and Rignot, 2015).  Thinning rates in the ablation zone of the glacier are 2.3 m/year (Willis et al, 2012).  The glacier has a low slope rising 700 m in the first 22 km. The low slope, broad piedmont lobe and many distributary terminus lobes is like the Brady Glacier, Alaska.

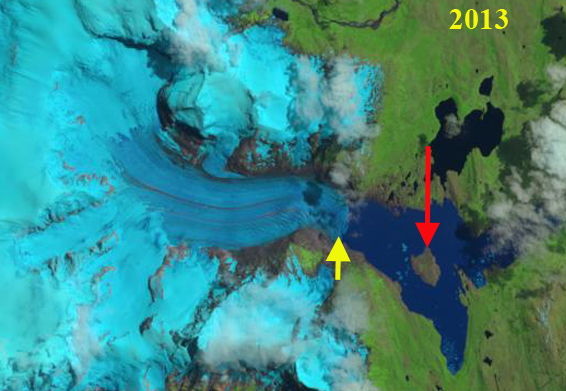
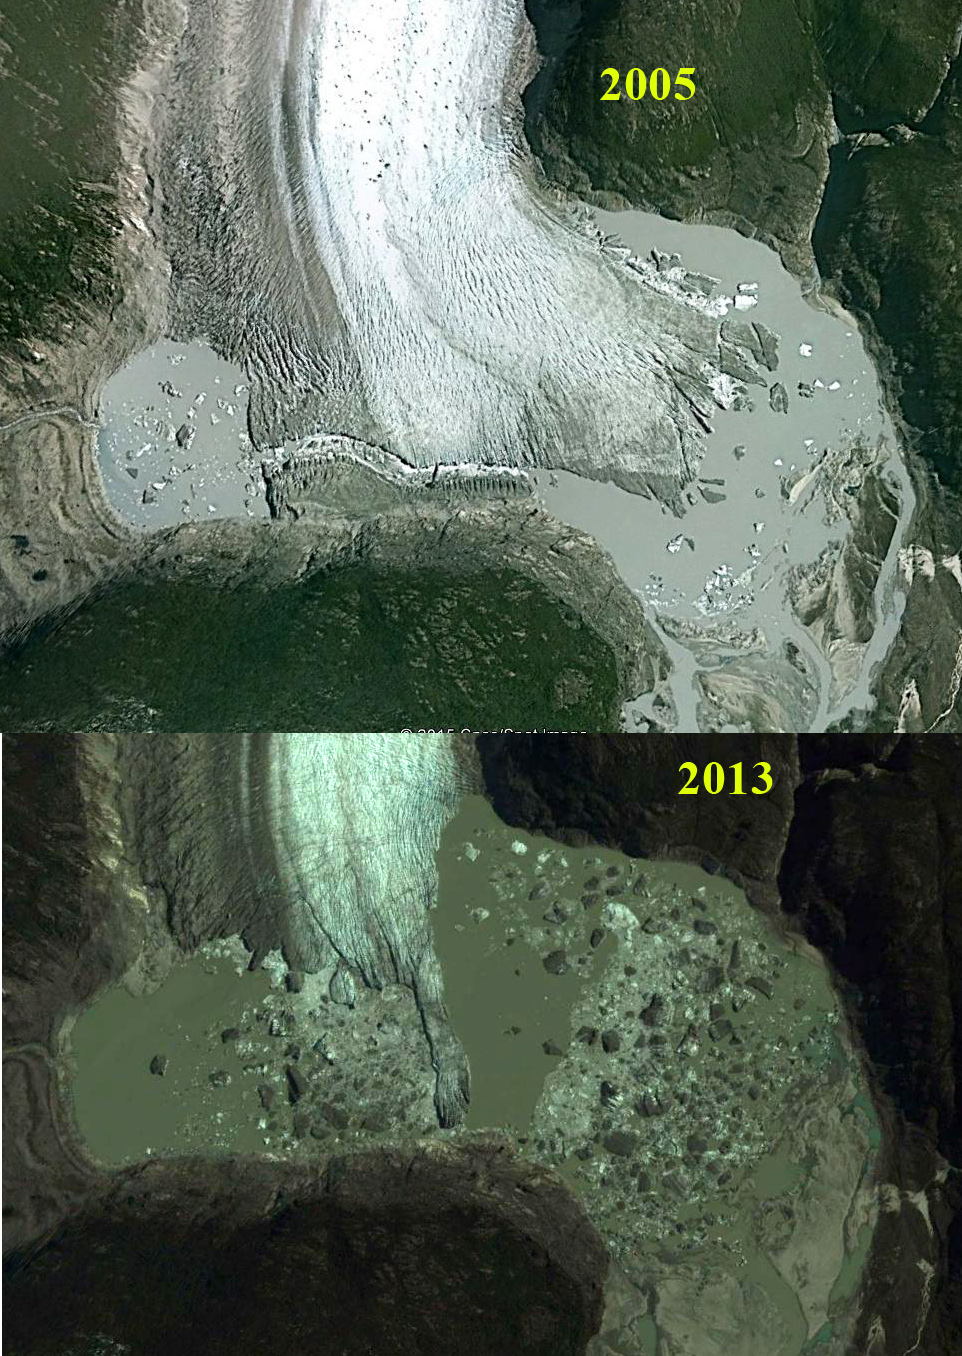
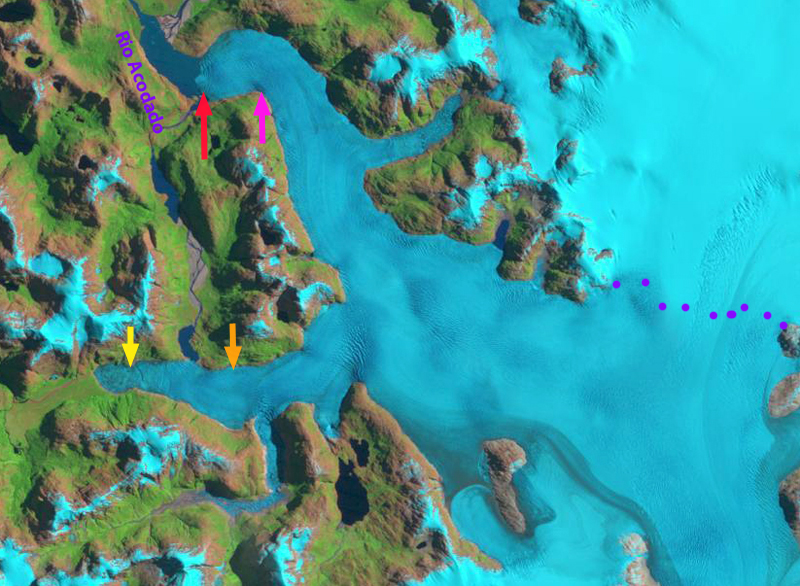
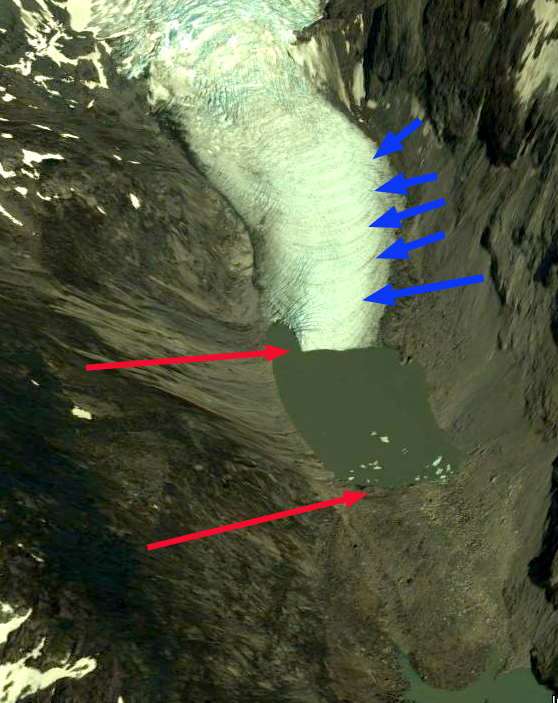
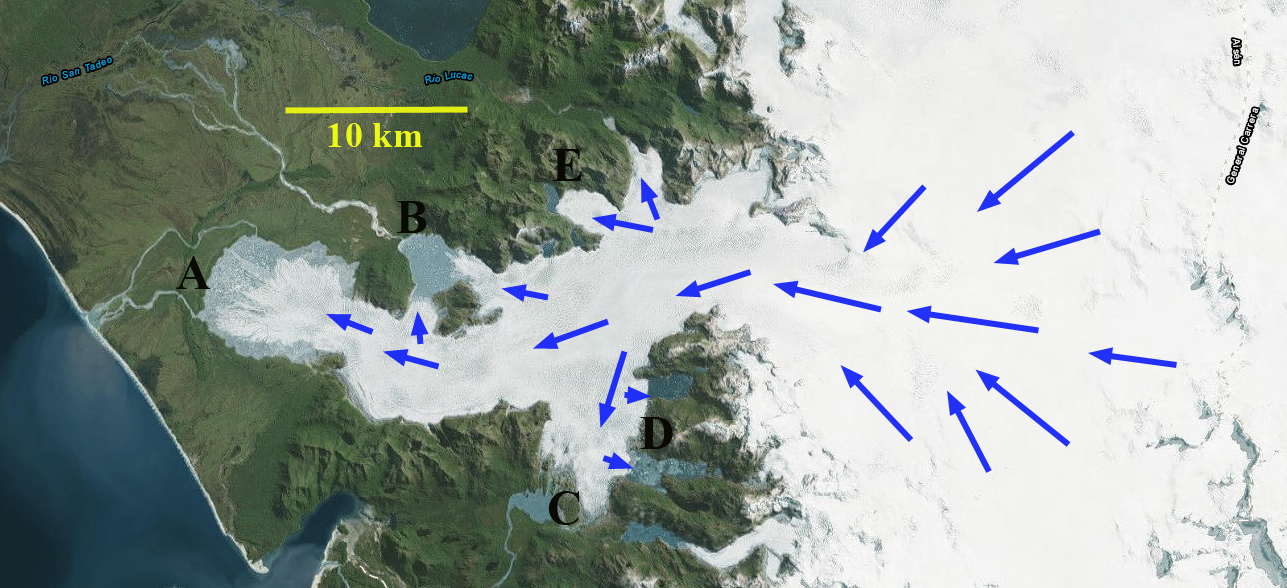
Davies and Glasser (2012) note that San Quintin Glacier terminated largely on land until 1991. The glacier has lost 15 % of its area in the last century (Davies and Glasser, 2012).  The glacier has a main terminus and many subsidiary termini.  In 1987 it is a piedmont lobe with evident minimal marginal proglacial lake development beginning. There is limited lake development at the main southern and northern terminus Point C and B respectively. Harrison et al (2001) observed that in 1993 the glacier terminus was advancing strongly into vegetated ground, while from 1996 to May 2000 the glacier underwent a transition between advance and retreat.  The high rates of thinning are leading to the retreat not just of main terminus but the distributary terminus areas extending north and south into lake basins from the main glacier. From 1987 to 2015 the main terminus retreated 2200 m, almost all after 2000, largely through a disintegration of the terminus tongue in a proglacial lake.  Extensive rifting of the terminus lobe in 2013 and 2015 is still apparent in imagery below, indicating this rapid area loss is not finished.  The main lake, Point A, had an area of 23.8 square kilometers in 2011 (Loriaux and Cassasa, 2013) . The lake at Point B developing on the north side of the glacier, due to a 3500 m retreat, is now over 8 square kilometers.  The southern terminus at Point C, has a narrow fringing lake and a retreat of 1100 meters from 1987-2015. The retreat here follows the pattern of Fraenkel GlacierAcodado Glacier and Steffen Glacier to the south.

san quintin overview

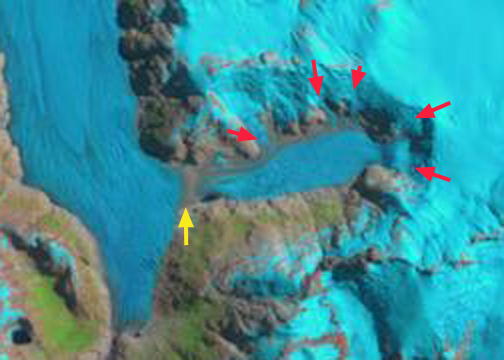
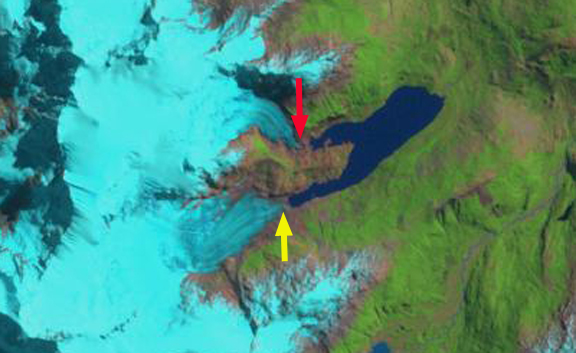
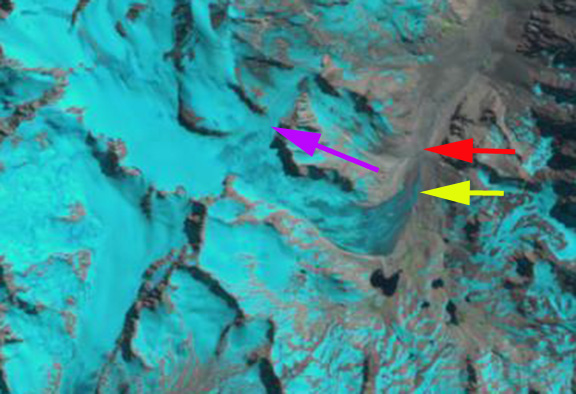
Digital Globe image of San Quintin Glacier in 2011.

san quintin terminus 2013

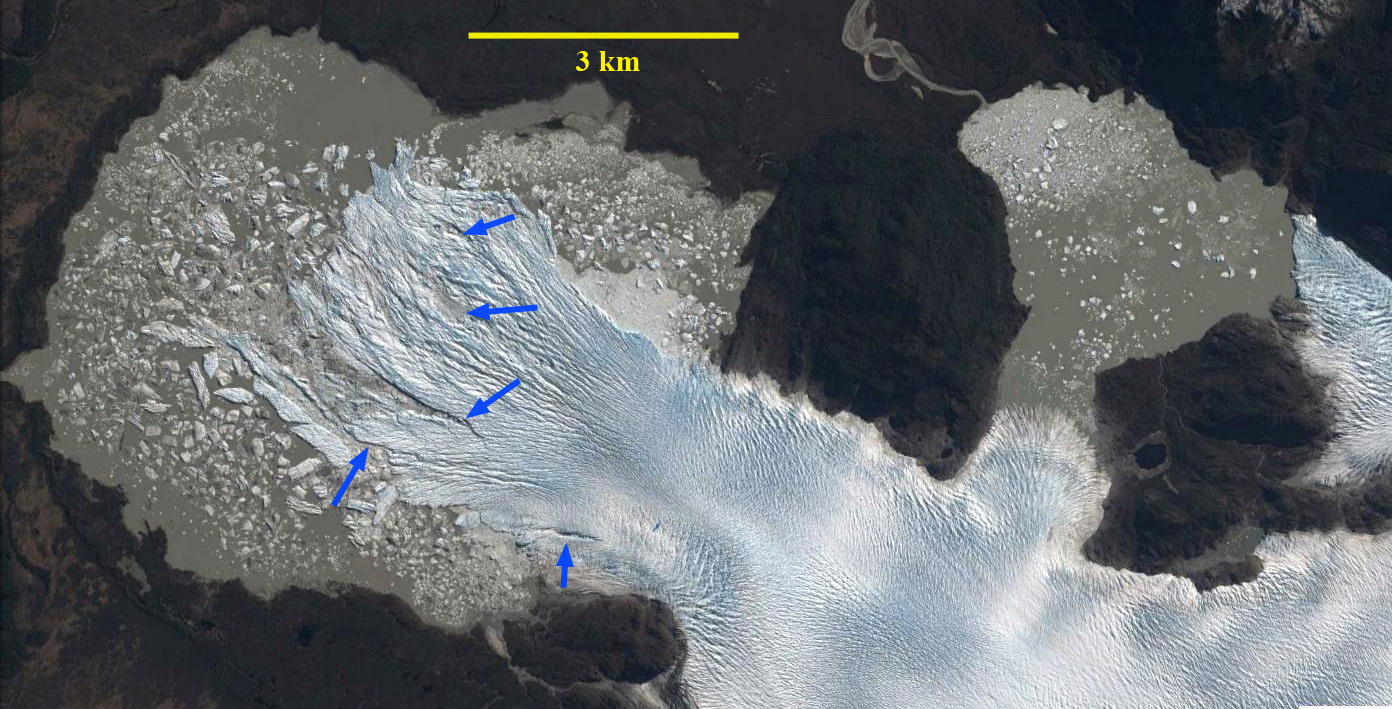
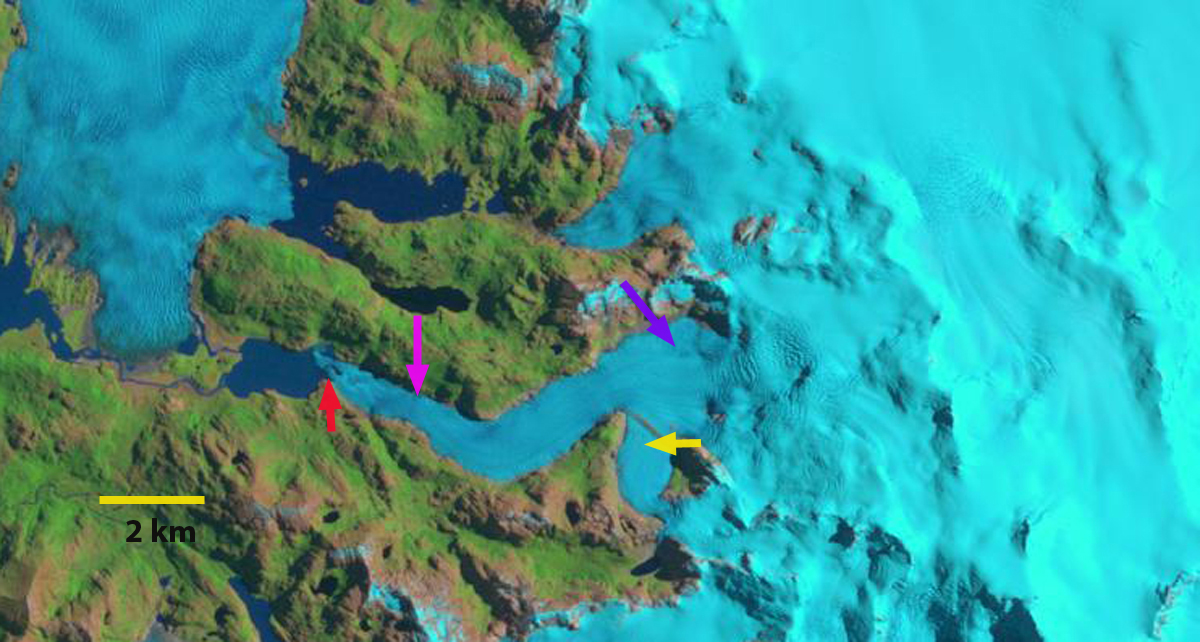
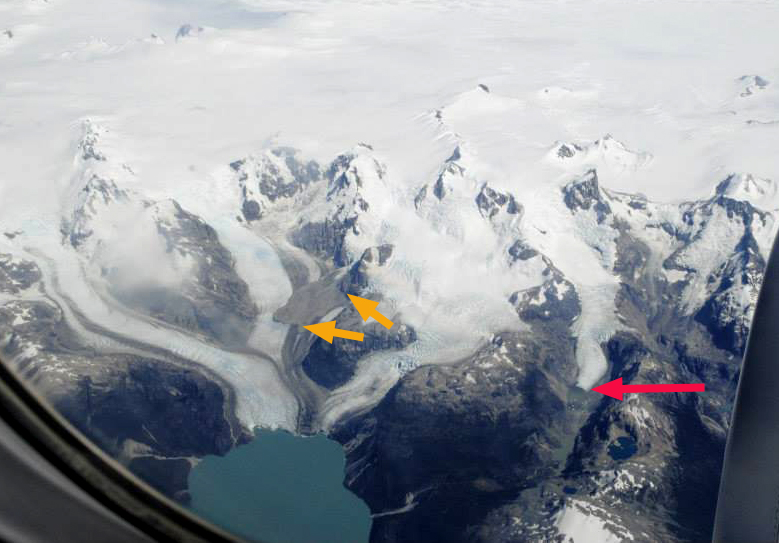
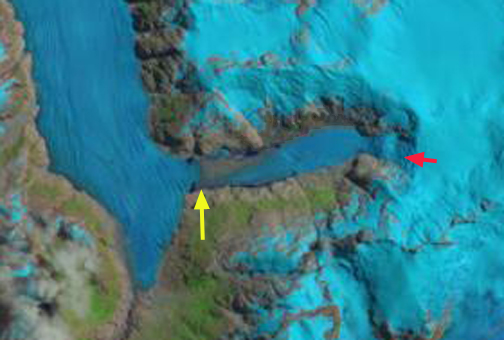
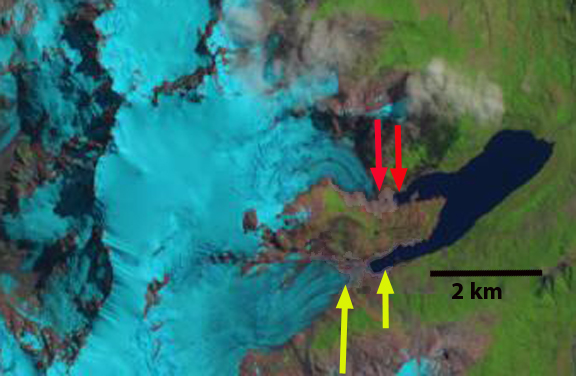
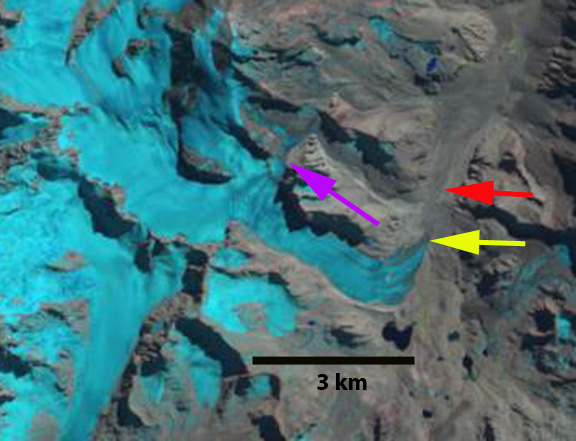
2013 Google Earth image, with the large rifts indicating glacier weakness noted with blue arrows. 

san quintin terminus 2015

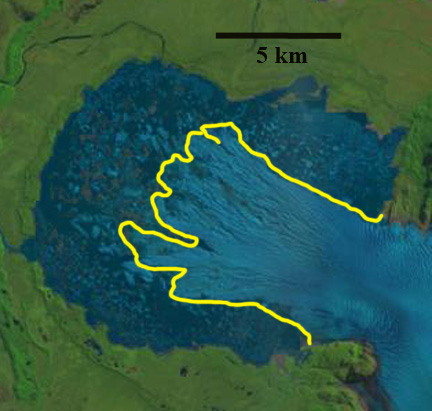
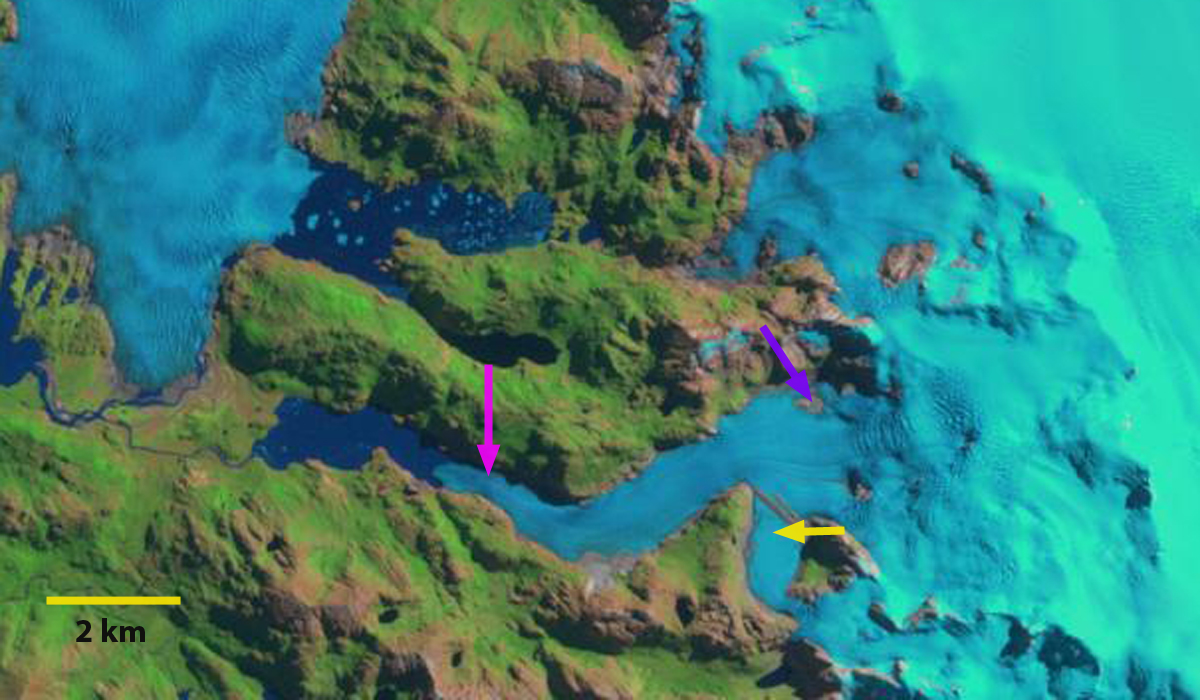
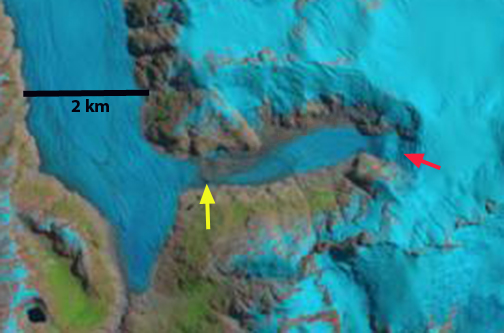
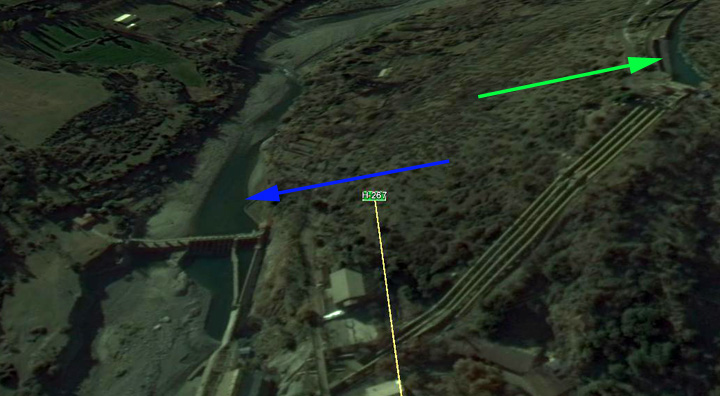
2015 Landsat image, yellow line indicates terminus. Note the tongue is surrounded on three sides by water.


Balmaceda Glacier Retreat, Chile Releases Island

balmaceda compare

1986 and 2015 Landsat images of the Balmaceda Glacier, Chile region.  Red arrow indicates 1986 ice front, yellow arrow 2015 ice front and purple arrow a tributary that has detached.

Balmaceda Glacier (Felicia Glacier) is at the southeastern end of the Southern Patagonia Ice Cap (SPI) field and drains into the Serrano River.  There is another glacier referred to as Balmaceda  that descends steeply almost to the shores of Fiordo Ultima Esperanza, hence Felicia Glacier will be used here.  Willis et al (2012) observed that between February 2000 and March 2012, indicate that SPI is rapidly losing volume, that thinning extends to the highest elevations.  The mass balance loss is occurring at a rate of −20.0 ± Gt/year, which is +0.055 mm/year of sea level rise. The retreat is driven by increasing calving rates from the 1975-2000 to the 2000-10 period (Schaefer et al, 2015). The pattern of retreat is consistent between these glaciers and the region as noted by Davies and Glasser (2012),  annual rates of shrinkage in the Patagonian Andes increased in  from 0.10% year from 1870-1986, 0.14% year from 1986-2001, and 0.22% year from 2001-2011. These losses have led to retreat such as at Glaciar Marconi and Glacier Onelli

In 1986 the glacier terminated on an island in that acts as pinning point stabilizing the glacier front.  The calving front is over 2.5 km wide. By 2000 Landsat imagery indicates the glacier has retreated from the island with the greatest retreat on the north side.  By 2013 the glacier has receded into a narrow western arm of the lake, the snowline is at 600 m. By 2015 a southern tributary has separated from the main glacier at the purple arrow. The terminus at the yellow arrow is 1 km from an increase in surface slope indicating a rise in bedrock that may be the inland margin of the lake. The retreat from 1986 to 2015 is 2100 m and the current calving front is 1.2 km wide.  The snowline in 2015 is at 1000 m is quite high.  De Angelis (2014) notes the ELA for this glacier at 690 m.  Above the snowline the linear wind sculpted features oriented west to east indicate the ferocious winds of the region Schaefer et al (2015) note the exceptional accumulation rates in the region

The Balmaceda Glacier drains into the Serrano River, the headwaters being Del Toro Lake on the southern boundary of Torres del Paine National Park.  The river is home to numerous giant Chinook salmon which can weigh up to 35 kg with fishing season from June to December.  Chinook salmon have just recently started populating rivers in Chile and Argentina. Fish hatcheries in southern Chile release thousands of Chinook smolts. The introduced Chinook originate from tributaries of the Columbia River of Washington and Oregon.

balmaceda 2000

2000 Landsat Image

balmaceda 2013

2013 landsat image

balmaceda 2015

2015 Landsat image the purple dots are the snowline which at 1100 m is quite high.  Also note the long wind drift features extending west to east above the snowline.


Colonia Glacier, Chile Retreat and Periodic Lake Outbursts


colonia-compare-1024x495

Comparison of 1987 and 2015 Landsat images indicating retreat from red arrows to yellow arrows of 2.5 km and development of a new lake at the terminus. orange arrow indicates glacier dammed lake that fills and empties periodically. 

Colonia Glacier drains east from the Northern Patagonia Icefield feeding the Baker River, Chile. It is the largest glacier draining east from the NPI.  A comparison of the 1987  and 2015 images indicate a 2.5 km retreat of the glacier front, development of a large lake and areas of thinning well upglacier at the purple arrows. The recent substantial retreat of Colonia Glacier like Glacier Nef just to its north is posing new hazards. The glacier is unusual in the number of lakes that are adjacent to or feed into the adjacent glacier dammed or proglacial lakes. In the image below Lake A=Arco Lake, Lake B=East Terminal Lake, Lake C=Cachet 1 , Lake D= West terminal Lake, Lake E=Colonia Lake and Lake F=Cachet 2. In the case of Baker River the outburst floods are a threat to the planned hydropower developments as documented by Dusaillant and others (2009).  Hidroaysen Project proposed 5 dams on the Baker and Pascua River generating 2750 MW of power that after initial permit approval in 2011Chile’s Committee of Ministers overturned the environmental permits in 2015.

Slide1

Google Earth image from 2005.

The glaciers recent retreat and glacier lake outburst floods have been closely monitored by the Laboratorio de Glaciología in Valdivia, Chile.  Aniya and others (1999) observed that Colonia Glacier began a rapid retreat after 1985 from 1997-2005 that has further accelerated, with a general frontal retreat of 2 km. Rivera and others (2007) observed that the Colonia Glacier had lost 9.1 square kilometers of area from 1979-2001, which is 3% of the total glacier area and thinned 1.1 m per year in the ablation zone.

Image from Laboratorio de Glaciologia, frontal change 1944-2005.

The Laboratorio de Glaciologia’s observed in the spring of 2008 Baker River suddenly tripled in size, in less than 48 hours, roads, bridges, and farms were severely damaged. Lake Cachet 2 had vanished the 5 square kilometer glacial lake had emptied 200 million cubic meters of water in just a matter of hours. This lake drained beneath the glacier after sufficient water had filled the lake to buoy part of the glacier and subglacial conduits had begun to develop. Since Cachet 2 emptied in April 2008, the lake has emptied at least six more times October, December 2008, March and September 2009, March 2010, and early 2013 with peak flows released of 3000 cubic meters per second. Below are images of Cachet 2 full iand empty in 2008 from Laboratorio de Glaciologia’s. Also a  comparison of before and after drainage in Landsat images from Sept. 2012 and Feb. 2013.

cachet 2 empty

Cachhet Lake full looking toward Colonia Dam 2008

Cachet Lake after emptying looking upvalley away from Colonia Glacier 2008. 

colonia outburst 2013

Cachet lake full in Sept. 2012 and emptied in Feb. 2013 Landsat images.

The two lakes at the terminus of the glacier did not exist in 1979, the western most terminus lake drained into the easternmost terminus lake (D) via a sub-glacial tunnel after formation in the late 1980’s until 2005 when a channel was cut right through the glacier terminus. Retreat of the glacier terminus first led to significant lake development in 2001.  This is evident in the image below, there is still glacier ice on both sides of this drainage channel.  By 2015 the lakes have merged into a single large proglacial lake at the terminus that is 3.2 km wide.The development and demise of glacier dammed lakes and the resultant problem of glacier lake outburst floods is not rare today, Imja Glacier, and Tulsequah Glacier are other examples.

Lake expansion at the end of the Colonia Glacier from 2005 to 2013, Google Earth images. 

colonia terminus lake

Acodado Glacier, Chile Rapid Retreat 1987-2015

acodado compare
Landsat image comparison 1987 and 2015
Loriaux and Casassa (2013) examined the expansion of lakes of the Northern Patagonia Ice Cap. From 1945 to 2011 lake area expanded 65%, 66 square kilometers. Rio Acodado has two large glacier termini at its headwater, HPN2 and HPN3. that are fed by the same accumulation zone and comprise the Acodado Glacier. The glacier separates from Steffen Glacier at 900 m. The lakes at the terminus of each were first observed in 1976 and had an area of 2.4 and 5.0 square kilometers in 2011. (Loriaux and Casassa, 2013). Willis et al (2012) noted a 3.5 m loss per year from 2001-2011 in the ablation zone of the Acodado Glacier, they also note annual velocity is less than 300 m/year in the ablation zone. Davies and Glasser (2012) noted that the Acodado Glacier termini, HPN2 and HPN3, had retreated at a steadily increasing rate from 1870 to 2011. Here we examine the substantial changes in Acodado Glacier from 1987 to 2015 using Landsat imagery. acodado ge
Digital Globe image of Acodado Glacier and the termini HPN2 and HPN3.

In HPN2 terminates at the red arrow in 1987 and HPN3 at the yellow arrow, the snowline is at the purple dots at 1000 m. By 2000 the glacier has retreated from the red and yellow arrow by 400 m and 900 m respectively, and the snowline is at 1100 m.   In 2014 there are many large icebergs in the lake at the terminus of HPN3, these are from recent calving retreat.  This is not an area where the lakes develop even seasonal lake ice cover.  The  snowline is again at 1100 m.  In 2015 it is apparent that HPN2 has retreated 2100 m from the red arrow to the pink arrow.  HPN3 has retreated 3200 m from the yellow to the orange arrow.  The snowline is again at 1100 m.  The retreat accelerated after 2000 for both glaciers. This high of a snowline indicates warm temperatures generating high ablation rates, which will lead to more retreat. HPN3 has a sharp rise in elevation 2.5 km above the terminus, before it joins the main Acodado Glacier, it should retreat rapidly toward this point and then calving will end and retreat will slow.  The retreat here is synonymous with the pattern observed at other Northern Patagonia Ice Cap outlet glaciers each with rapid calving retreats in expanding proglacial lakes; Fraenkel Glacier, Gualas and Reichert Glacierand Steffen Glacier.
acodado 1987
Landsat image from 1987

acodado 2000
Landsat image from 2000

acodado 2014
Landsat image from 2014

acodado 2015
Landsat image from 2015

Fraenkel Glacier Retreat, Patagonia, Chile

Fraenkel Glacier drains the west side of the Northern Patagonia Ice Cap (NPI) just south of Glaciar San Quintin. The retreat of this glacier in the last 30 years mirrors that of Gualas and Reichert Glacier, which also terminate in an expanding proglacial lake.   Davies and Glasser (2012) work, had an excellent Figure indicating two periods of fastest recession since 1870, are 1975-1986 and 2001-2011 for NPI glaciers.  They noted the loss was 0.07% from 1870-1986, 0.14% annually from 1986-2001 and 0.22% annually from 2001-2011. Willis et al (2011) observed that the thinning rate of NPI glaciers below the equilibrium line has increased substantially from 2000-2012. On Fraenkel Glacier they observed a 2.4 m per year thinning in the ablation zone. Here we examine the changes in this glacier from 1987 to 2015 using Landsat Image.

fraenkel ge

In 1987 the glacier terminus was at the end of a peninsula red arrow and the proglacial lake it terminates in is 2 km long. There is a medial moraine on the glacier at the yellow arrow and the glacier covers the terrain below an icefall at the purple arrow. By 2000 at the purple arrow bedrock is appearing from the base of the glacier. The medial moraine at yellow arrow is little changed. The terminus has retreated 800 m. By 2015 the area around the purple arrow has been deglaciated emphasizing the amount of thinning in the ablation zone even well upglacier of the terminus. At the yellow arrow the medial moraine has been replaced by a wide rock rib separating the glacier from a former tributary. The main terminus is at the pink arrow, indicating a retreat of 1.4 km since 1987. The retreat rate of 50 meters per years though large is less than on Reichert Glacier or Gualas Glacier.  Mouginot and Rignot (2014) observe that Fraenkel Glacier does not have the high velocity of the neighboring Benito and San Quintin Glacier or the Gualas and Reichert Glacier, this leads to the potential for greater mass loss of the ablation zone and even faster retreat.

fraenkel Glacier 1987
Fraenkel Glacier Landsat Image 1987
fraenkel glacier 2000
Fraenkel Glacier Landsat Image 2000

fraenkel glacier 2015
Fraenkel Glacier Landsat Image 2015

North Leones Glacier Retreat and new Landslide, Patagonia, Chile

Jill Pelto, my daughter returning from fieldwork with UMaine in the Falkland Island took a picture last week out the plane window of Leones Glacier of the northern Patagonia Icefield. The picture illustrated two changes worth further examination, and the fact that if you have a glacier picture that you would like more information on let me know. The picture indicates outlet glaciers of the Northern Patagonia icefield fed by the snowcovered expanse.  Also evident is a large landslide that is both fresh and that I knew had not been there before, orange arrow,and it showed a new lake had formed due to retreat of the glacier north of Leones Glacier, red arrow, hereafter designated North Leones Glacier. The landslide extends 2 km across the glacier and is 3 km from the terminus. Here we use 1985 to 2014 Landsat imagery to identify changes in North Leones Glacier and the landslide appearance.

npi tri glacier
Jill Pelto took this picture on March 13th, 2015

In 1985 there are medial moraines on the glacier surface, but no large landslide deposit. The Northern Leones Glacier terminates on land, red arrow. A distributary terminus almost connects with another glacier to the north at the yellow arrow. In 1987 there is little evident change from 1985. By 2002 a small lake is beginning to form at the terminus of Northern Leones Glacier. By Feb. 2014 a substantial lake has formed at the end of the North Leones Glacier. There is considerable separation between the distributary terminus at the yellow arrow and the next glacier. There is no landslide deposit either. Google Earth imagery indicates the lack of a landslide deposit as well. A closeup of the terminus of North Leones Glacier in 2013, with Google Earth imagery, indicates ogives (blue arrows), which are annually formed due to seasonal velocity changes through an icefall. In January 2015 the landslide deposit is evident, extending about 2 km across Leones Glacier and 3 km from the terminus. The North Leones Glacier has retreated 700 meters from 1985-2015. The retreat of the distributary terminus indicates thinning upglacier of the icefall on North Leones Glacier. The landslide adds mass to Leones Glacier, which will lead to a velocity increase. The debris is thick enough to reduce melting in this portion of the ablation zone. The velocity of this glacier is indicated by (Mouginot and Rignot, 2015) as 200-400 meters per year, indicating that for the next decade at least this landslide will impact the lower Leones Glacier. (Willis et al, 2012) identify thinning of the Leones Glacier area around 1 m per year, which will be reduced on the landslide arm of the glacier.
(Davies and Glasser, 2012), indicate that this region experienced increased area loss from 1986-2011.  Lago Leones feeds the Leones River which is also fed by the retreating General Lago Carerra Glacier.

leones glacier 1985
Landsat image 1985

leones glacier 1987
Landsat image 1987

leones galcier 2002
Landsat image 2002

leones glacier 2014
Landsat image 2014

leones north ge
Google Earth Image 2010

leones landslide
Google Earth image 2013

Leones Glacier 2015
Landsat image 2015

Downwasting Tributary-Glacier Dammed Lake Formation at HPN4 Glacier, Patagonia, Chile

We often are more concerned with what is happening at the terminus of a glacier; however, often key changes are happening up glacier some distance. This is the case with the following example. The Northern Patagonia Icefield (Hielo Patagónico Norte, HPN) is one of the two main icefields in Patagonia.  The remoteness of the region is evidenced by the number of significant lakes and glaciers that remain unnamed.  This remoteness has led to several valuable detailed recent studies utilizing satellite imagery on glacier extent (Davies and Glasser, 2012), glacier thickness change (Willis et al, 2012) and glacier velocity (Mouginot and Rignot, 2015)  Here we focus on a downwasting tributary to an unnamed glacier listed as HPN4 Glacier  in the aforementioned studies. Davies and Glasser, (2012)  identify this region of the icefield as retreating faster from 2001-2011 than during any measured period since 1870.    Willis et al, (2012) in their Figure 2, seen below,  identify this an area of pronounced thinning, approximately 5 m/year from 2000 to 2011. Why such rapid thinning in an area without calving?   Mouginot and Rignot, (2015) indicate that this area is not an area of rapid flow, and given the thinning it should be an area of diminishing flow.  Here we examine changes from 1987 to 2014 using Landsat imagery.

HPN4-map

Digital Globe image of southern section of Northern Patagonia Icefield, with black arrow indicating downwasting tributary from the east flowing into HPN4 Glacier.

npi thinning

Figure 2 from Willis et al (2012) indicating thinning of NPI glaciers from 2000-2011, the blue arrow indicates the downwasting tributary of interest flowing into HPN4 Glacier from the east.

hpn4 flow

Ice Flow direction for HPN4 Glacier and the downwasting tributary (DT).   The flow diagram above indicates the converging flow of the downwasting tributary and HPN4, that meet at the medial moraine.

In 1987 there are five contributing glacier tongues to the downwasting tributary, each indicated with a red arrow.  It is like a bathtub being filled with five taps at once.  The yellow arrow indicates a medial moraine at the mouth of the valley, signalling the lack of current contribution of the downwasting tributary to HPN4 Glacier.  By 2004 only three of the contributing glacier tongues still merged with the downwasting tributary, and two of these are much more tentative.  The medial moraine has shifted east indicating that the main HPN4 Glacier is now flowing into the valley instead of the downwasting tributary being a contributing tributary to HPN4.  By 2014 there is only one contributing glacier tongue to the downwasting tributary, only one tap for this draining bathtub, the other four contributing tongues have retreated from contact with the downwasting tributary.  The medial moraine has spread eastward and some fringing proglacial/subglacial lakes are evident.  In 2015 the only change is that the rifting near the medial moraine is more pronounced.  A closeup 2013 Digital Globe image indicates both fringing ponds-blue arrows, rifts caused by varying flotation-green arrows and expanding supraglacial ponds, red arrows.  The rifts are a sign of instability and typically lead to break up of  this portion of the terminus. The downwasting tributary continues to demise faster than HPN4 Glacier, which crosses the valley mouth, hence it is likely that a glacier dammed lake will form and that HPN4 Glacier will continue to flow further east up this valley, which could offset some of the downwasting and lake development.  In either case this redirected flow of HPN4 into a high ablation valley, will help encourage a faster retreat of the main terminus. How large the lakes gets and how much of the time it is filled are difficult to speculate upon.  Analogs for this type of lake are seen at. Allemania Glacier (Lago Martinic) and Baird Glacier (Witches Cauldron) .  Schaefer et al (2013) discuss the HPN4 Glacier because the main terminus has changed little given its modelled mass balance, and the modelled mass balance to the east appears too negative, which they suggest indicates wind redistribution from the HPN4 to the Pared Sud Glacier just east.  That is a challenge to sort out without some ground truth.

hpn-4 1987

1987 Landsat image

hpn-4 2004

2004 Landsat image

hpn-4 2014

2014 Landsat image-not the fringing blue indicating trapped sub-glacial/proglacial lake.

hpn-4 2015

2015 Landsat image

hpn4-ge


Google Earth image 2013

Cordillera Lago General Carrera Glacier Retreat, Chile

You know southern Chile has lots of glaciers when an icefield with an area of 132 square kilometers has no named glaciers.  Davies and Glasser (2012) referred to this icefield as Cordillera Lago General Carrera, since it drains into that lake, the icefield is just east of the Northern Patagonia Icefield.   Davies and Glasser (2012)  noted that the icefield has a mean elevation of 1670 m and has declined from an area of 190 square kilometers in 1870, to 139 square kilometers in 1986, and 132 square kilometers in 2011.  They further noted that the area loss of Patagonia glaciers has been most rapid from 2001 to 2011.  Paul and Molg (2014) observed a more rapid retreat of 25% total area lost from glaciers in northern Patagonia from 1985-2011, the study area was north of the Northern Patagonia Icefield. Lago General Carrera drains into the Baker River, which is fed by most glaciers on the east side of the Northern Patagonia Icefield.  This river had a series of proposed hydropower projects that have now been cancelled by the Chilean government.

clcg

Here we examine Landsat imagery from 1987 to 2014 to identify the changes in a pair of outlet glaciers that drain the eastern side of the icefield, images below. In 1987 both outlet glaciers terminated in an unnamed lake that drains into the Leones River. The southern glacier is 5.5 km long beginning at 2400 m and terminates at the yellow arrow, with the snowline marked by purple dots, in the images below.  The northern glacier is 5.0 km long beginning at 2200 m with the terminus at the red arrow. In 1987 the glaciers were in shallow enough water  that calving was limited and no icebergs are evident. By 2001 both glaciers are no longer terminating in the lake.  The retreat can no longer be enhanced by calving into the lake.  By 2014 both glaciers have retreated several hundred meters from the lake.  It is easier to measure the retreat in the 2013 Google Earth image.  The retreat from the 1987 to 2013 position are indicated by the pair of arrows.  The northern glacier has retreated 400 m and the southern glacier 600 m from 1987 to 2013.  In both cases this is approximately 10% of the glacier length.  The beautiful green color of the lake is indicative of the contribution of glacier flour from actively moving and eroding glaciers.  This glaciers retreat is similar to that of the nearby Nef Glacier and Verde Glacier.

clgc 1987
1987 Landsat image
clgc icefield 2001

2001 Landsat image
clgc 2014

2014 Landsat image

clgc ge 2013
2013 Google Earth image.  With arrows indicating terminus change from 1987 to 2013.

Cortaderal Glacier Retreat, Chile

Cortaderal Glacier is in central Chile on the south slope of Paloma a stratovolcano. The glacier feeds the Cortaderal River which joins the Cachapoal River. Pacific Hydro has opened a new hydropower plant at Chacayes that is fed by this and other glaciers. It is a 111 MW run of river project with water taken out at a small dam run through a canal a small reservoir and back into the river. There is an older Coya Hydropower Plant a short distance downstream. Pacific Hydro plans to add several more plants in the area.  Continued glacier retreat in the regions will lead to further glacier runoff declines during the melt season.cortaderal ge 2007
Cortaderal Glacier Google Earth image

chacayes intake
Chacayes Hydropower intake and canal

chacayes canal
Chacayes Hydropower Canal and Reservoir

coya hydro
Coya Hydropower Plant
La Quesne et al (2009) reported a that Cortaderal Glacier retreated 110 m from 1970-2000 and 450 m from 2000-2007. Here we use satellite imagery from 1990-2014 to observe this retreat and more recent changes. In each image the red arrow is the 1990 terminus the 2014 is marked by a yellow arrow and the purple arrow a smaller side glacier feeding a secondary terminus. In 1990 the glacier after descending turned north in the main river valley and extended 1 km north. The side glacier has a significant width of 300 m. By 2000 the glacier had retreated 300 m and with a high snowline the connection to the secondary terminus at the purple arrow is narrowing but still significant. In 2003 further change is hard to discern. In 2013 substantial further retreat has occurred, the snowline is high at 3800 m and the secondary terminus connection is nearly gone. By 2014 the retreat since 1990 is 800 to 900 m, the snowline is at 3700 m and the secondary terminus connection is to narrow to actually feed glacier ice.  The retreat here is similar to that of nearby Glaciar del Humo, Argentina.  The Laboratorio de Glaciologia in Valdivia, Chile, Rivera et al (2002), has noted the extensive retreat of the Central Chile glaciers over the last four decades.
cortaderal 1990
1990 Landsat image
cortaderal 2000
2000 Landsat image
cortaderal 2003
2003 Landsat image
cortaderal 2013
2013 Landsat image
cortaderal 2014 2014 Landsat image