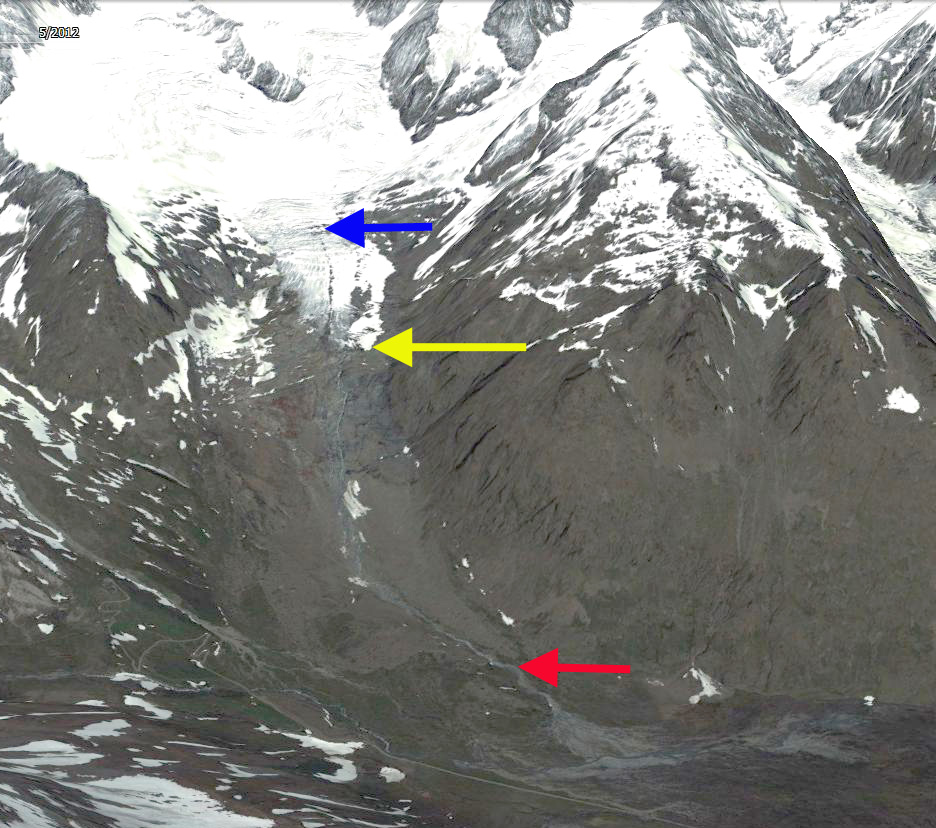
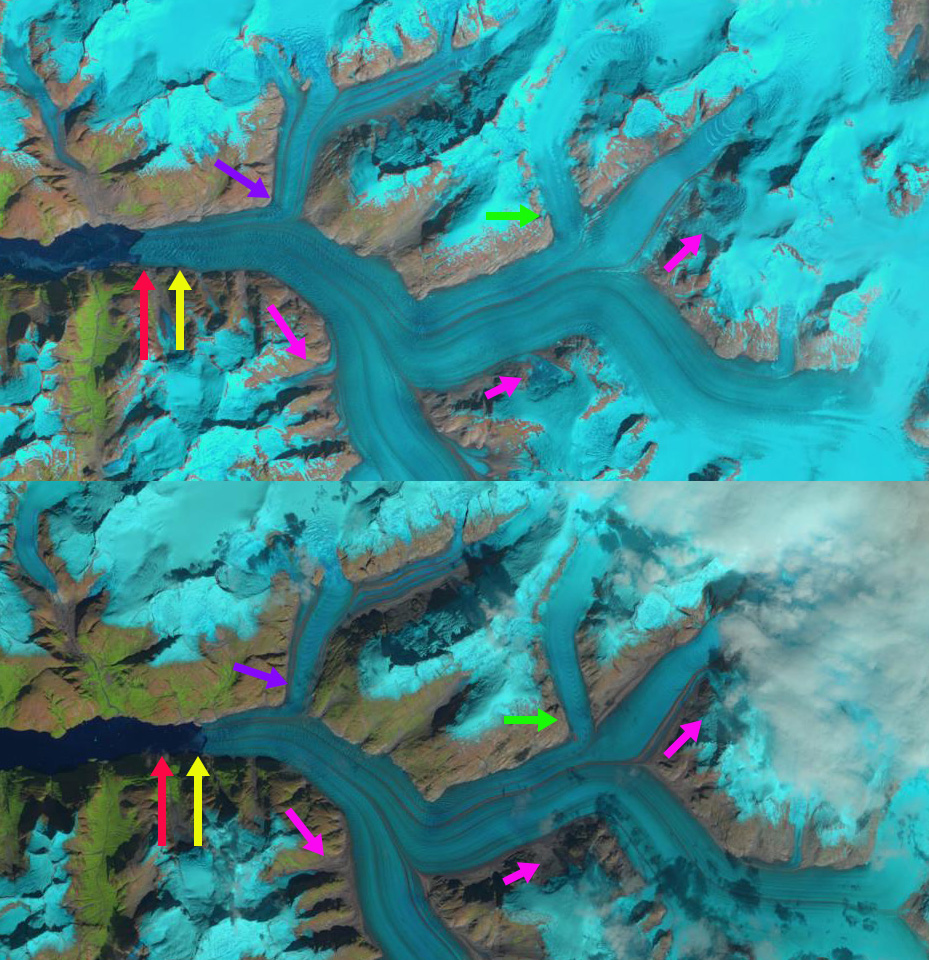
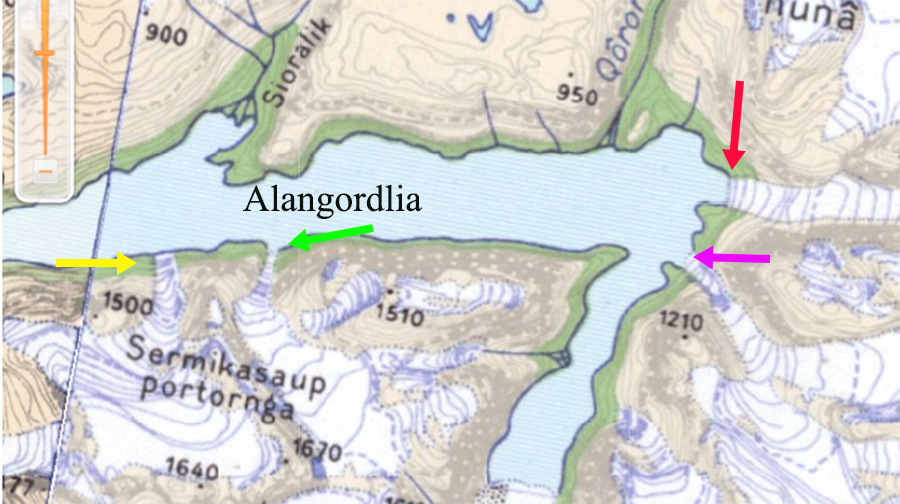
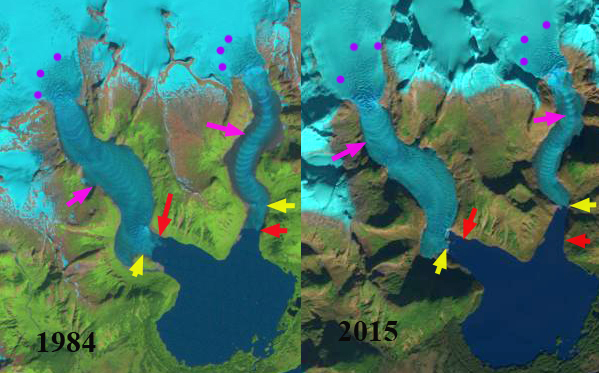
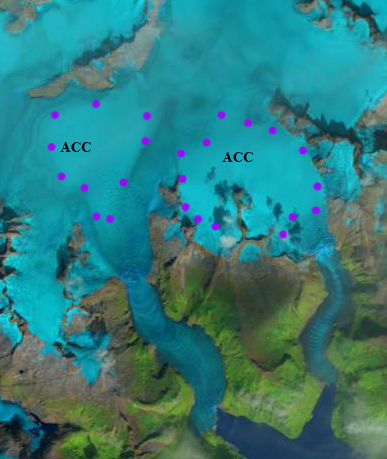
Murchison Glacier change revealed in Landsat images from 1990 and 2015. The red arrow indicates 1990 terminus location, the yellow arrow indicates 2015 terminus location and the purple arrow indicates upglacier thinning.
Murchison Glacier is the second largest in New Zealand. The glacier drains south in the next valley east of Tasman Glacier and terminates in a lake that is rapidly developing as the glacier retreats. The lower 6 km section is debris covered, stagnant, relatively flat and will not survive long. There was not a lake in the 1972 map of the region. In 1990 the newly formed lake was limited to the southeast margin of the terminus . From 1990 to 2015 the terminus has retreated 2700 m. A rapid retreat will continue as 2010, 2013 and 2015 imagery indicate other proglacial lakes have now developed 3.5 km above the actual terminus. These lakes are glacier dammed and may not endure but do help increase ablation, and in the image below show a glacier that is too narrow to provide flow to the lower 3.5 km. The demise of the lower section of this glacier will parallel that of Tasman Glacier. The expanding lake will continue to enhance the retreat in part by sub-aqueous calving noted by Robertson et al (2012) on nearby glaciers. The increased retreat has been forecast by the NIWA and Dykes et al (2011). The glacier still has a significant accumulation area above 1650 m to survive at a smaller size. The ongoing retreat is triggered by warming and a rise in the snowline in the New Zealand Alps observed by the NIWA. Notice the changes upglacier indicated at the purple arrows above, where tributary flow has declined, bedrock areas in accumulation zone have expanded and the snowline is higher. Gjermundsen et al (2011) examined the change in glacier area in the central Southern Alps and found a 17% reduction in area mainly from reductions of large valley glaciers such as Murchison Glacier.
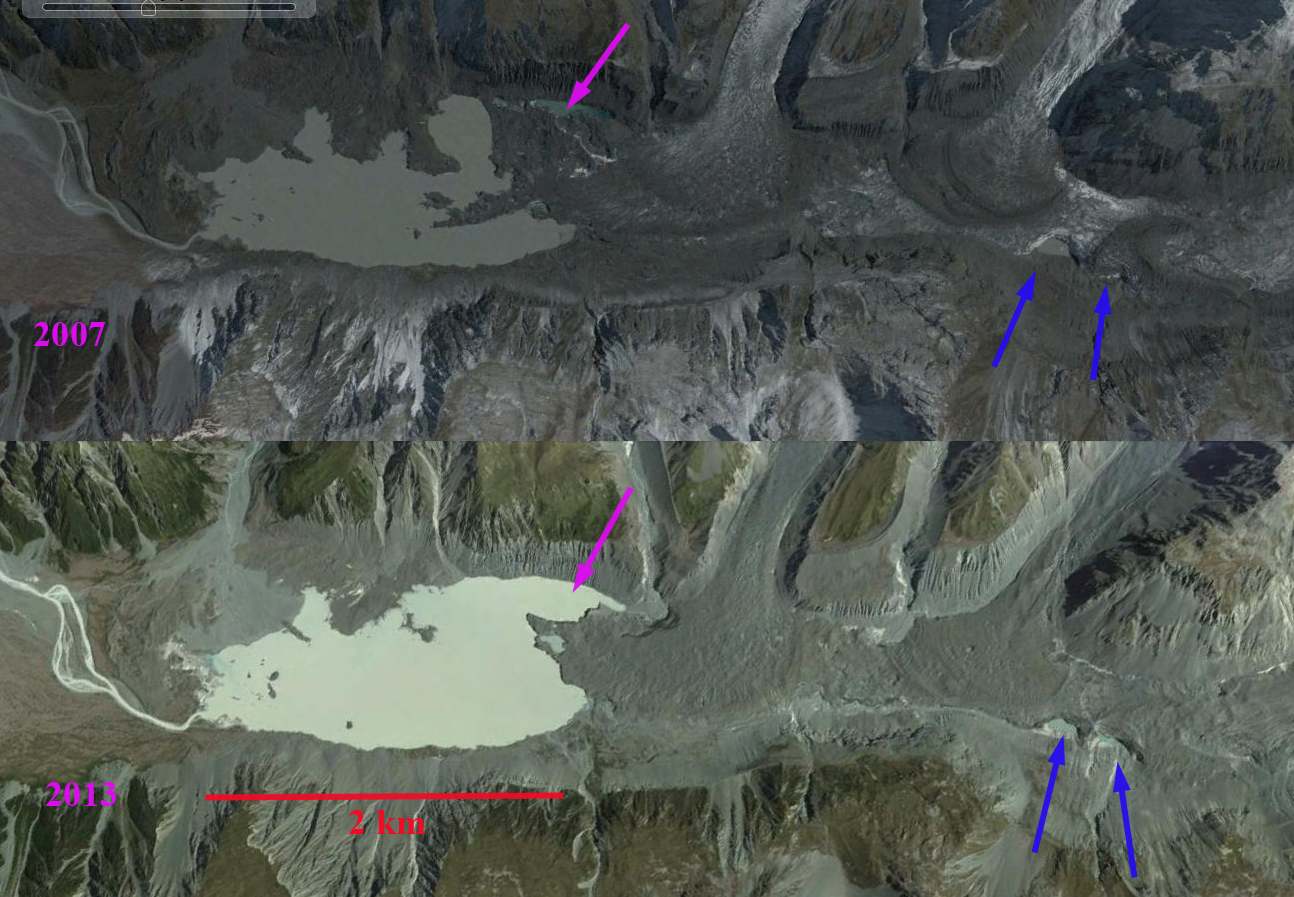
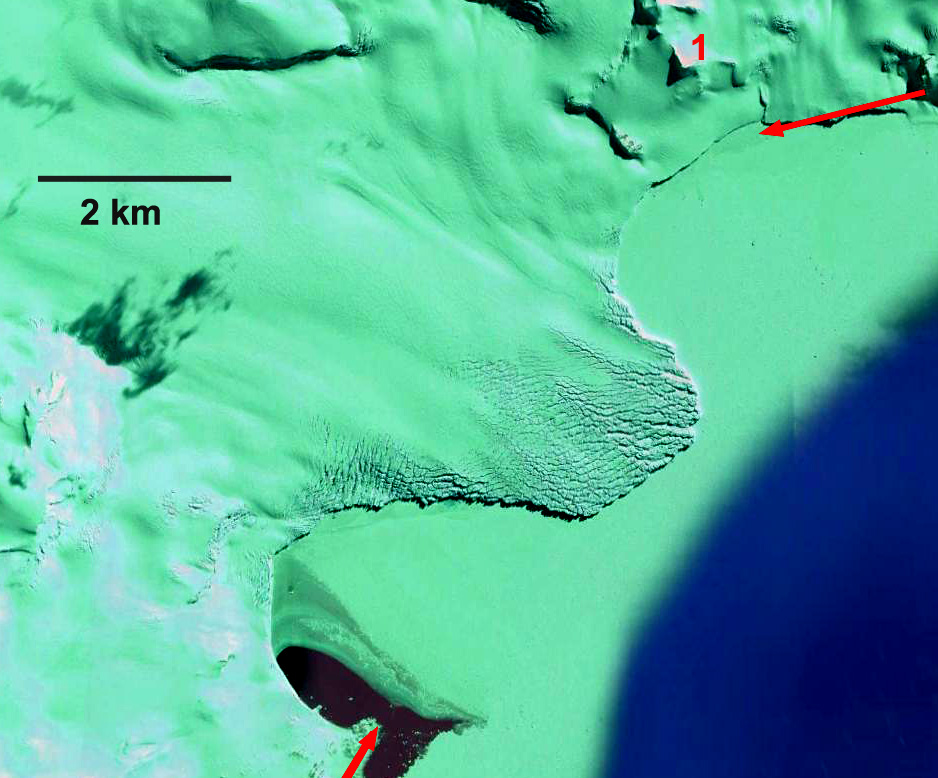
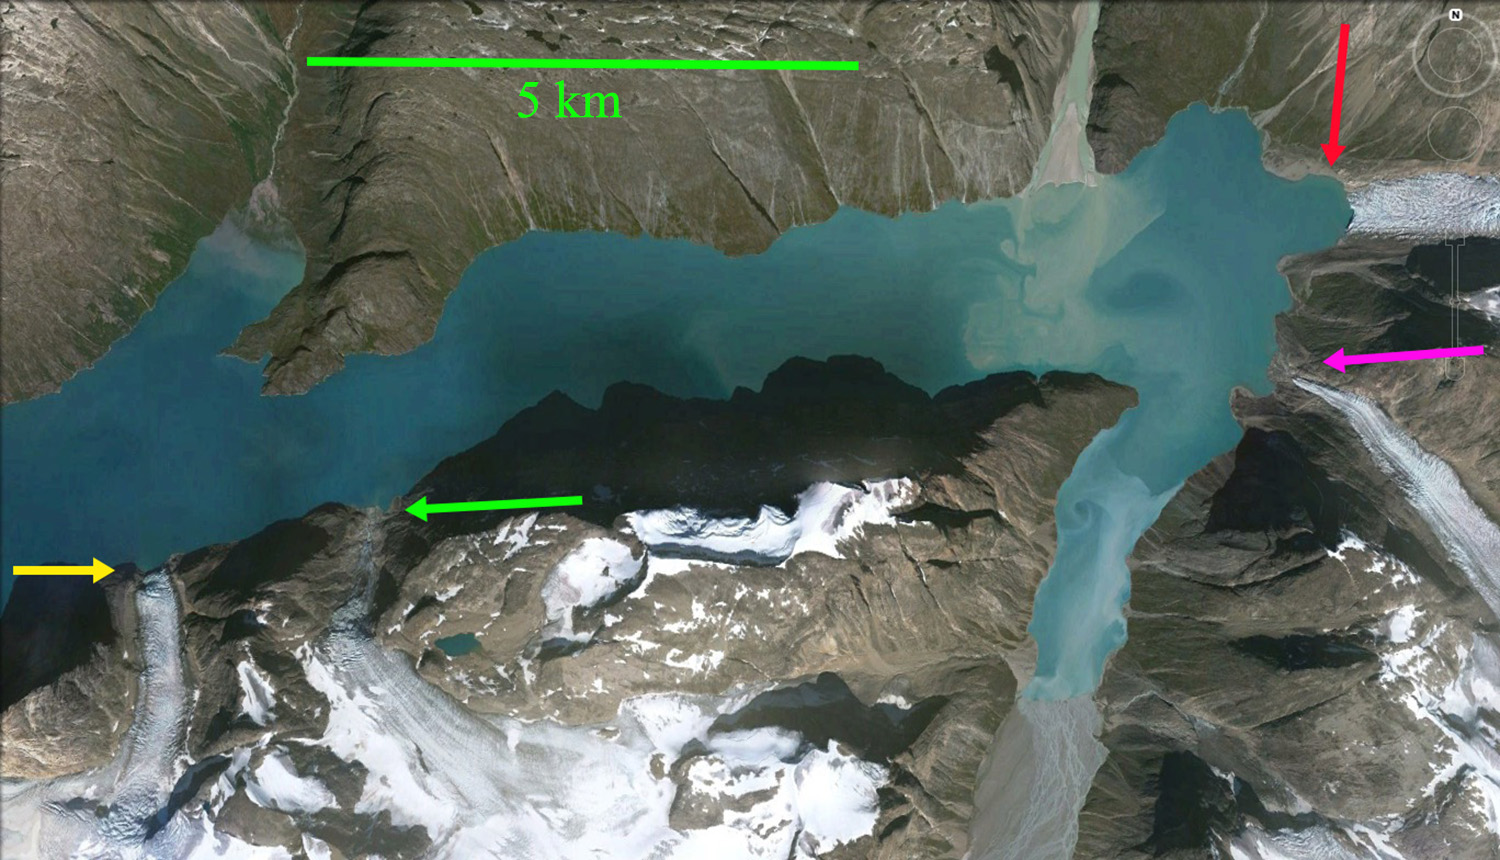
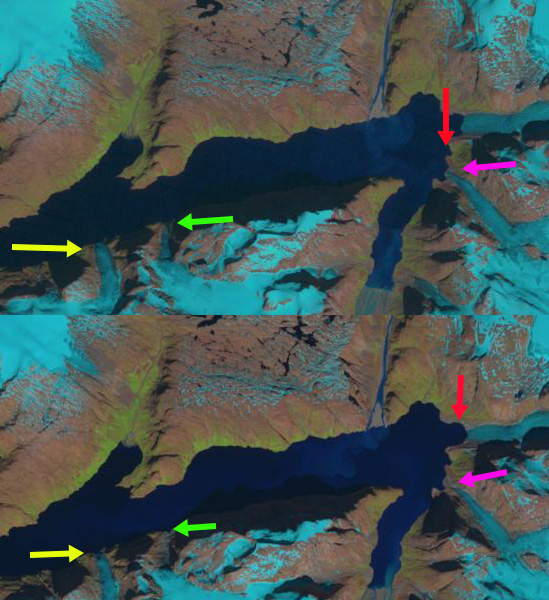
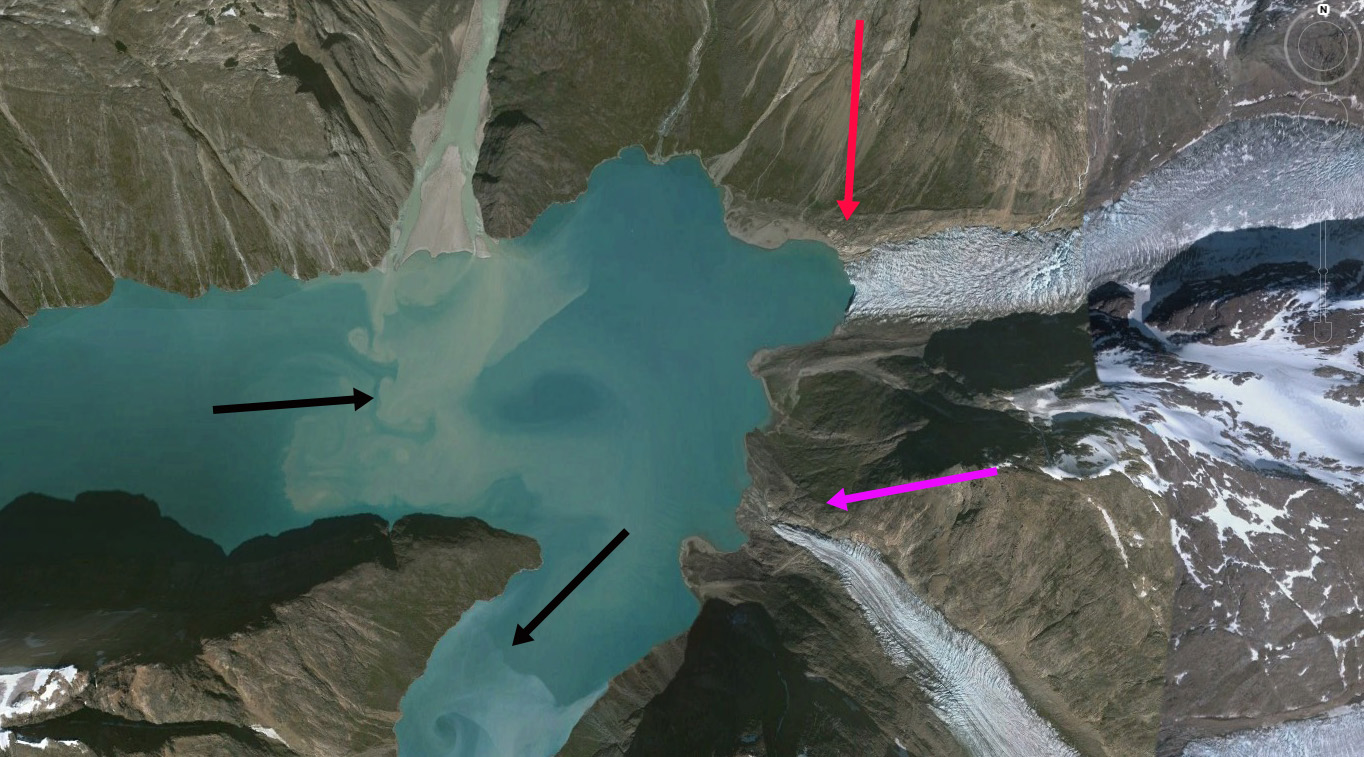
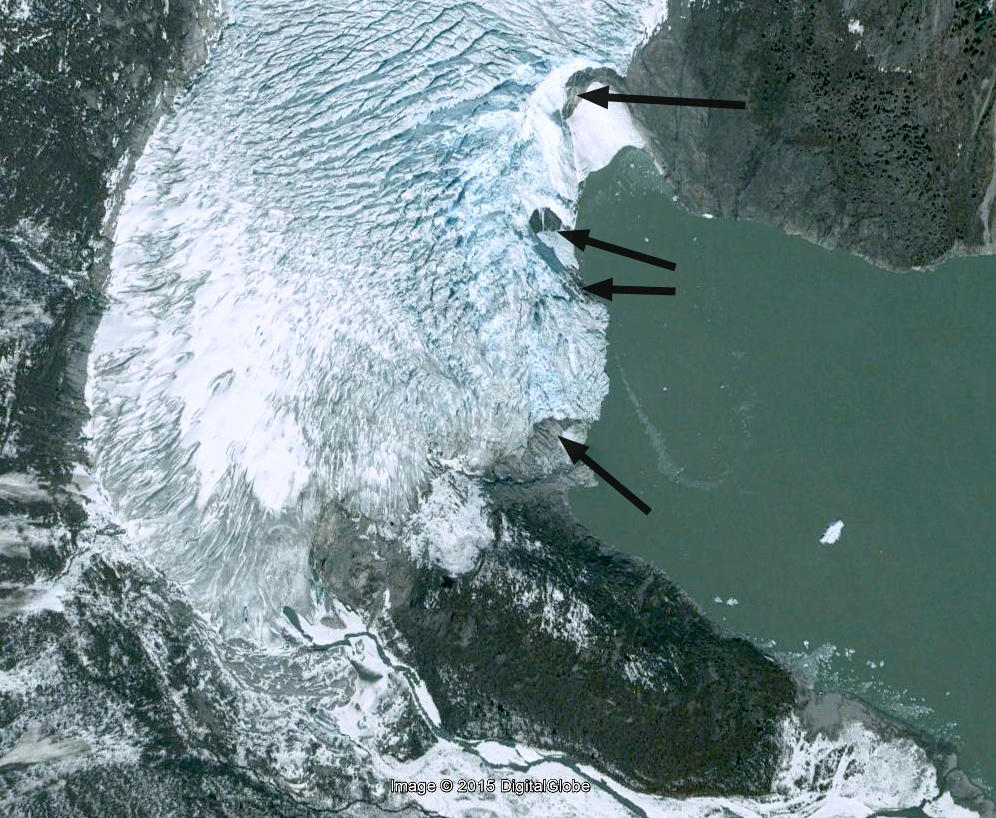
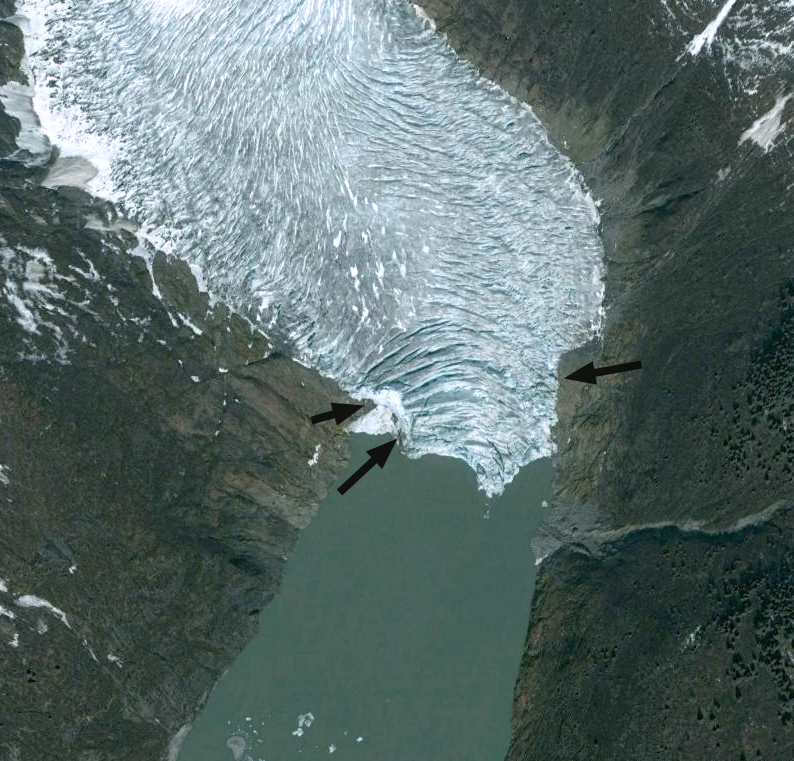
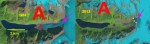
Terminus reach of Murchison Glacier in Google Earth images from 2007 and 2013. Note expansion at pink arrow on the terminus lake and the development of proglacial lakes 3.5 km upglacier at blue arrows.
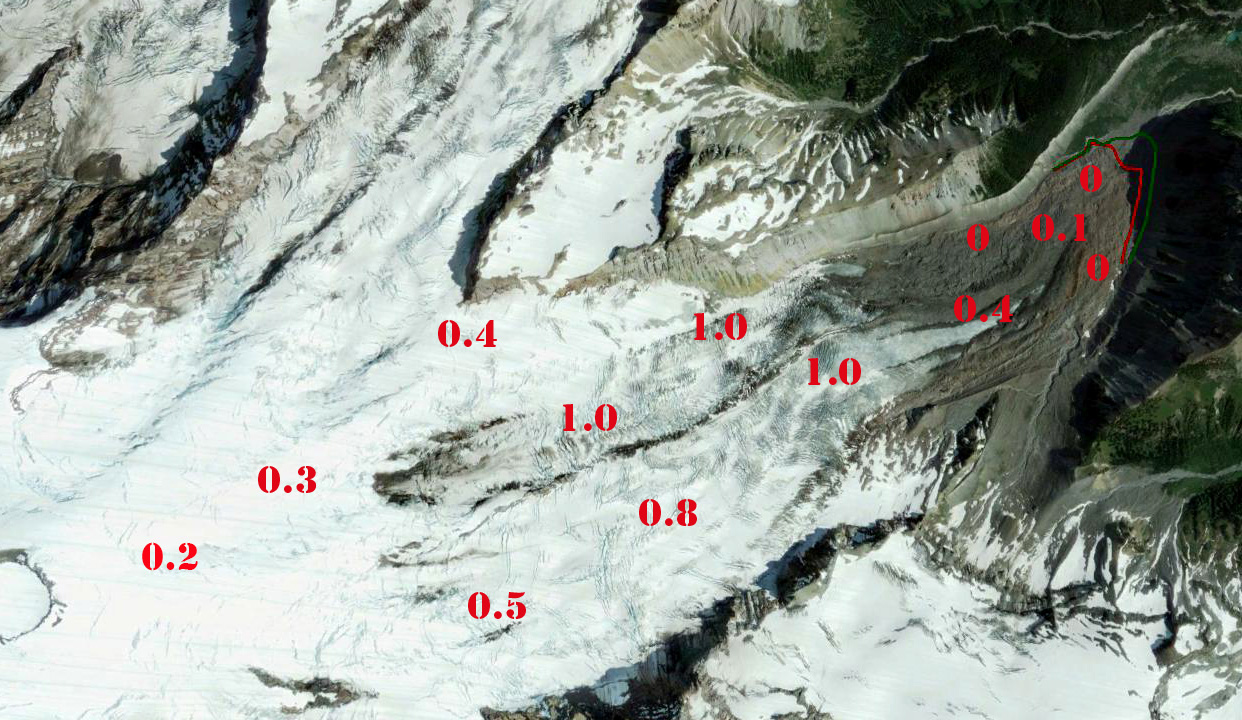
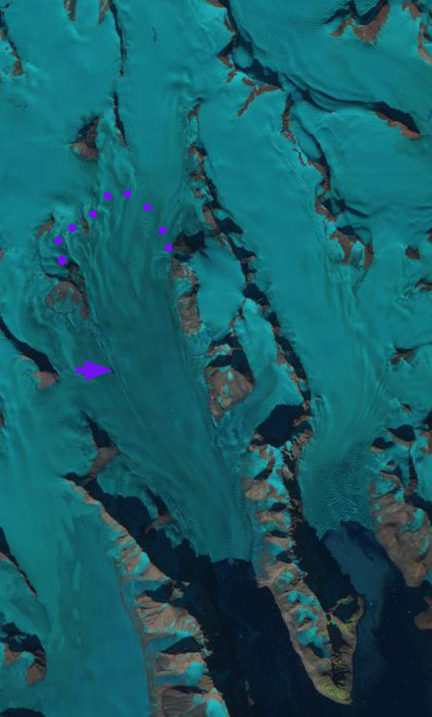
The Feb. 2011 earthquake near Christchurch led to a major calving event of a portion of the rotten stagnant terminus reach of the Tasman Glacier. There was no evident calving event from Murchison Glacier.This has led to increased exposure of bedrock high on the glacier and reduction of tributary inflow noted at purple arrows.
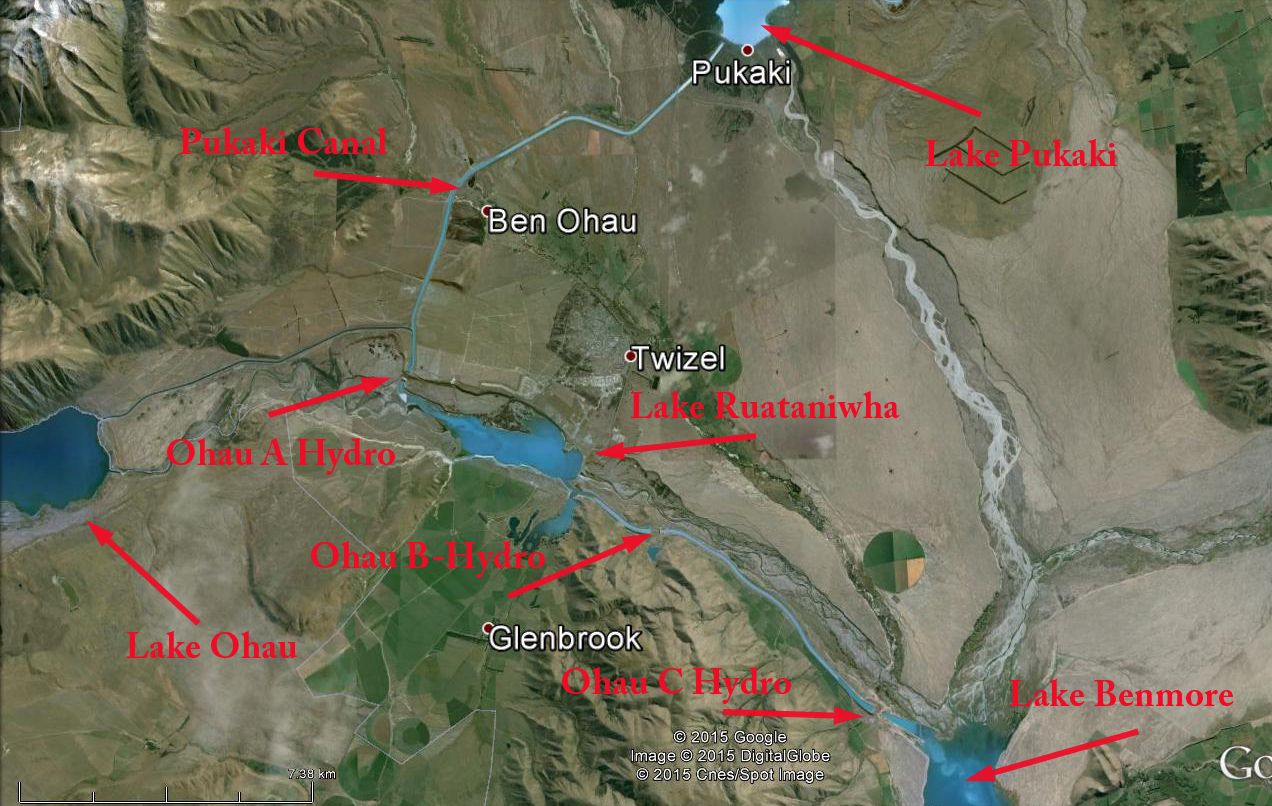
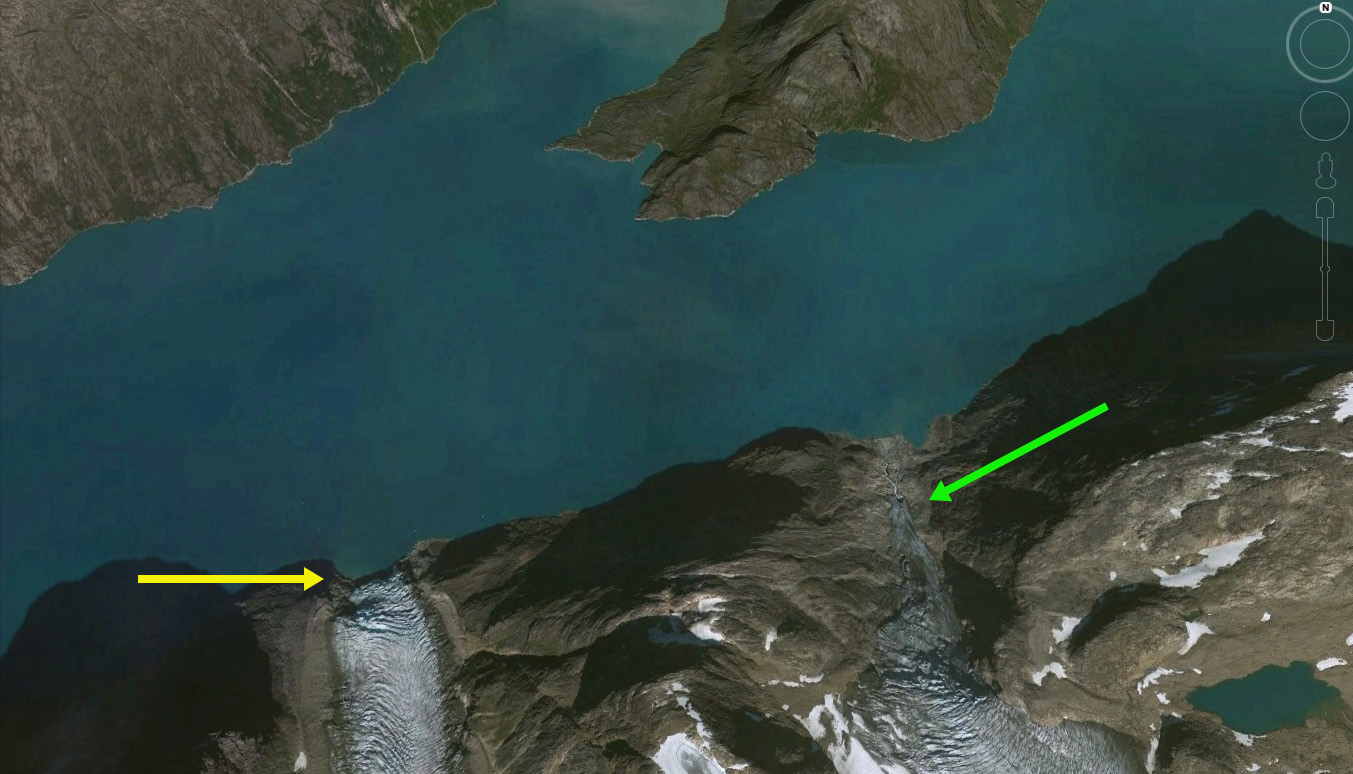
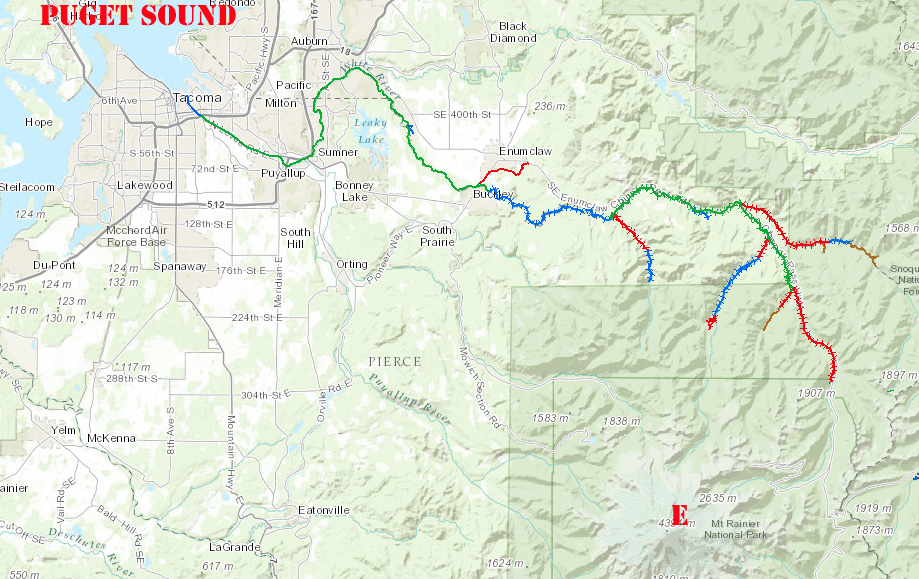
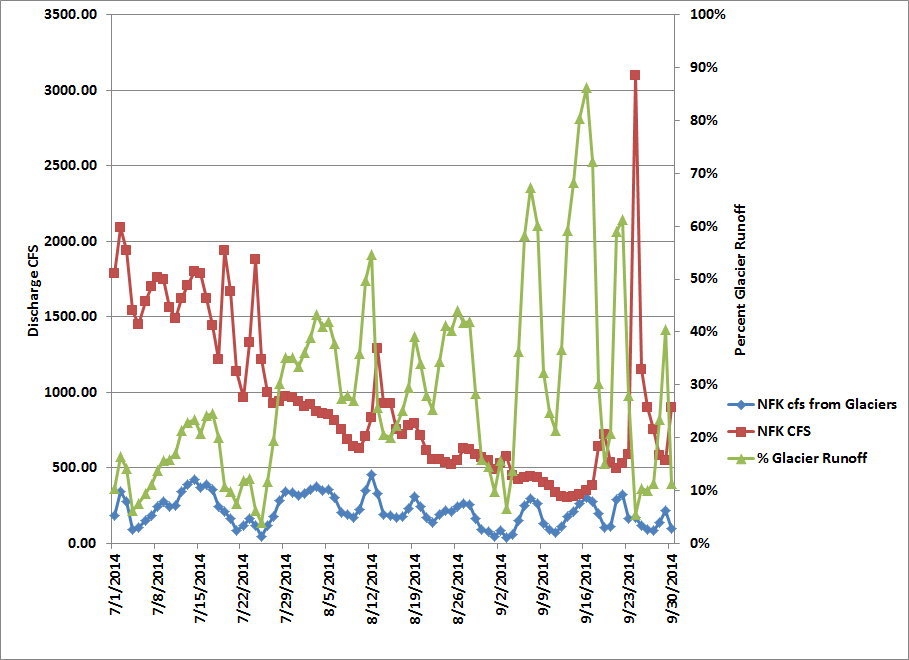
Murchison Glacier drains into Lake Pukaki,a along with Hooker, Mueller and Tasman Glacier, where water level has been raised 9 m for hydropower purposes. Water from Lake Pukaki is sent through a canal into the Lake Ohau watershed and then through six hydropower plants of the Waitaki hydro scheme: Ohau A, B and C. Benmore, Aviemore and Waitaki with a combined output of 1340 MW. Meridian owns and operates all six hydro stations located from Lake Pūkaki to Waitaki. Reductions in glacier area in the watershed will lead to reduced summer runoff into the Lake Pukaki system. Below the Benore Dam is pictured,. Interestingly salmon have been introduced into the Waitaki River system for fishing near its mouth. Benmore Lake itself is an internationally renowned trout fishing spot, providing habitat for both brown trout and rainbow trout.

Google Earth Image with Benmore Dam in foreground and Benmore Lake. This hydropower system is fed by a canal from Lake Pukaki which in turn is fed by Murchison Glacier.