This 2016 winter has proved much different than in 2015. In 2015 exceptional warmth led to record low snowpack despite above average precipitation. The warmth is illustrated using the North American Freezing Level Tracker for our Sholes Glacier site. The highest mean level by far is 2015, 500 m above average versus 180 m above average this winter. The low snowpack combined with a long warm melt season in 2015 led to the highest mass losses from North Cascade glaciers in our 32 years of observations.
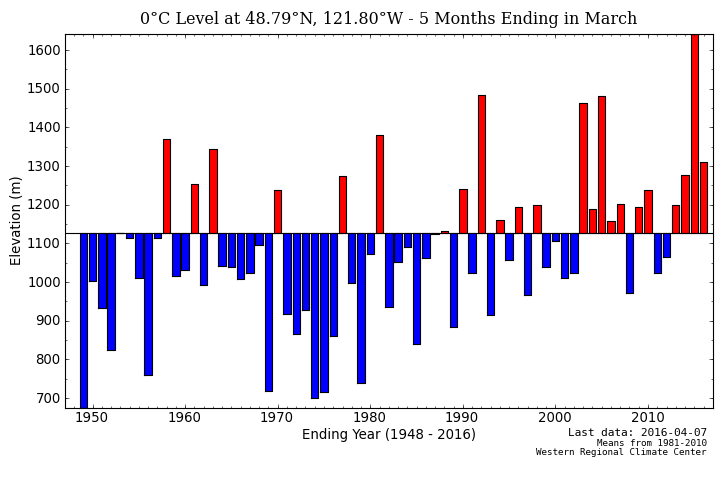
Freezing Levels for the November-March period at Sholes Glacier in the North Cascades.
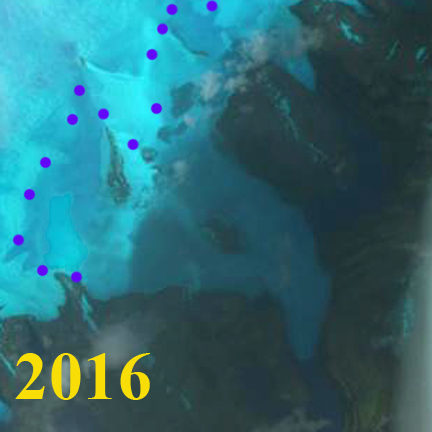
A key date for snowpack assessment has always been April 1. As a result there is good data set from six of the invaluable USDA SNOTEL sites in the North Cascades since 1946. A comparison of snowpack water equivalent (SWE) and total precipitation yield a ratio of SWE retained on April 1 to total precipitation. The result is the ratio between SWE and precipitation, snowpack storage efficiency has been in decline, as noted by Mote et al (2008) and Pelto (2008). The best long term precipitation stations in the region are Diablo Dam and Concrete, we use the average of the two. The storage efficiency ratio was a minimum in 2015 at only 19% of precipitation retained as snowpack. In 2016, 43% of precipitation has been retained leading to snowpack that is 10% above the mean for the 1984-2015 period.Winter precipitation over the period has a positive trend and SWE a negative trend. This declining ratio led Jon Riedel of the North Cascades National Park Service to observe that we now need 120% of average precipitation to achieve average snowpack. It is interesting to note that 2014, 2015 and 2016 had quite similar November-March total precipitation. With 2016 slightly exceeding 2014 for snowpack.
In 2014 the glaciers had a poor year, not due to low snowpack but to high melt season temperatures. What will transpire in 2016 will be the focus on our 33rd consecutive annual field season monitoring North Cascade glaciers. In the last 10 days warm weather in the region has led to significant snowpack melt. At low elevation sites snowpack depth and SWE have decreased by 20% at sites like Trinity 2930 feet. Just 10 miles away at Lyman Lake at 5980 feet the snow depth decreased from 170 inches to 142 inches, but SWE has not declined. As is typical this early snowmelt period leads to percolation and either refreezing or storage within the snowpack. This is still an important ripening that must occur before SWE can drop. Typically SWE reaches a maximum at the elevations of glaciers between May 1 and 10. A 10 day warm period as has occurred may indicate an early peak, but April could also feature more snow storms that will lead to future increases. From Alaska to British Columbia to Washington groups are heading into the field to assess snow depth on glaciers at the end of this winter season. Snowpits, snow stakes emplaced last last summer and Ground Penetrating Radar will all be deployed.

Trends in winter precipitation November-march in the North Cascades , average of Concrete and Diablo Dam. Mean SWE at six USDA SNOTEL station on April 1 (Fish Lake, Lyman Lake, Park Creek, Rainy Pass, Stampede Pass and Stevens Pass). Ratio of April 1 SWE and winter precipitation.

Mean SWE at six USDA SNOTEL station on April 1 (Fish Lake, Lyman Lake, Park Creek, Rainy Pass, Stampede Pass and Stevens Pass.

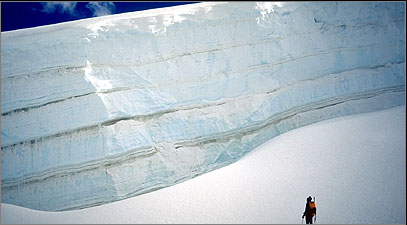
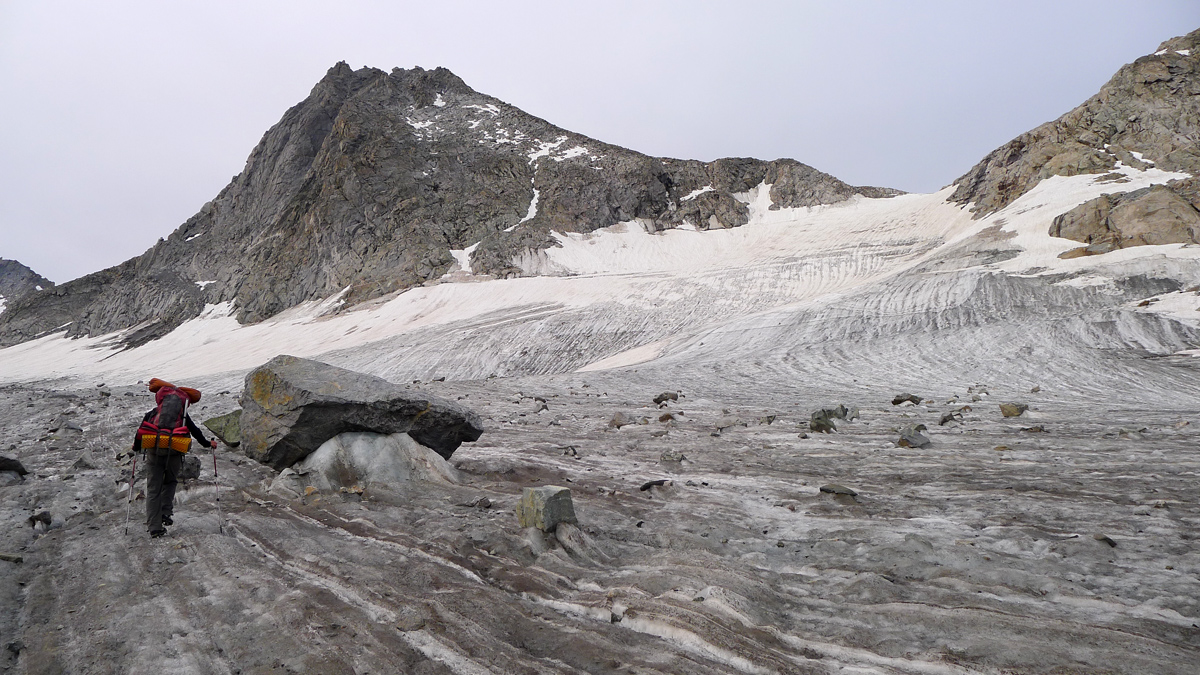
Assessing snow depth on Easton Glacier using crevasse stratigraphy.
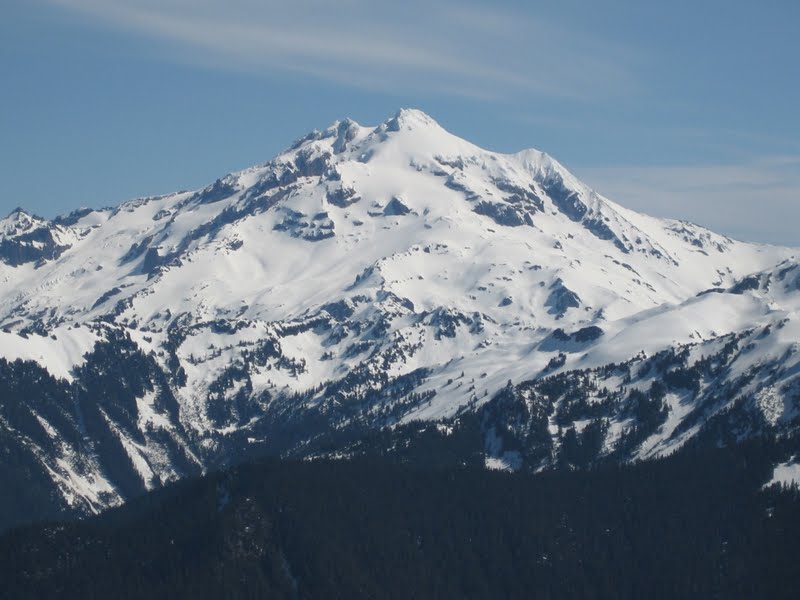
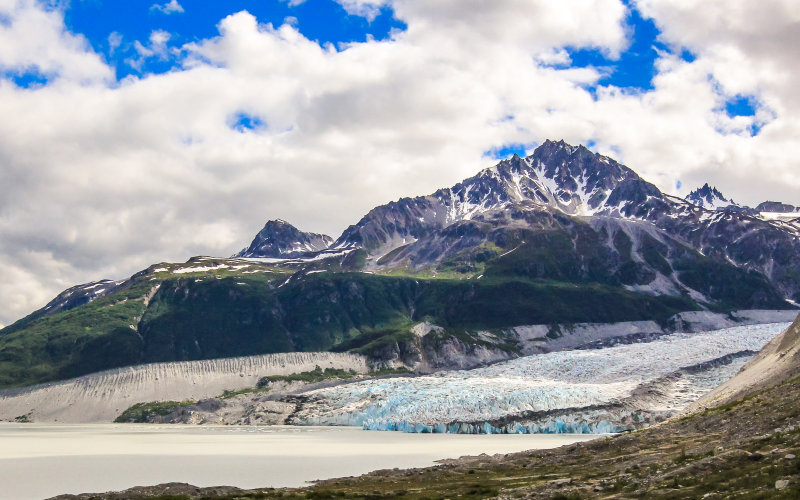
Image above of Glacier Peak and below of Monte Cristo Peaks in the North Cascades on April 9, 2016 from a trip to Bedal Peak by raising3hikers at NWHikers.net. The blanket of snow remains deep.