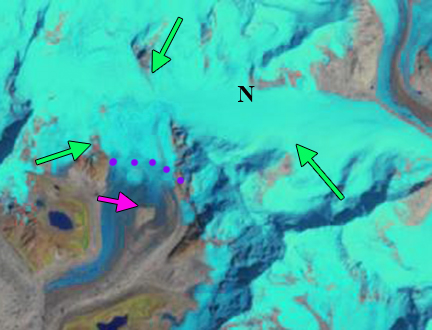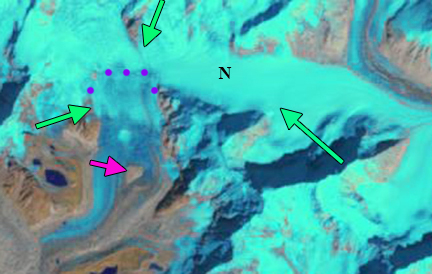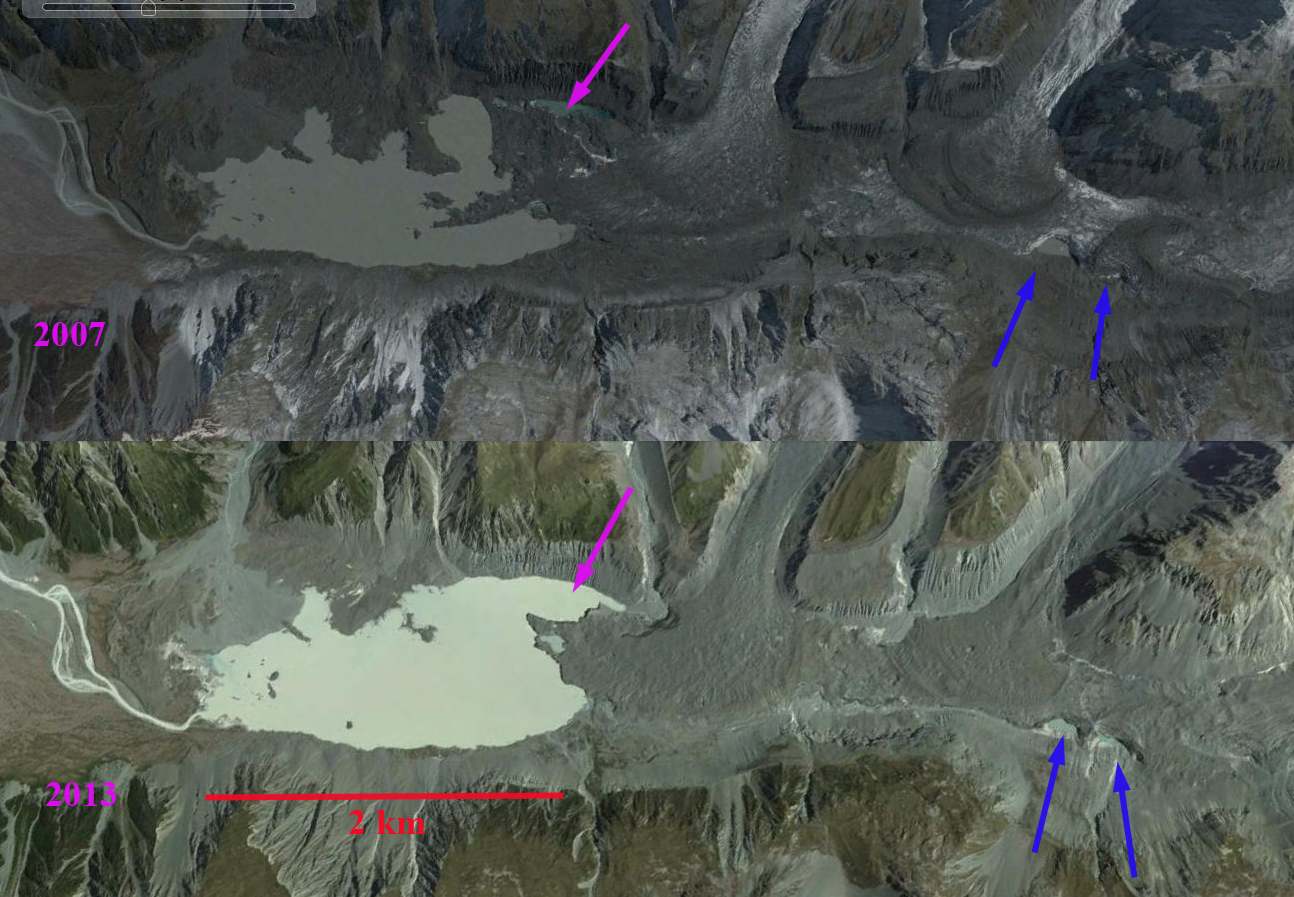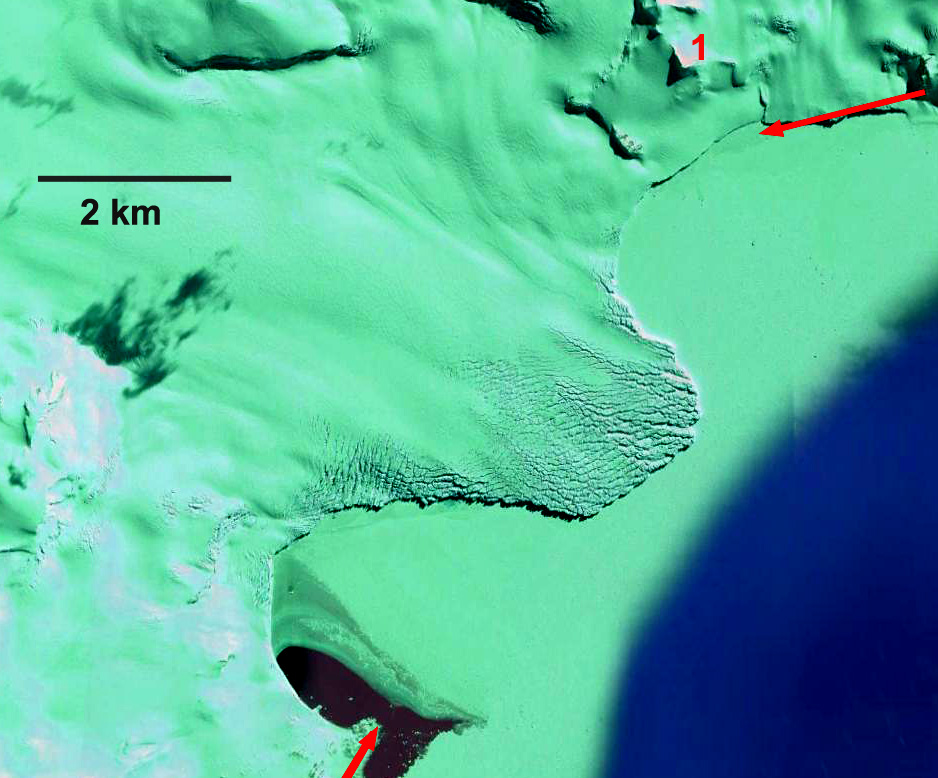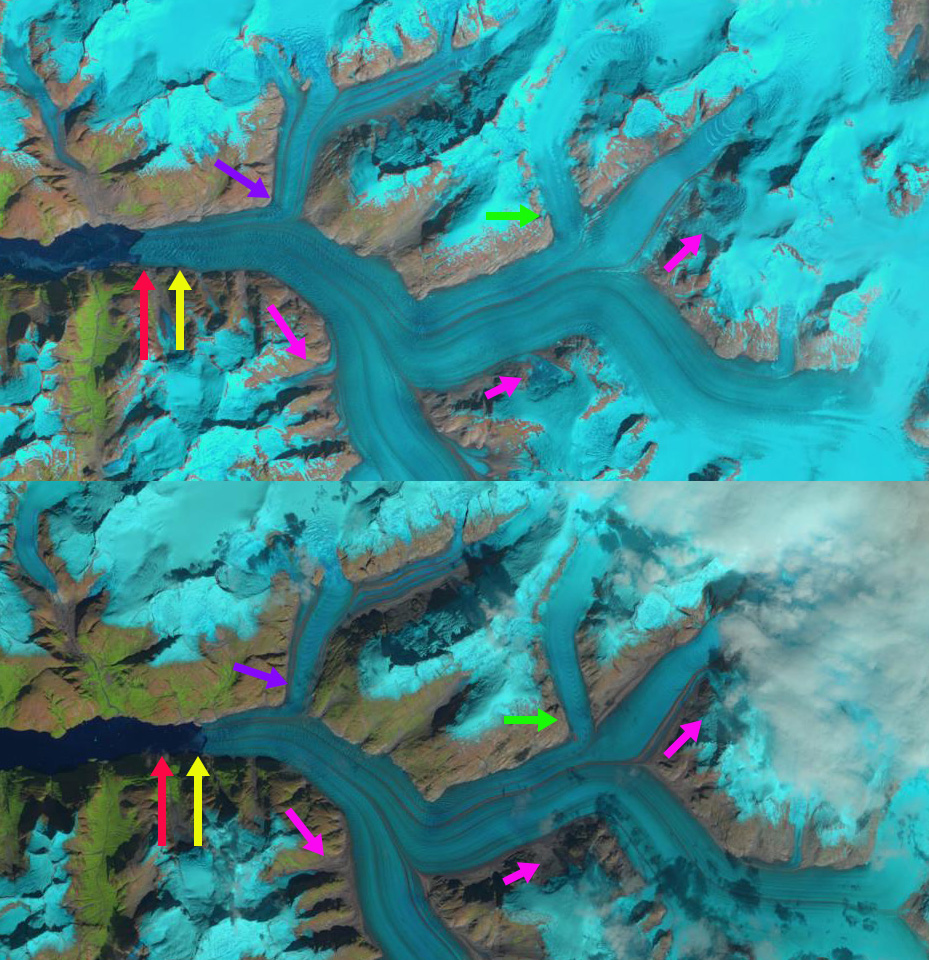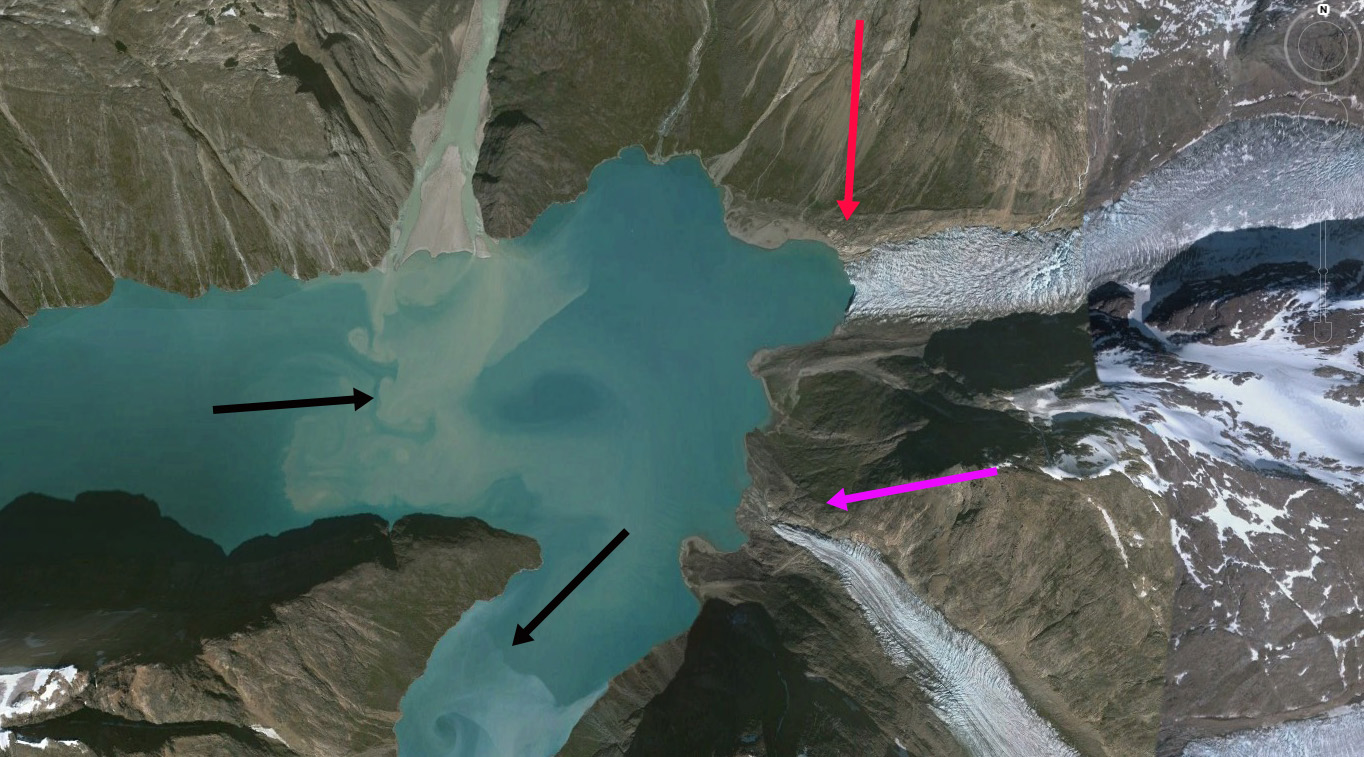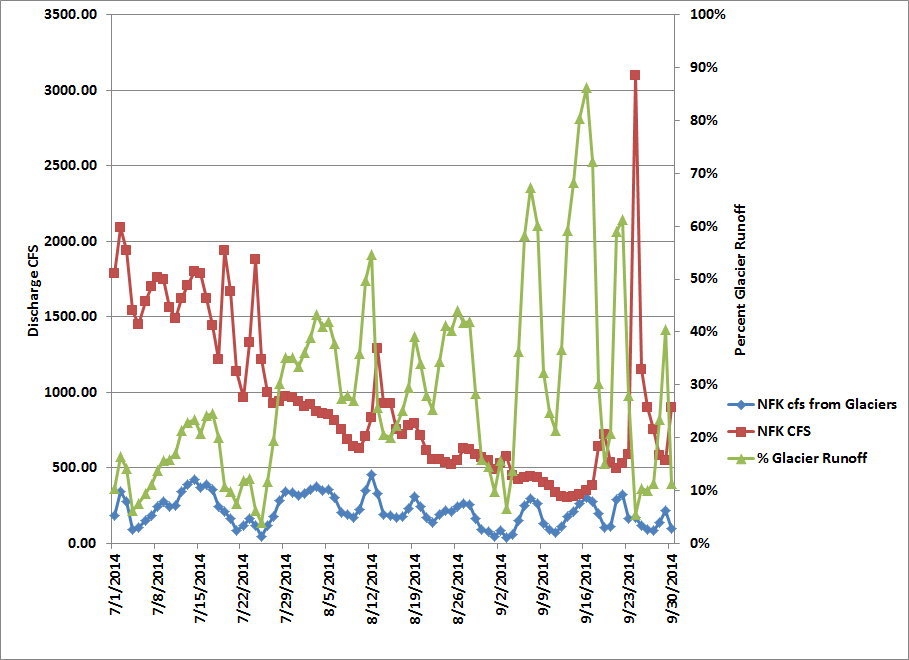
Landsat image comparison from 1990 and 2015 of the Pré de Bar Glacier (P). The adjacent Argentiere Glacier (A) is shown, the red arrow is the 1990 terminus, the yellow arrow the 2015 terminus and the purple dots the snowline. Retreat from 1990 to 2015 was
Pré de Bar Glacier is a glacier on the east side of Aiguille de Triolet and south side of Mont Dolent. This is a steep valley glacier that experienced a large retreat during the first half of the 20th century, then advanced from the 1960’s-1980’s, before beginning a retreat again in 1990, that has continued to 2015. In the Landsat images above the 1990 terminus extended approximately 600 m beyond the base of an icefall, forming a substantial low slope terminus lobe. By 2015 this lobe below the icefall had disappeared and the terminus is now at the base of the icefall, with a net retreat of 550 m since 1990. With the retreat increasing during each five year increment according to WGMS from 1990-2010 and image analysis here from 2011-2015. The retreat is measured each year by the Italian Glacier Committee and reported to WGMS. The New Italian Glacier Inventory that has just been released has reports on each region of glaciers in Italy. For the Glaciers of Aosta Valley it is observed that there are 192 glaciers about 21% of Italy’s total, covering 133.7 square kilometers, 24% less than a half-century ago. This amazing inventory was completed by the Earth Science Department of the University of Milan’s Glaciology staff, led by Claudio Smiraglia and Guglielmina Diolaiuti. On page 91 of the Aosta Chapter is a series of images of Pré de Bar from 1897, 1993 and 2012. The main change from 1993 to 2012 is the loss of the terminus lobe below the narrow icefall.
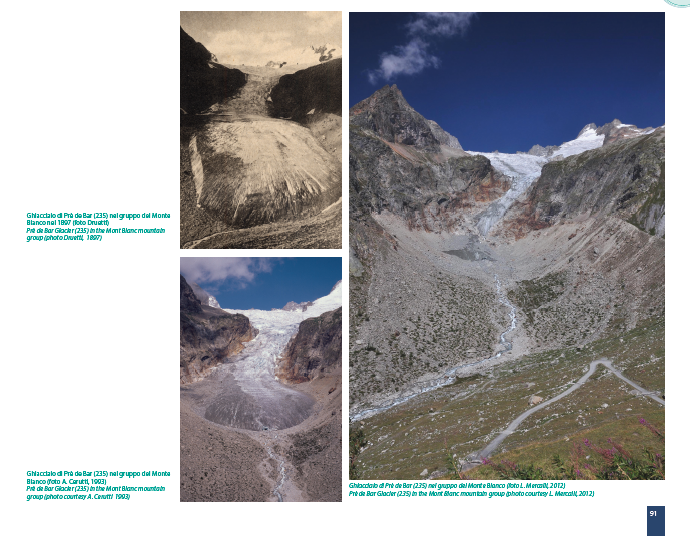
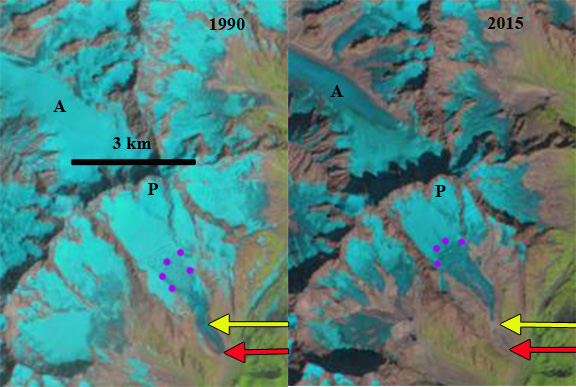
Figure from the New Italian Glacier Inventory of Pré de Bar Glacier in 1897, 1993 and 2012
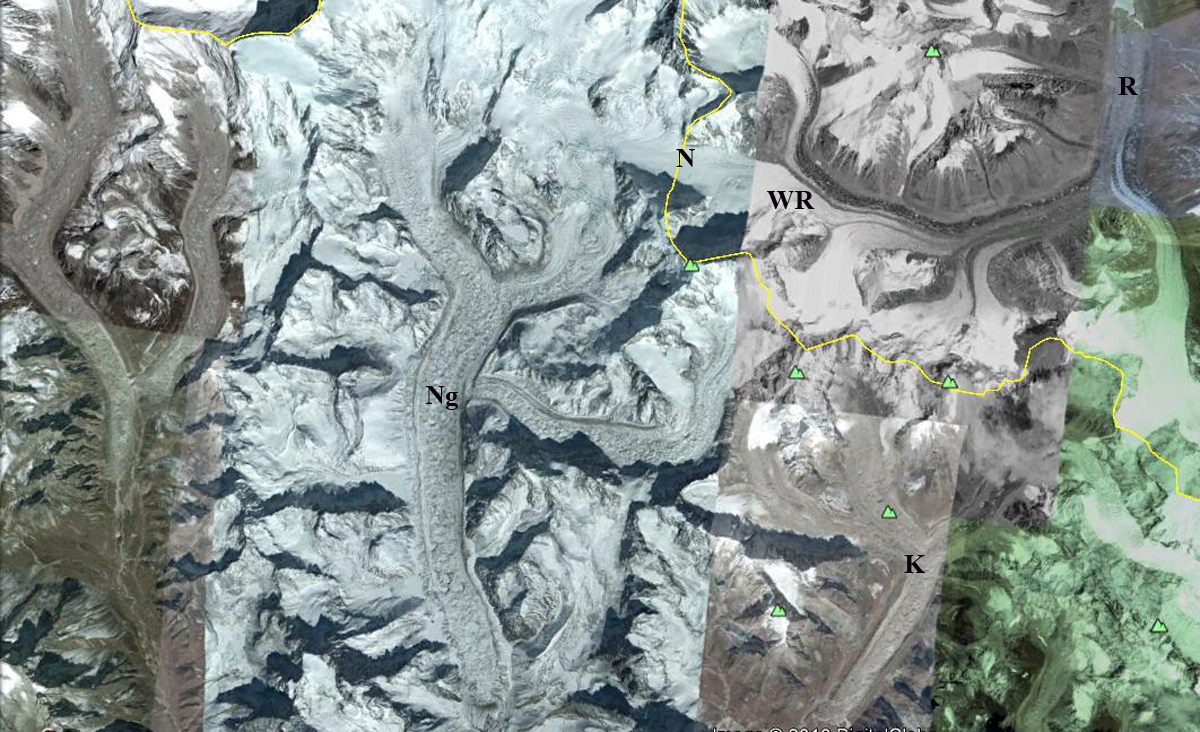
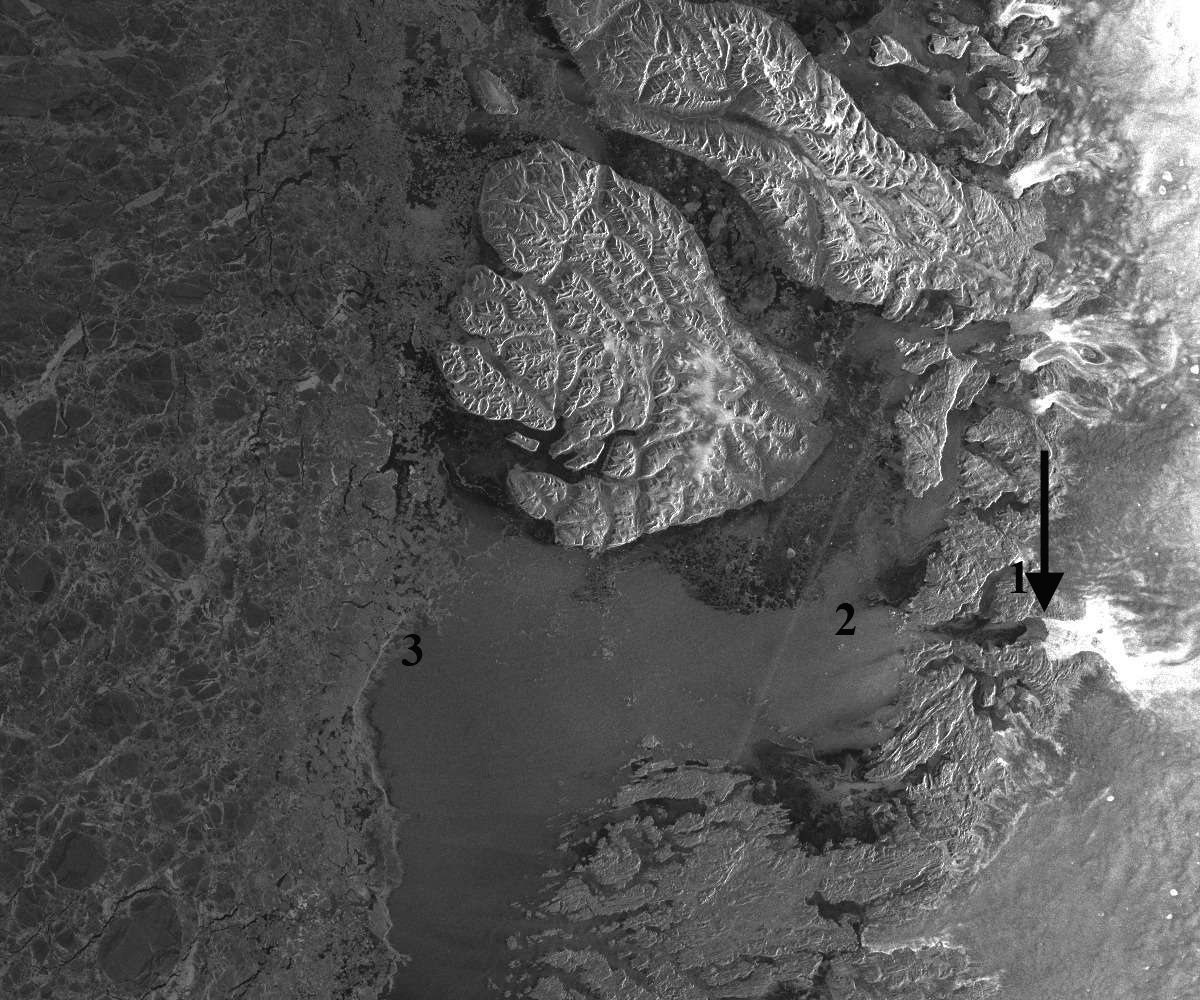
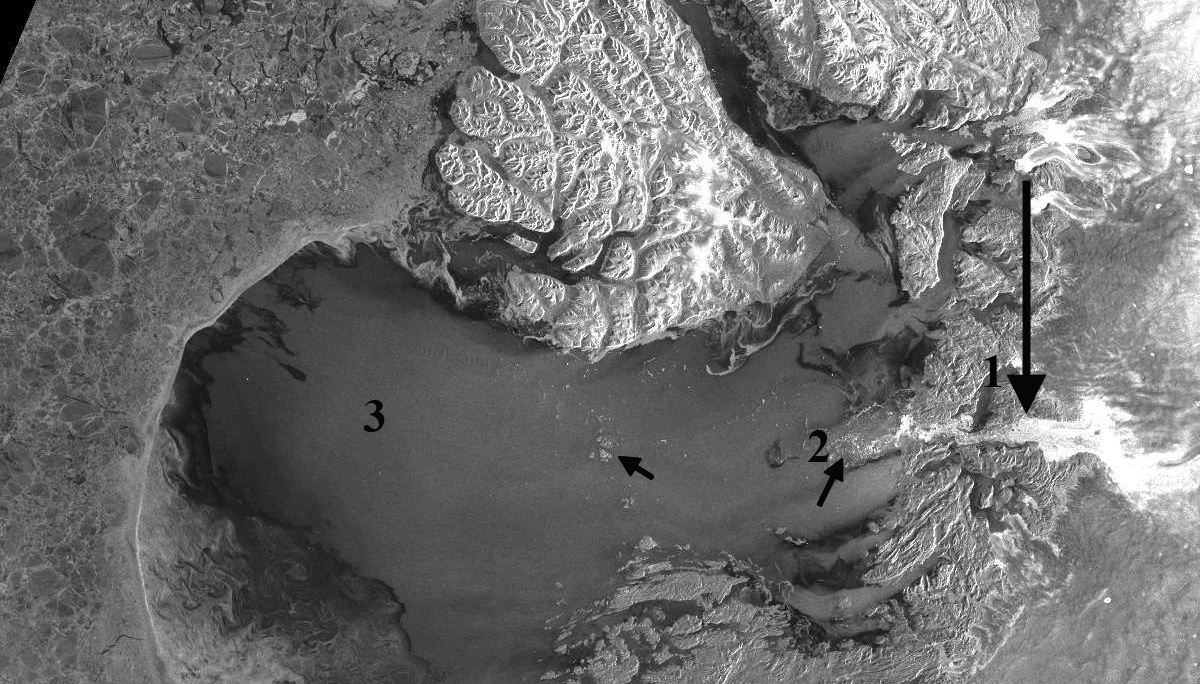
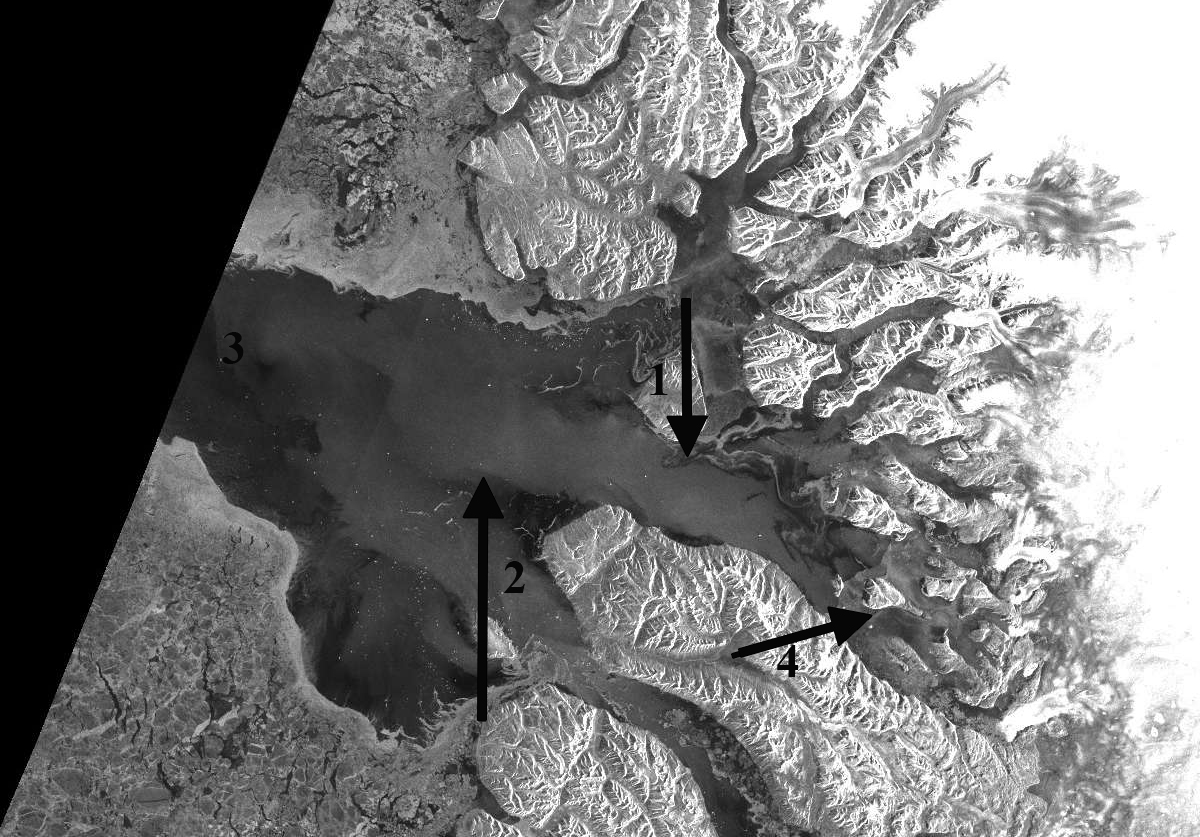
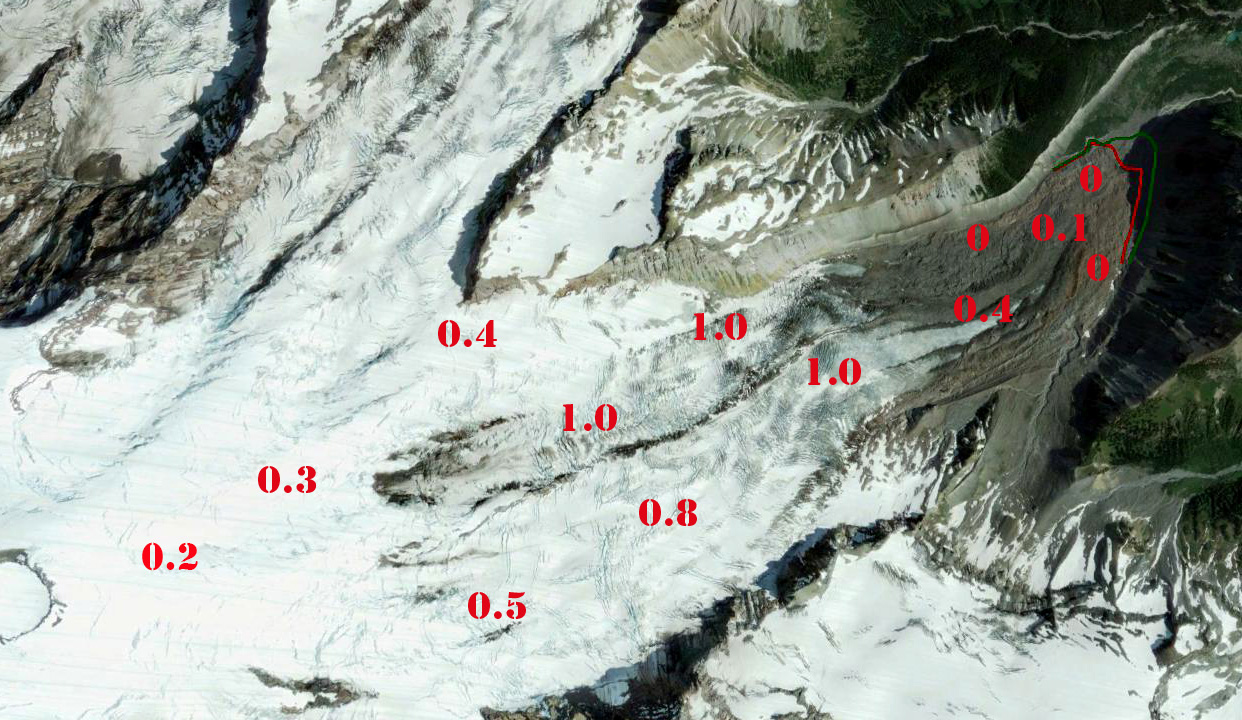
Berthier et al (2014) mapped ice thickness changes in this region from 2003 to 2012 using the Pléiades satellites. They identify a negative Mont Blanc region wide mass balance of glaciers of -1.04 m/year for the 2003-2012 period. On Pré de Bar Glacier their figure below indicates at least 5 m thinning across nearly the entire glacier, with more than 25 m of thinning in the terminus region below the icefall. This dramatic thinning largely driven by increasing summer melting. Bonnano et al (2012) identified a long term retreat rate of 3 m per year for the glacier. However, retreat from 1990 to 2015 is 22 m/year, the WGMS indicates retreat of 404 m from 1990-2010, a rate of 20 m/year. The rate of retreat incireased from 16 m/year in the 1990’s to 24 m/year in the 2000’s. The thinning identified by Berthier et al (2014) up to 2012 high on the glacier suggests this will continue. Note in the image below from Bonnano et al., (2012) of Pré de Bar Glacier the amount of firn exposed above the ELA particularly on the two easternmost feeders, and the 2015 Landsat image indicates the annual ELA is closer to the end of the black arrows in that image than the red line from 2000. The pattern of thinning is similar to that of nearby Lex Blanche Glacier, and Glacier d’Argentiere, but Mer de Glace has a much larger relatively low slope ablation zone section with high thinning.
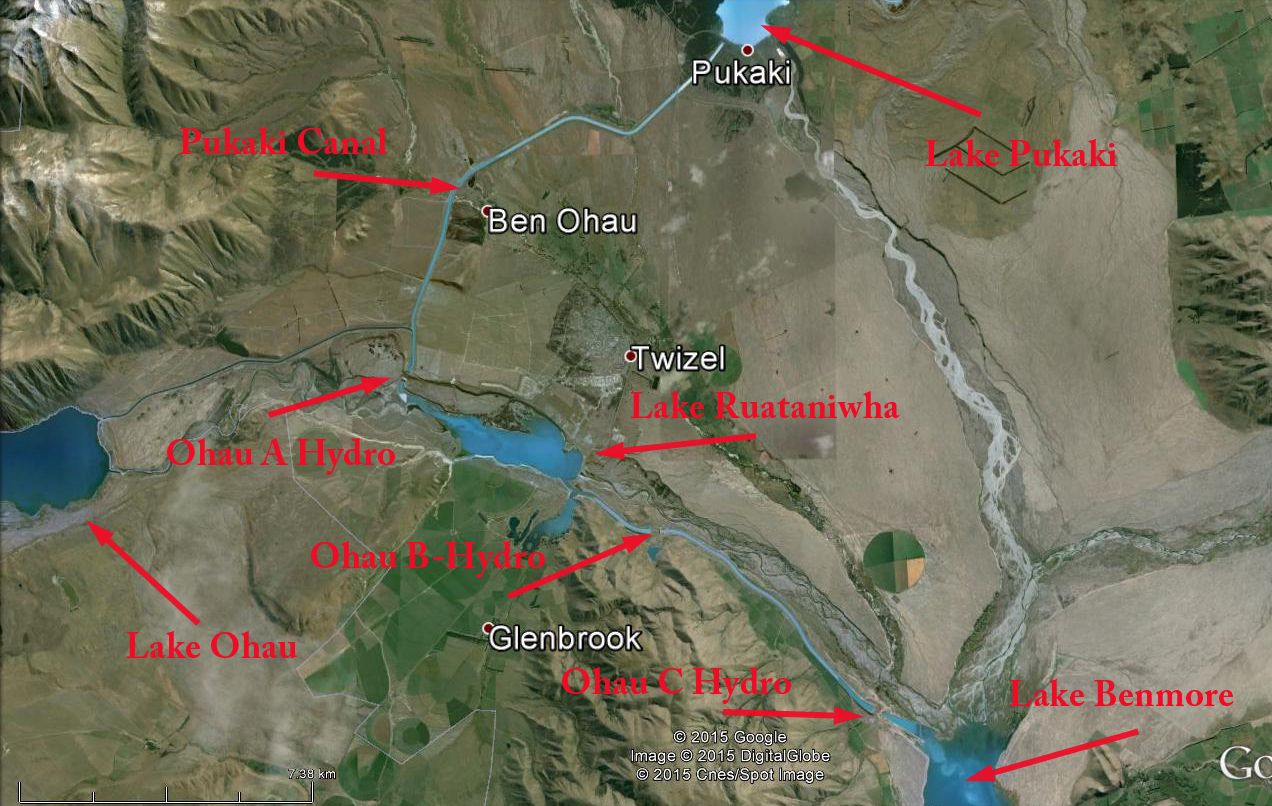
The meltwater runoff from this glacier feeds the Dora Baltea River and eventually the Po River. The Aosta Valle region hosts extensive hydropower along this drainage including the Avise, Champagne,Nus, Montjovet, Isollaz, Chatillon, Verras, Hone and Ivrea.
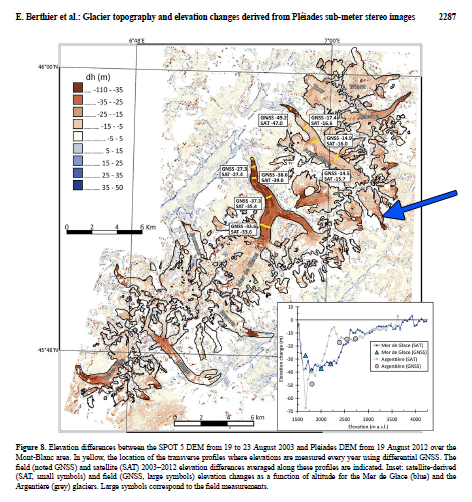
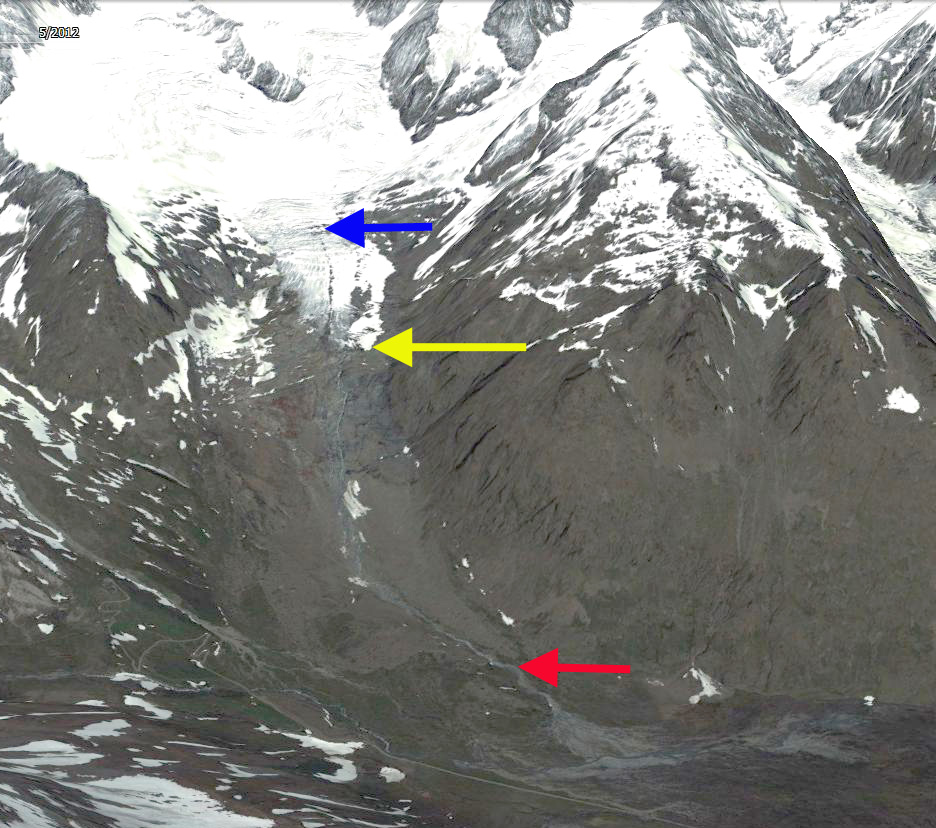
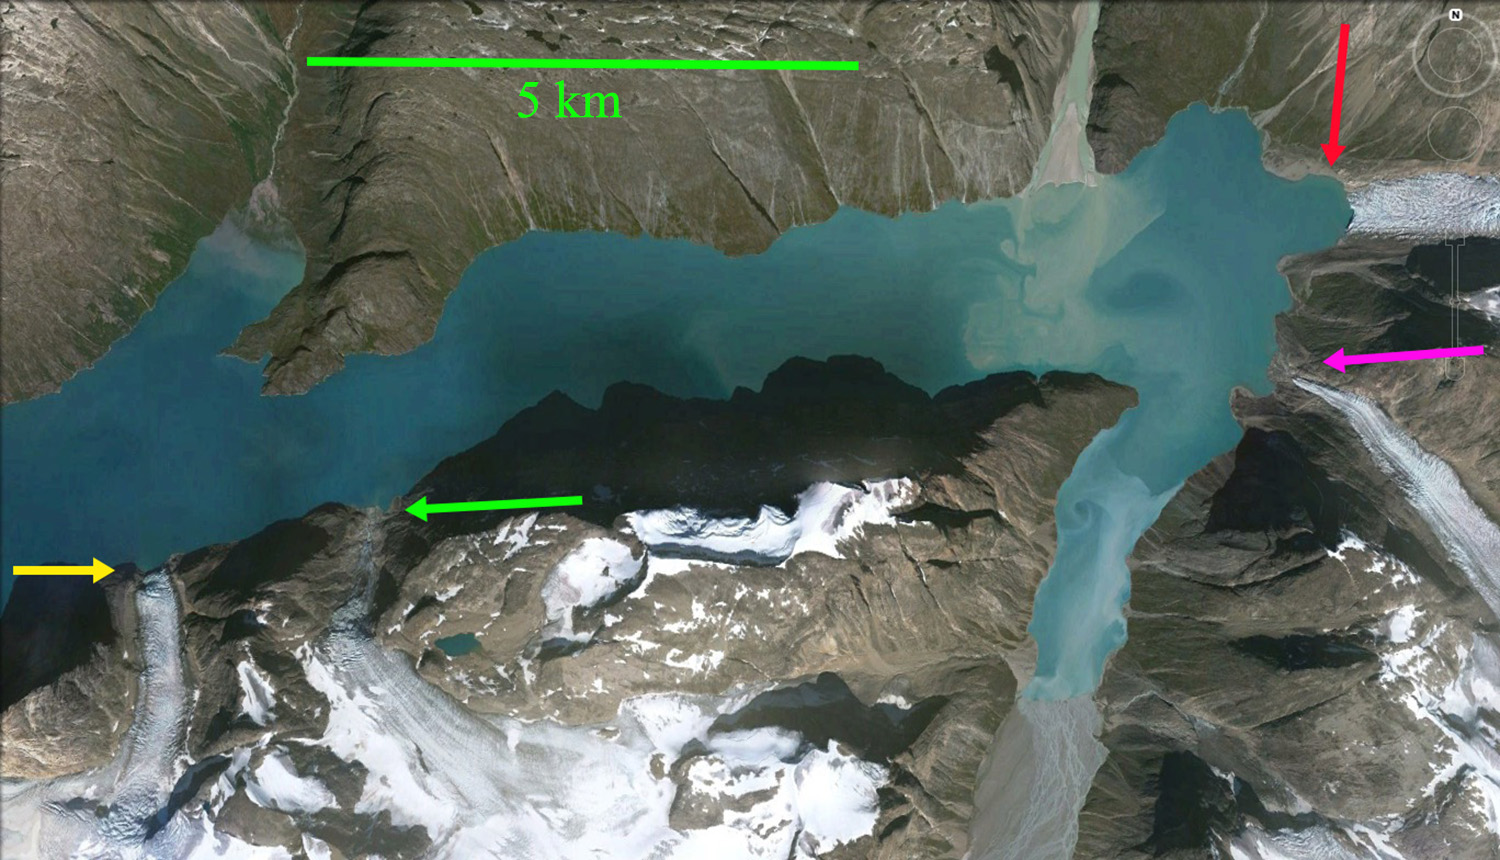
Figure from Berthier et al (2014) indicating thinning of Mont Blanc Glacier 2003-2012, Pre de Bar Glacier noted with blue arrow.

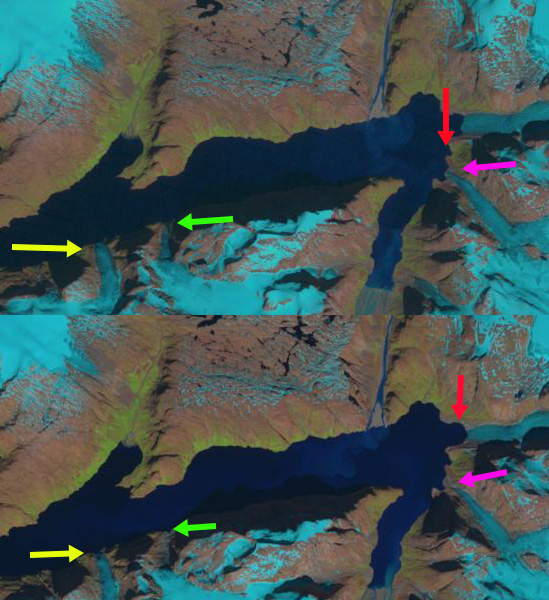
Pre de Bar Glacier in 2000 showing the ablation zone, accumulation zone, ELA, glacier front this is from Bonnano et al (2012)