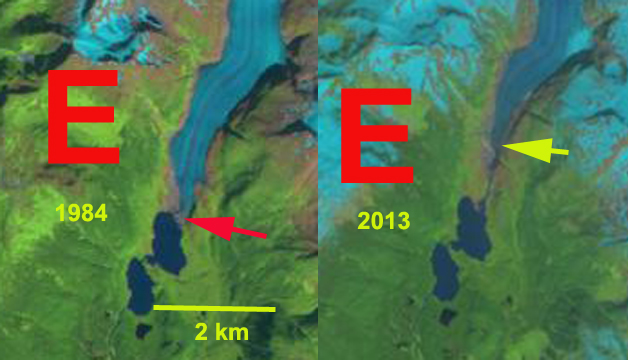
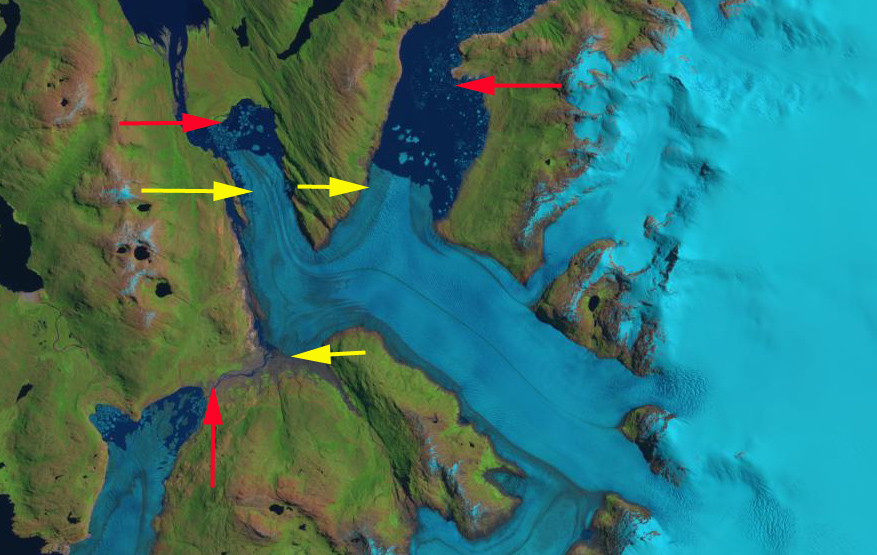
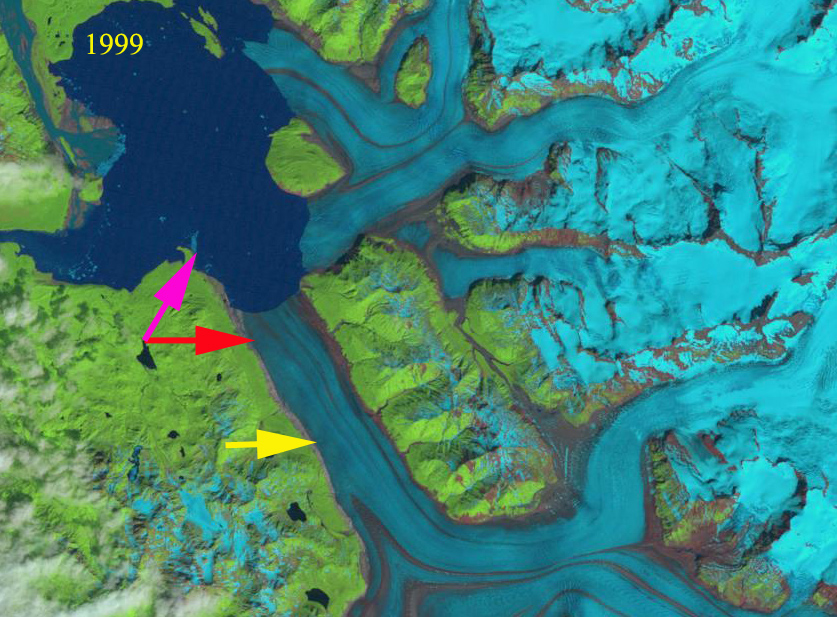
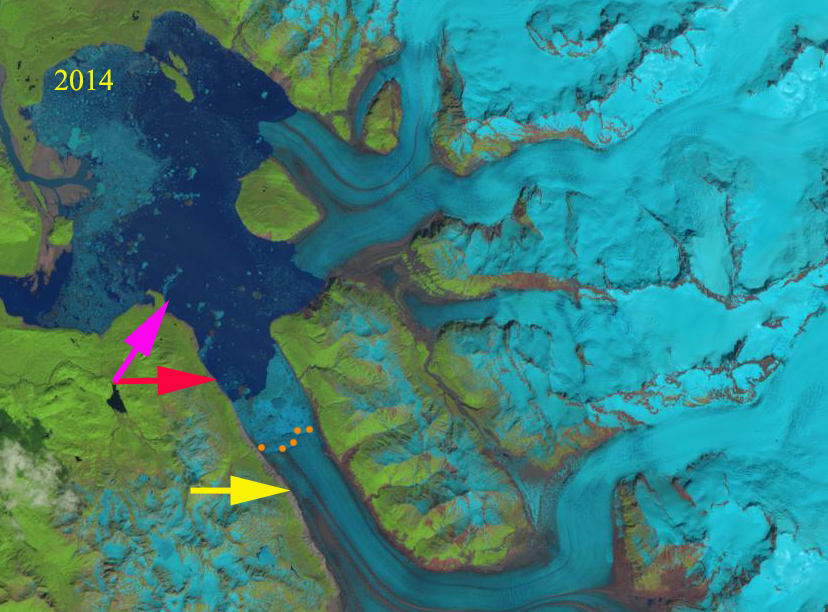
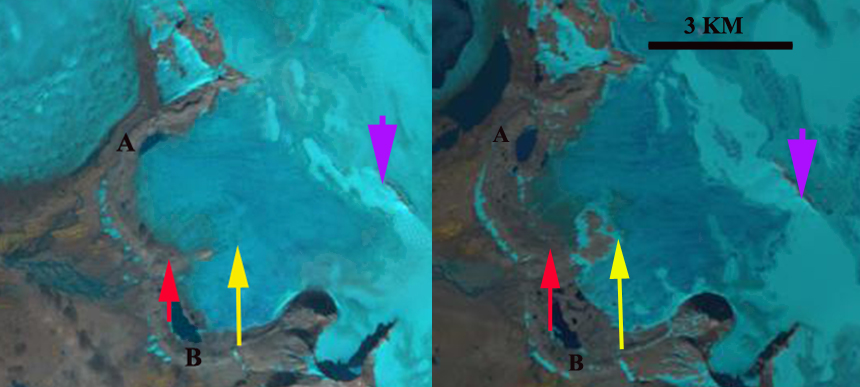
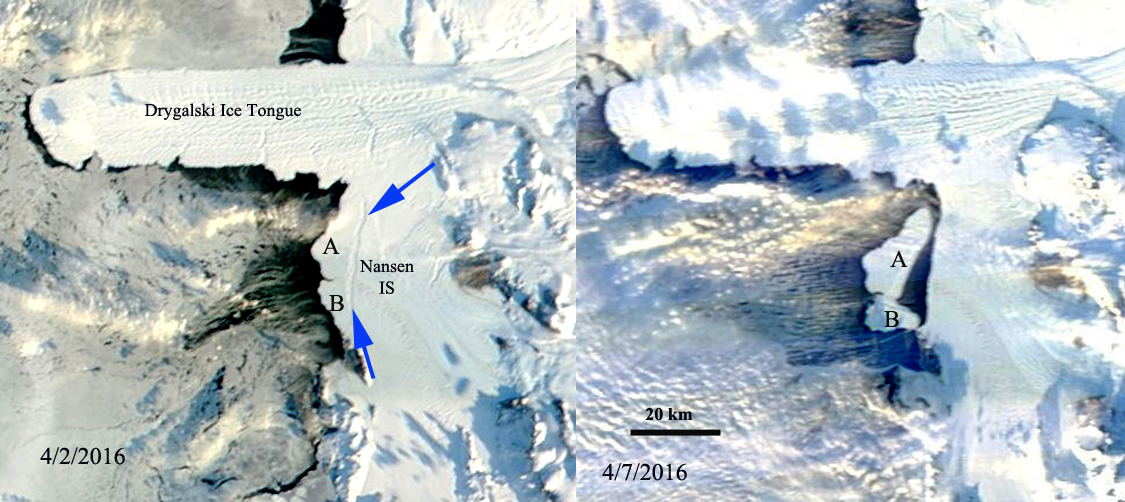
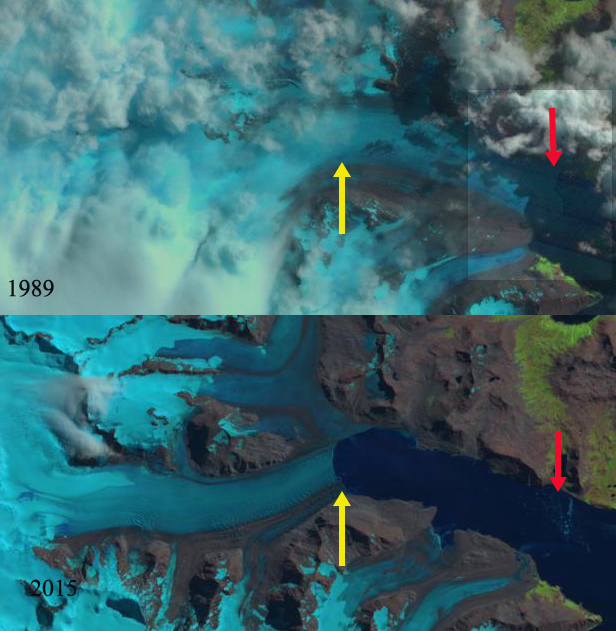
Tingmiarmit Glacier comparison in 1999 and 2015 Landsat images indicating the separation of tributaries at the terminus. The red arrows indicate the 1999 terminus and the yellow arrows the 2015 terminus location. Point A is peninsula where the tributaries joined, and Point B is a nunatak just upglacier from the 2015 terminus.
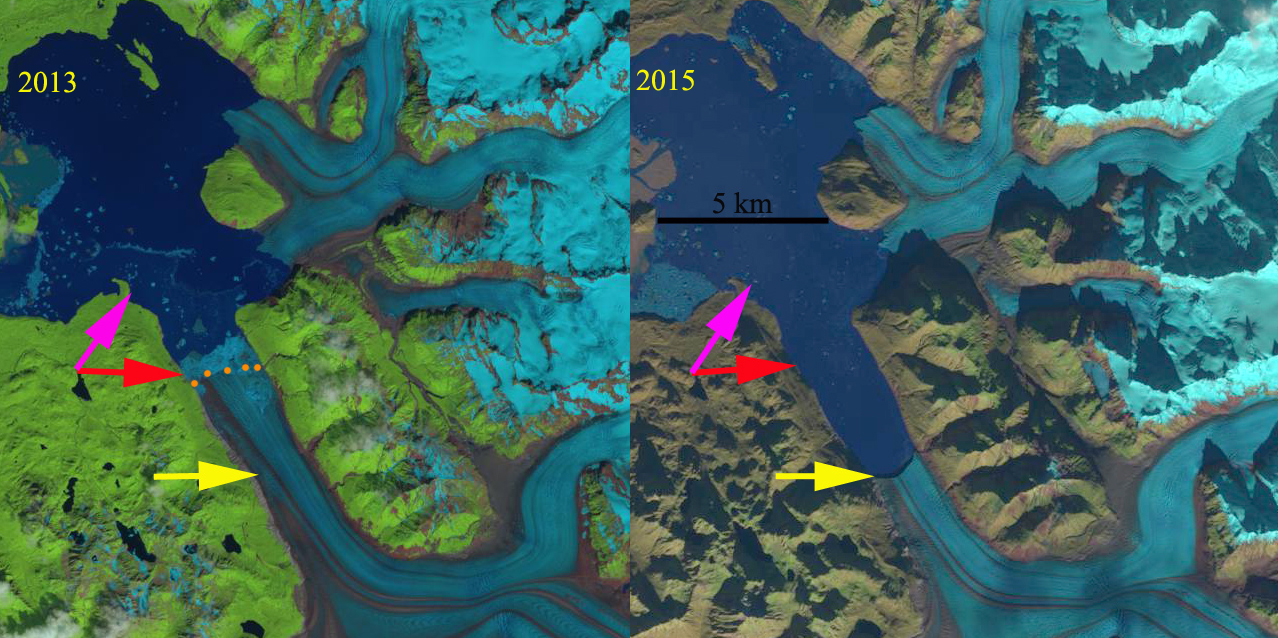
Tingmiarmit Glacier (Timmiarmiit also) ends in the Tingmiarmit Kangertivat Fjord in southeast Greenland. The glacier is just south of Heimdal Glacier and is noted by Rignot et al (2012) as having a velocity of 1.4 to 3 km/year. Moon et al (2012) note that most glaciers in SE Greenland experienced a significant velocity increase after 2000. In 1999 the glacier terminus was beyond the junction of two main tributaries, with little variation from 1994. Here we examine 1999-2015 imagery to identify the separation and retreat. The retreat is similar to that of nearby Thrym Glacier, which also had a tributary separation and nearby Puisortoq.
In 1999 the glacier terminates 1 km beyond the junction of the two tributaries, indicated by red arrow on each image. The fjord is 2.2 km wide at this point. The terminus had not changed in 2001 Landsat imagery. By 2010 terminus is now located at the junction of the two glaciers. which still share a single calving front, though the calving front is longer with northern and western facing section. In 2015 retreat has led to complete separation of the western and northern tributary. The western tributary is the main glacier and has retreated 2.4 km and the northern tributary has retreated 2.2 km in the sixteen year period. The retreat of the northern tributary has been slower since 2010. The western tributary now terminates 1.5 km from former junction.The fjord is expanding in width, which suggests the current terminus is not at a stable location. The nunatak marked B is a potential point of stability but not likely as the main arm of the glacier goes south of this location and then the fjord continues to expand. Moon and Joughin (2008) observed an ice sheet tidewater glacier retreat rate increase from 2000-2006, coinciding with an increase here. Howat and Eddy (2010) noted a mean change for this region of -107 m per year. Tingmiarmit Glacier’s rate of retreat was slightly higher at 120 m/year for the 1999-2010 period and . Polar Portal continues to expand the number of glaciers with updated terminus positions from satellite imagery with 20 presently.
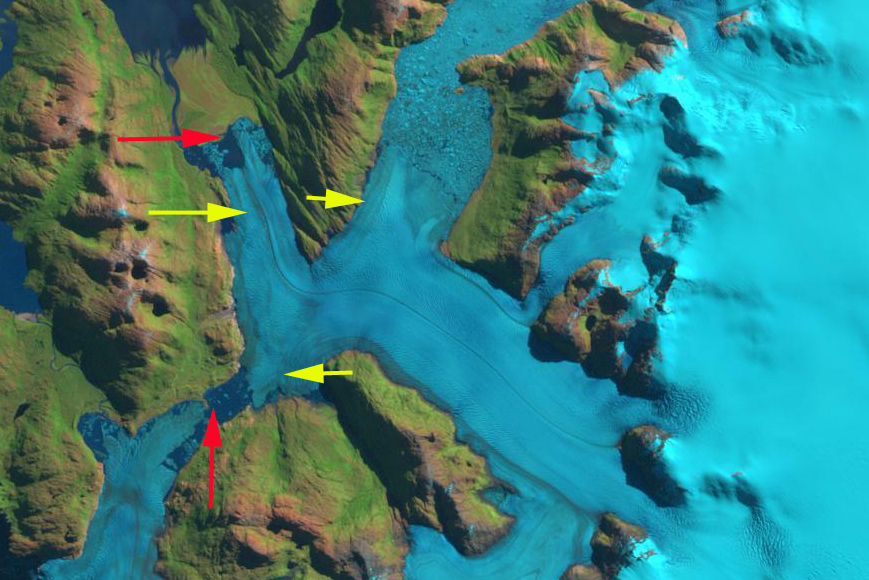
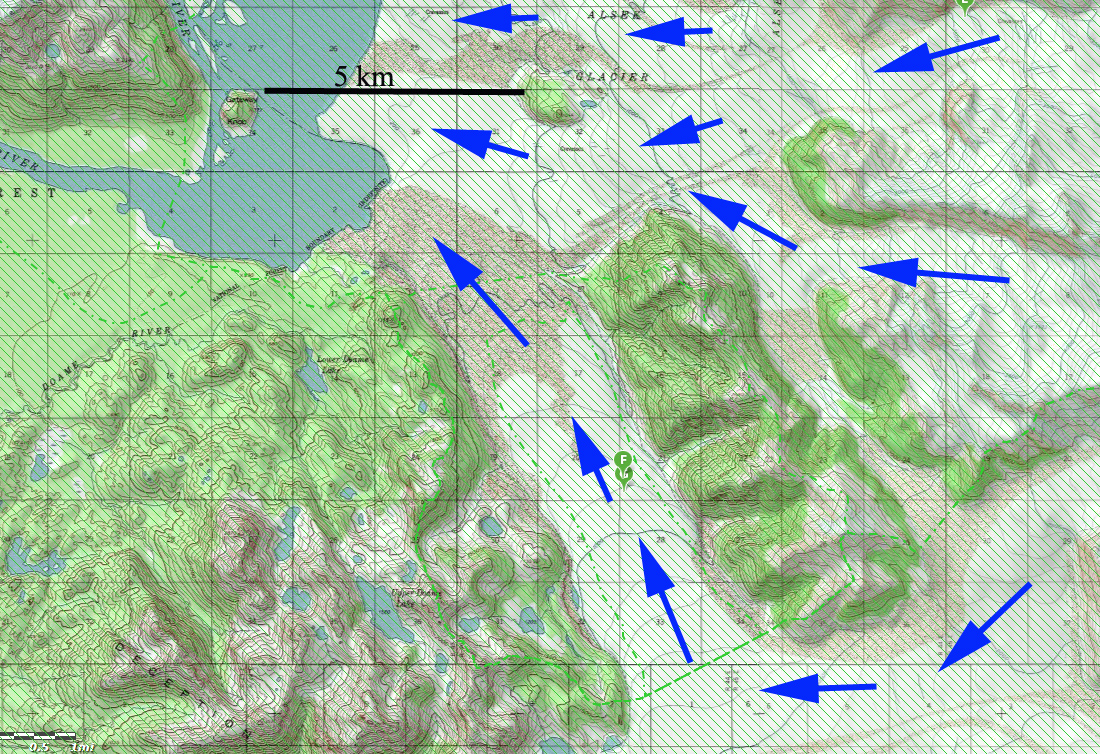
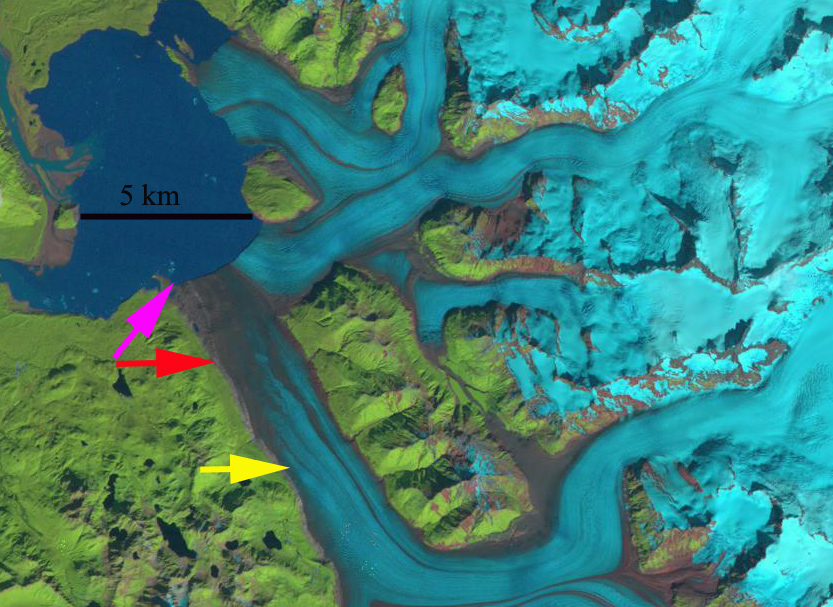
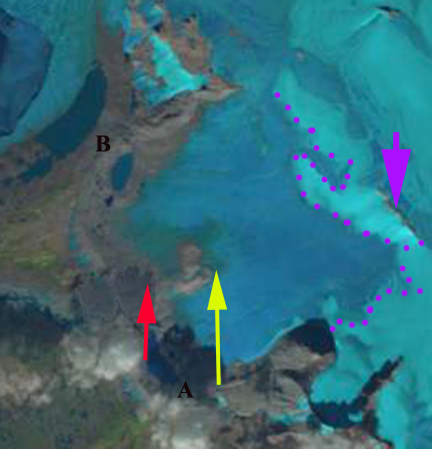
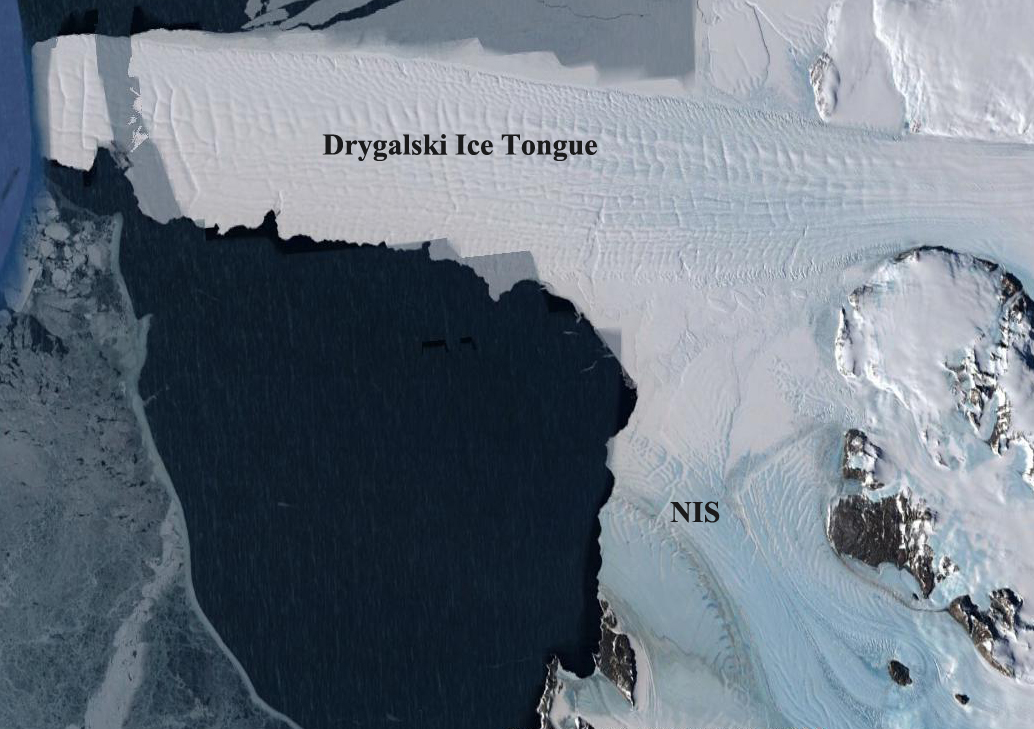
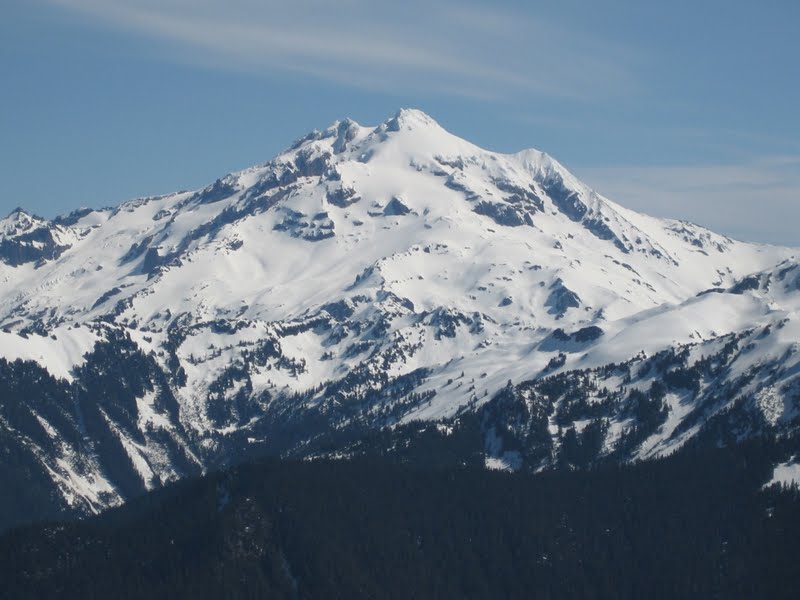
Mountain Photographer Jack Brauer captured an excellent image of the terminus area in late August, particularly given it was out a commercial airliner window. This image illustrates the steeper slopes and much smaller contribution of the tributaries to the right (east) of Point A and B. The image also indicates that Point B is likely not a significant pinning point to stabilize the terminus. The map below from the Greenland Geological Data viewer indicates the change with the tributaries now disconnected.

Image from Jack Brauer, looking northwest toward Tingmiarmit.

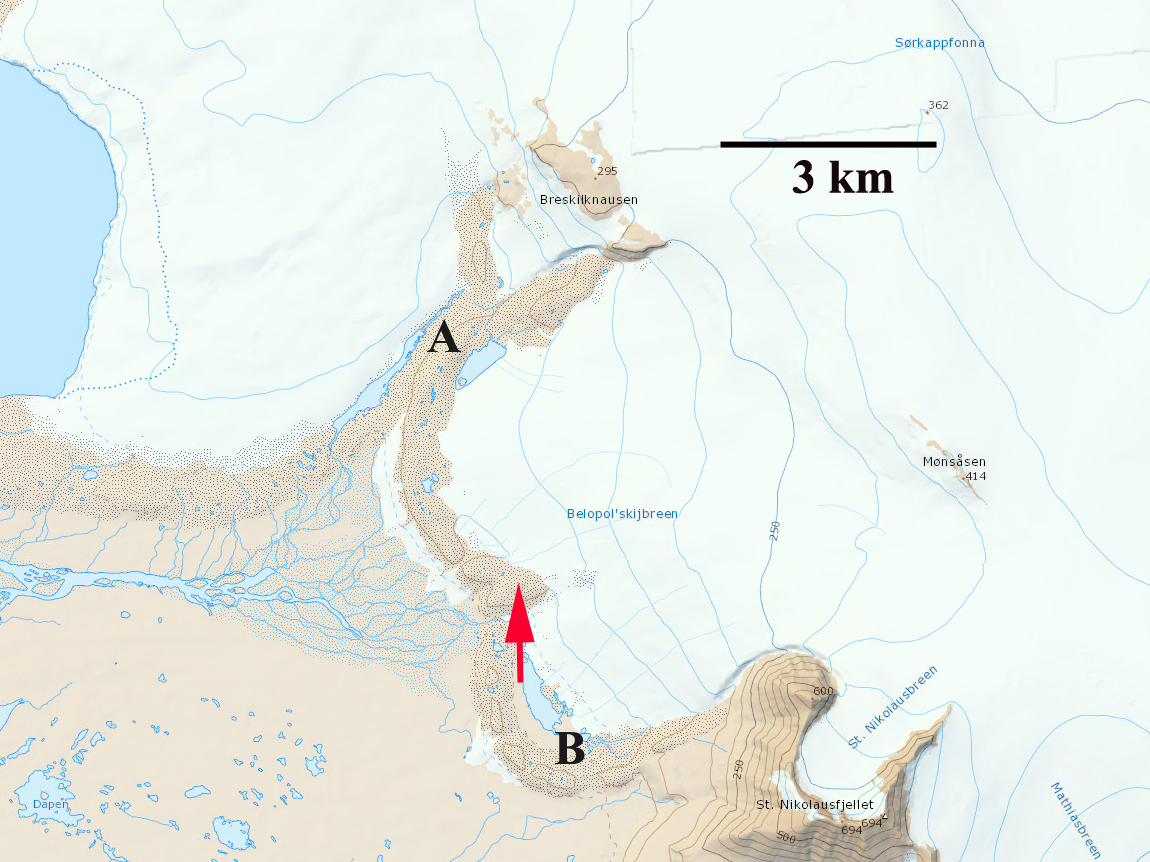
Greenland Geological Data, from the Geological Survey of Denmark and Greenland.

2001 Landsat image
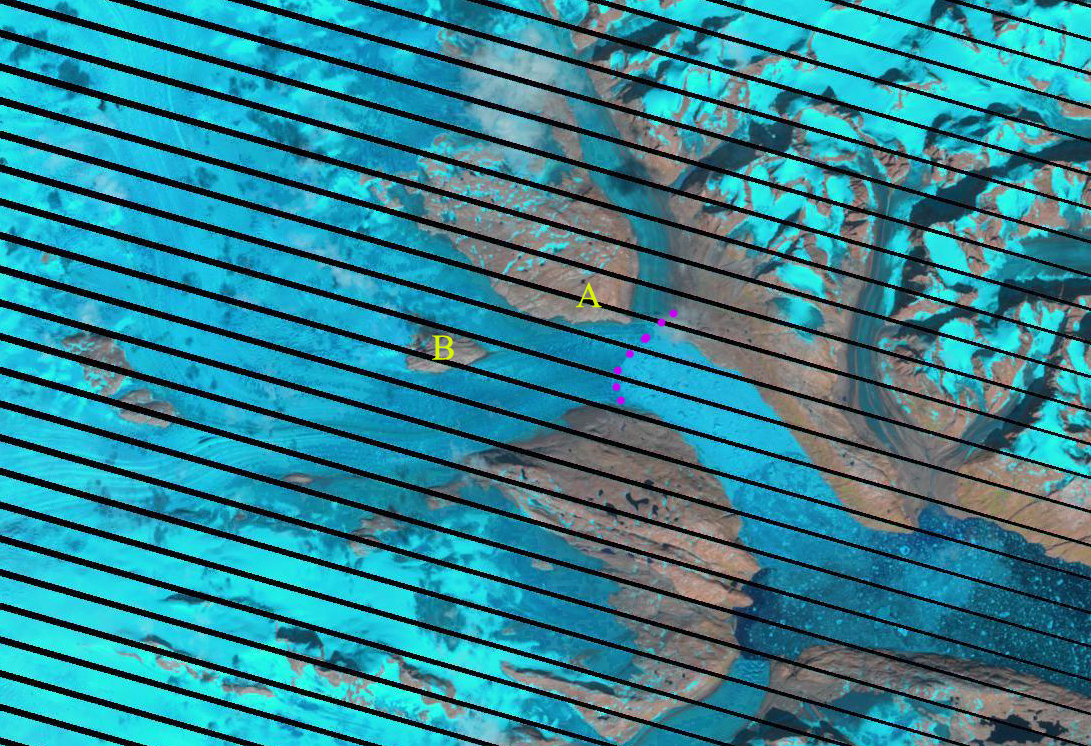
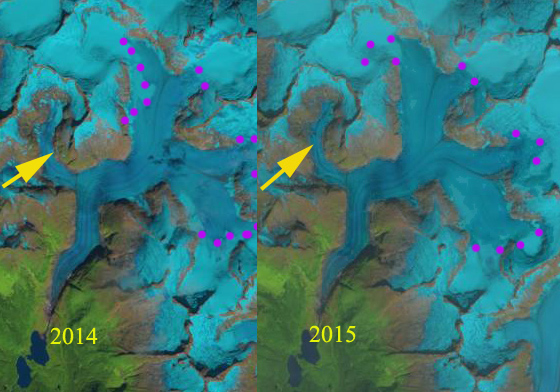
2010 Landsat image, purple dots indicate ice front.