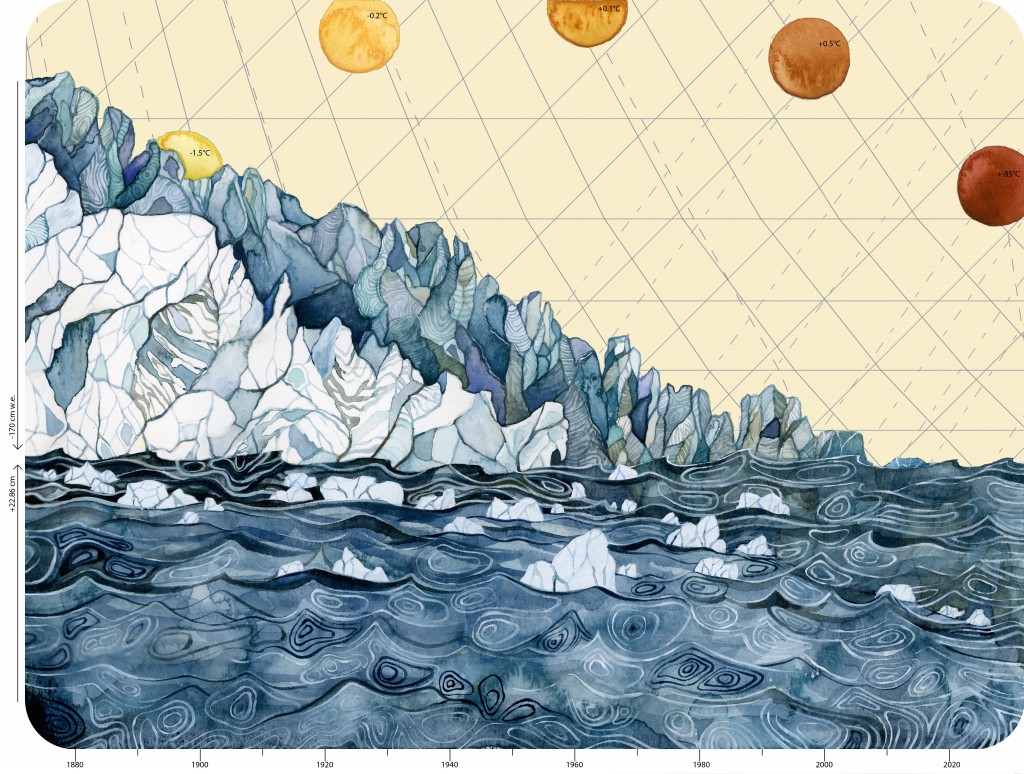
Painting from Jill Pelto illustrating the Climate Change Data using multiple quantities: the annual decrease in global glacier mass balance, global sea level rise, and global temperature increase. The numbers on the left y-axis depict quantities of glacial melt and sea level rise, and the suns across the horizon contain numbers that represent the global increase in temperature, coinciding with the timeline on the lower x-axis.
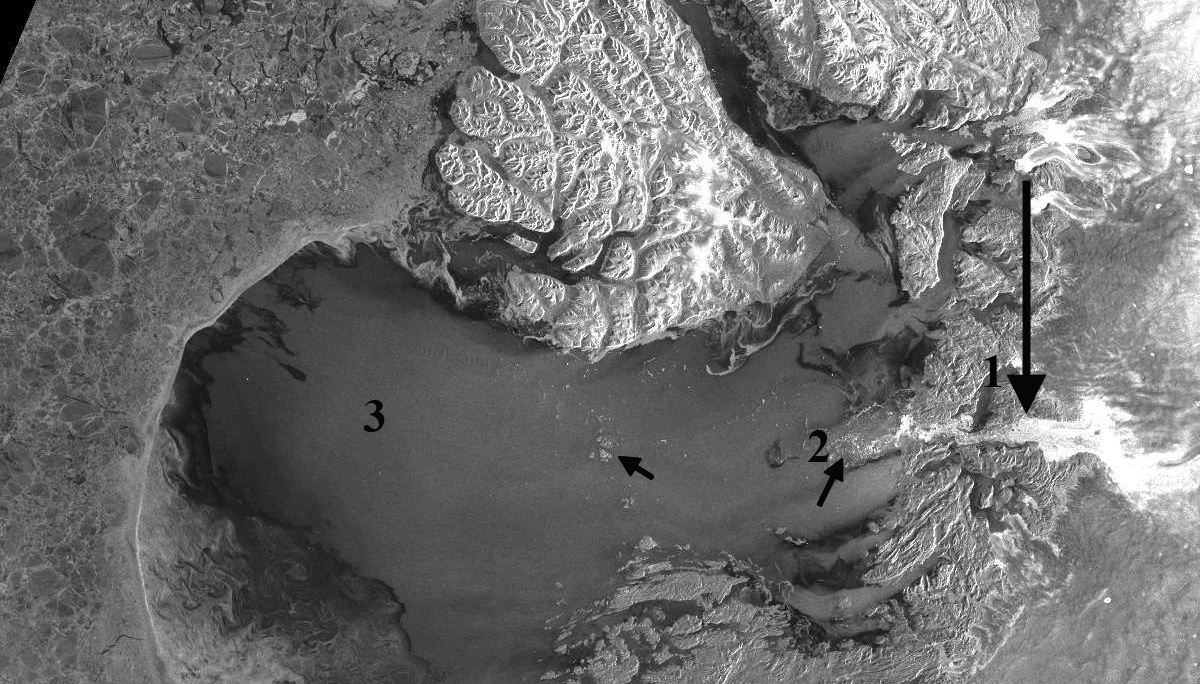
The World Glacier Monitoring Service (WGMS) record of mass balance and terminus behavior provides a global index for alpine glacier behavior. The WGMS data set for terminus change contains 42 000 observations from 2000 glaciers extending from the mid-19th century. Annual mass balance is the annual change in volume due to snow and ice accumulation and snow and ice losses. Here, mass balance is reported in mm of water equivalent. The following analysis is something I work on annually as the United States Representative to the WGMS, putting the alpine glacier mass balance of the globe in perspective. Preliminary data for 2015 from 16 nations with more than one reporting glacier from Argentina, Austria, Canada, Chile, Italy, Kyrgyzstan, Norway, Switzerland, and United States indicate that 2015 will be the 36th consecutive year of negative annual balances with a mean loss of −-1162 mm for 27 reporting reference glaciers and −1481 mm for 62 of all reporting glaciers (WGMS 2016). The number of reporting reference glaciers is 90% of the total whereas only 50% of all glaciers that will report have reported to date. When all data are available the 2015 mass balance will likely be comparable to 2003 the most negative year at −1268 mm for reference glaciers and −1198 mm for all glaciers.
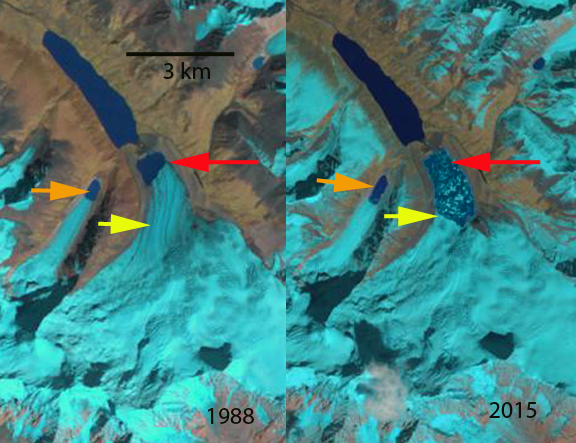
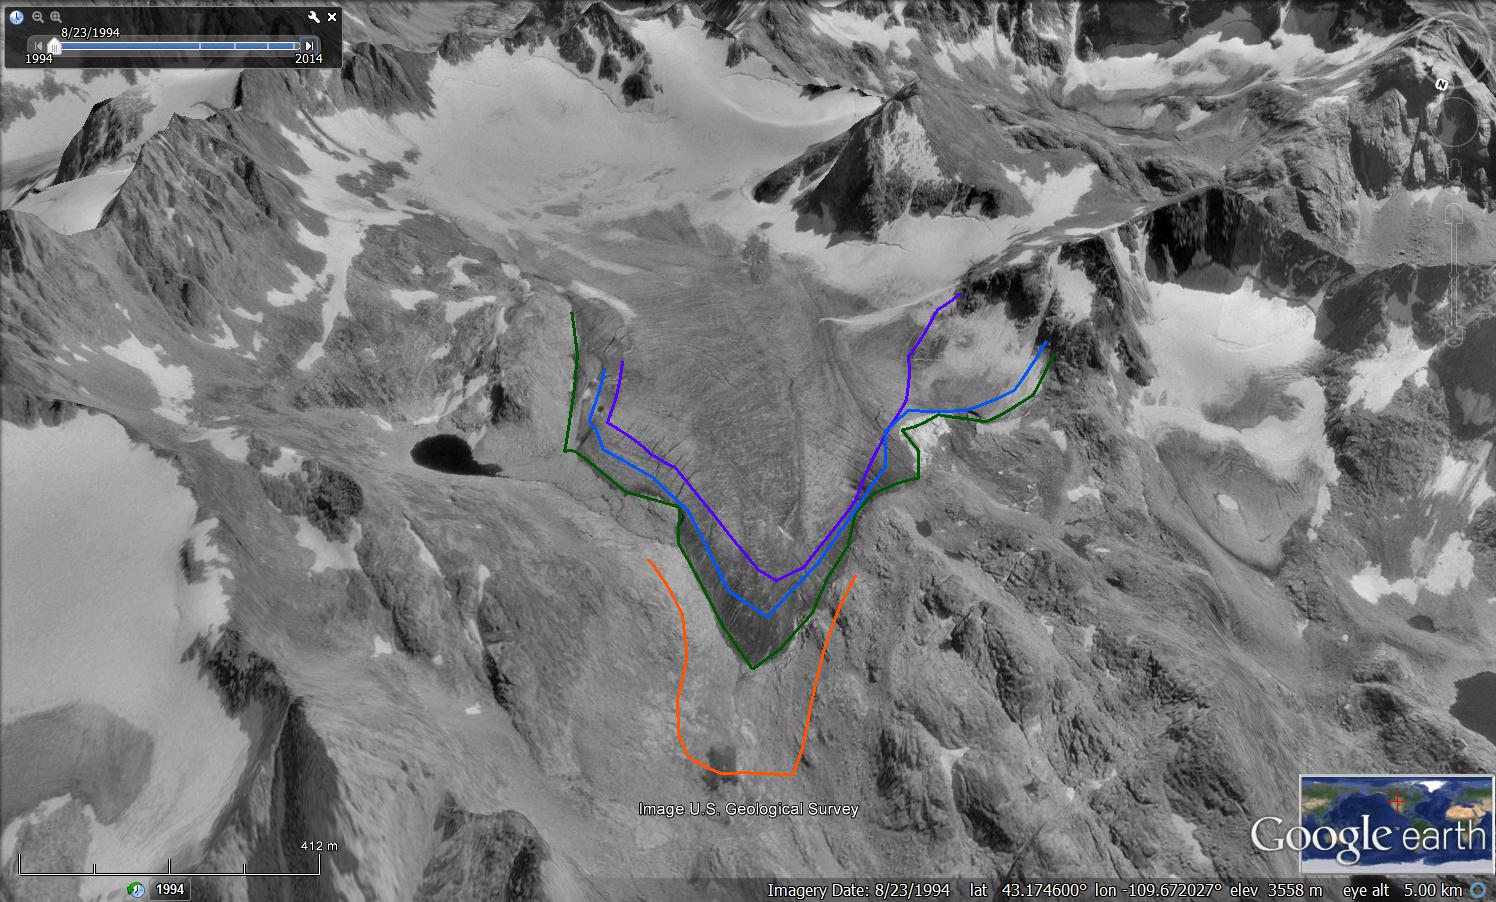
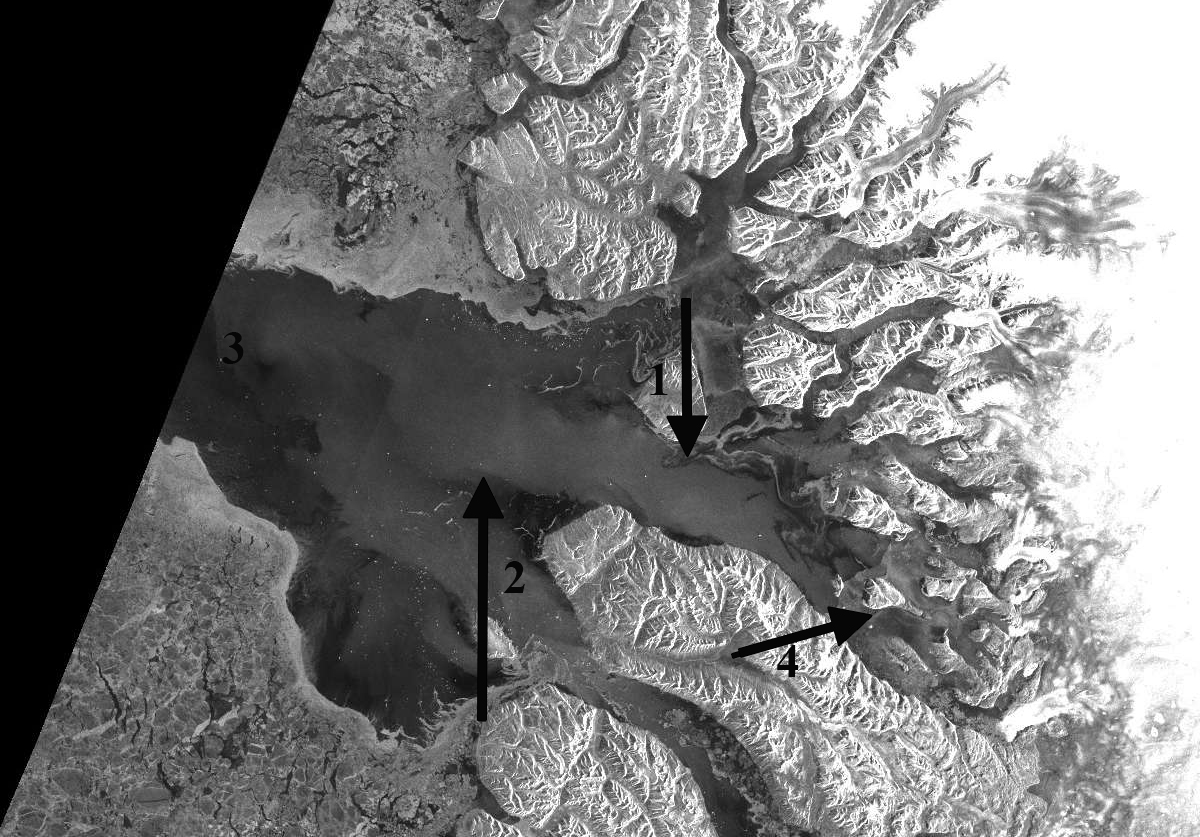
The cumulative mass balance loss from 1980–2015 is 18.8 m, the equivalent of cutting a 20.5 m thick slice off the top of the average glacier. The trend is remarkably consistent from region to region (WGMS 2015). The decadal mean annual mass balance was −261 mm in the 1980s, −386 mm in the 1990s, -−727 mm for 2000s and −818 mm from 2010–15. The declining mass balance trend during a period of retreat indicates alpine glaciers are not approaching equilibrium and retreat will continue to be the dominant terminus response (Zemp et al. 2015). The recent rapid retreat and prolonged negative balances has led to many glaciers disappearing and others fragmenting (Pelto 2010; Carturan et al. 2013).

Annual glacier mass balance record of reference glaciers reporting to the WGMS.
In South America seven glaciers in Columbia, Argentina, and Chile reported mass balance. All seven glaciers had losses greater than −1200 mm, with a mean of −2200 mm. These Andean glaciers span 58°of latitude.
In the European Alps, mass balance has been reported for 14 glaciers from Austria, France, Italy, Spain and Switzerland. All 15 had negative balances exceeding −1000 mm, with a mean of −1860 mm. This is an exceptionally negative mass balance rivaling 2003 when average losses exceeded −2000 mm.
In Norway mass balance was reported for seven glaciers in 2015, all seven were positive with a mean of 860 mm. This is the only region that had a positive balance for the year. In Svalbard six glaciers reported mass balances, with all six having a negative mass balance averaging −675 mm.
In North America Alberta, British Columbia, Washington, and Alaska mass balance data from 17 glaciers was reported with a mean loss of −2590 mm, with all 17 being negative. This is the largest negative mass balance for the region during the period of record. From Alaska south through British Columbia to Washington the accumulation season temperature was exceptional with the mean for November–April being the highest observed.
In the high mountains of central Asia seven glaciers from China, Russia, Kazakhstan, and Kyrgyzstan reported data, all were negative with a mean of –705 mm.
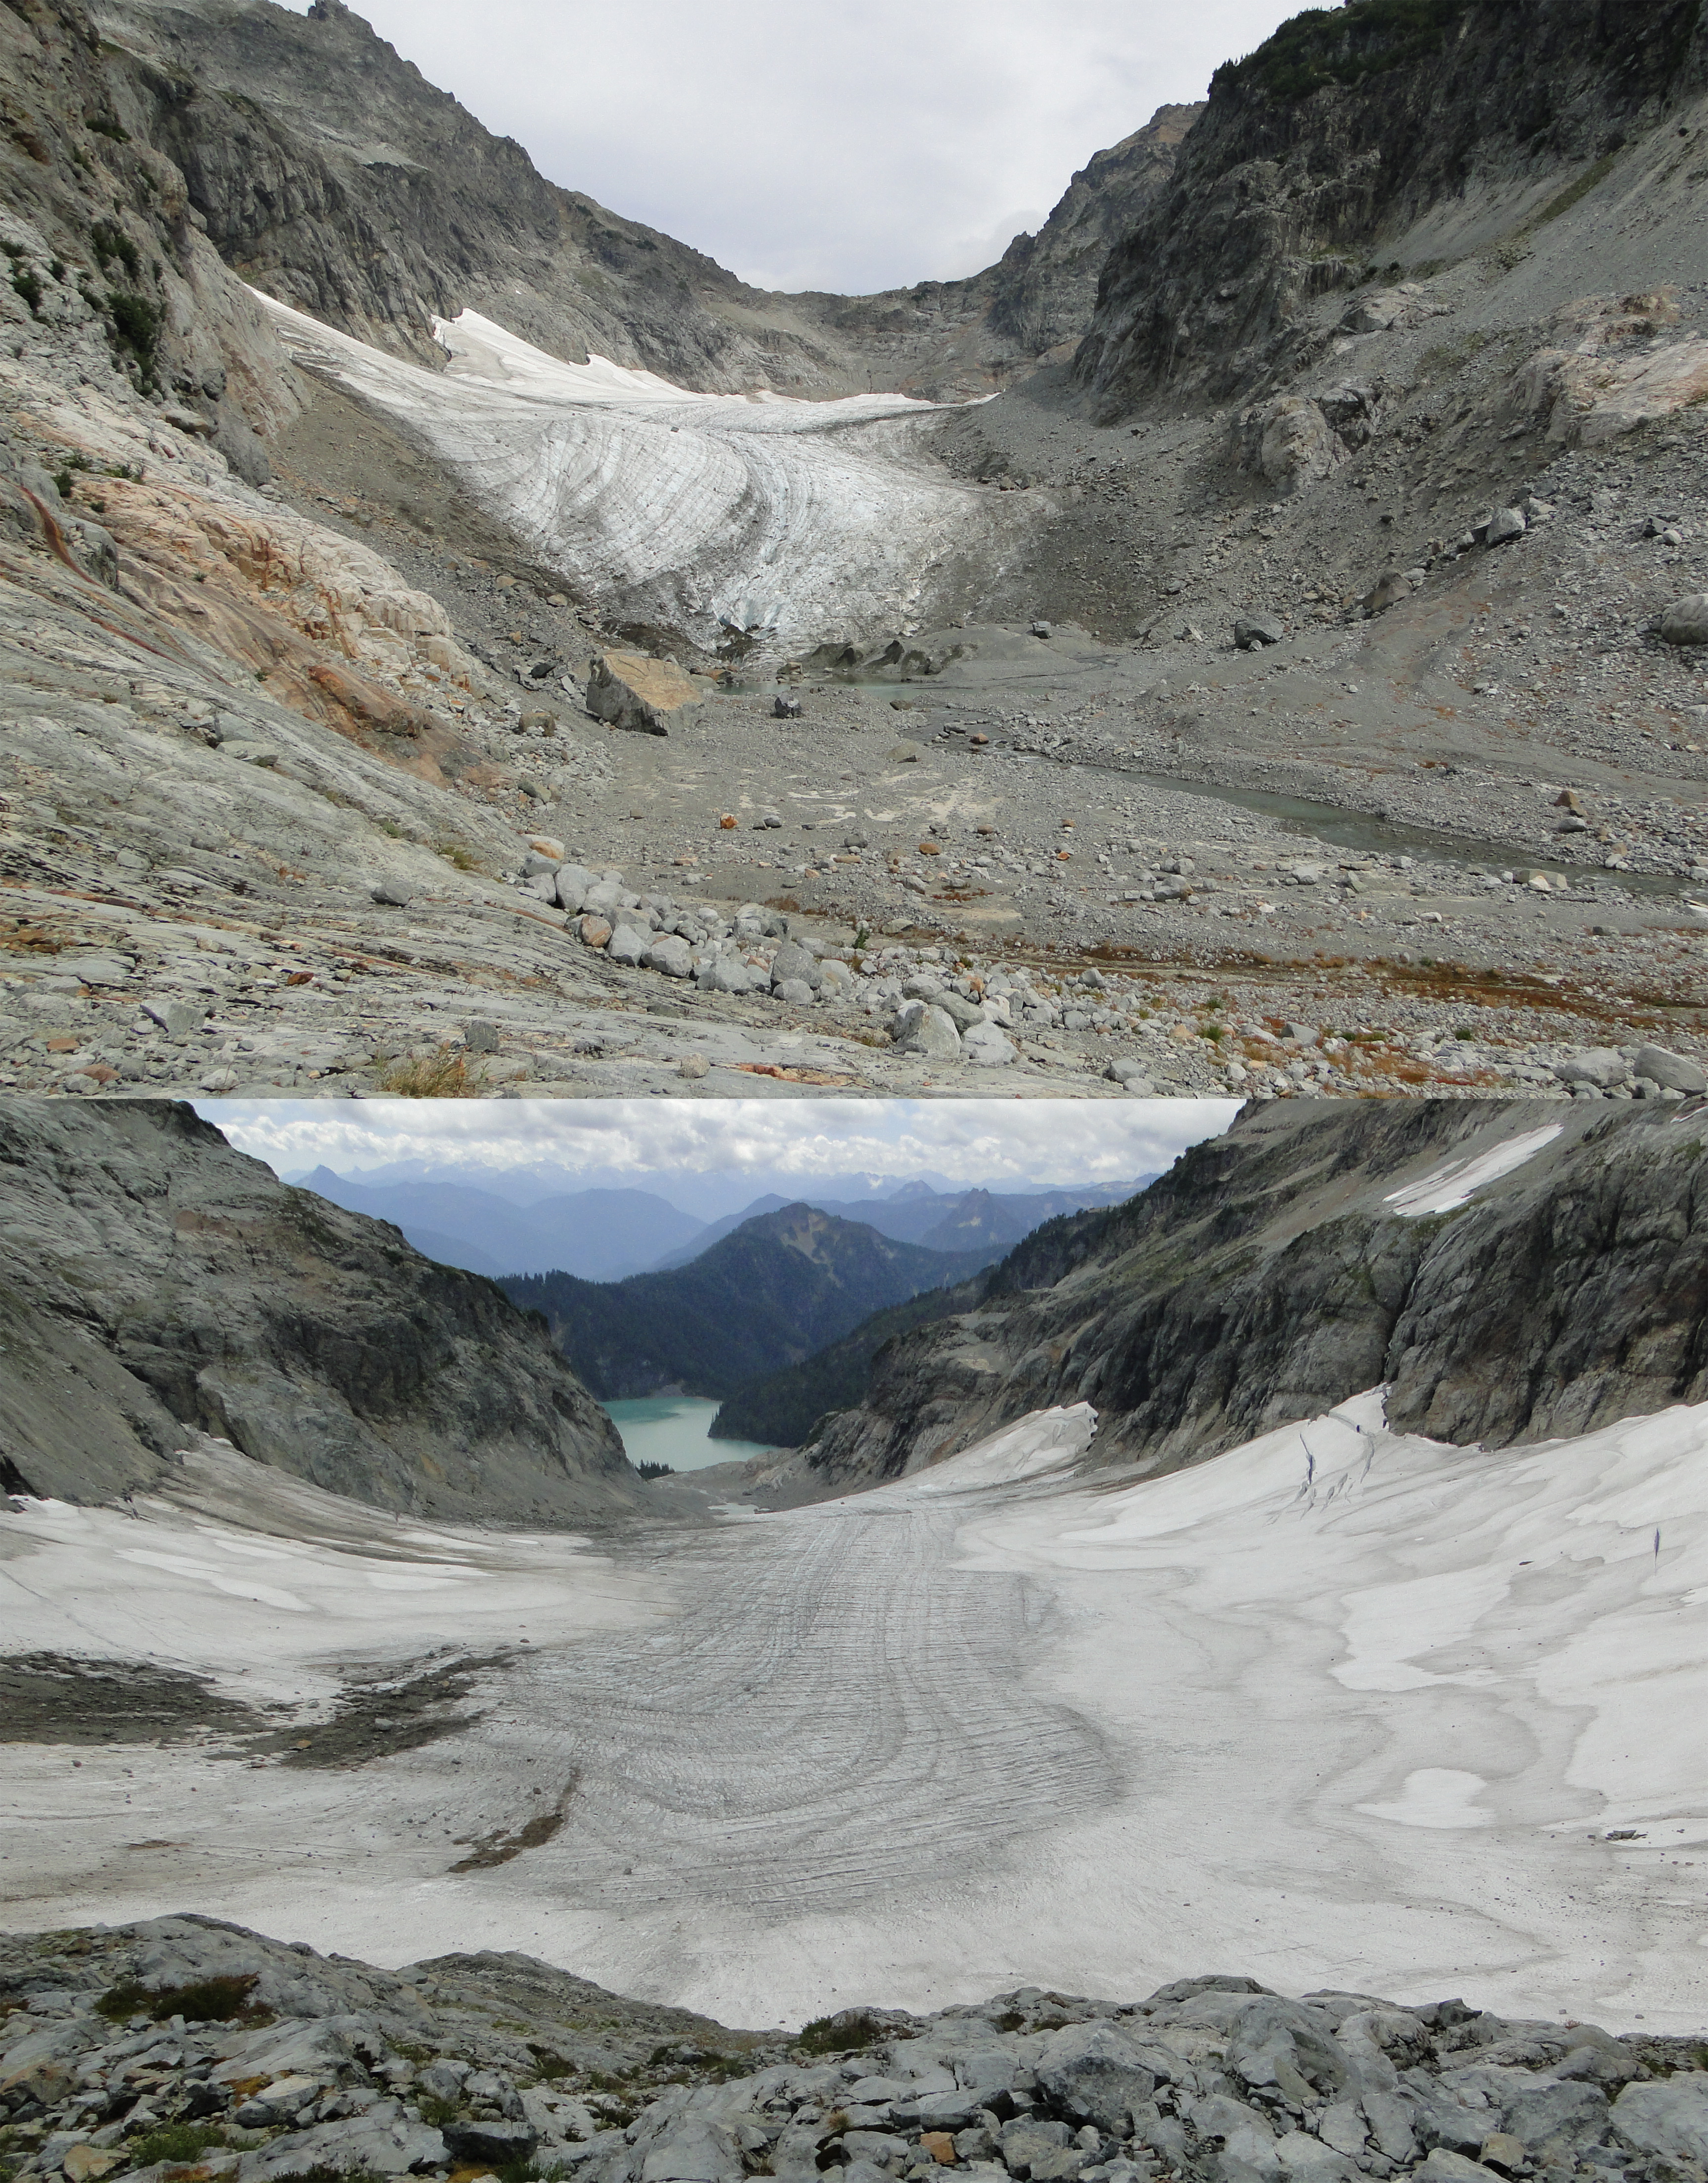
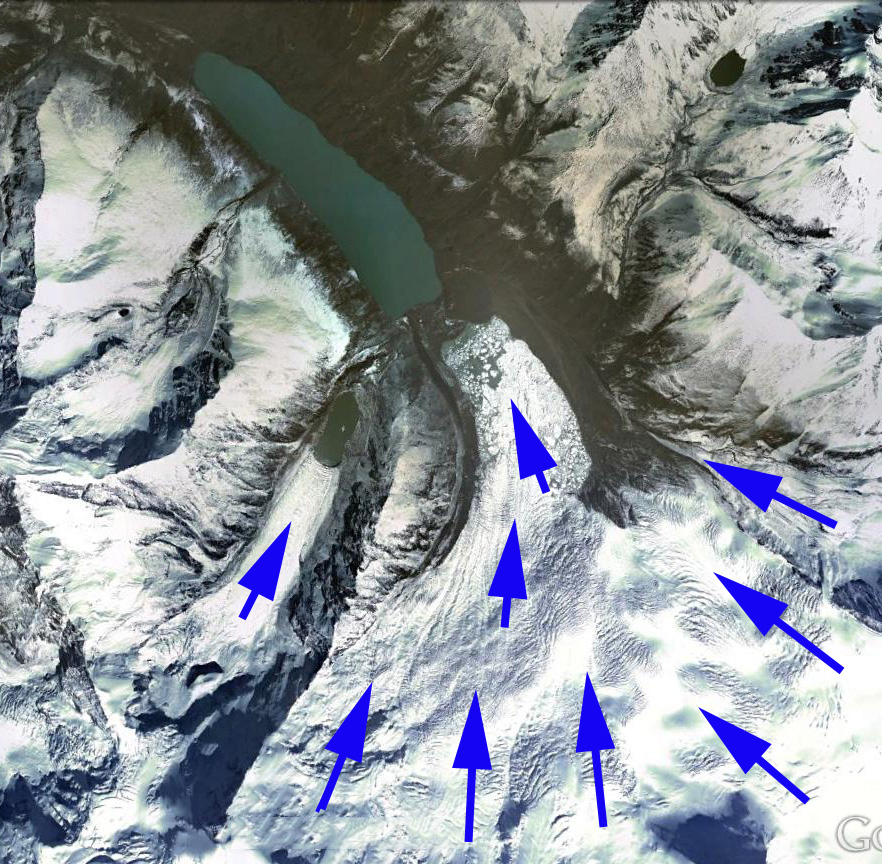
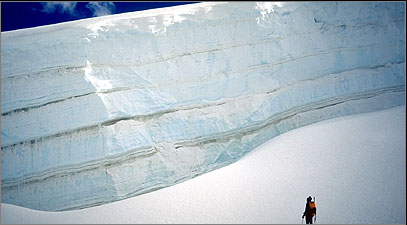
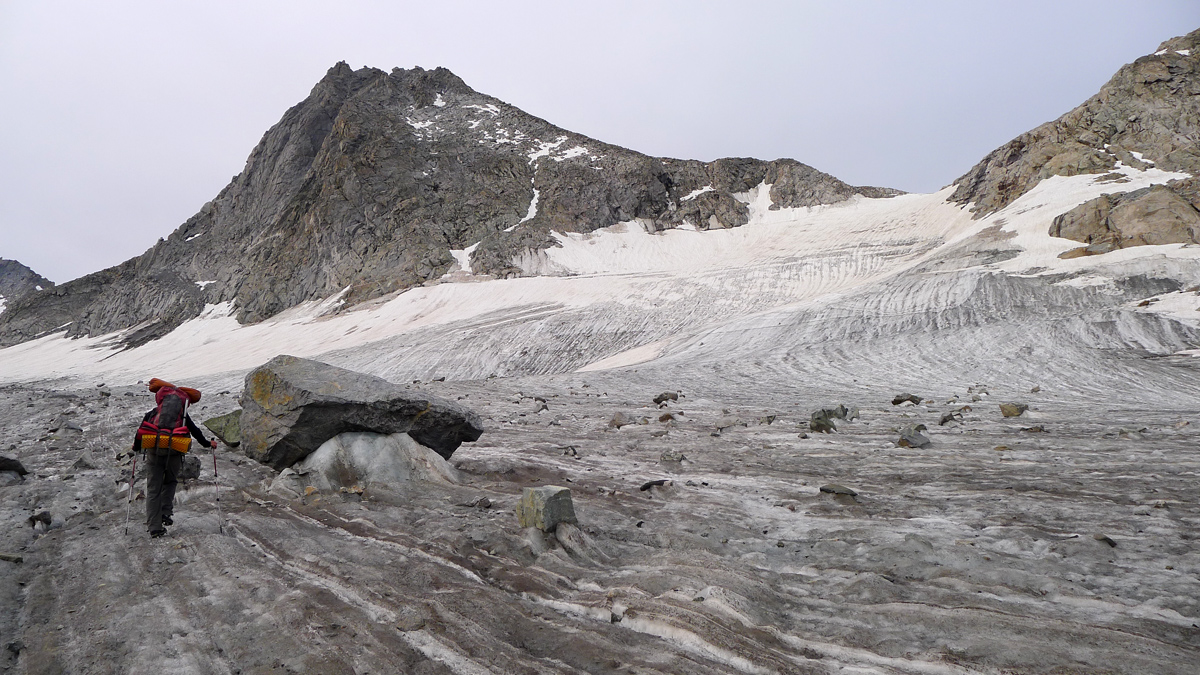
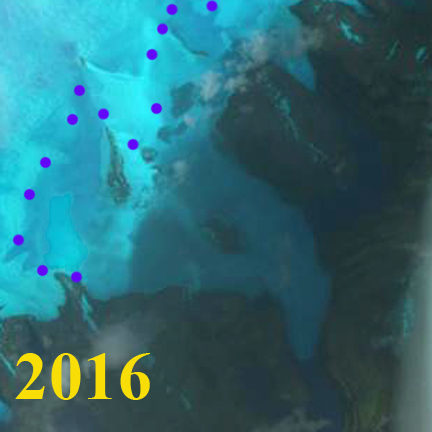
Columbia Glacier, Washington in 2015 during our mass balance observations from the terminus and head of the glacier indicating the lack of snow cover retained and extensive melting,