Silverstar Glacier, Last Glacier in Methow River Valley, WA

Silver Star Glacier image from August 18, 2025 indicating no retained snow cover. Ilustrates the glacier still has crevasses. Below is June 2025 image from Jack McLeod that illustrates detachment occuring in upper portion.

The USGS (1971) North Cascade glacier Inventory identified 15 perennial snow/glacier areas in the Methow Valley from 1958 aerial images. To qualify for the list you needed an area of 0.1 km2. There were three glaciers on Tower Mt., two on Golden Horn, two on Gardner Mt., two on Robinson Mt. and 5 on Silver Star Mt. When we began annual field monitoring of North Cascade glaciers in 1984 we explored the identified glaciers around Tower Mt. and Silver Star Mt. The northeast side of Tower Mt. still had one existing glacier and Silver Star Mt. had three.

Tower Mountain in 2025 illustrating the loss of glaciers at the three locations that had hosted glaciers in 1958.

As of 2005, I could identify 9 glaciers with an area of 0.8 km2, in the Methow Valley. About 30% of this area was on Silver Star. On Silver Star there were 3 glaciers in 1958 with a combined area of 0.33 km2. Silver Star had three identified glaciers in 1958. With the western most being the most extensive. The middle and western Silver Star Glacier had crevassing. The eastern Silver Star Glacier was a perennial snow field with no crevassing and insufficient thickness and size to generate movement.

Silver Star Glacier from Aug. 28 2006. The glacier is snow covered above the main icefall.

In 2006 here were two glacier left with an area of 0.19 km2 .  In this area average July-Sept. ablation on the glacier is 2.6 m/a. Thus, an area of 900,000 m2 x 2.6 m =2.34 million m3 of runoff from the glaciers on average contributed to the Methow River system. This is down from 3.9 million m3 in the 1970’s. This is a significant amount of water, but based on the disappearance of Lewis Glacier, a 40% drop in runoff occurred from the glacier basin in July-Sept. after the glacier was gone. This indicates that approximately 60% of the runoff would occur from the snowpack in the former glaciated area. Thus, the loss of all glaciers will generate a loss of close to 1 million cubic meters for the basin during the July-Sept. period. This runoff would be released earlier in the melt season. Average July-Sept. flow at Winthrop was 750 cfs from 1990-2004, while the glacier runoff had declined to ~10 cfs .

In 2013 the western Silver Star Glacier still had active crevassing and does retain snow cover through the summer. The middle Silver Star Glacier was fragmented stagnant ice that indicated it may no longer have been a glacier. At that time I assessed it could not survive the next pair of warm years. 

Silver Star Glacier in 2014 illustrates that is still an active glacier with significant crevassing. This image is taken from lower west margin by Fritz Stugren.

The lone remaining glacier is confined to a narrow chute is 750 m long, and no more than 200 m wide. There is a small icefall. This glacier is similar to the upper east side of Lynch Glacier, if that was the only part. The glacier is retreating slowly 75 m from 1993 to 2013. 

In 2025 the western Silver Star Glacier was 670 m long, an 80 m retreat since 2013, and has an area of 0.075 km2. The crevassing is noticeably reduced. The top of the glacier has several thin areas that will lead to detachment as illustrated by the Jack McLeod image. The glacier still has crevassing and areas likely over 30 m thick. This is the only remaining glacier in the basin and can survive another decade. During late summer periods the glacier provides between 1 and 2 cubic feet per second to the stream system.

The role glaciers play for rivers is buffering low flow periods late in summer. Without glaciers the late summer water supply diminishes. The trend in the Methow has been a sharp reduction in flow for June-August from the 1990-2004 period to the 2015-2025 period. Average discharge from July-September has fallen ~40% for the 2015-2025. In the Methow River valley supporting the reintroduction of beavers is a project that can buffer late summer streamflow to an extent. The Methow Beaver Project is well on the way in this effort.

Methow River mean monthly discharge at the Methow River at Winthrop, WA – USGS-12448500 station. The river has a higher peak discharge in spring now and and a much lower summer discharge.

North Cascade Glacier Climate Project 2025 Field Season Summary: Year 42

Core field team in 2025 Emmett Elsom, Mauri Pelto, Jill Pelto and Caitlin Quirk.

We hiked into North Cascade glacier to complete detailed observations for our 42nd consecutive year. These annual observations provide a detailed assessment of their response to climate change. For the third consecutive year North Cascade glacier on on average lost more than 2 m of glacier thickness. This cumulative loss of 7-8 m on most of the ranges glaciers that average 25-40 m in thickness represents 20% of their volume lost in just three years. On a few of the largest glaciers, such as those on Mount Baker that average 40-60 m in thickness the loss represents 12% of their volume lost.

The consequence is an acceleration of the collapse of the North Cascade glacier system. This landscape that has for long been shaped by ice is rapidly losing that glacier element. The rate of retreat for the glaciers we work on has accelerated so quickly that we are faced each year with changing terrain and new challenges. Beyond that, we are starting to really see the effect this retreat and the decrease in water has on the ecosystems both near the glaciers and further downstream. During the field season we love seeing the wildflowers, eating blueberries, and counting mountain goats. These are all parts of a habitat that is built around glaciers and snowpack. Seeing these shifts has been really difficult, but it helps to still return to these landscapes and continue to tell their stories through science and art. Below the story is told in images with captions by each of us who participated.

Two things that stood out during the 2025 field season were the strength of our collaborations, and the changing resources the glaciers are able to provide to the surrounding ecosystem. This visible change attracted the attention of KING5-Seattle NBC affiliate and CBS Morning News. At the bottom of this post the resulting footage is embedded. The film “Shaped By Ice” Jill and I worked on with Dan McComb has been a finalist in two recent film festivals, this footage also at bottom of this long read post.

Working on Rainbow Glacier from left-Katie Hovind, Caitlin Quirk, Claire Seaman, Jill Pelto and Margaret Kingston

We worked with two oil painters, one watercolor painter, one printmaker, two news film crews, a team of botanists, and more. The result of all these collaborations has led to so many great stories being created and shared about our collective work. It also meant our core group of field assistants had to be flexible to a changing group and the sometimes difficult and imperfect logistics that accompany that. -Jill Pelto

This photograph of an icefall at 2000 m (6700 ft) on the Easton glacier encompasses the wide range of emotions that I felt working on these glaciers this summer. The focal point of the picture is the wound inflicted upon the glacier by our changing climate. Bedrock and sediment creep through the gaping wound in the lowest icefall of the Easton, the opening visible for the first time in the project’s 42-year history. The place also holds a beauty, a sense of majesty that cannot be diminished by the tragic context of our work. The seracs at the top of the scene lean at impossible angles, destined to crash down onto the slope below, piercing the quiet of the snowy expanse in dramatic fashion. The dark annual layers in the glacier speak to the age of the ice, flowing down the flank of Mt. Baker over decades. The landscape has been a facet of my life for the past few years, as it falls upon the Easton Glacier route to the mountain’s summit. The icefall has always drawn me in as I pass, sparking a profound sense of wonder. It makes me deeply sad to see the beauty of such special places diminished, sad in a way that little else does. Over the past few years, I’ve come to like visiting these places to visiting an elderly loved one. While time may change them and even take them away from us, their beauty and meaning to me will hold true.-Emmett Elsom

How does being present in a place shape our understanding? To the left is a view of Sholes Glacier, complete with my on-site rendition. I can’t express how lucky I feel to have had the chance to experience these places first hand. To interact with a place by attempting to capture its likeness — paying attention to the negative space not only between the white snowpack and black exposed rock, but in the empty, carved-out area that used to be filled with ice. Experiencing the texture of the glacier under your feet, the cool air drifting off the snow, the good tired feeling of your body after physically traversing top to bottom. This is what you don’t get from a photo. To know places such as these is to love them and see their role in the world, and want to protect them. But so many never get the chance to understand them this way.-Claire Seaman

This field season I focused on exploring the once-barren foreland a glacier leaves behind. Studying the plants growing in the wake of the Easton Glacier made me reflect on the way life responds to these major changes. This photo of a bright monkeyflower cluster in the streambed of the nearby Sholes Glacier exemplifies this resilience and optimism to me. The Sholes, in the background, drains a lifeblood that will feed the watershed downstream into the Nooksack, supporting people, fisheries, and a whole riparian ecosystem. The eventual loss of glacial ice feeding the river will be catastrophic, yet the scarred space left behind will blossom with vegetation. Witnessing firsthand how staggering the extent of glacial retreat is can be overwhelming, but that bright patch of flowers stands as encouragement. Alone in an altered landscape, those flowers will pave the way for more to follow. Change is nuanced, and as we watch it occur we can change, sharing stories of the beauty of this environment supported by ice, and adapting our lives and policies in a way that can be the difference which keeps glaciers flowing.-Katie Hovind

As a backcountry skier and oil painter focused on winter landscapes of the North Cascades, the idea of painting glaciers in the field was a dream come true! I knew what we would see and learn about the health of our glaciers from the scientists would be highly emotional, but the power of these environments disappearing in our lifetimes is something my words fail to communicate how devastating that feels. During the study on Rainbow glacier I caught on film the moment a serac collapsed, loudly crashing, crumbling from a newly melted out rock knob down the mountain splitting into smaller and smaller pieces. It looked sickly as it broke before our eyes. Another unique experience was going into a teal, translucent, otherworldly ice cave. I have started 2 paintings to capture this vanishing environment. My goal is to assist the project in translating the study’s findings through landscape paintings that communicate the beauty of these places with titles that call attention to the retreating glaciers in the North Cascades. We all have a responsibility as humans to make individual changes to combat climate change and vote like fresh water and air depends on it, because it does. -Margaret Kingston

The pace of glacier change struck me hard this summer. Never before have humans lived with such a deglaciated Cascades mountain range. Not the settlers, not the fur trappers, not the first people who have been here for 13,000 years or more. Cultures and ecosystems spawned from the retreating edge of the Cordilleran Ice sheet into the Puget Sound area. Alpine glaciers fed streams, rivers, salmon, all kinds of human projects in Washington State. Our societies are shaped by the ice and now we are experiencing glaciers disappear.

I write this at the end of the 2025 hydrological year, waiting for winter snow to shelter the land I love in a cool white blanket. The devastation of the alpine glaciers has surfaced so frequently in conversation these last couple months. Those who have seen the mountains are alarmed as beds of ice they once knew to be hundreds of feet thick look shallow and frail, ice pitches that were once climbed are now grey gullies of rock, and volcanoes which have always been white are unnervingly gray and shrouded in smoke. The realities of climate change in the Northwest are clear.

It is a painful time to care about the glaciers of the Cascades. Witnessing the erosion of something so much older and bigger and impactful than myself is staggering. There is much action to be done in this new terrain but for now, I come back to this: I sit in the dying glaciers warm light as the sun rises, summon the deepest snowfall in years and tell the glacier that we care, that we were grateful for all the help watering our food and feeding our oceans and making sure our salmon had somewhere to live. We are here because of you. 
-Cal Waichler
Image description: This image shows a crevasse on the Easton Glacier of Mount Baker. The saturation is distorted because I shot this photo on 35mm and pre-exposed the film to light and heat to parallel the material effects of global warming on our glacier systems. The Easton glacier is a source of water for Baker Lake, which provides recreation and hydropower to the region. When I see this photo, I think of the impacts of glacial melt to water, energy, cultural, and economic resources in Washington. -Caitlin Quirk
Columbia Glacier is one of sixty global reference glaciers. This summer it lost 5% of its volume.
Lower Curtis Glacier continues to rapidly thin at the top of the glacier as well as at the terminus. The glacier retained additional avalanche accumulation, leading to a less negative balance than other glaciers.
Rainbow Glacier is one of the sixty global reference glaciers. This year new bedrock began to emerge and expand in several icefalls, leading to serac fall.
Easton Glacier has retreated 700 m since 1990 and has a number of bedrock areas emerging in icefall up to 2500 m.
Lynch Glacier east and west side are separating. The upper basin did retain some snow in 2025.
Daniels Glacier lost all snowpack by the end of the summer and bedrock is quickly expanding amongst the glacier.

The trajectory for most North Cascade glaciers is one of fragmentation. This is illustrated by Foss Glacier on the east flank of Mount Hinman, that we began observing annually in 1984 but stopped measuring as it fragmented. Foss Glacier from the top was a 1 km long and nearly 600 m wide glacier. In Sept. 2025 Cal Waichler captured view from the top with the two main fragments now less than 50 m wide and 300 m long.-Mauri Pelto

Leah Pezzetti KING5 meterologist hiked in with us to Lower Curtis Glacier.

The CBS team hiked into Sholes Glacier with us spending the night, and we had three generations of Pelto’s.

Signs of a Collapsing Glacier System: North Cascade Glacier Climate Project 2025

Field team Emmett Elsom, Mauri Pelto, Jill Pelto and Caitlin Quirk at Rainbow/Mazama Glacier saddle.

For the 42nd consecutive year we were in the field observing North Cascade glaciers. Our expedition of scientists and artists observes the response of the glaciers to climate change. In the last five years the glacier system in this mountain range is showing signs of collapse. The signs range from vanished glaciers, dwindling summer runoff, increased rockfall and serac instability.

Our first field area was Columbia Glacier, which feeds the North Fork Skykomish River. This is the largest glacier in the Skykomish River Basin and a World Reference glacier. We have observed ongoing retreat and accelerated volume loss, 50% of its volume lost in 42 years. The primary field team consiste of Emmett Elsom (field scientist), Caitlin Quirk (field scientist), Jill Pelto (art director) and Mauri Pelto (science director). In 2025 the new glacier lake that developd in 2010 continue to expand, a warmer Blanca Lake supported more algae, and the reduced glacier area provided notably less streamflow dring this the late July-August period.

Columbia Glacier 7-29-2025 with the expanding new lake and the thinning glacier that used to have a steep high terminus (Jill Pelto).

We next headed north to Lower Curtis Glacier on Mount Shuksan, which feeds into Baker Lake. We were joined by Katie Hovind (field scientist) and Margaret Kingston (oil painter). Leah Pezzetti, meteorologist and Nick Goldring videographer from KING5 in Seattle joined us.

The terminus of this glacier continues to thin, with the seracs becoming less imposing. The terminus front has diminished from over 45 m high, to 25 m. The glacier is thinning almost 1 m per year even in the accumulation area of the cirque basin. Glacier retreat has been 225 m since retreat began in 1986 across the wide terminus front.

Next up was Sholes and Rainbow Glacier, both accessed from our camp on Ptarmigan Ridge. Claire Seaman (oil painter) joined our crew for both. Ben Pelto and Margot Pelto joined us for Sholes Glacier, along with their nine-month old daughter Wren, (my granddaughter). The Sholes Glacier has been rapidly thinning and losing area along its broad lower margin particularly in the last 5 years. The glacier has lost 0.25 km2 in this century along this margin, or 30% of the total glacier area. In 2023 we explored an ice cave that was over 100 m long. In 2025 this entire slope is devoid of ice. CBS Sunday News joined us on Sholes Glacier and captured well, what we do and how we combine art and science.

Rainbow Glacier descends from a saddle with the Mazama Glacier. This area consistently retains deep snow. This year the snowpack was 3.5-4.75 m deep in early August. Further down glacier, a series of bedrock knobs continue to emerge from beneath the ice, leading to steeper, thinner icefalls that leads to unstable serac conditions. The collapse of these seracs is predictable in terms of where. We did observe a large one. We descended to the terminus of the glacier. The glacier continues to retreat, with a retreat of 890 m since 1986. The glacier had been advancing prior to 1986.

Easton Glacier on August 9, 2025 from our research camp. In 1990 glacier ended at small ridge right behind our hats. Now glacier has receded 700 m (Abby Hudak, Jill Pelto and Mauri Pelto)

We circled to the south side of Mount Baker to examine Deming, Easton and Squak Glacier. Easton Glacier has retreated 705 m since retreat began in 1990. This year we continued to observe new bedrock emerging from beneath the glacier, including in the main icefall at 2000 m and as high as 2800 m on the glacier. This is also occurring on Deming Glacier. In both cases there is oversteepening in icefall areas leading to unstable seracs. On Squak Glacier we descended, what had been a crevassed icefall, that now is a steep ice ramp, to the terminus. This indicates limited velocity feeding the now nearly stagnant glacier tongue.

New areas of rock exposure emerging at base of main Easton Glacier icefall for the first time, at 2000 m.

Bedrock emerging at 2800 m on Easton/Deming Glacier. These features illustrate thinning is extensive even near the top of Mount Baker glaciers.

Our last stop was in the Alpine Lake Wilderness, and we were joined by Cal Waichler (wood cut printing) and Margaret Kingston. The glaciers of Mount Daniel and Mount Hinman have been in rapid decline this century. With six of the nine ceasing to exist by 2024. We continue to monitor Lynch and Daniels Glacier each year. Lynch Glacier continues to retain snowpack on the upper portion of the glacier, while losing 50% of its area since 1984. Daniels Glacier has lost 60% of its area since 1984 and is no longer retaining significant snow pack by the end of the summer. The retreat of area loss on Daniels Glacier has been 5% per year in the last five years. The runoff from glaciers into the Cle Elum Reservoir has diminished markedly in late summer reducing both runoff and increasing water temperatures. By late August Cle Elum Reservoir had dropped to 7% full, which will curtail water allocation to downstream Yakima Basin agriculture.

Descending onto Lynch Glacier, with Pea Soup Lake below. The glacier filled the lake until 1978.
Daniels Glacier in 2025, illustrating the bare rock slope that was almost entirely covered by the glacier in 1984.
The remaining fragments of Foss Glacier that has lost 80% of its area since we first mapped it in 1986.

2025 North Cascade Glacier Climate Project Field Plan-42nd Year.

2025 Field Season: For the 42nd consecutive summer we are heading into the field to measure and communicate the impact of climate change on North Cascade glaciers. This year an overall focus of the project is supporting the UN’s “International Year for Glaciers’ Preservation”. This means focusing on glaciers that have disappeared and are in critical danger of disappearing in the next decade. Jill Pelto, Art Director and Mauri Pelto, Science Director

This field season follows the 2021-2024 seasons that featured either historic heat waves and/or periods of extended warm weather. The heat led to a greater exposure of bare ice on glaciers with a higher albedo and greater density. The observed melt rates are 7-9 cm/day water equivalent during warm weather events vs 4-6 for snow surfaces. This led to substantial mass losses on North Cascade glacier for the four years of over ~6 m. 

Science objectives: We will complete detailed measurements on 10 glaciers, three of which are part of the World Glacier Monitoring Service reference glacier network (48 glaciers globally), which have 30+ consecutive years of mass balance observations. This summer we will have an opportunity to assess the long-term ramifications of the 2013-2024 period of unprecedented mass balance losses and associated glacier changes, with detailed mass balance, crevasse depths and glacier surface elevation profiling.  We also focus on the impact of diminishing glacier size on downstream runoff.

Drilling and emplacing ablation stakes on Sholes Glacier.

Art Objectives: We will collaborate with several artists who will join us for a portion of the field season. They will be able to create their own work about the landscape and the science or may join us for fieldwork and make plans for future artwork. We hope to use this art to share our research with a broader audience and highlight the beauty and importance of these places. 

Cal Waichler Sketch of Lower Curtis Glacier.

Communication Objectives: We will leverage the brands of our expedition sponsors and the focus on vanishing glaciers that the UN brings this year. These organizations can help spread our message. We will utilize a combination of artists and scientists to tell the story.

From the Glaciers to the Sea: this is one of two paintings that tells stories of watersheds fed by North Cascade glaciers that flow out into the Puget Sound. The snowpack and glaciers in the mountains in this region provide crucial meltwater to river systems, many of which connect critically to the ocean.

Field Team 2025:

Jill Pelto (she/her) is an artist and scientist from New England who grew up loving winter sports and trips to the mountains. She incorporates scientific research and data into paintings and prints to communicate environmental changes. Her multi-disciplinary work weaves visual narratives that reveal the reality of human impacts on this planet. She completed both her B.A. degrees in Studio Art and Earth and Climate Science, and her M.S. focused on studying the stability of the Antarctic Ice Sheet at the University of Maine, spending two field seasons at a remote camp in the southern Transantarctic Mountains. Jill will be joining the project for her 15th field season. She is excited about continuing to document the change in North Cascade glaciers that she has witnessed each of the last ten years — through science and art.

Jill’s 2025 Paintings inspired by our work about the Skykomish River Watershed and the Nooksack River Watershed.

Mauri Pelto (he/him) has directed the project since its founding in 1984, spending more than 800 nights camped out adjacent to these glaciers. He is the United States representative to the World Glacier Monitoring Service. For 15 years he has been author of the blog “From a Glacier’s Perspective”, and associate editor for three science journals.  He is on the Science Advisory Board for NASA’s Earth Observatory. His primary position is Associate Provost at Nichols College, where he has been a professor since 1989. He either runs on trails or skis on alpine and cross country trails every day.

Emmett Elsom (he/him) is an environmental science student at Western Washington University from Portland, Oregon. Growing up mountaineering and backpacking in the Cascade Range, he developed a love for the region and a fascination with the complexities of its ecosystems. In 2024 he had an opportunity to work In the field with the Oregon Glaciers Institute, assisting with SNOTEL data collection and fieldwork. This year, he is looking forward to broadening his understanding of the ecological role of glaciers and their melt across the Pacific Northwest, and the power of utilizing art in science. 

Caitlin Quirk (she/her) is a Masters student of Environmental Humanities at the University of Utah. She writes essays and poetry about socio-environmental justice, land relations, and political ecologies of climate change. Before graduate school, Caitlin worked as a mountaineering instructor and environmental researcher. Through these roles, she formed deep relationships with glaciers throughout the Pacific Northwest.  

Katie Hovind (she/her) is an environmental science student at Western Washington University. She feels a deep connection to the Cascade mountains and their watersheds from growing up in this region, and hopes to share their beauty and importance with others. She was a field assistant with NCGCP last year, and is excited to continue collaborating this year to explore ways science and art can evoke caring—for protection of natural spaces and response to the climate crisis. This season, she will help conduct a vegetational succession study at the Easton’s terminus to observe the changing alpine plant growth in the wake of a receding glacier.

Margaret Kingston: is an oil painter and art educator from Winthrop, Washington. Originally from New Hampshire, she moved 3000 miles with her husband Jonathan Baker to the Methow Valley after visiting the North Cascades National Park. Landscapes of the Pacific Northwest have been her inspiration for the past 13 years, captured first through a photo then realistically painted on canvas. As a backcountry skier, hiker, and biker she captures the energy of places these activities take you. With funding from the Mary Kiesau Fellowship Grant, Margaret will plein air paint on site in honor of her friend Mary Kiesau. Her observations during time spent with the North Cascade Glacier Climate Project will be shared through the resulting artwork and at a community event in the Methow Valley. Learn more about Margaret Kingston’s work at MkOilPaintings.com 

Claire Sianna Seaman (she/her) is a painter, filmmaker, and printmaker from Leavenworth, WA. She holds a BA from Smith College in Studio Art, with a concentration in Climate Change. She is currently earning her MA in Human Geography at the University of British Columbia. Claire has been featured in the Wild and Scenic Film Festival Art Exhibition and received an Artist Trust GAP Award. She worked with scientists from the University of Washington Climate Impacts Group  to create an art piece that imagined climate resiliency in the Pacific Northwest. This piece is currently part of the 5th National Climate Assessment Art x Climate Gallery on display at the Smithsonian Natural History Museum in Washington, D.C https://www.clairesianna.com/

2025 Schedule 

July 28:   Hike In Columbia. 

July 29:   Columbia Glacier survey

July 30:   Hike Out Columbia/Hike in Lower Curtis

July 31:   Lower Curtis Glacier Survey

Aug. 1:    Hike out, Hike in Ptarmigan Ridge

Aug. 2:    Sholes Glacier

Aug. 3:    Rainbow Glacier

Aug. 4:    Rainbow Glacier

Aug. 5:    Hike out. Hike in Easton Glacier (Resupply in Bellingham WA) 

Aug. 6:    Easton Glacier

Aug. 7:    Deming Glacier

Aug. 8:    Easton Glacier

Aug. 9:    Easton Glacier

Aug. 10:  Hike in Mount Daniels

Aug. 11:  Mount Daniels Survey

Aug. 12:  Ice Worm Glacier Survey-Exit

Assessing Crevasse Depth on Easton Glacier

Ptarmigan Ridge-Shuksan Arm Developing Landscape of Glacier Loss

Glaciers on the ridge from Moutn Shuksan to Mount Baker that we observed to be active in mid 1980s, identified in GLIMS map below. Above Sentinel image from 9-9-2023. Glaciers that are no longer glaciers in yellow, seven of them including Mount Ann=MA, Shuksan Arm=SA, Coleman Pinnacle East/West=CPW/CPE, Camp Kiser=CK, Table Mountain=TM and HBB=Happy Bunny Butte. We still monitor each year Lower Curtis, Rainbow and Sholes.

The two most prominent mountains of the North Cascades Mount Shuksan and Mount Baker are connected by a ridge from Shuksan Arm to Ptarmigan Ridge. We visited 12 glaciers along and close to this ridge in the mid-1980s, to decide which to monitor annually. At that time each of these had active crevasses and significant area of glacier ice. We By the end of 2023 seven of the twelve glaciers are gone. We continue to monitor Lower Curtis, Rainbow and Sholes Glacier in detail. Portals and Ptarmigan Ridge Glacier which we visit every year, but do not assess in detail, will likely disappear in the next few years. Below is the evolving area and the date the glacier was lost, the area reported in the 1958/84 period and 2015 are from GLIMS and the 2023 area we determined from Sentinel imagery.

GlacierGLIMS IDYear Lost1958/84 Area2015 Area2023 Area
Camp KiserG238275E48809N19930.220.030
Happy Bunny ButteG238277E48834N20050.16600
Table MountainG238295E48850N20150.15800.008
Coleman PinnacleG238269E48826N20180.560.0310.018
Mount AnnG238341E48818N20220.120.070.01
Shuksan ArmG238362E48838N20230.160.070.03

1963 image of Ptarmigan Ridge sent to me by Austin Post.

Ptarmigan Ridge glaciers in 1993-all small but still all nearly joined.

In 2024 the lack of glacier ice or perennial snow along Ptarmigan Ridge is evident.

North Cascade Glacier Accumulation Season 2025 and Forecast Outlook

As April ends there is a sharp snowline ranging from 1200 m at Mount Baker to 1400 m at Cascade Pass. Above 1500 m the melt season is just getting started.

As the accumulation season comes to an end for North Cascade glaciers it is worth reviewing this winter and looking ahead with a forecast for glacier mass balance by the end of summer 2025. The winter of 2025 at NOAA’s Washington Cascade Mountain West Division 5 records indicate that this winter was below the declining trendline of total precipitation with a mean of 54.8 inches, down slightly from last year. Winter temperatures were again warm at 33.2o F but close to the expected rising trend line average.

The 1946 to 2025 winter (November-March) mean temperature and total precipitation for the Western Cascade Mountains-Division 5 weather stations.

The mean April 1 snow water equivalent (swe) at the six North Cascade Snotel sites with a consistent long term record was 0.72 m. This is below the declining trend line and 31% below the long term average for the 1946-2025 period. This is above the 2024 value, but in the lowest quintile. Mount Baker ski area has reported 585 inches of snowfall through April 21, which is ~30% percentile. April 1 swe is the key date for asssessment for winter snowpack water resources. For glaciers the accumulation season typically continues until the end or April or early May. This year snowpack depth at Mount Baker Ski Area (1280 m) increased from 148 inches on April 1 to 164 inches on April 9 and then declining to 119 inches by May 1 (80% of normal). A similar pattern was seen at Stevens Pass-Grace Lake station (1460 m) with snowpack depth on April 1 of 107 inches, increasing to 114 inches by April 9 and decreasing to 82 inches by May 1. These stations are several hundred meters below glacier elevations. At Lyman Lake Snotel (1800 m) snowpack SWE which most closely matches the glacier elevations was 40.1 inches rising to 42.5 inches by April 11 and declining to 35.9 inches by May 1, ~60% of normal. At the Middle Fork Nooksack site (1520 m) snowpack was 44.8 inches SWE on April 1, rising to 49 inches by April 11 and declining to 46 inches on May 1, 67% of normal . This illustrates that at glacier elevations snowpack would have also increased in mid-April, before a slow decline in the latter part of the month. There were a number of atmospheric rivers that drove a higher snowline than usual as May starts, but also led to a rapid increase in snowpack above the snowline.

The mean April 1 SWE from 1946-2025 at six long term SNOTEL stations: Stampede Pass, Fish Lake, Stevens Pass, Lyman Lake, Park Creek and Rainy Pass.

As the melt season begins, based on the above the winter snowpack on glaciers on May 1 are 70-80% of normal. Eric Gilbertson measured snowpack on the summit Colfax Peak at 17.3 ft (5.27 m) on April 18, 2025. This is a location that is to some extent wind scoured and would be less than the depth on the adjacent glacier, a normal year there is 8-9 m of snowpack at 2300-2800 m. On Eldorado Peak they found 25.3 feet on April 27, 2025. This is the depth expected for this location in a year with 75-80% of normal snowpack. It is a location that appears to balance enhanced deposition and scour. Weather conditions in the Pacific Northwest are forecast to have above average temperatures for the upcoming 90 day period. This combined with the below average snowpack on glaciers on May 1, will yield another year where ice thickness loss exceeds 1 m across the glaciers, as each of the last four years have. The average from 2014-2024 has been -1.41 m, which is a 1.5 thick slice of the glacier lost each year. The range expected this year is -1.2 m to -2.4 m. How much will depend on the specific weather and the frequency and intensity of heat waves.

Mean mass balance observed in the field annually by the North Cascade Glacier Climate Project.

Ice Worm Glacier Disappears in 2023, North Cascade Range, WA

Ice Worm Glacier from the same location in 1986 and 2023, Bill Prater in 1986 image.

Ice Worm Glacier is an east-facing cirque glacier on the east flank of Mount Daniel, WA. Mount Daniel is on the crest of the North Cascade Range of Washington, the crest separates the dry east side that drains to the Columbia River and the wet west side that drains to Puget Sound. The glacier is at the headwaters of Hyas Creek, which drains into the Cle Elum River and the Cle Elum Reservoir. The Cle Elum Reservoir has a storage volume of 538,900,000 m3 and is primarily used for flood control in spring, and agricultural irrigation in summer. This reservoir is the largest in the Yakima River Basin and provides irrigation to 180,000 hectares of agricultural land. The glacier is located in the Alpine Lakes Wilderness area which prohibits the use of mechanized equipment. The Ice Worm Glacier cirque floor is at 1940 m and the headwall at 2050 m. There is a bench at 2150–2300 m that held a glacier/perennial icefield prior to 2015. The glacier is accessed by backpacking 8 km from the Cathedral Rock trailhead with the same base camp used each year at 1700 m on the bank of Hyas Creek. Detailed publication by Mauri and Jill Pelto at: Loss of Ice Worm Glacier, North Cascade Range, WA USA, 2025.

The glacier is fed by wind drift accumulation along the ridge that was just above the top of the glacier during the 1944-2000 period. Avalanching from the slopes below the East Peak of Mount Daniel and from the ridges extending along the north and south flank of the glacier have also been significant. The glacier is part of the Mount Daniel-Mount Hinman Glacier Complex just south of Highway 2 and sits astride the Cascade Divide. This complexcomprised of 9 glaciers covering 3.8 km2 in 1984. This was the biggest cocentration of glaciers between Mount Rainer and Glacier Peak. At the end of the summer 2023 melt season only three of these remain as glaciers, Daniels, Foss and Lynch Glacier. We began monitoring these glaciers along with Ice Worm Glacier in 1984.

Ice Worm Glacier Evolution

Ice Worm Glacier field sketch by Jill Pelto in 2023.

In 1986 William (Bill) Prater, who had made many first ascents in the area between 1944 and 1960, joined us in the field. Bill also had invented and patented (1973) the first snowshoe with a claw attached to its binding, the Sherpa Snowshoe. Comparing images from these early visits with the current margin of Ice Worm Glacier indicated that there had little change in this glacier from 1944-1986. The mapped area in 1958 was 0.19 km2 (GLIMS, 2023), in 1986 we mapped the area at 0.18 km2.

Each summer during the third week in August we measure the mass balance of this glacier. Because the glacier lacks crevasses we simply grid the glaciers with measurements made 50 m apart along transects running up the glacier and across the glacier along the margins. We also completed a longitudinal profile running up the glacier from a fixed location on the bedrock at the below and at the top of the glacier. The surface elevation was determined at the specific 50 m points to identify thinning of the glacier. During the first decade the glacier extended to within 10 m of the ridge on the south side of the glacier, allowing us to ski off of the ridge, see 1990 image below.

Glacier Area Change

View of the south ridge across Ice Worm Glacier in 1990 above and 2006 below, note recession of the top of the glacier from this ridge.

From 1984 to 1992, the glacier extended to within 15 m of the ridge on the south side of the basin. By 1995 this was no longer possible as the top of the glacier was retreating as fast as the bottom of the glacier. In 2006, the recession from this ridge was greater than the recession at the terminus. The glacier perimeter was surveyed in the low snow years of 2005 and 2015, identifying the glacier area to be 0.15 km2 and 0.110 km2, respectively. In 2015, the inventory for RGI noted an area of 0.106 km2. Annually, from 2021 to 2024, low snow cover allowed for mapping of the glacier perimeter during a rapid decline from 0.09 km2 to 0.03 km2. The area loss from 1986 to 2015 was 0.07 km2, which is less than the area loss from 2015 to 2023 of 0.08 km2. provides a photo comparison of the change from 1986 to 2023, with the people standing in the same location in each case. The observed area determined in the field from the GPS position locations closely matches the RGI inventory area in 2015 and the area derived from overlaying the points on Sentinel 2 imagery from August 2021 to 2024, which have a 10–30 m resolutionThis summer we observed a dozen holes that reached the bottom of the glacier 4-6 m below, indicating how thin the ice is. There is no movement, the size and thickness are too low to generate future movement, hence this is no longer a glacier. A glacier is a body of snow and ice that is moving, this requires a persistent thickness of 20-30 m, which is typically associated with snow/ice areas of ~50,000 m² or larger. As a glacier becomes thinner or smaller than this movement will not be sustained.

Table 1. The observed area of Ice Worm Glacier from field measurements. The area of Ice Worm Glacier from previous inventories and Sentinel 2 imagery.

YearField Mapped Area (m2)Validating Aerial/Satellite Image Area (m2)
1958 190,000 (GLIMS)
1986180,000 (±10,000)Field Observation only
1992170,000 (±10,000)Field Observation only
2005150,000 (±5000)Field Observation only
2015110,000 (±5000)106,000 (RGI)
202188,000 (±2000)90,000 (Sentinel)
202268,000 (±2000)Field Observation only
202341,000 (±2000)40,000 (Sentinel)
202432,000 (±2000)30,000 (Sentinel)

We have measured discharge at a natrual weir below Ice Worm Glacier since 1986. Average August daily runoff has declined 60% by 2022.

Glacier Base Observations

Ice Cave in 2024 that extended from top to the end of the glacier.

Beginning in 2015, we routinely assessed how deep each moulin, crevasse or supraglacial stream channel was on the glacier. One measure of a glacier no longer being a glacier is when crevasse features and stream channels consistently reach the bedrock below the glacier. In 2023, we examined 24 of these features and each reached bedrock at depths of 2–10 m. These features were distributed widely across the glacier. There are undoubtedly limited areas of thicker ice. In 2024, we explored an ice cave that extended 250 m from the top of the glacier to the end of the glacier. The cave roof was 1–4 m above bedrock, and the roof was consistently less than 2 m thick allowing light to penetrate from the glacier surface into the cave. An extensive ice cave transecting the entire glacier such as this cannot exist in a current glacier because ice movement would lead to ice cave closure.

Streams channel reaching bedrock at base of Ice Worm Glacier.

Each year in mid-August, stream discharge has been observed immediately below the 1986 terminus position of Ice Worm Glacier at 11 a.m., 2 p.m. and 5 p.m. during the field visit. This stream is also fed by perennial snowfields and, before 2015, a small glacier. These observations are insufficient to quantify daily runoff, but because of the consistent timing and methods, do allow for comparison. The glacier is located on the dry side of the range and has not experienced rainfall during any of our field observation periods, which would contribute to stream discharge. From 1985 to 2002, streamflow was observed on 36 days, with the average discharge being 0.12 m3 s−1. From 2021 to 2024, discharge was observed on 6 days with the average discharge being 0.03 m3 s−1. This roughly 75% decline in August runoff is similar to the 60% loss in runoff modeled for the loss of small glaciers in basins in the Alps and observed when the Lewis Glacier, North Cascade Range was lost. The change in summer streamflow in Hyas Creek near our base camp is apparent, as it had been a challenging stream crossing to keep your feet dry until 2013, and now is a simple step across. There has also been a marked increase in algae coating the substrate of the stream with the lower flow, clearer and warmer water, which is expected.

Climate Drivers

Trends in summer temperature at Western Cascade weather stations for the 1896 to 2024 period indicate that seven of the ten warmest melt seasons (June–September) have occurred since 2013. Melt season temperatures from 2014 to 2024 were 1.3 °C above the 1896 to 2022 mean. The long-term winter temperature trend from 1896 to 2024 has been 1.2 °C. From 2014 to 2024 winter temperatures were 0.9 °C above the long-term average, the warmest decadal period of the record.

During the 1896 to 2024 period from June to September, precipitation exhibited no significant trend. For the November–April (winter season) there was a 3% increase in precipitation from 1896 to 2024. From 2014 to 2024 winter precipitation averaged 1.68 m vs. the long-term average of 1.65 m. April 1 SWE from six long-term SNOTEL stations where April 1 SWE has a declining trend of 30% from 1946 to 2023, with a 10% decline since 1984. The April 1 SWE loss reflects increased melting of the snowpack or rain events during the winter season.This indicates that it is temperature rise that is driving the glacier mass balance loss, retreat and eventual disappearance of Ice Worm Glacier.

Washington State Division 5 -Cascade West-Temperature trends.
Washington State Division 5 -Cascade West-Precipitation trends.

2024 North Cascade Glacier Climate Project Results-41st year

Serac on Easton Glacier at 2400 m indicating retained snowpack from previous years.

Climate Conditions Summary

The winter season of 2023/24 yielded a low snowpack across the North Cascades. Snowpack at six longer Snotel stations was 0.63 m w.e on April 1, vs. a 1984-2024 average of 1.02 m. This was the third lowest snowpack of this period, with 2005 and 2015 being lower. The melt season in May and June was cool, helping extend the low snowpack at elevations above 1500 m. July rivaled 2015 for the warmest of the last 50 years, quickly melting back the snowpack by the start of August. The end of the melt season was fairly typical with several new snowfalls and periods of heat. The main melt season for the glaciers is June-September and this year the average temperature was 18.3 C, which is 1.3 C above the long term mean. This was the fourth year in a row above 18 C and thus the fourth consecutive year of large glacier mass balance losses. The cumulative impact is glacier recession, thinning, loss of a number of glacier and overall steeper/dirtier ice. We conducted detailed field work on eight glaciers.

Probing snow pack depth on Lower Curtis Glacier. The 12 foot segmented steel probe cannot penetrate the icy surface from the previous summer.

Glacier Mass Balance

Annual mass balance is the difference between the mass of snow and ice accumulation on the glacier and the ablation of snow and ice on the glacier during a year. The data is reported in the average change across the glacier in water equivalent thickness. In 2024 we again utilized probing snow depth with a 12 foot long segmented steel probe (520 measurements), annual layer thickness measurement in vertically walled crevasses (140 measurements), and mapping snow line position in the field. To assess ablation we used snow line migration in satellite imagery and ablation stakes drilled into the glacier. The mass balance at the snowline is 0 m w.e., and as it transects areas of known snow depth that identifies ablation rate.

Ben Pelto deploying his ice augur to emplace ablaiton stakes on Sholes Glacier, Katie Hovind and Mauri Pelto assisting.
Jill and Mauri Pelto in front of Columbia Glacier that has retreated forming a new lake. Avalanche accumulation on west side only snowcover retained by end of summer.

All eight glaciers had a negative balance exceeding 1.3 m w.e., with an average of -2.09 m w.e., this is equivalent to at ~2.25 m of glacier thinning. The loss during the last four years is unprecedented with 8 m of average thickness lost from 2021-2024. This is greater than the entire decade of loss for 184-1993, 1994-2003 or 2004-2013. The acceleration of loss continues even as the glaciers lose their highest melting terminus regions. This is an indication that none of the glaciers are approaching equilibrium. The cumulative mean mass balance loss has been -28.89 m w.e., ~33 m in thickness. This represents the loss of ~40% of volume of the glaciers we have observed, 1% loss per year overall but over 2% per year in the last decade.

Annual mass balance time series for the eight glaciers we monitor and the USGS monitored South Cascade Glacier. In 2024 Columbia=-2.34, Daniels=-2.70, Easton=-1.74, Ice Worm=-2.40, Lower Curtis=-1.82, Lynch=-2.35, Rainbow=-1.38, Sholes=-2.35.

The deglaciated area exposed by the retreat over the last four decades is substantial and is most visible below Easton Glacier. The retreat of 620 m since 1990, has included a retreat of over 100 m in the last two years. The thinning of this glacier along with neighboring Squak and Deming have led to emergence of bedrock areas high on the glacier as well.

Deglaciated area below Easton Glacier from the 1990 advance moraine to 2024.
Bedrock areas that are emerging and expanding above 2100 m on the upper portions of Deming-Easton and Squak Glacier. Only one of these (upper right) existed before 2010.

Glacier Crevasses

We have been assessing the depth and distribution of crevasses on several glaciers annually since 2013. We have noted a decline in the number of crevasses in specific icefall regions, such as on Lower Curtis, Rainbow and Easton Glacier. The depth also decline rapidly with glacial thinning during the last decade. In the main icefall on Easton Glacier in 2024 at 2300 m were the deepest crevasses we found at ~30 m. Below is Jill Pelto measuring crevasse depth using a camline.

Glaciers Lost

There are 31 active glaciers across the North Cascades that we observed since the 1980s that have now disappeared. The list below indicates the year they were lost, the area of the glaciers in the GLIMS inventory for initial area (1958-1984), 2015 area, and the area of the former glacier in 2022/24. This is not a complete list of glaciers lost in the North Cascade Range. The rate of loss is clearly accelerating.

When a glacier’s volume becomes too limited to generate motion, a combination of thickness below ~15-25 m, and area less than 0.02-0.05 km2, it is no longer a glacier.

North Cascade glaciers that we observed as glaciers in the 1980s that are now gone. The first two areas reported come from GLIMS.org inventories, and the last area and year of loss come from our observations.

Glacier Runoff

We directly measured runoff below Sholes Glacier and in the basin of former Ice Worm Glacier. In each continued glacier recession is reduing glacier runoff. The increased rate of melt is, exceeded by the reduced area available for melting. The result is declining summer streamflow and increased late summer stream temperatures.

Reflections from the 2024 North Cascade Glacier Climate Project Field Season

The 2024 field season was our 41st, from the glaciers perspective it was the fourth consecutive year of exceptional mass loss, leading to thinning, retreat and glacier loss. Below are images from the field season and reflections on each from the varied perspectives of our field team and field partners.

Coleman Glacier, Mount Baker at the golden hour as we just finished work.

Jill Pelto: During the field season our typical day involves getting up with the sun and working out on a glacier until early evening. Going to Coleman Glacier on Mt. Baker this year was special because we got to work on it during golden hour, a rare thing to experience. We had the glacier to ourselves, and the nearby big camping area — despite this being a popular destination for ice climbers. This is only my third time in sixteen years working on this glacier, and its significant loss since we last saw it in 2019, when I sat and painted on it, was so apparent. But in spite of that, I was feeling joyful to be there — something about four of us out there on our own taking measurements as the summer sun set was so magical. I was so grateful to be there at that moment and experience this landscape as it is now. 

Saddle at top of Rainbow Glacier looking to summit of Kulshan (Mount Baker). Ben, Jill and Mauri Pelto a combined 70+ years of experience on these glaciers.

Mauri Pelto: Climate change has led to increased glacier melting on all of the glaciers we have observed. A combined 70+ years of field experience that Ben, Jill and I have provides a context that is crucial. The increased melt is apparent in the streams flowing across the surface very few meters carrying meltwater to the rivers and then the sea. This summer we saw the beauty of the final stages of decay of a glacier melting away in the ice caves that transected the former Ice Worm Glacier (image below). The cave started at the top of the glacier and continued right to the bottom, by next summer that too will be gone. The colors and atmosphere in the cave were spell binding. The landscape remains beautiful, but is losing the glaciers that are a powerful, beautiful and dynamic part of this landscape.

Katie Hovind: Nestled along Ptarmigan Ridge, overlooking Kulshan’s glacier-flanked slopes, was our longest campsite of the field season. Unzipping my tent to an increasingly familiar skyline four mornings in a row, I found myself developing a relationship with this place. I noticed patterns and changes alike, discovering not just the place but a sense of home in it. We followed transects across the Sholes, probing up and down the glacier; we explored a collapsed ice cave near its terminus, blue ice towering over me, ancient wisdom frozen in the dripping layers I ran my hands along; we took water measurements from the stream it feeds, pausing for a break next to the fresh melt as I sketched the textures of rock and snow and ice. We commuted across it twice to the Rainbow Glacier, a trek familiarizing me with the Sholes’ sweeping slopes and views; and we screwed an ice auger deeper than we could see, dropping stakes 3-4 feet below the surface. 19 days later, I returned to the coordinates of those four stakes, which were now all exposed, one sticking up to just over 3 feet above the surface. Reeling as I walked across the glacier I’d gotten to know, the near-incomprehensible volume of loss I saw. A feeling of belonging is so integral to caring. And then comes the question of how to transmit that connection, to spread to others the same sense of responsibility to protect a place? Being lucky enough to experience even a handful of days taking in just a small degree of the Sholes’ nuances, I felt deeply just how wrong and quick the melt is. But from the outside looking in, without any prior reference points, the severity of the glacier shrinking could be overlooked. Through these comparison photos, I hope to share just a glimpse, beauty and grief and all, of what it means to understand and love a glacier.

Emma Murray: Just a few minutes into our hike from camp to the Easton glacier, Science Director Mauri Pelto pointed out the rock that marked the spot where he put his crampons on in 1990. Looking up the valley, the ice felt SO far away. This glacier has retreated almost 600m in my lifetime already. In response to the melting at each of the six glaciers I visited during my time with the Project, I added paint, pen, and thread to canvas. These flags are both white-flag surrenders to all the melting we cannot stop and blowing-in-the-wind prayers for us all to act in the ways we can. I hope these pieces help people to visualize and feel the difference between where the ice was and where it is now. I think feeling that loss is groundwork for our urgent conversations about climate solutions, which can be uplifting and cool and pragmatic and creative!

Shari Macy: Mauri Pelto, peers into the melting terminus of the Lower Curtis Glacier; located on the southern slopes of Mount Shuksan in the North Cascades of Washington State. As founder of the North Cascade Glacier Climate Project, he has been measuring these shrinking giants since 1984. This image, to me, shows a man and what he dedicated his life to studying. A passion that drove him to spend over 700 nights in tents, camped out next to the glaciers of the North Cascades. These glaciers could use a lot more people like Mauri. Does everyone need to backpack to remote glaciers every summer? No. He already does. However, we could all be a little more dedicated to the health of our planet, our home. Our one and only. Our children’s one and only.

Megan Pelto: To me, Mt. Baker represents the North Cascades. Camping next to its looming presence makes me aware of how impactful it is, its glaciers helping support the ecosystem and the wildlife that surround it. Getting to be present in this wilderness feels like a gift and a chance to both disconnect and reconnect. Everything you have is contained in one little tent and the experience of camping in this landscape is magical. I wanted to capture that with our colorful little tents tucked into grassy hills with Baker above us. I have been able to visit this landscape over the past 10 years, and while the glaciers change each year, many things have remained peacefully the same.

Ben Pelto: Disappearing glaciers remind me of grandparents—I’m saddened by their decline, yet deeply grateful for the time I still have with them. This year, being in the field was especially meaningful, surrounded by an incredible group of people, just experiencing the mountains and soaking it all in. What I find hardest about glaciers vanishing is not just the loss of ice, but the disappearance of their dynamism and beauty from the landscape. These ancient giants bring a sense of magic and power to the mountains, and it breaks my heart to think that my children or grandchildren might never witness them as I have.

Cal Waichler: This season I ask what it means to be a voice for glaciers. How can I transmit my gratitude that I can stand on this earth, breathe glaciers’ breezes, seep in icy blue and alpenglow rose, pop alpine huckleberries in my mouth, and notice the shrinking snow and dissolving ice, while also alerting people to their vulnerabilities? Glaciers are a throughline in my explorations and art. I am so utterly enchanted by them. The awe and creative inspiration they bring to my life is a great gift. As a voice for shrinking glaciers, what stories can I share that will enchant other people with them? What will make us care enough to enact climate change mitigation and adaptation, and vote for climate leaders? Here, a snapshot of those most transient and irreplaceable things.

Cascade Pass Area Loses Two Glaciers

Screenshot
Screenshot

The Triplets and Cascade Peak glacier in GLIMS glacier viewer with the red outlines of the 1958 and 2015 margins and the black dot indicating they are now extinct.

In a 1993 Washington Geology article I noted that “In the Cascade Pass area two small glaciers in Torment Basin and two beneath the Triplets Peak and Cascade Peak have altitude ranges of less than 150 m. These glaciers in 1985, 1987 and 1992 were entirely in the ablation zone if present conditions persists they will disappear.” This is an update on the glaciers below The Triplets and Cascade Peak. The threshold for a glacier to exist in terms of area is typically 50,000 m² or 10,000 m², there must also be motion which is increasingly rare as area drops below 50,000 m² (Leigh et al 2019). Motion is typically determined by active crevassing, which does not include relict crevasses reaching bedrock (Fountain et al 2023). To survive a glacier must have a persistent accumulation zone, the lack of this leads to thinning of the glacier even in its upper accumulation area (Pelto, 2010).

triplets 1986

The Triplets and Cascade Peak glacier with plentiful active crevassing in 1986 image I took from near Cascade Pass.

triplets 1990The Triplets and Cascade Peak glacier with significant retained snowcover in 1990 image I took from near Cascade Pass.

In 1986 I first walked on the two glaciers below The Triplets and Cascade Peak. They were crevassed glaciers fed on north facing benches below the peaks providing good radiational shading and fed by avalanches. The glaciers are also steep enough to shed avalanches. In 1992 these two glaciers did not retain significant snowpack and we noticed some crevasses within 50 m of the ice front reaching bedrock. Of more import was that several sections of glacier with bedrock reaching crevasses had slid detaching from the glacier on the steep smooth bedrock glacier bed.This process of melt driven thinning leading to detachment of small glacier sections is what prompted me to think these glaciers would not last. This type of detachment is evident in the 1998 Google Earth image, lower right of Cascade Peak Glacier.

triplets 1992

The Triplets and Cascade Peak glacier with limited snowcover on Triplets glacier even in early August 1992. We were on route to the glacier when I took this picture.

crevasse to bedrock

Crevasse on Triplet Glacier that reaches bedrock near terminus in 1996.

Screenshot

The Triplets and Cascade Peak glacier with active crevassing in 1998 Google Earth image (yellow arrows). Some of these crevasses reached bedrock and led to detachments, note lower right on Cascade Peak glacier.

cascade pass triplets 2003

The Triplets and Cascade Peak glacier with active crevassing in 2003 with developing separation between east and west sections at yellow arrows.

The Triplets and Cascade Peak glacier with active crevassing only on Cascade Peak glacier in 2016 Google Earth image (yellow arrow).

triplets-2023-Wyatt-Mullen

In Sept 2023 The Triplets is now six fragments Cascade Peak glacier is three fragments. Image from Wyatt Mullen, who shares spectacular images on Instagram daily.

From 2003-2005 each summer these two glaciers failed to retain much snowpack and continued to thin and lose area. The Global Land Ice Measurements from Space (GLIMS) assessed the The Triplets and Cascade Peak glaciers with an areas of  respectively 55,000 m² and 60,000 m², respectively this area was updated with a 2015 area assessment of 70,000 m² and 32,000 m² respectively. In 2019, 2021, 2022 and 2023 glaciers in the North Cascades experienced a sequence of years that left most glaciers in the range largely snow free for the last 4-6 weeks of the melt season leading to exceptional mass loss and consequently area loss. The area of the largest contiguous area of ice of the two glaciers declined from 51,000 m² and 31,000 m² in 2019, to 37,000 m² and 26,000 m² in 2021 and 18,000 m² and 15,000 m² in 2023. By 2023 neither glacier exhibited active crevassing as both approached the lower threshold for glacier existence. Thirty years after my initial assessment both The Triplets and Cascade Peak glaciers no longer exist. This is shown in the GLIMS glacier viewer which illustrates extinct glaciers as black dots. These two are in the list of 34 extinct glaciers in the North Cascades that I have measured since 1984 that are now gone, and are in this GLIMS extinct glacier layer. The sustained mass balance loss of North Cascade glaciers is what is leading to significant volume declines of all glaciers and loss of glaciers that were thin (Pelto, 2018).

Screenshot

The Triplets and Cascade Peak glacier in August 2019 Sentinel false color image. Area of  The Triplets  glacier =51,000 m²: Cascade Peak glacier=31,000 m² 

Screenshot

The Triplets and Cascade Peak glacier in August 2021 Sentinel false color image. Area of The Triplets glacier =37,000 m²: Cascade Peak glacier=26,000 m² 

Screenshot

The Triplets and Cascade Peak glacier in August 2023 Sentinel false color image. Area of The Triplets glacier =18,000 m²: Cascade Peak glacier=15,000 m² 

From Mount Hood to Mount Robson Extremely Limited 2023 Snowcover Retained

Written by Ben Pelto, Jill Pelto and Mauri Pelto

jill sketch ice worm 2023

Field Sketch of Ice Worm Glacier from Aug. 13, 2023 on photograph of glacier. (Jill Pelto)

It was July 5, 1981 and Juneau meteorologist Brad Coleman had just informed us that Juneau had experienced one of its warmest least snowy winter ever. I was with the Juneau Icefield Research Program and we were headed up to the icefield the next day, it would be my first visit to a glacier. I was looking forward to plentiful summer skiing and now was concerned there would be limited snow. This worry proved unfounded, as once on the icefield, we stayed above 1000 m, and it was all snow, allowing me to ski 500 km in the next several weeks. From that summer through 2000, I continued to spend the majority of my time working on glaciers every August skiing whether in Alaska or in the North Cascade Range, Washington. Alpine glaciers need to maintain at 55%+ snowcover right to the end of the summer to maintain equilibrium. Hence, skiing should be plentiful. However, in 2003 I gave up skiing on glaciers during our August North Cascade field seasons, the snow had become too limited and patchy. During the last decade the percentage of snowcover has been consistently low, with the 2021-2023 period setting the record for persistent snowcover deficits in the North Cascacdes, but also throughout the Pacific Northwest from Mount Robson, BC to Mount Shasta CA. This sequence of difficult years for glaciers had led to the end for quite a few. -Mauri Pelto

I have spent 15 years with the NCGCP most years snow remains only at higher elevations or in large avalanche fans, with a couple of years having deep snowpack and lack of heat waves has led to a good year for the glaciers. And now years like 2015, 2021 and 2023 where there is so little snow that walking on the glaciers is almost a different landscape. Every feature is exposed, debris cover is piled up, and new or changed water features like melt channels or ponds emerge. In August 2023 it was most starkly seen on Mt. Daniel, on the eastern, drier side of the North Cascades. It was my first year seeing the loss of a glacier: the Iceworm Glacier. A remnant ice patch remains, but there are no longer any active features such as crevasses. It was also my first time seeing the very steep Daniel Glacier with essentially no snow. Navigating across bare ice on a 35+ degree slope for very few measurements had our whole team questioning how long it would be worth our effort. Some of my favorite moments of my 14 other seasons are glissading (or skiing with your hiking boots) down the steep slopes of Daniels. You can carve turns and do quick stops, and you can get down the glacier in about a quarter of the time you climb up. It’s always an exhilarating and rewarding way to end the season. This year the descent was difficult one firm crampon step at a time.  I clung onto one fun glissade on the adjacent Lynch Glacier. In that moment I needed to enjoy what I could, and after the season I needed to feel the loss of a place that has defined a piece of my life. 

Here we focus on this lack of snowcover we observed in the field and in satellite images from Mount Hood, OR to Mount Robson BC in August and Septemeber 2023. This combined with 2021-2023 has redefined many glaciers, making it clear how many cannot survive even current climate. We developed a forecast model of alpine glacier survival, published in 2010 that indicated significant accumulation zone thinning and/or lack of consistent accumulation zone are indicators of a glacier that cannot survive. The glaciers below on some of the highest peaks in OR, WA and BC are failing this metric in 2023.

Screenshot
Screenshot

At the end of August 2023 on the north side of Mount Hood, OR; Sandy Glacier and Ladd Glacier are so dirty looking in this Sentinel image that it is hard to discern that they are glaciers, both have limited patches of retained snow from the winter of 2023. Coe Glacier has three pockets of snow remaining from last winter covering close to 30% of the glacier. 

Screenshot
Screenshot

Across the Columbia River on Mount Adams, WA Wilson and Rusk Glacier are both over 90% bare firn and ice, with some snow on the upper margin above 2800 m where avalanche deposits endured.

Screenshot
Screenshot

On the south  slope of Mount Rainier, WA South Tahoma Glacier and Success Glacier lost all of their snowcover. There are a few patches of snow left on Kautz Glacier. The snowcover becomes more consistent at 3500 m, higher than can sustain most of the glaciers.

Ice worm glacier 1984-2023

Halfway between Mount Rainier and Glacier Peak is the Mount Daniel/Hinman area where glaciers are in rapid collapse. This includes Ice Worm Glacier on the east slope of Mount Daniel, which lost all of its snowcover in 203 (above) and Daniels Glacier that only has 5% snowcover in mid-August 2023 (below)

daniels-glacier-2022-2023

Foss Glacier on the northeast slope of Mount Hinman looks like a bug that splats on your windishield with wings/limbs in all directions, this will lead to rapid fragmentation.

Closer to Glacier Peak is Columbia Glacier, below Kyes, Monte Cristo and Columbia Peak. The view down the accumulation zone indicates a lack of snow or firn where there should be 2+ m of snowpack in early August.

Screenshot
Kololo Peak is on a ridge extending south from Glacier Peak and is host to several large glaciers. In September 2023 Whitechuck, Suiattle and White River Glacier lost all their snowpack, while the top of Honeycomb Glacier has a small area of snow left. Yellow arrows indicate where we observed the terminus of these glaciers 40 years ago.

Screenshot
Screenshot

On Glacier Peak Ptarmigan Glacier has separated into and east and west part and had no retained snow. Kennedy, Vista and Ermine Glacier had 10-20% retained snowcover on 9-15-2023 mostly in a band at 2500 m. Yellow arrows indicate terminus locations when I first visited these glaciers 40 years ago.

easton upper glacier composition

Easton Glacier is on the south/southwest side of Mt. Baker. The upper part of the glacier is a patchwork of ice, firn and snow, with new rock areas emerging even high on the glacier in August 2023. The difference with 2022 is evident. Two new waterfalls appeared in 2023 due to the extensive thinning and retreat at the terminus., yellow arrows. These are also depicted in the field sketch by Jill Pelto below.

jill easton sketch

Screenshot

Near Whistler, BC, the Garibaldi Neve (Icefield) showed little remaining snow in mid-September. Snow only clings high on Mount Garibaldi above 2200 m or 7200 ft.

Small glaciers across the region are losing all traces of seasonal and multi-year snow and are transitioning from active glaciers to remnant ice patches. The Stadium Glacier near Squamish British Columbia is one example of this. Photo by Ben Pelto.

Screenshot

The Conrad Glacier on the boundary of Bugaboo Provincial Park in British Columbia showing extensive bare ice and limited snow cover. The dark grey areas surrounding the white snow is firn, or multi-year snow, now exposed. The area covered by firn is important to glacier health. Firn that remains on a glacier becomes glacier ice and can retain meltwater. Areas of bare ice behave like a parking lot, nearly all water that reaches glacier ice leaves the glacier as runoff. The area of glaciers covered by firn is dramatically decreasing in the region. Pelto et al. (2019) found that 58% of the Conrad Glacier was covered by multi-year firn, a quick visual scan here shows that that number has declined to roughly 30-40%.

conrad smolke

Wildfire smoke darkens the sky and ice as Alexandre Bevington, Jacob Bailey and Margot Pelto stand on the Conrad Glacier in August 2018. Photo by Ben Pelto.

Coleman glacier 2018-2023 copy

Coleman Glacier is on the east flank of Mount Robson. In 2018 the terminus is in a small lake with the snow covering 25% of the glacier. By 2023 the glacier has retreated 400 increasing the lake size. The snowcovered area is less than 10% of the entire glacier and is restricted to regions above 2500 m.

The above images of snow free and nearly snow free glaciers is a sight that has until the last decade been very rare. It is now becoming a typical event. The glacier response has been rapid, profoundly changing most and leading to the end of some.

Collapse of the Glacier Complex on Mount Daniel-Hinman, Washington

jill sketch ice worm 2023

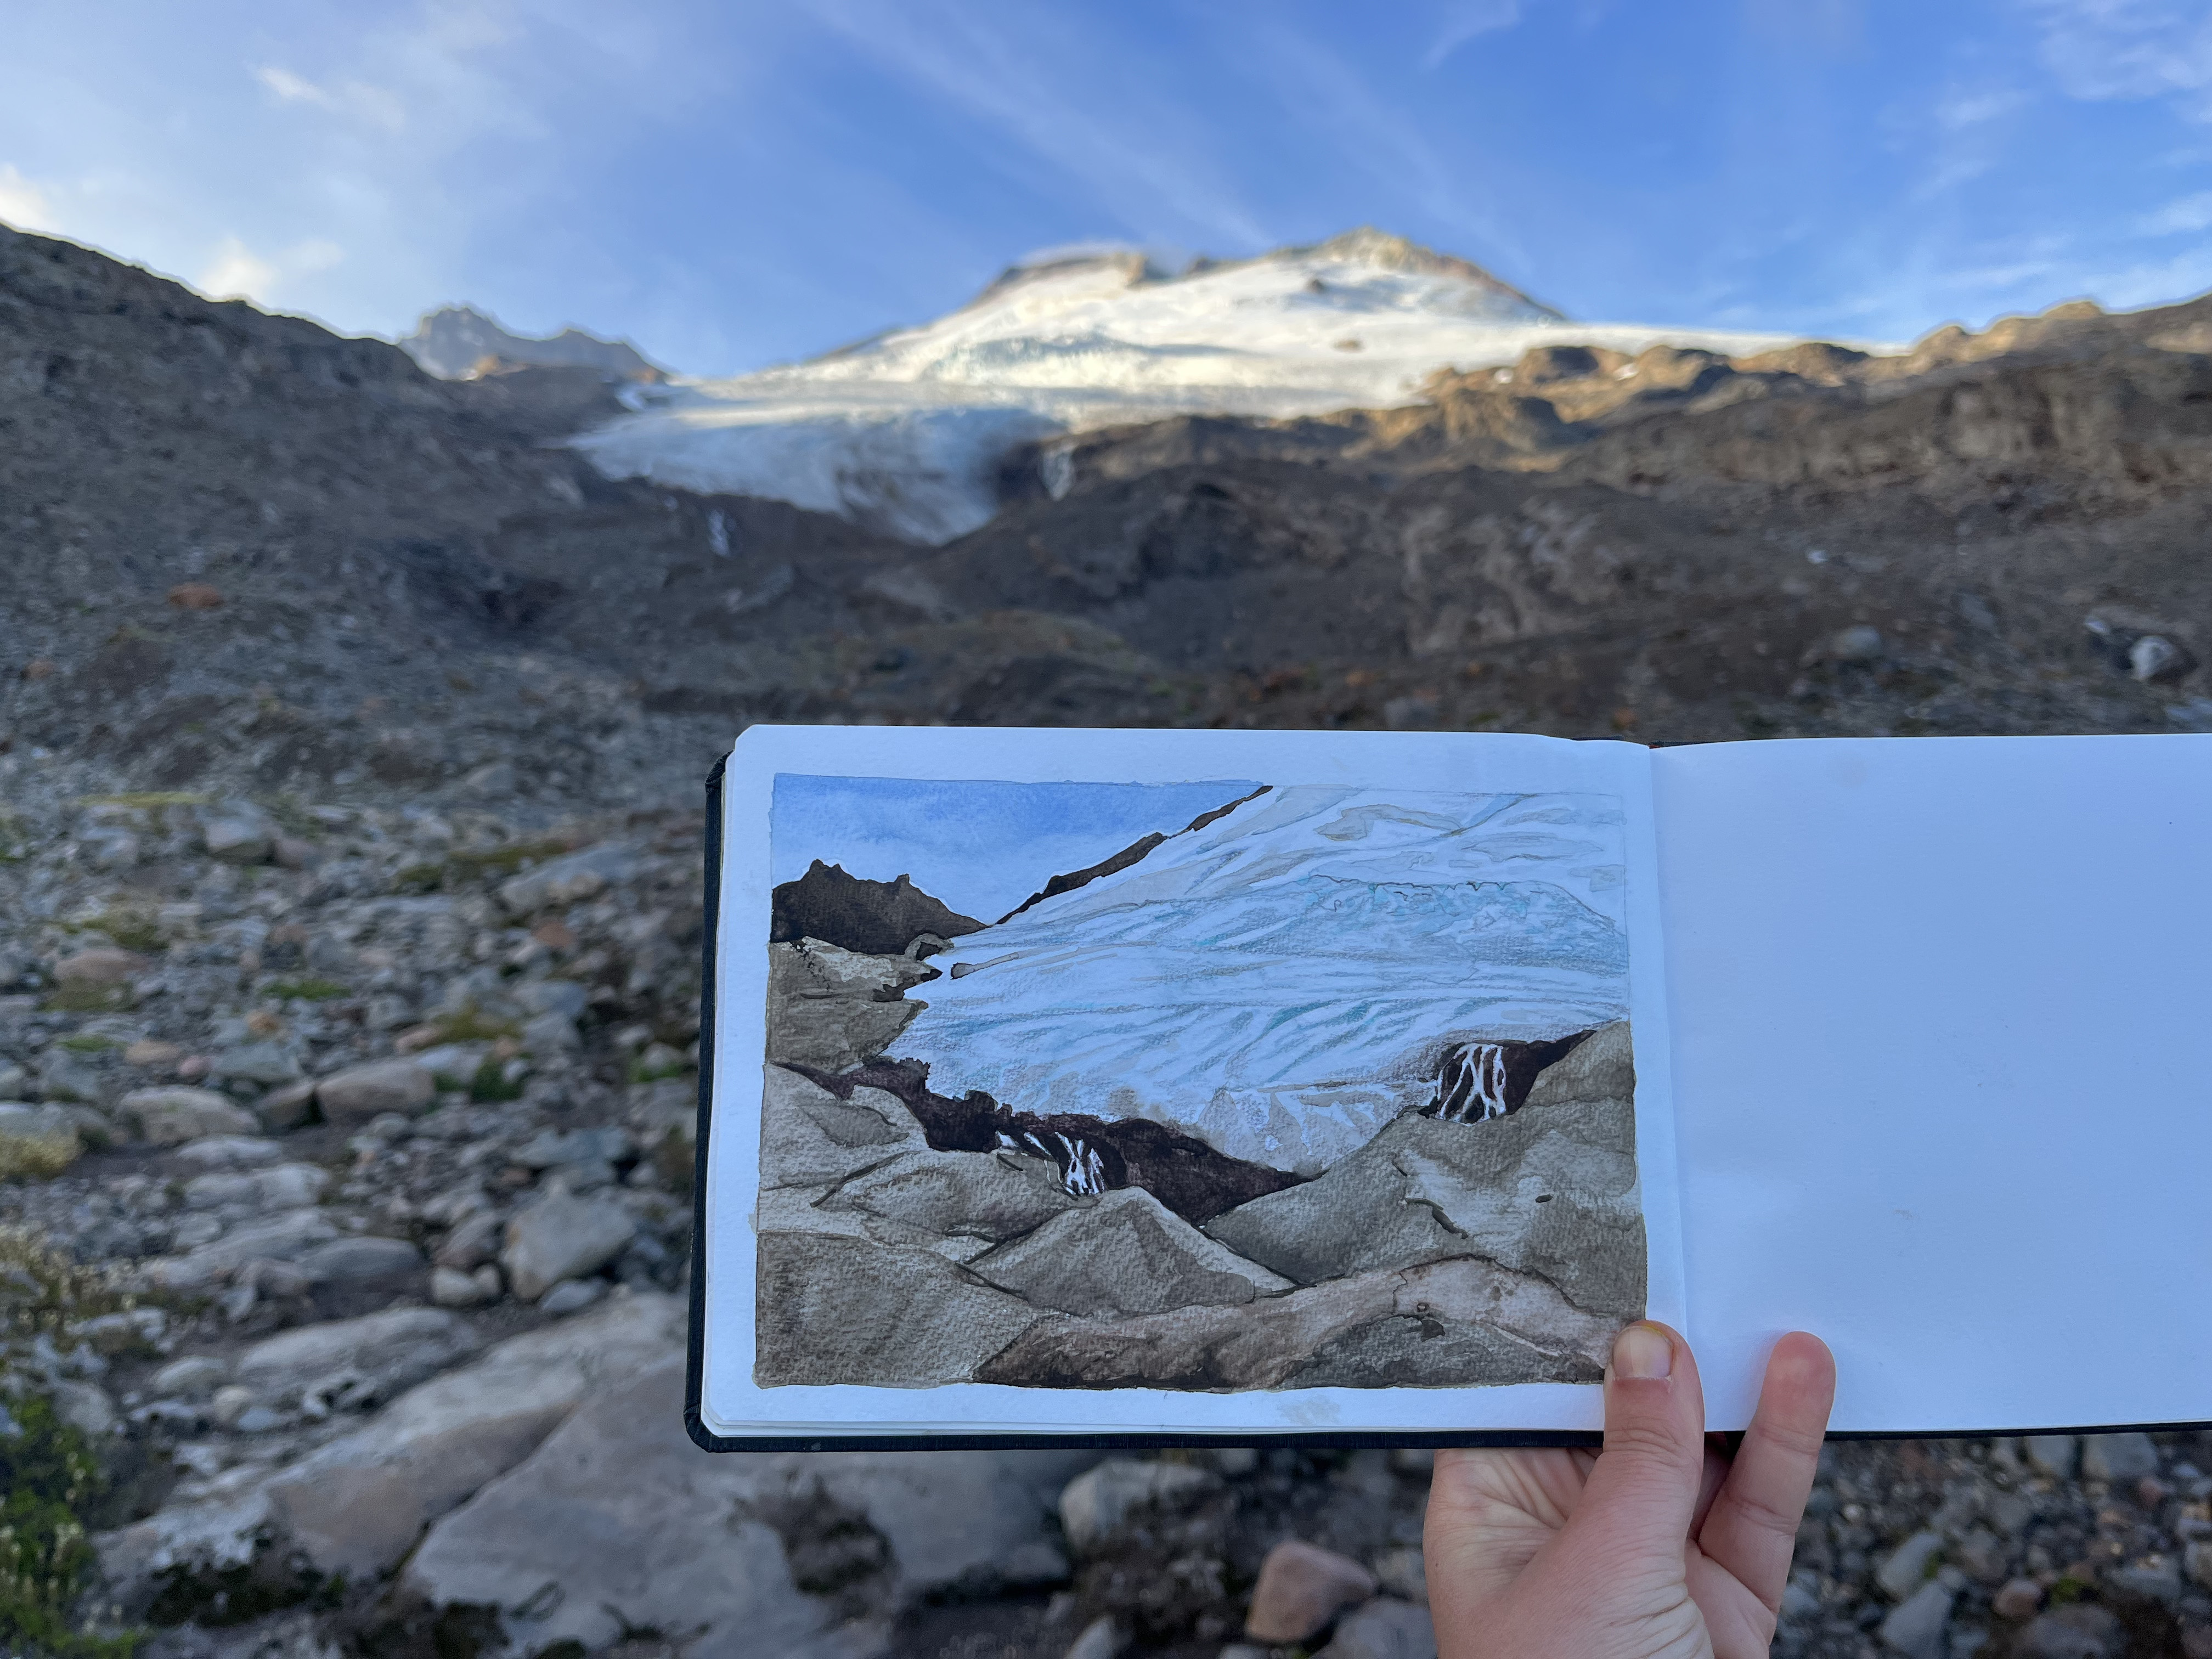
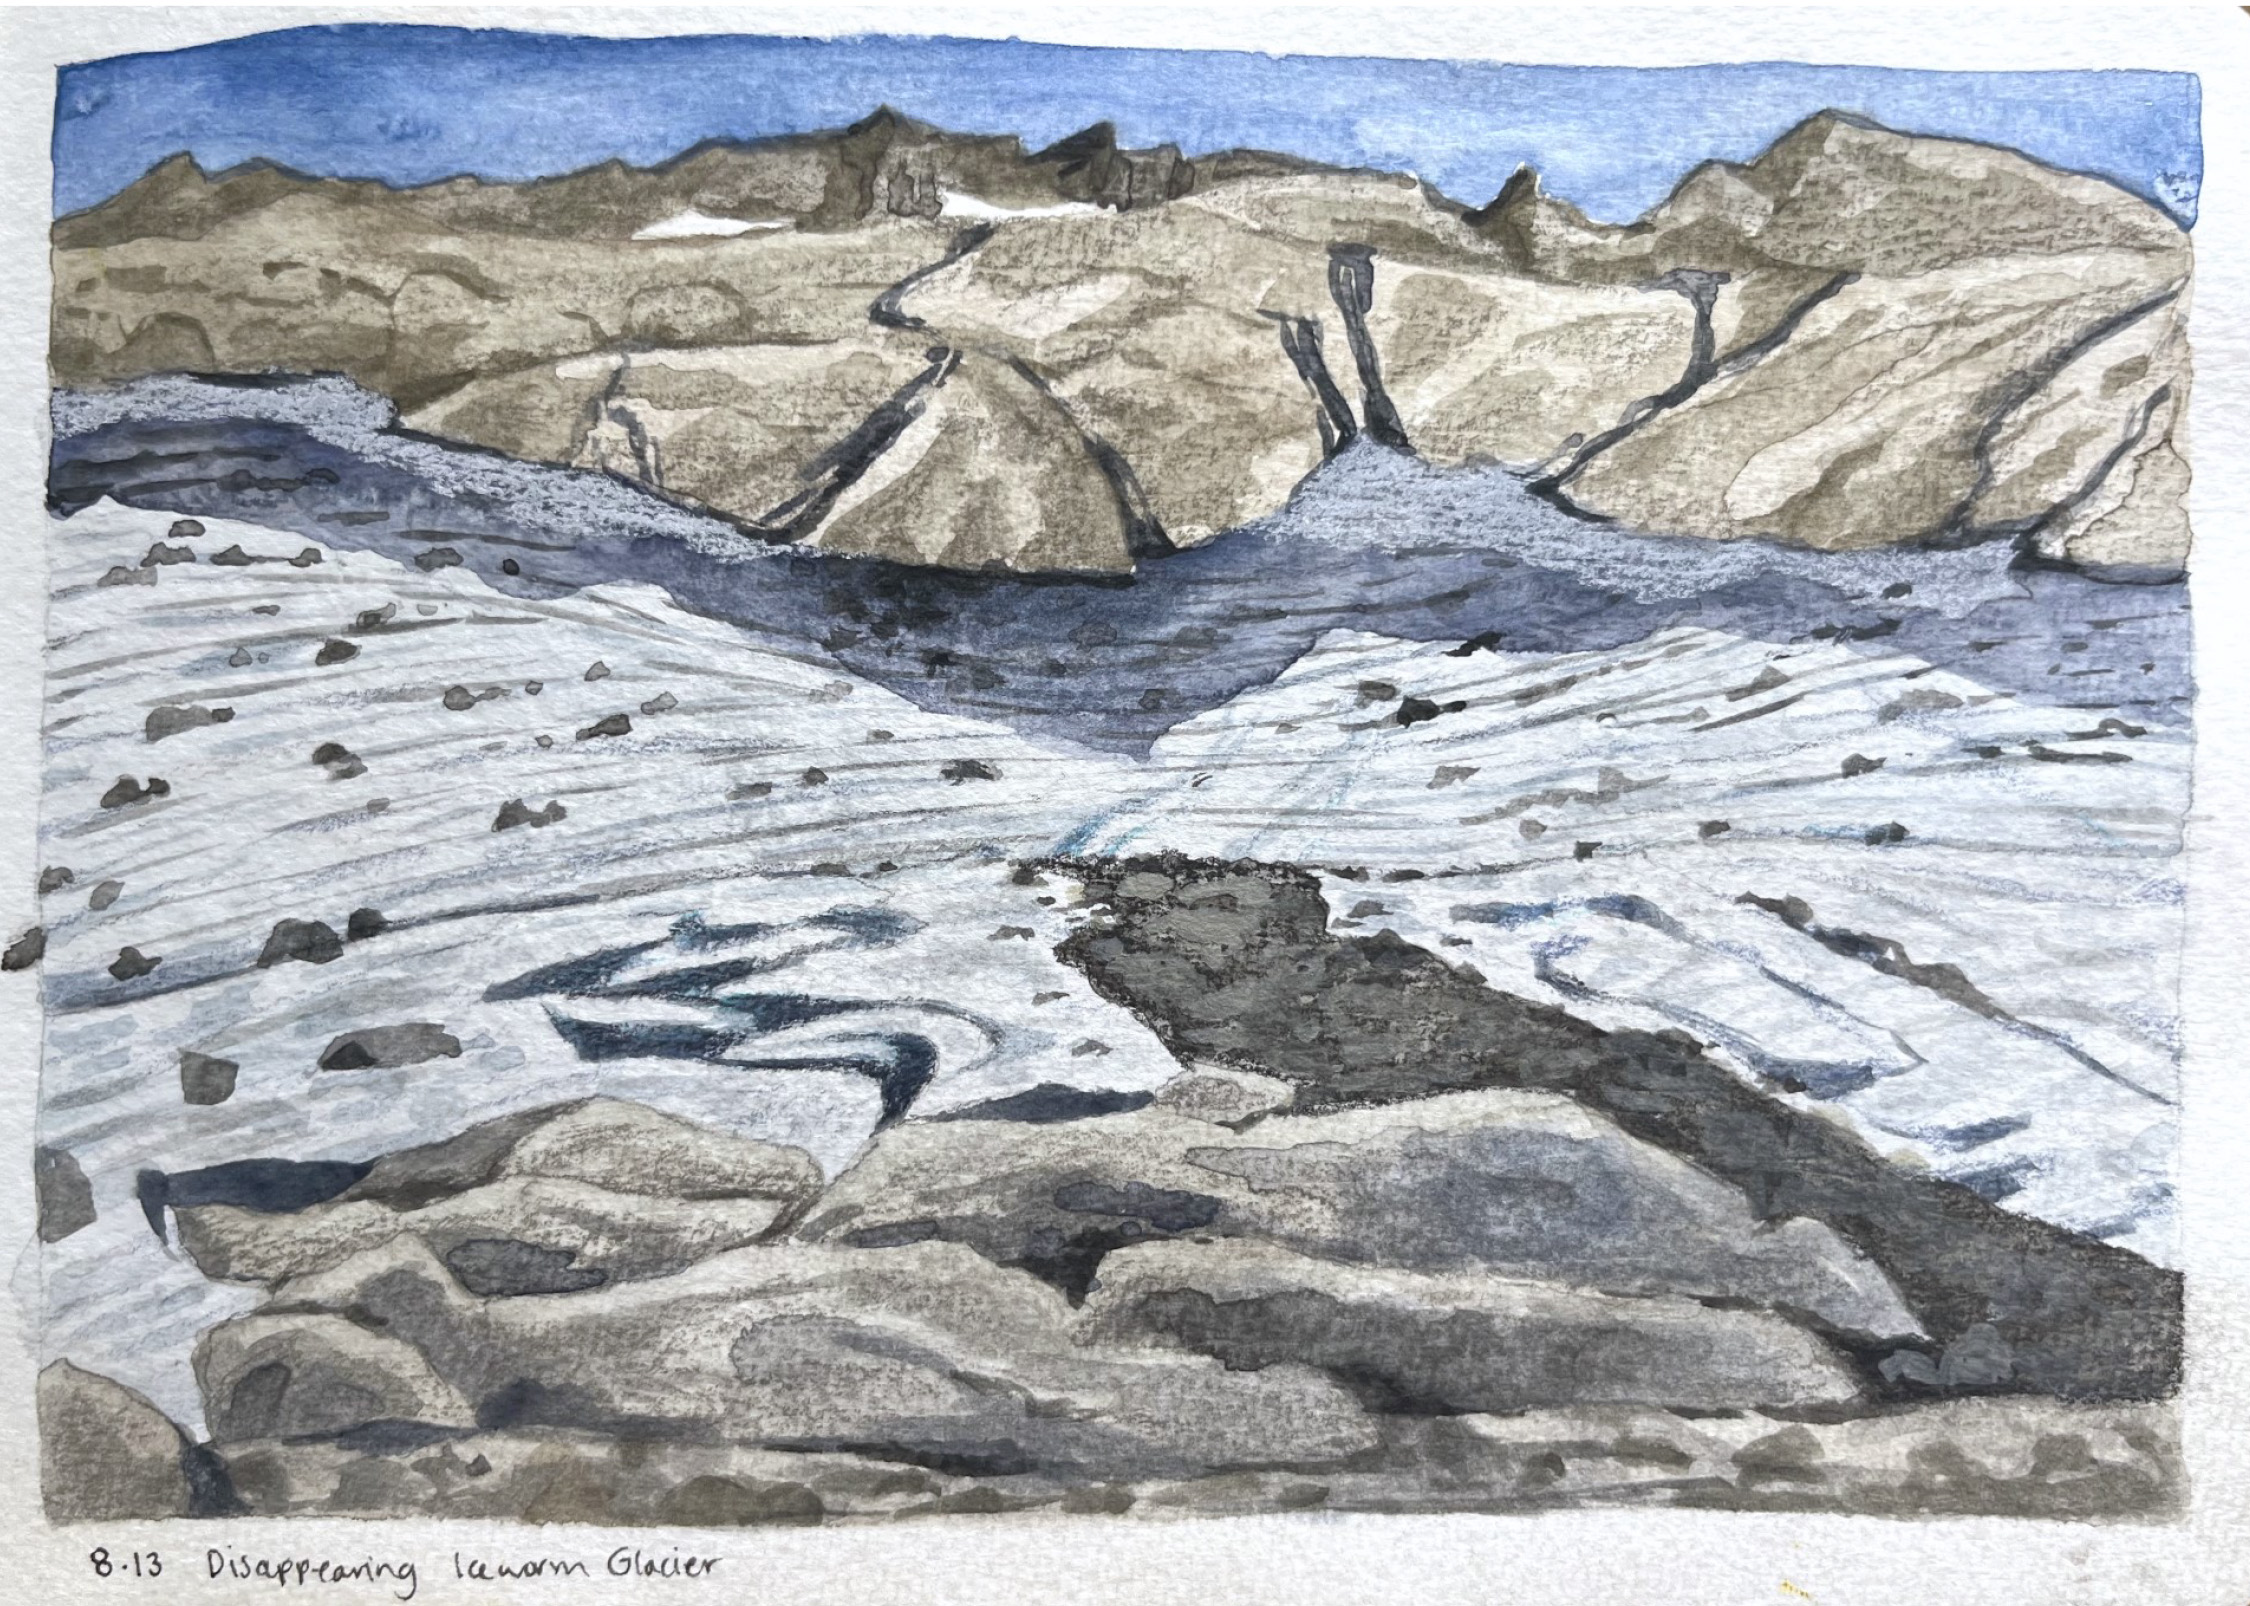
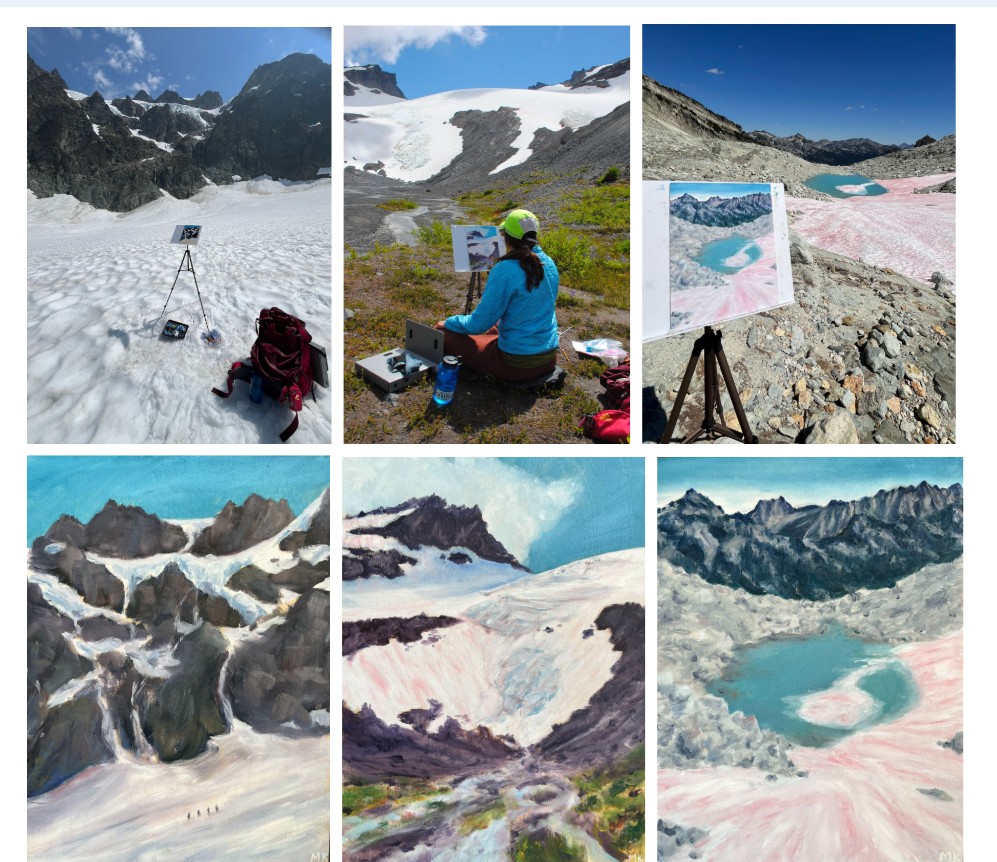
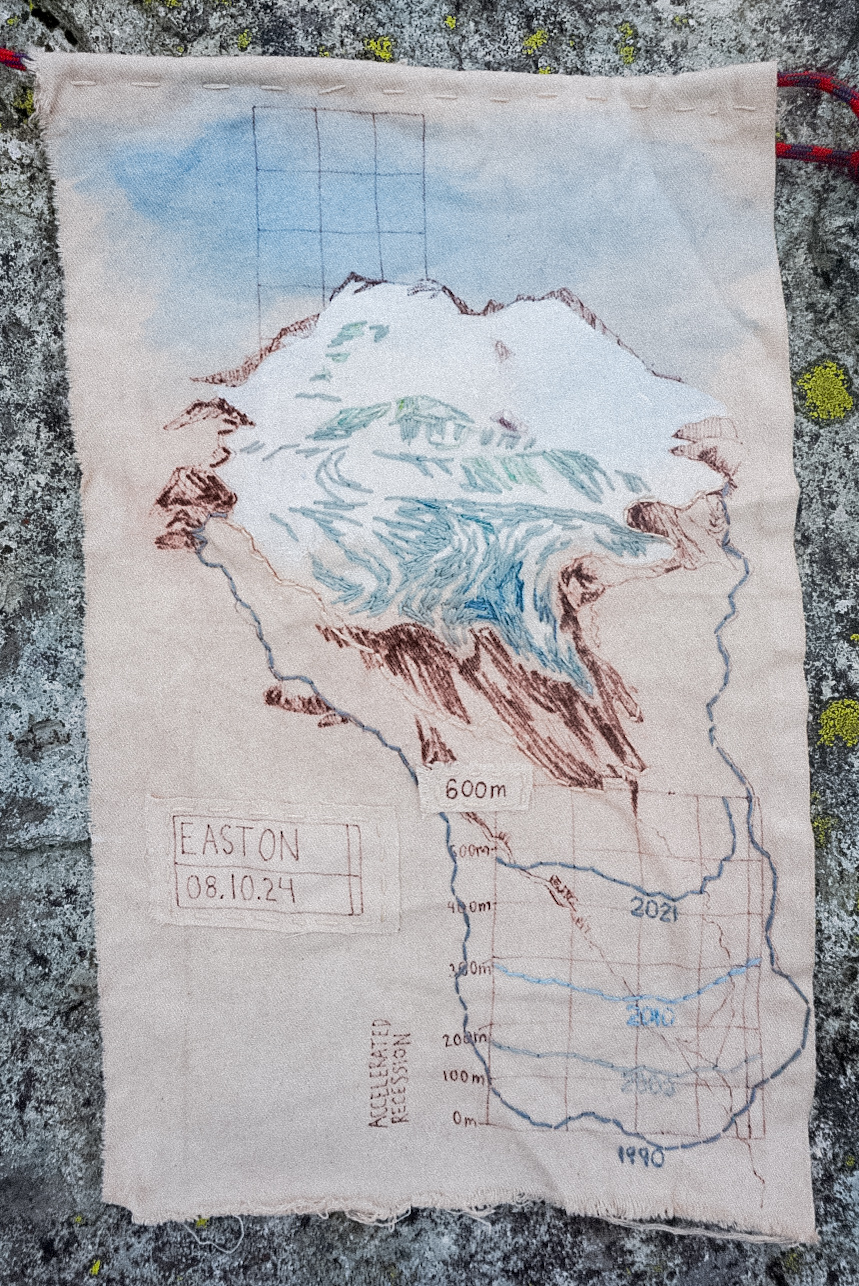
Jill Pelto Sketches the demise of Ice Worm Glacier August 13, 2023.

In 1984, as the North Cascade Glacier Climate Project began, the largest concentration of glaciers between Mount Rainier and Glacier Peak was on Mount Daniel-Hinman; Daniels, Foss, Hinman, Ice Worm and Lynch Glacier. Hence, I felt these glaciers were worth monitoring. Now in August 2023, we just finished our 40th annual survey of these glaciers and they have had their worst year yet in terms of mass loss. Each year we ascend the Cathedral Rock trail, hike passed Peggy’s Pond and set up camp to observe the glaciers. The rapid mass loss builds on the last two year leading to dramatic thinning and area loss. Ice Worm Glacier and Hinman Glacier are no longer glaciers. Pelto (2010) developed a forecast model that identified a glacier that retreats and thins not just at the terminus but even on the upper glacier, does not have a consistent accumulation zone and cannot survive. Foss Glacier may not survive the summer. Daniels Glacier is rapidly shrinking. Only Lynch Glacier remains active. This is the story of the glacier’s decline and the impact.

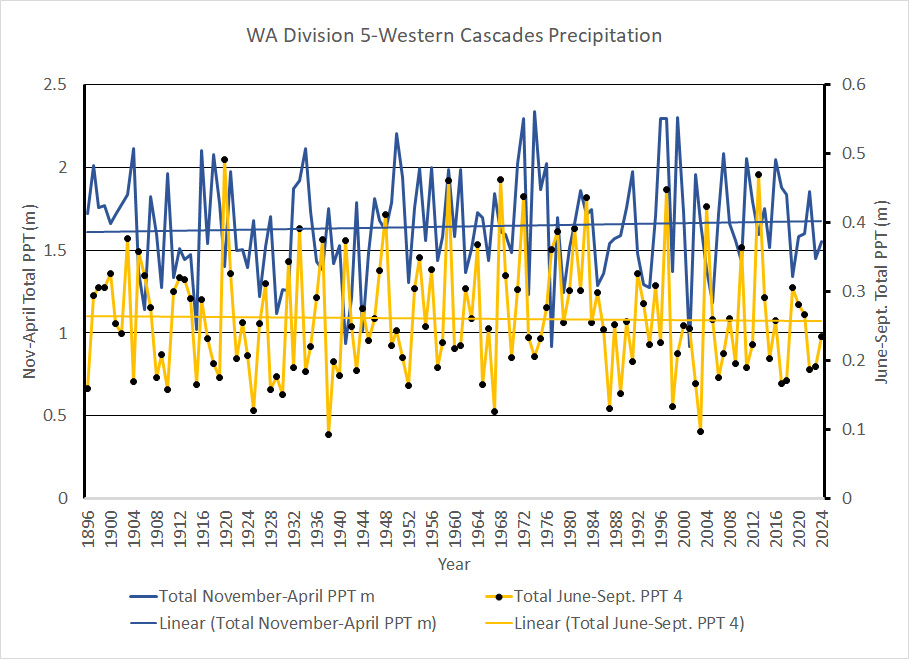
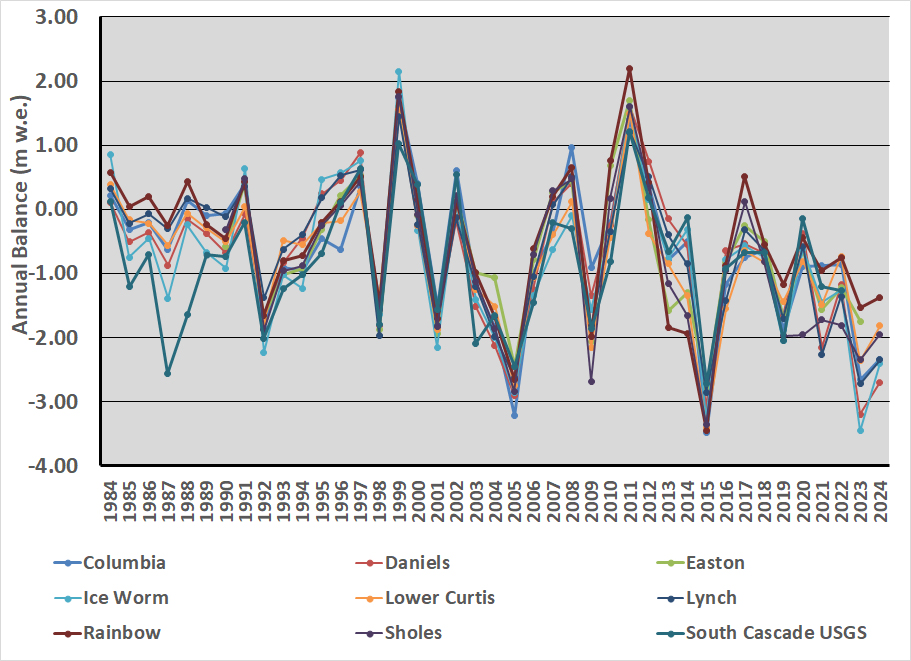
In 1958 these five glaciers had a combined area of 3.8 km². In 1984 the area was 3.2 km², in 2009 the area had declined to 1.5 km², and 0.8 km² in 2023. This is an 80% decline since 1958 and ~a 50% decline since 2009. This area loss is driven by mass balance losses. We measure the mass balance annually on Daniels, Ice Worm and Lynch Glacier from 1984-2023, and on Foss Glacier 1984-2005.  From 1984-2022 mean annual balance averaged -0.6 m w.e., a cumulative loss of 21.3 m w.e.. The mass balance losses have driven the reduction in glacier area. In recent years, the mass losses have been consistent and greater than the long term mean at –1.20 m w.e. annually.  This summer is not complete but will finish close to -3 m in a single year.

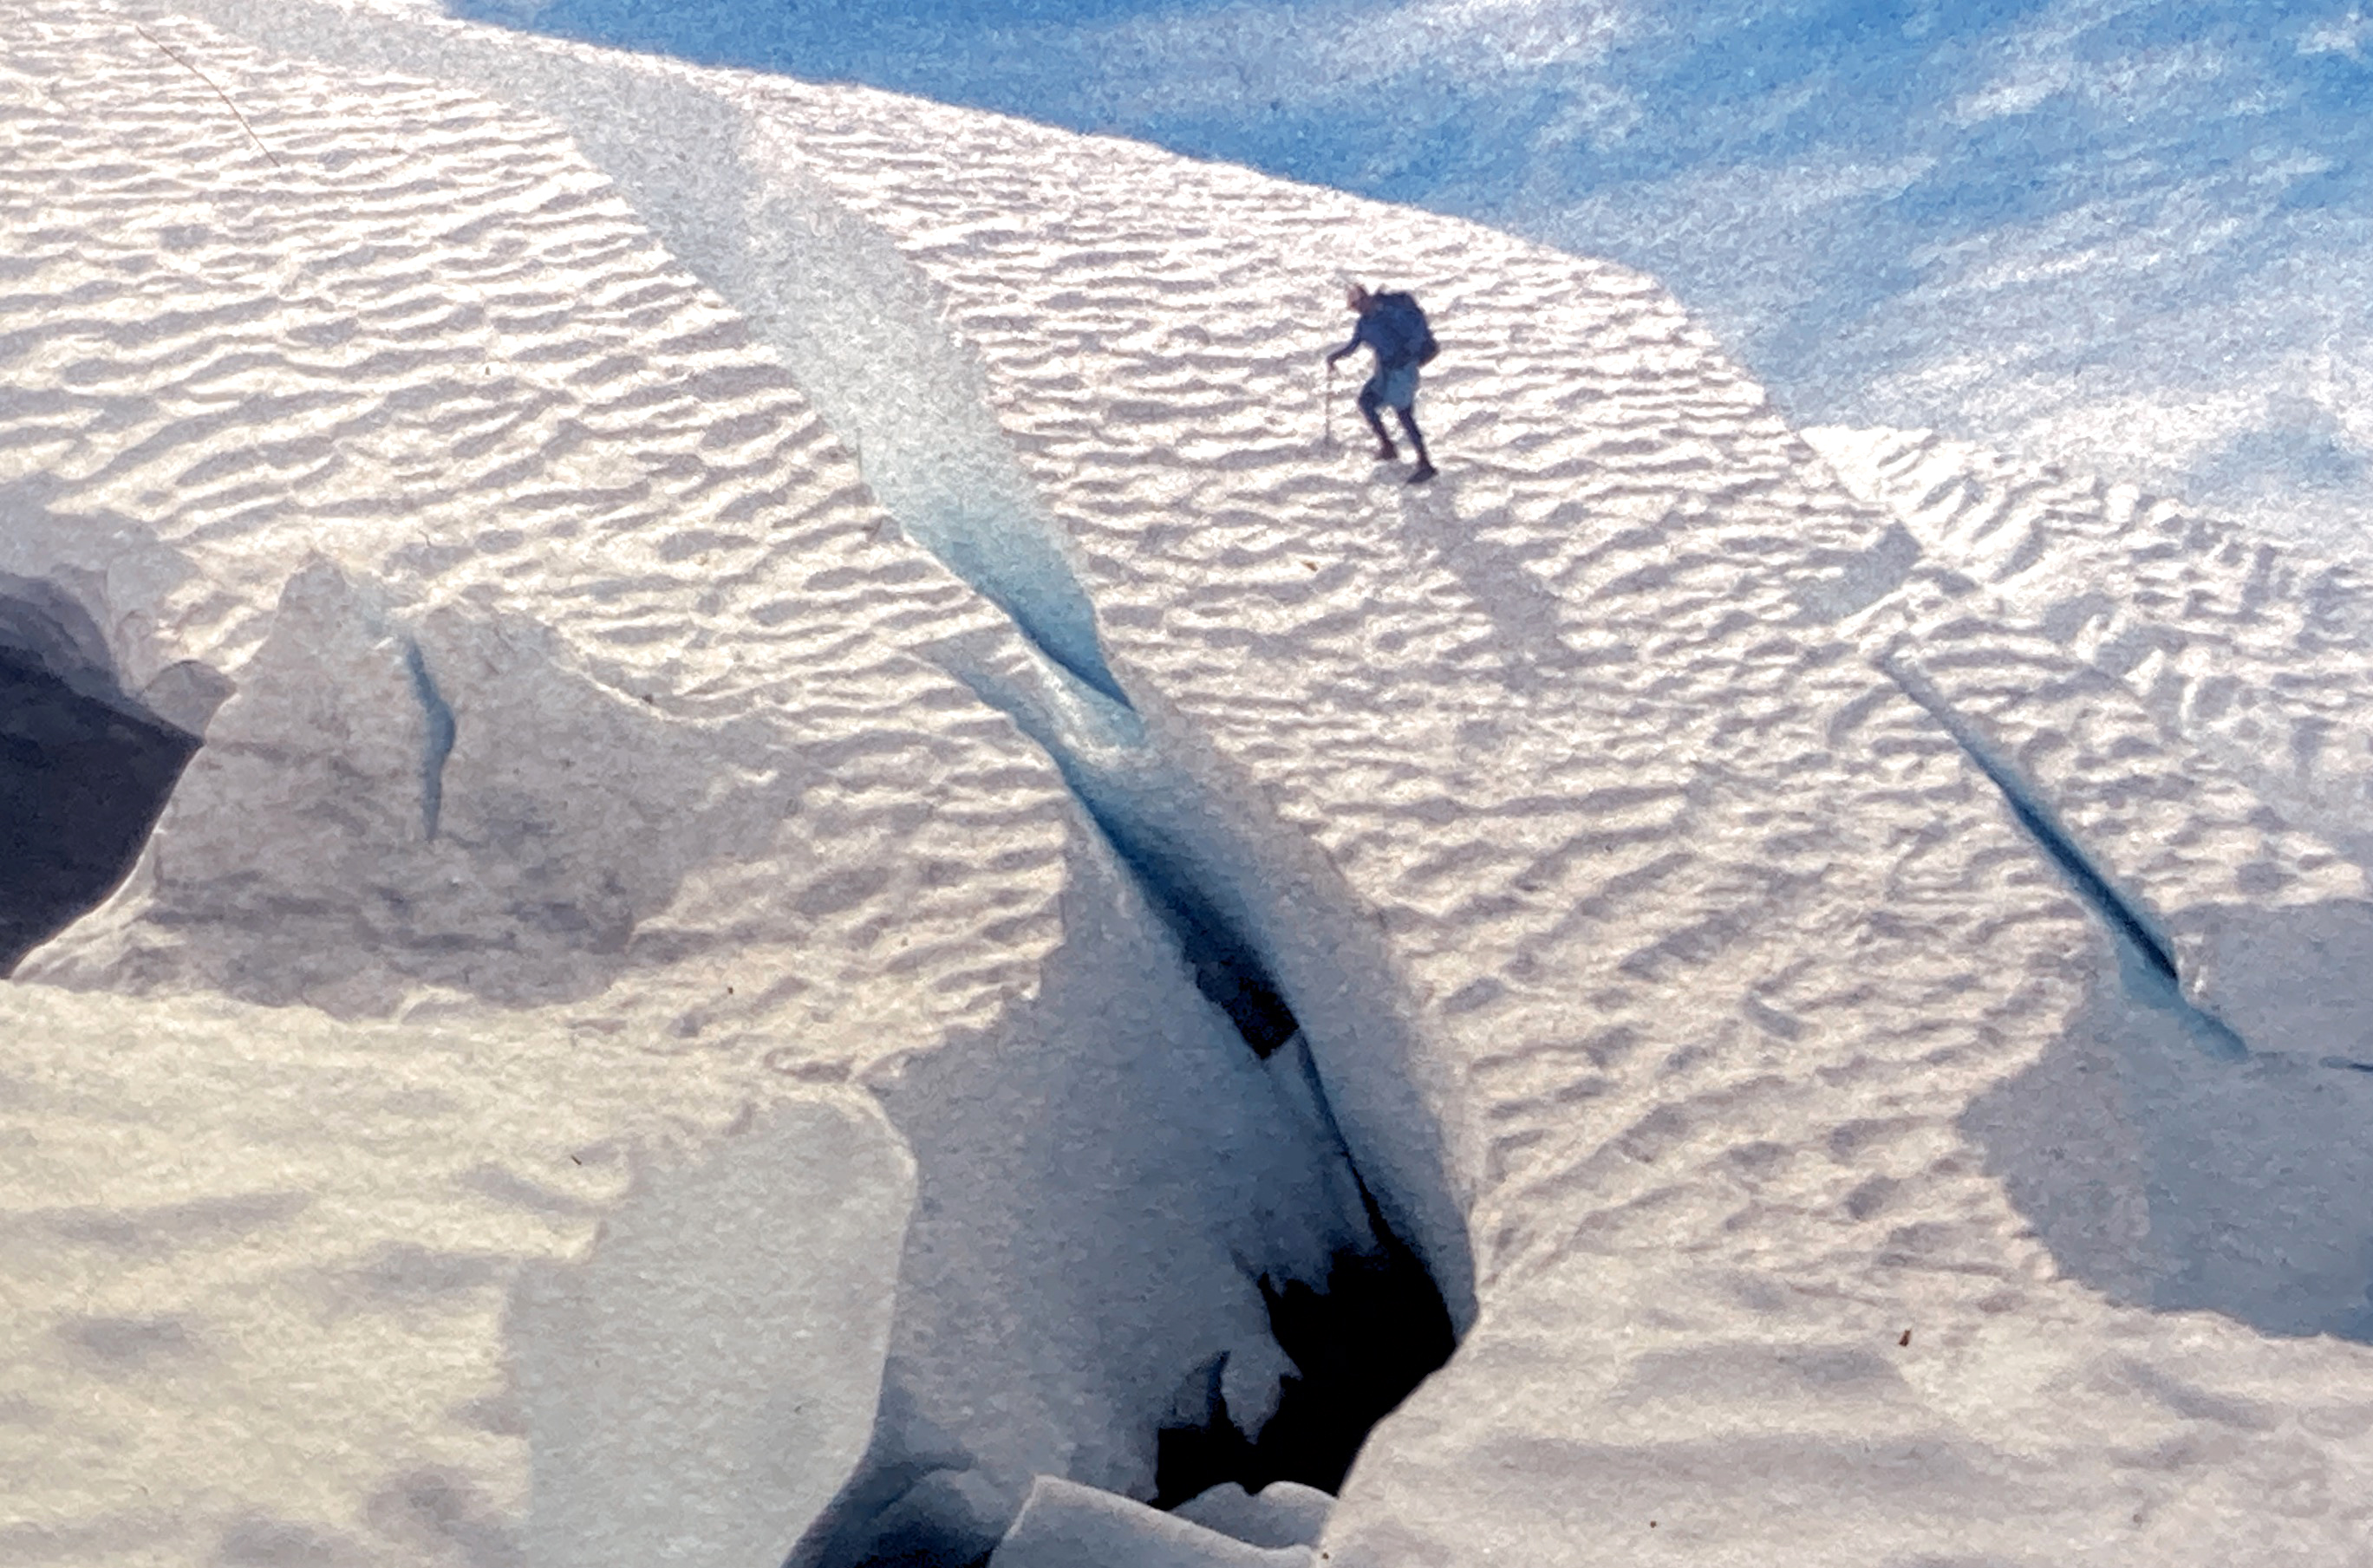
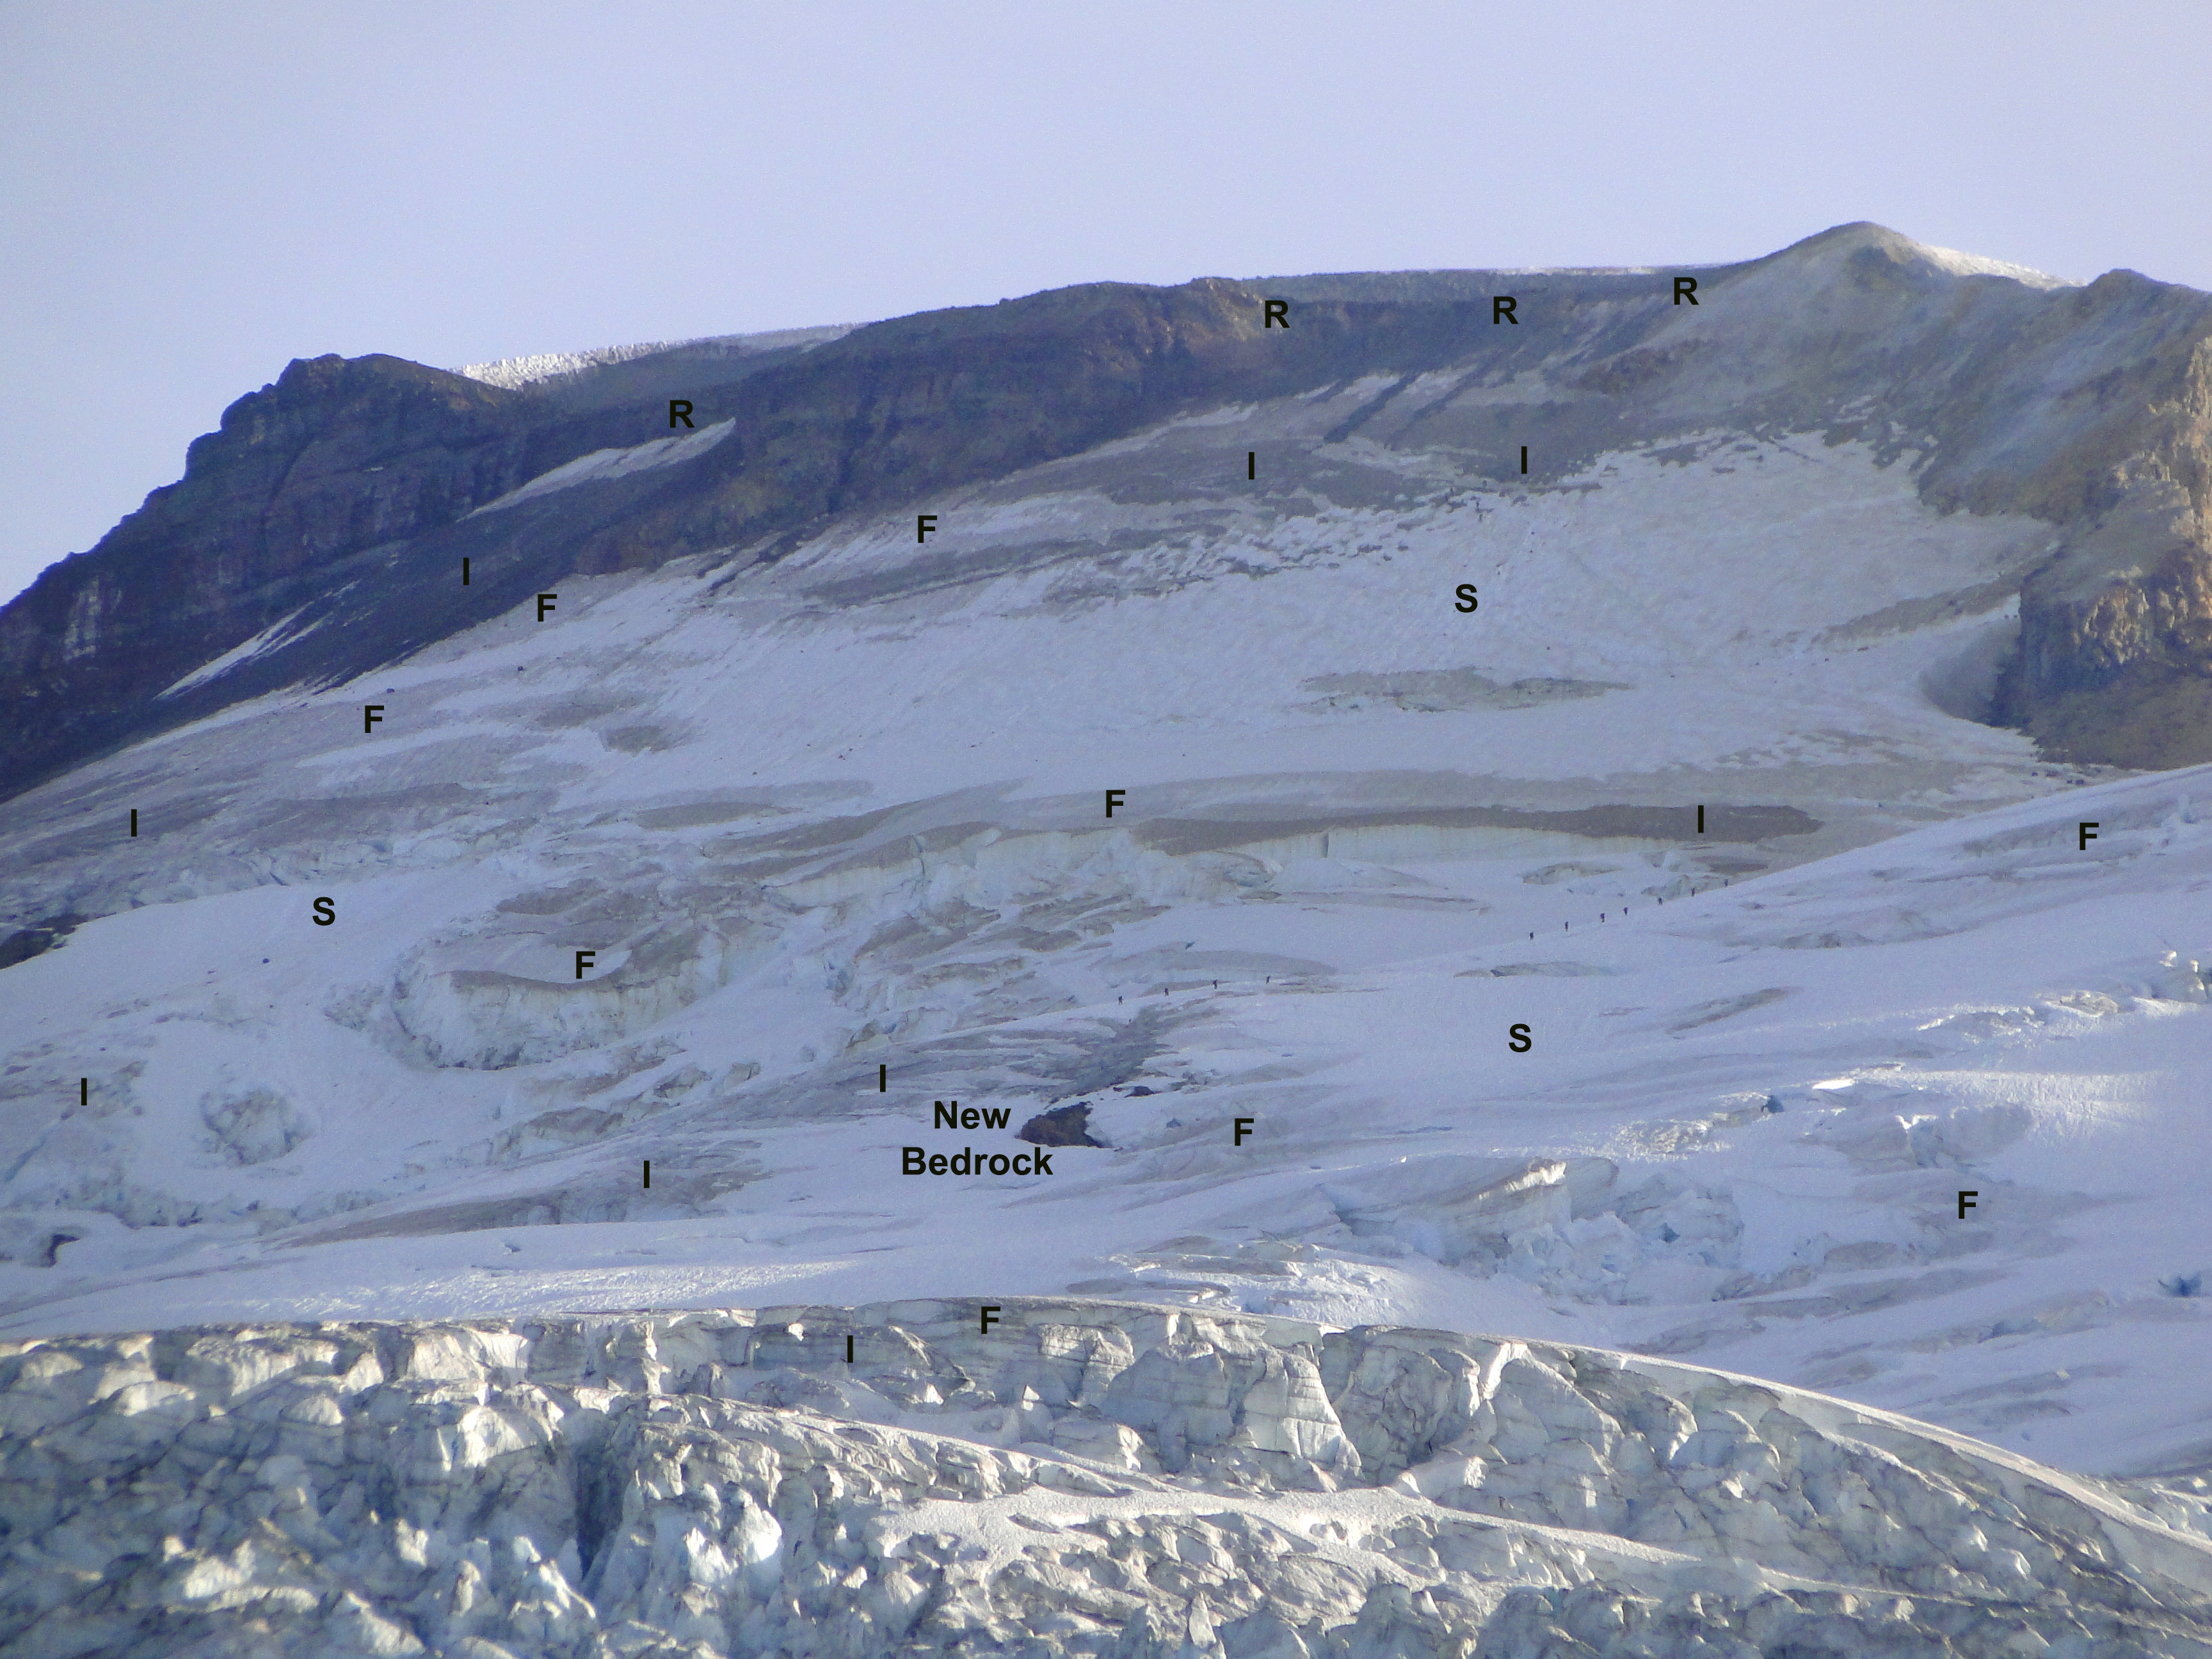
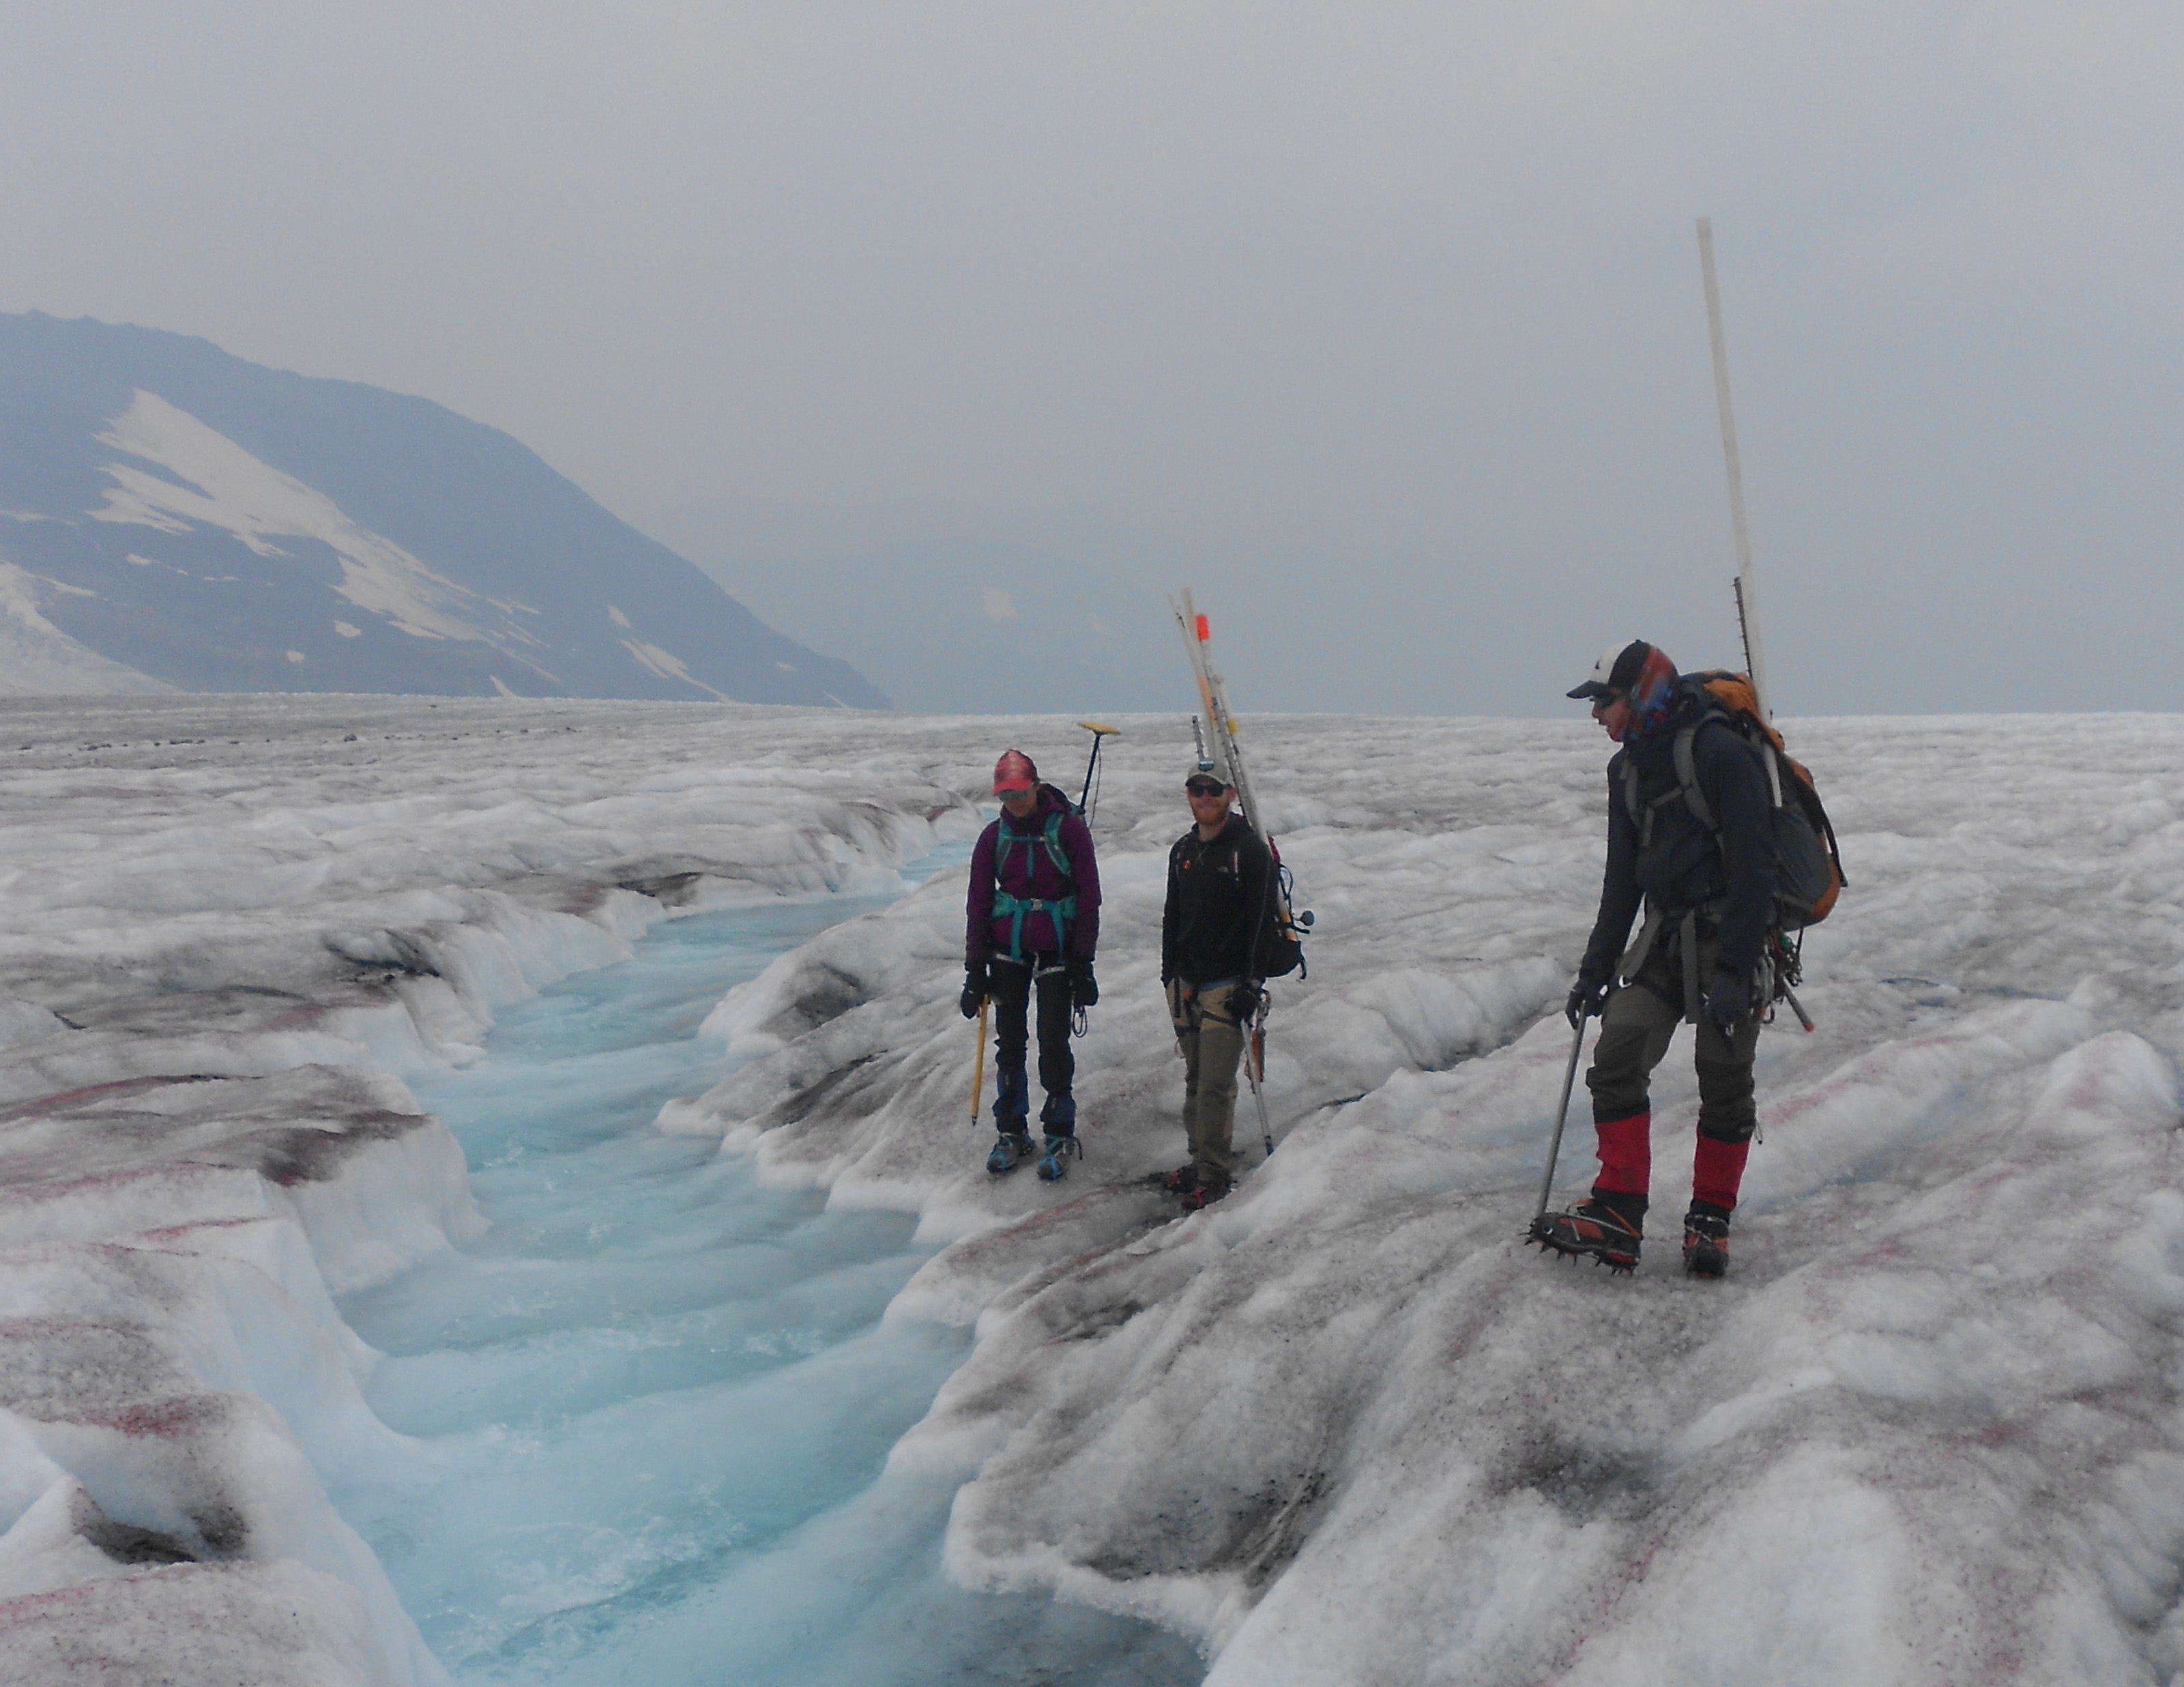
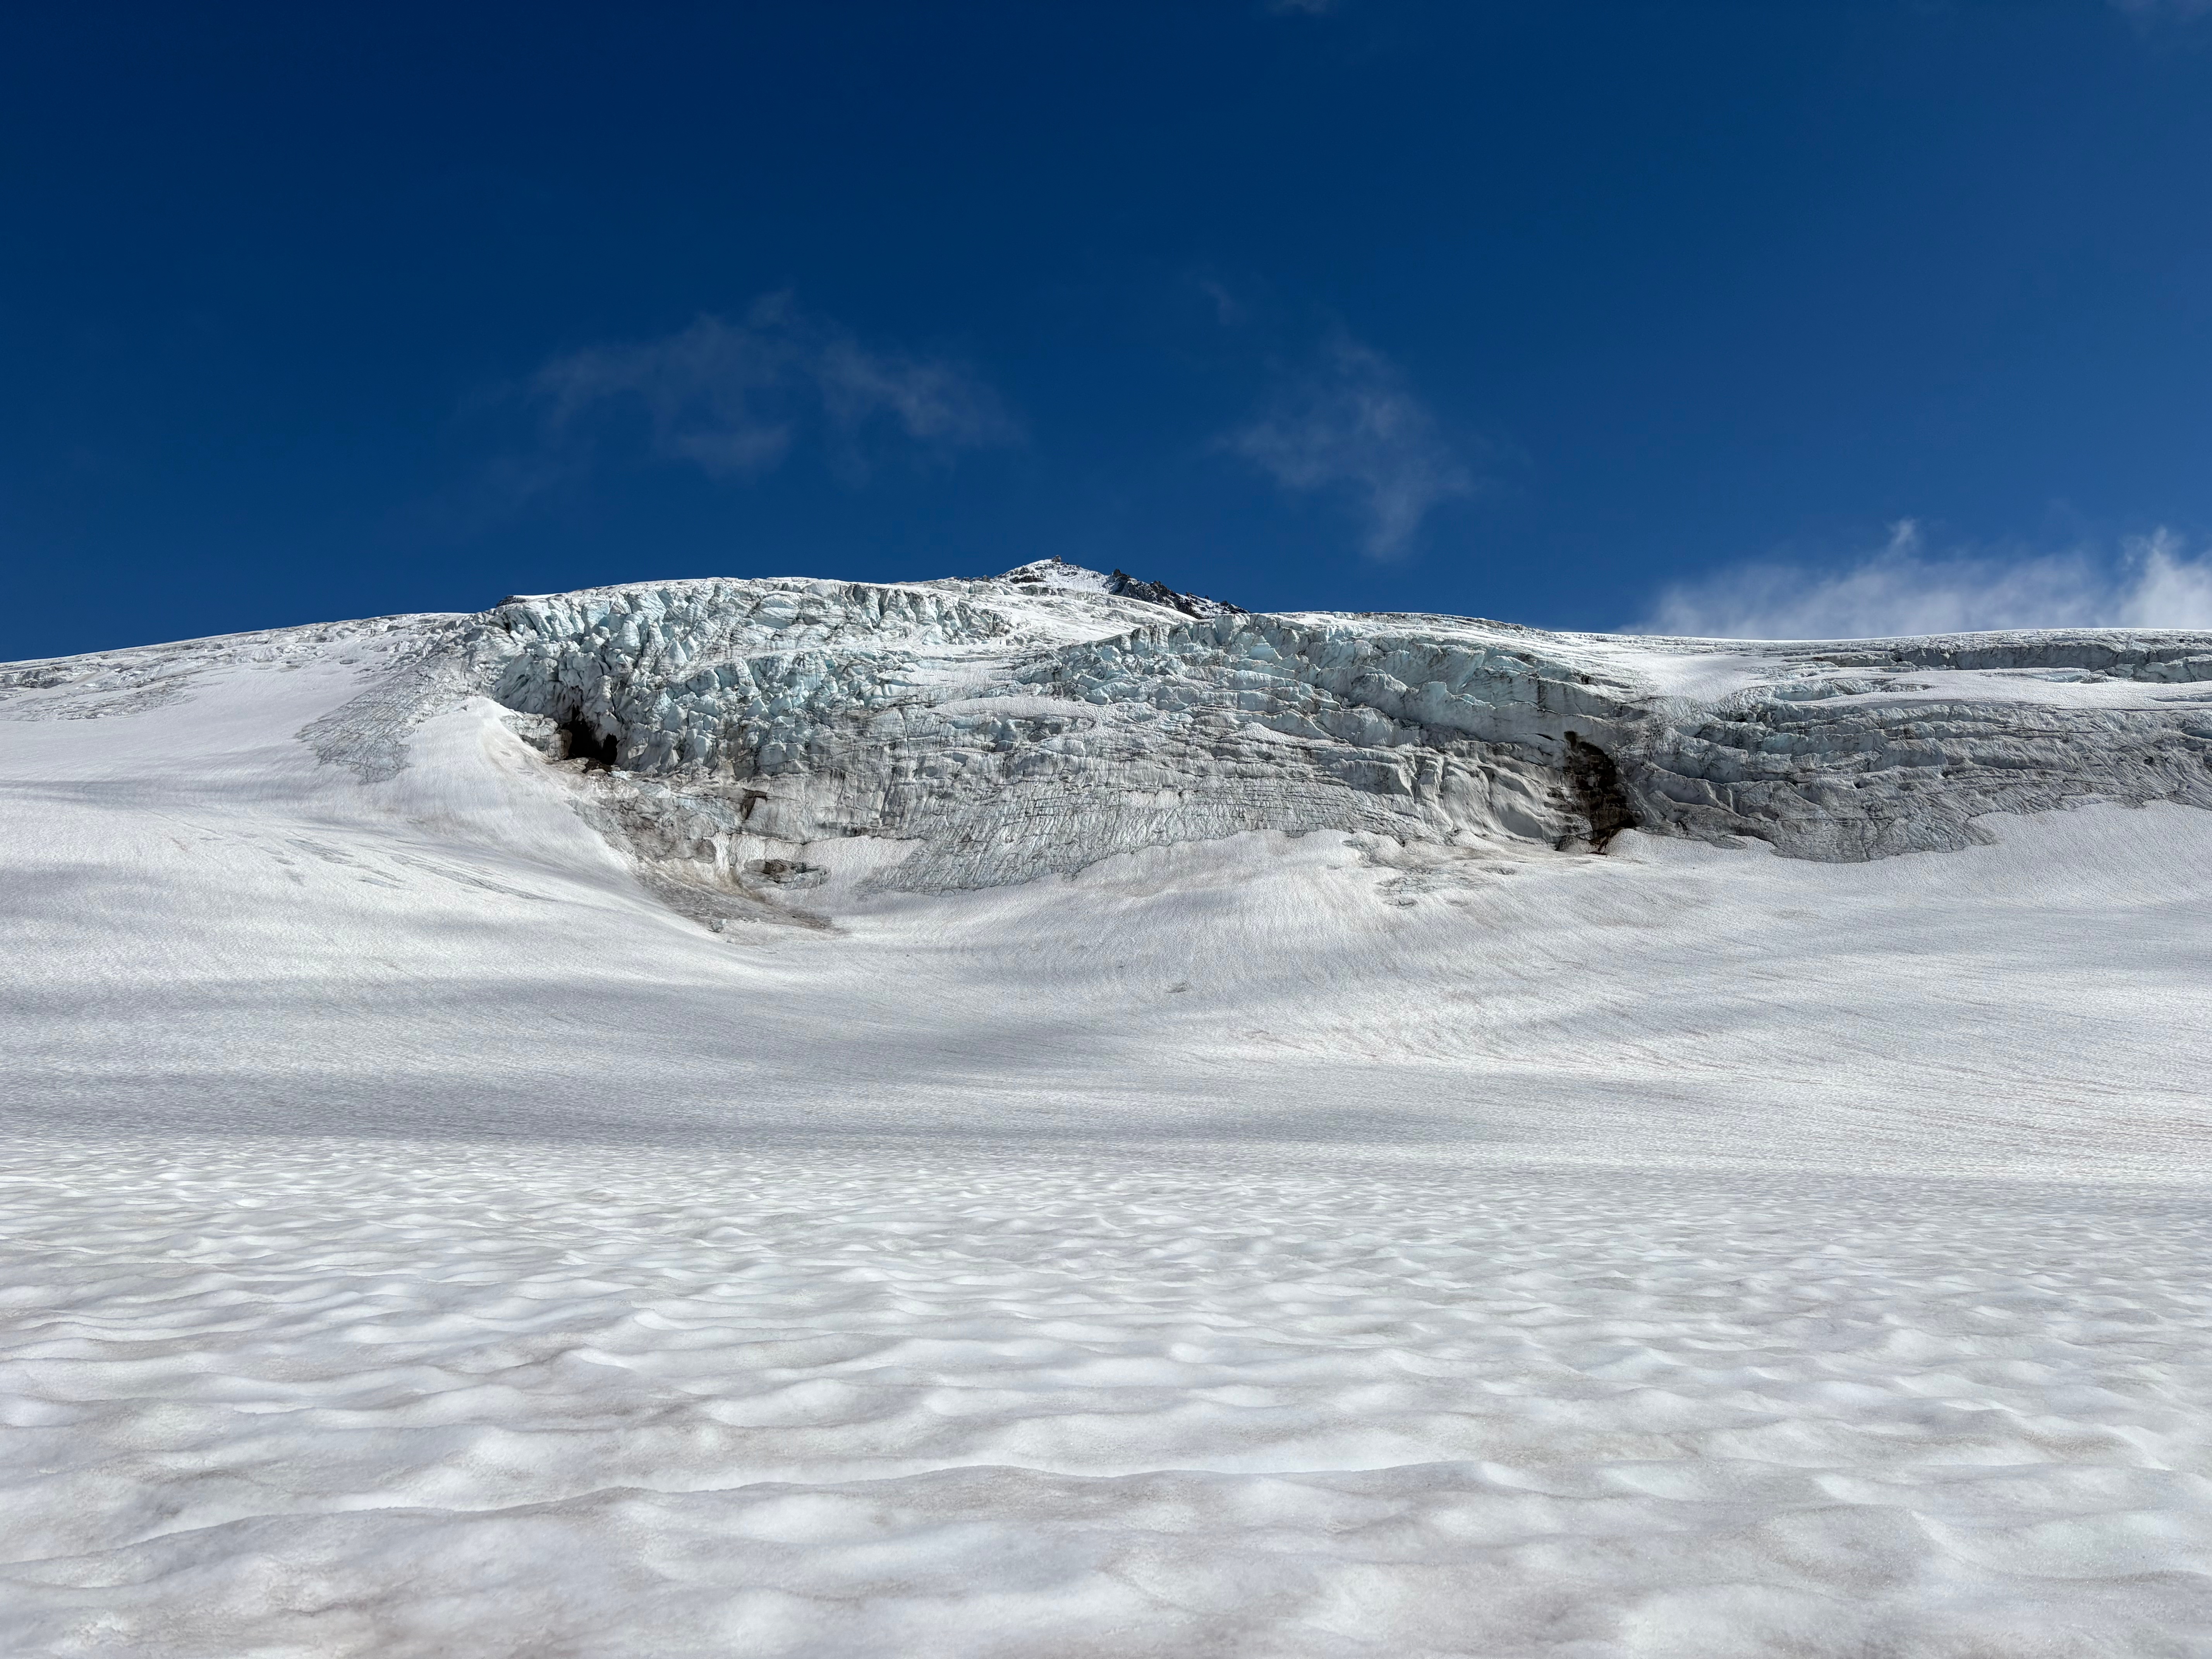
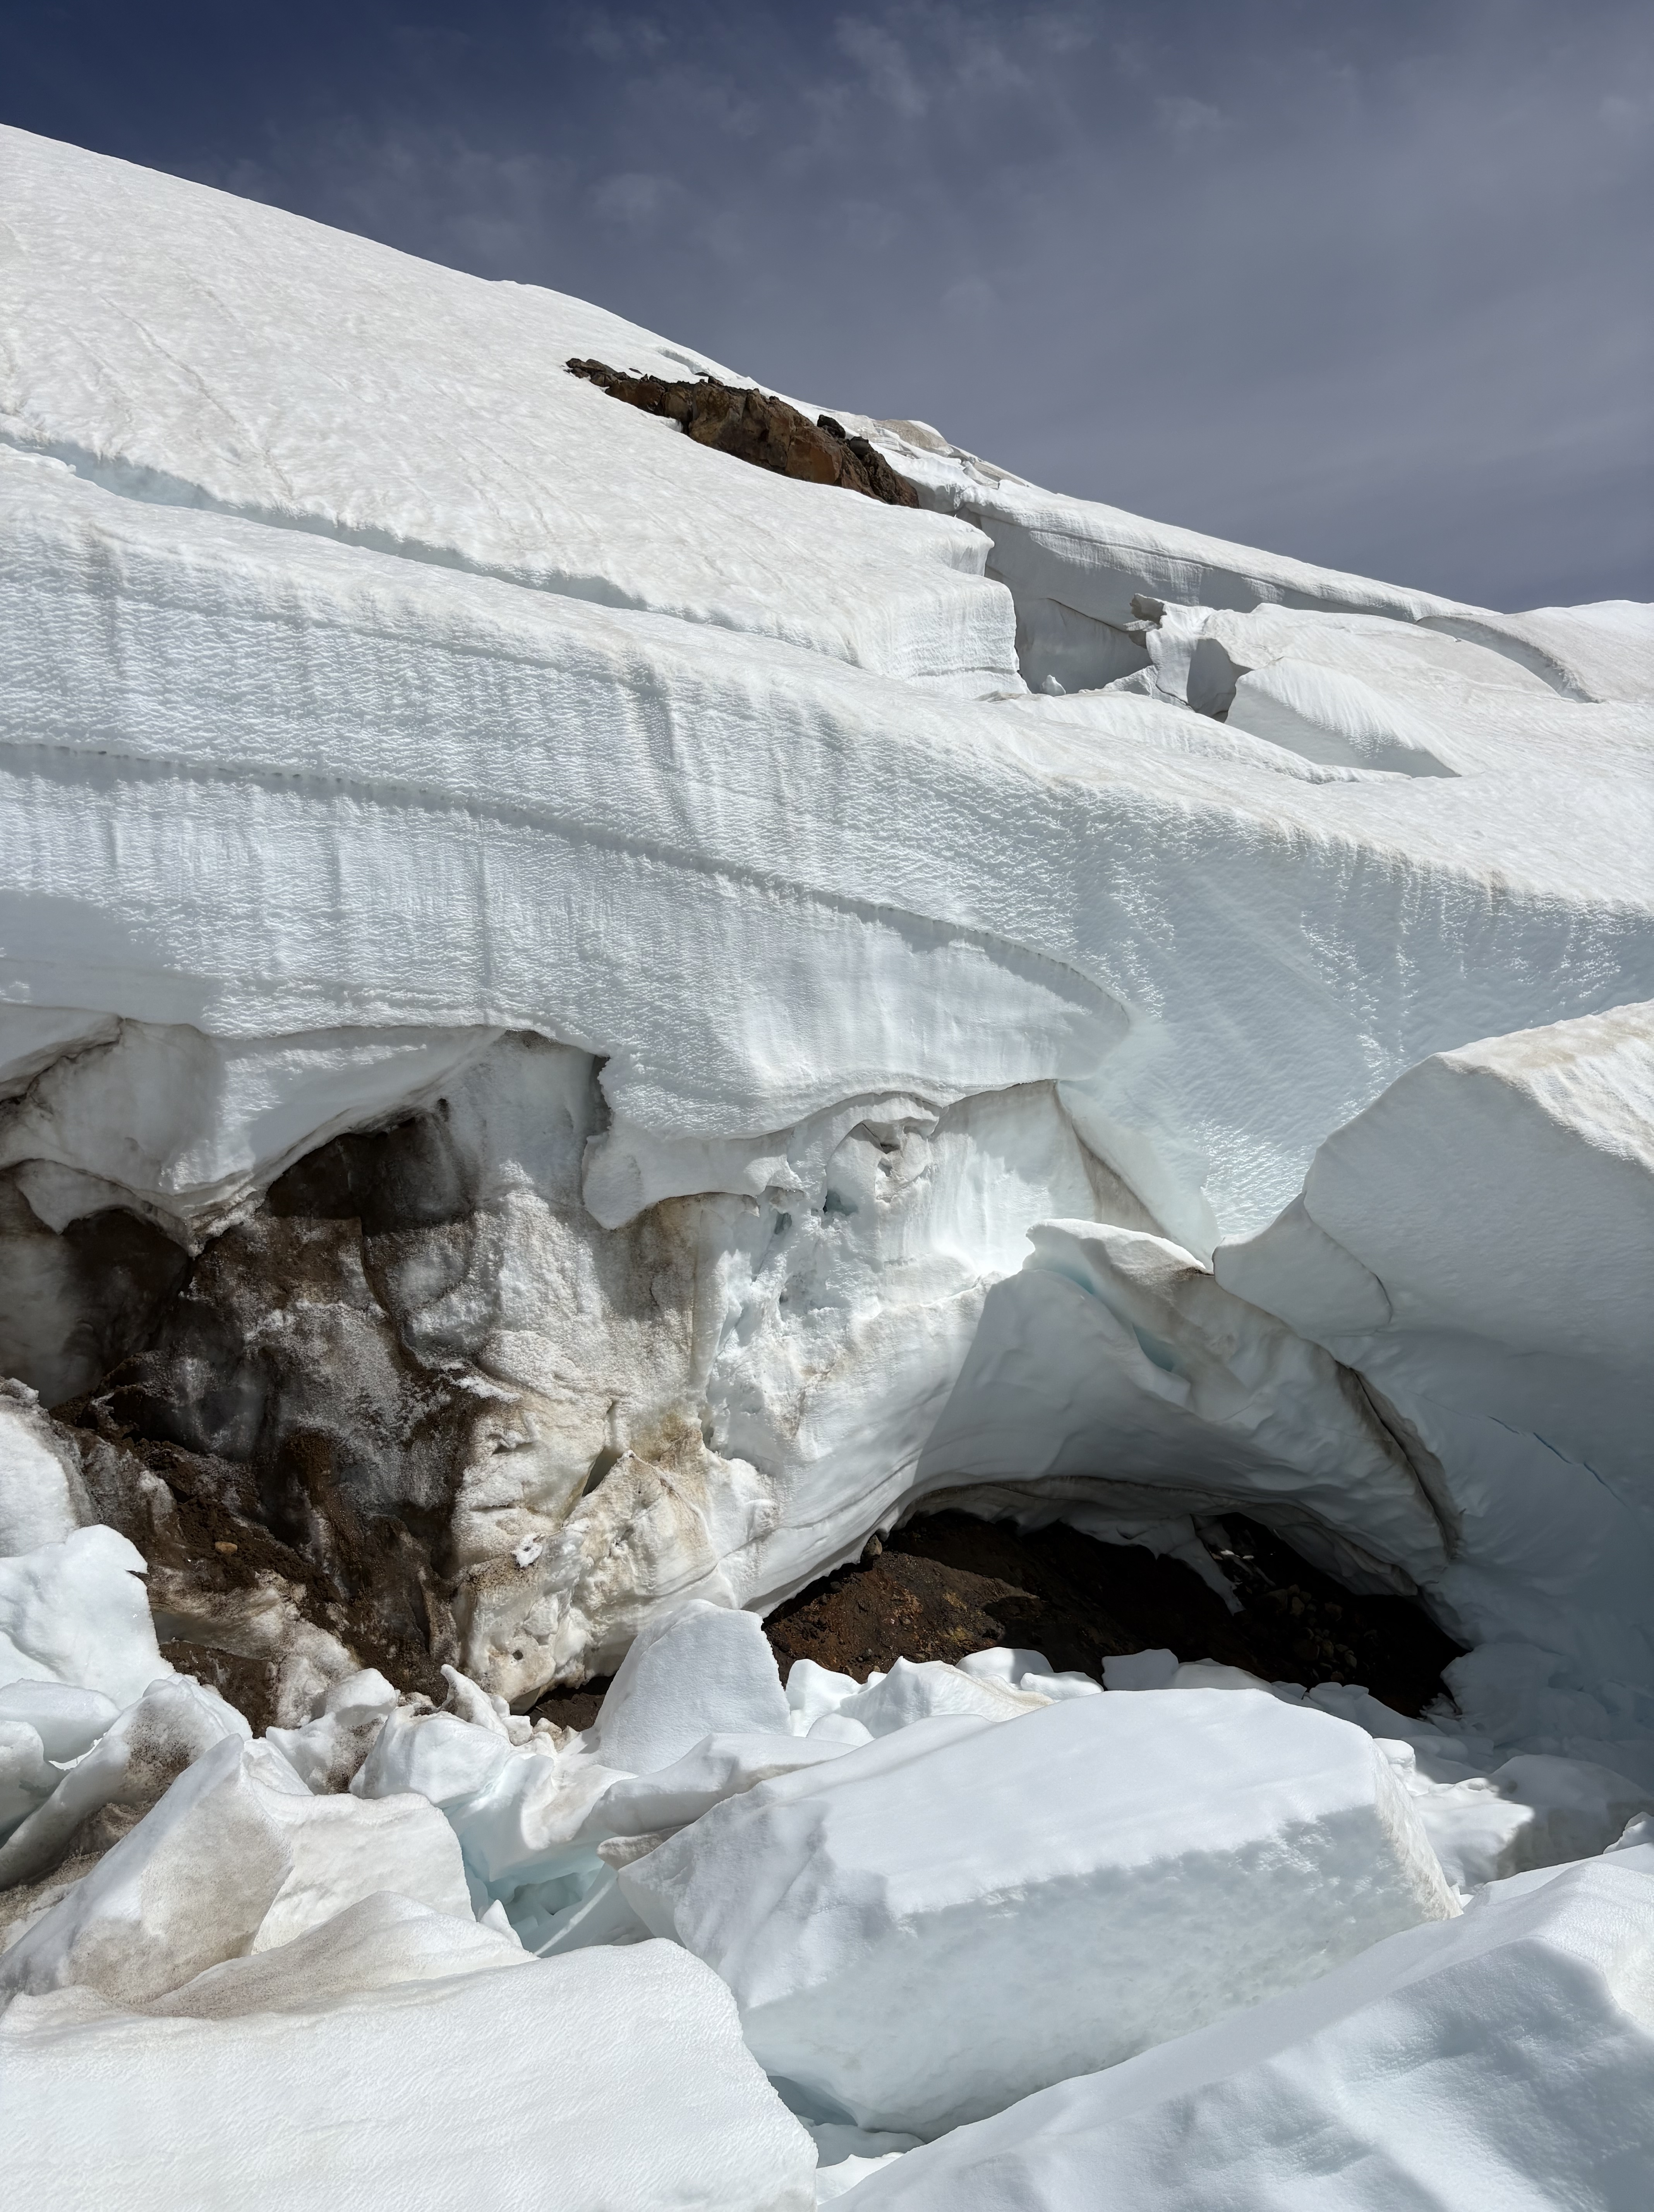
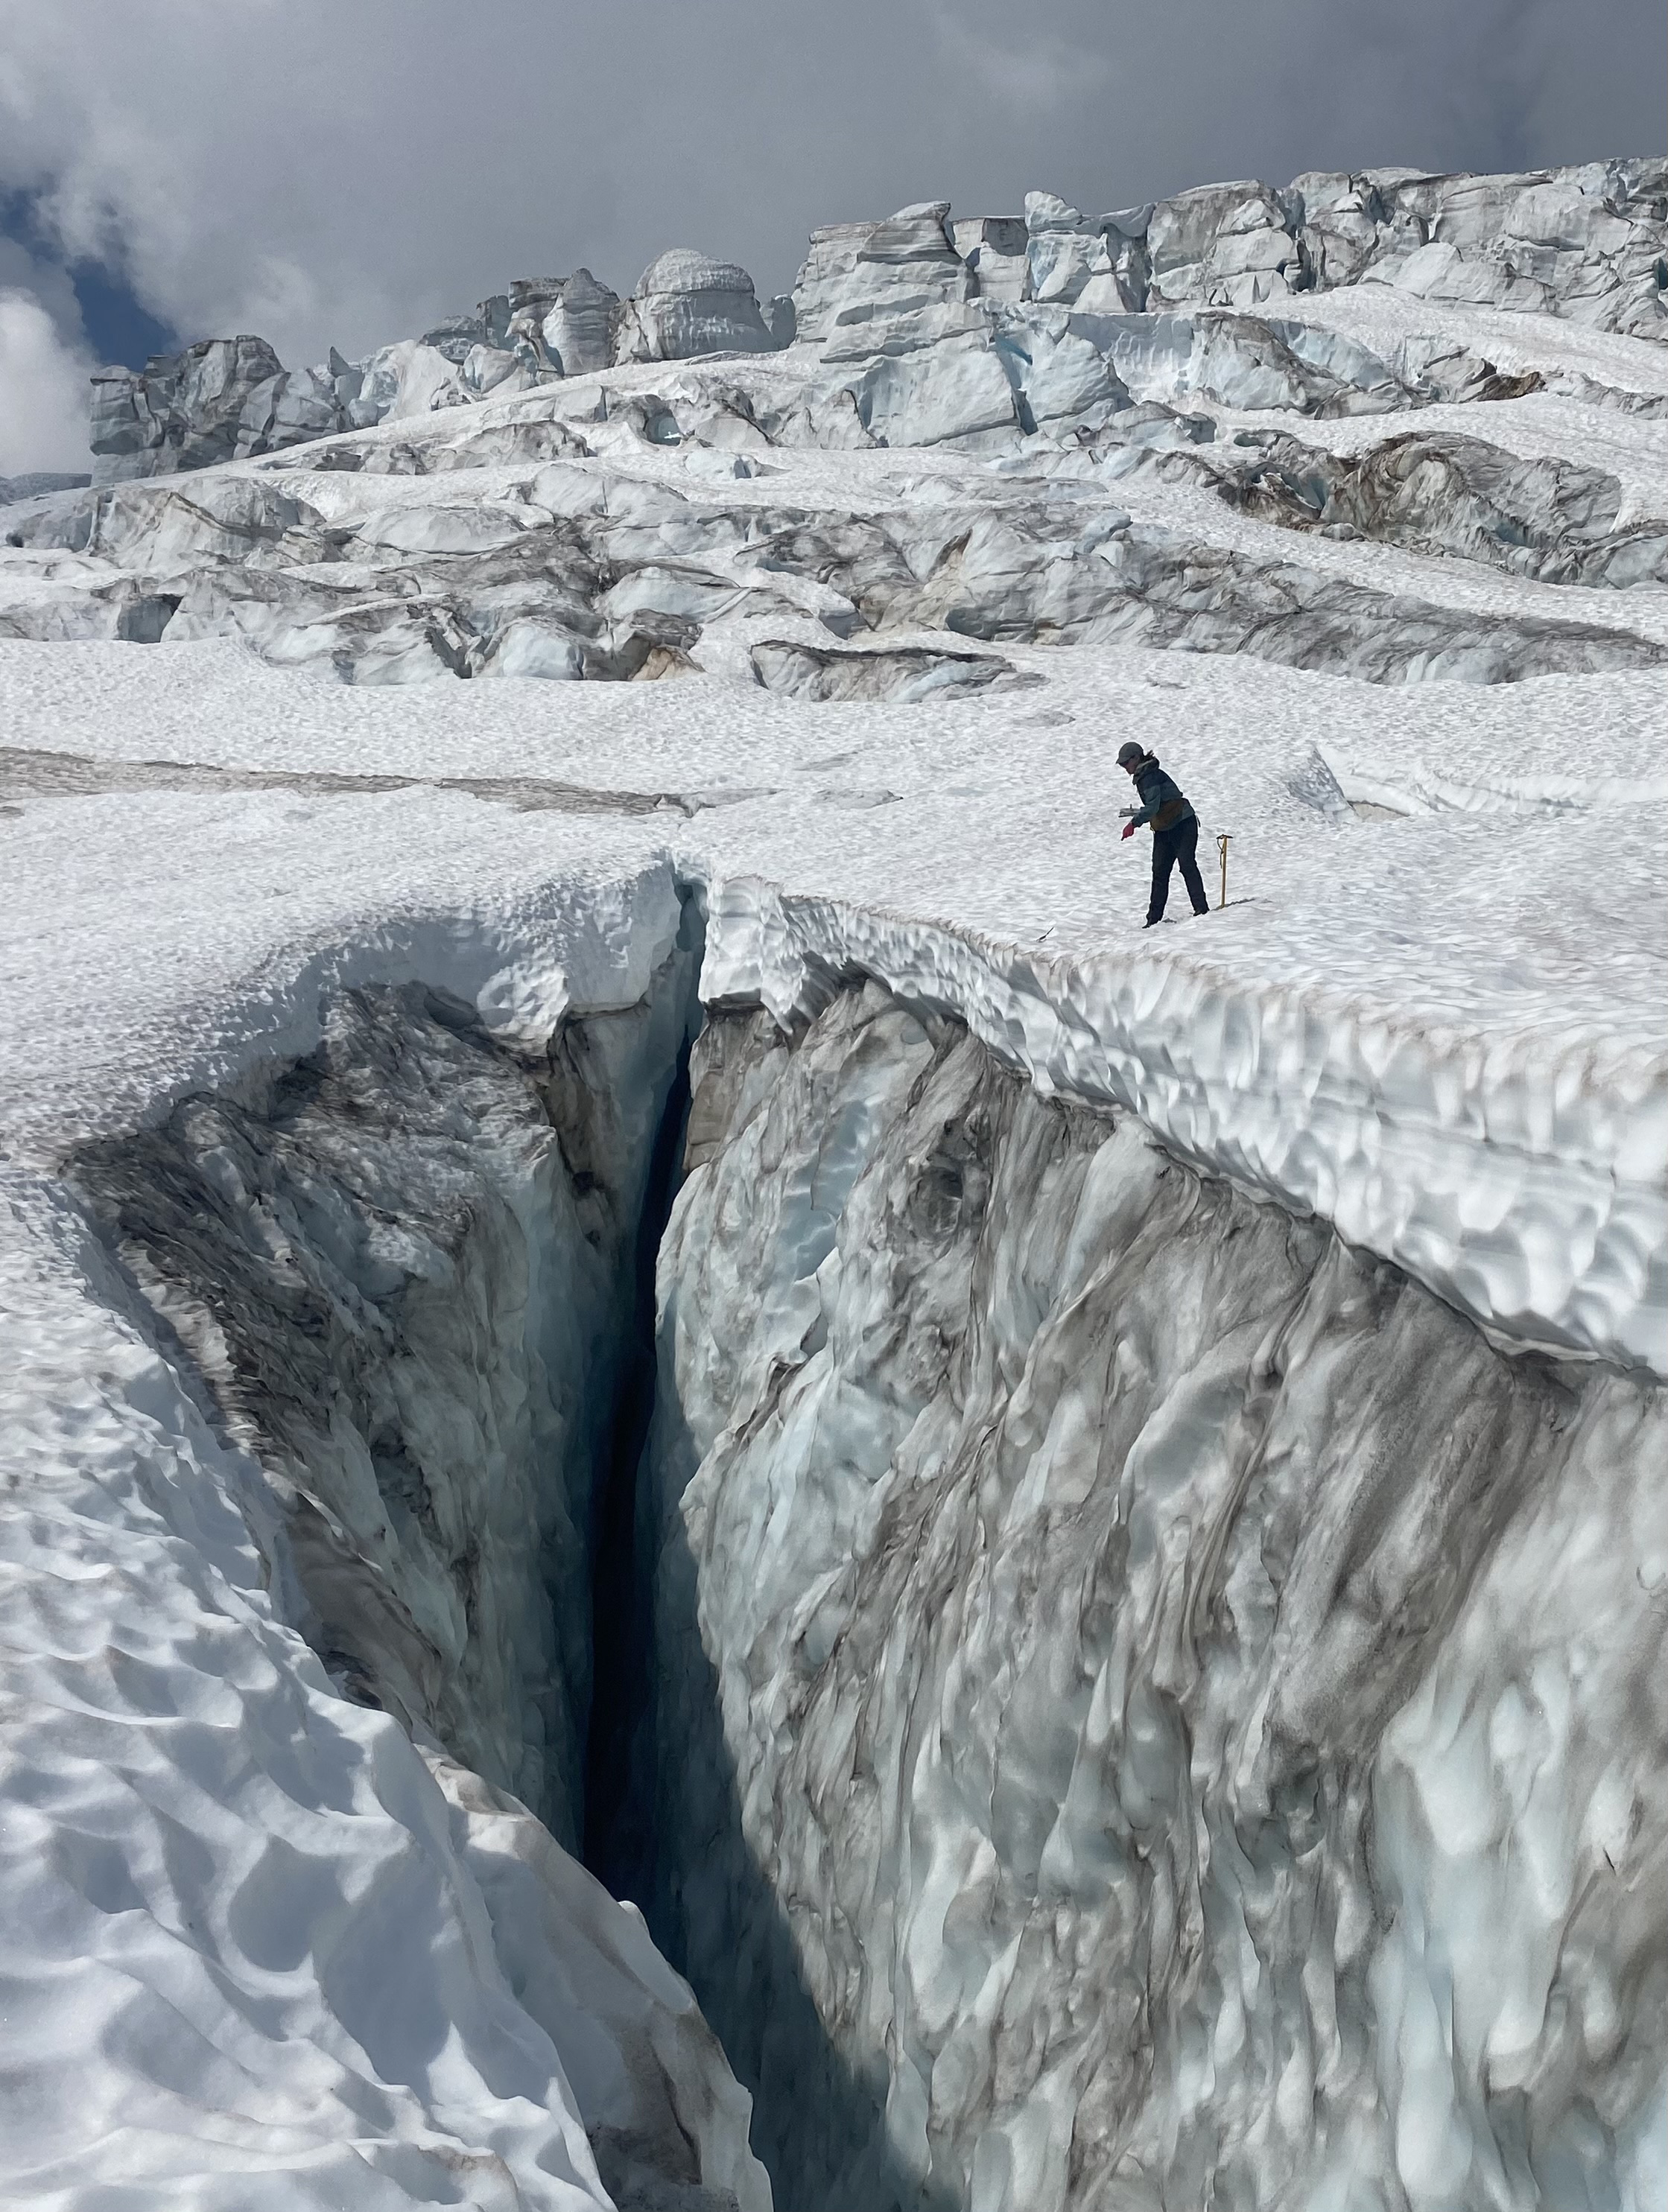
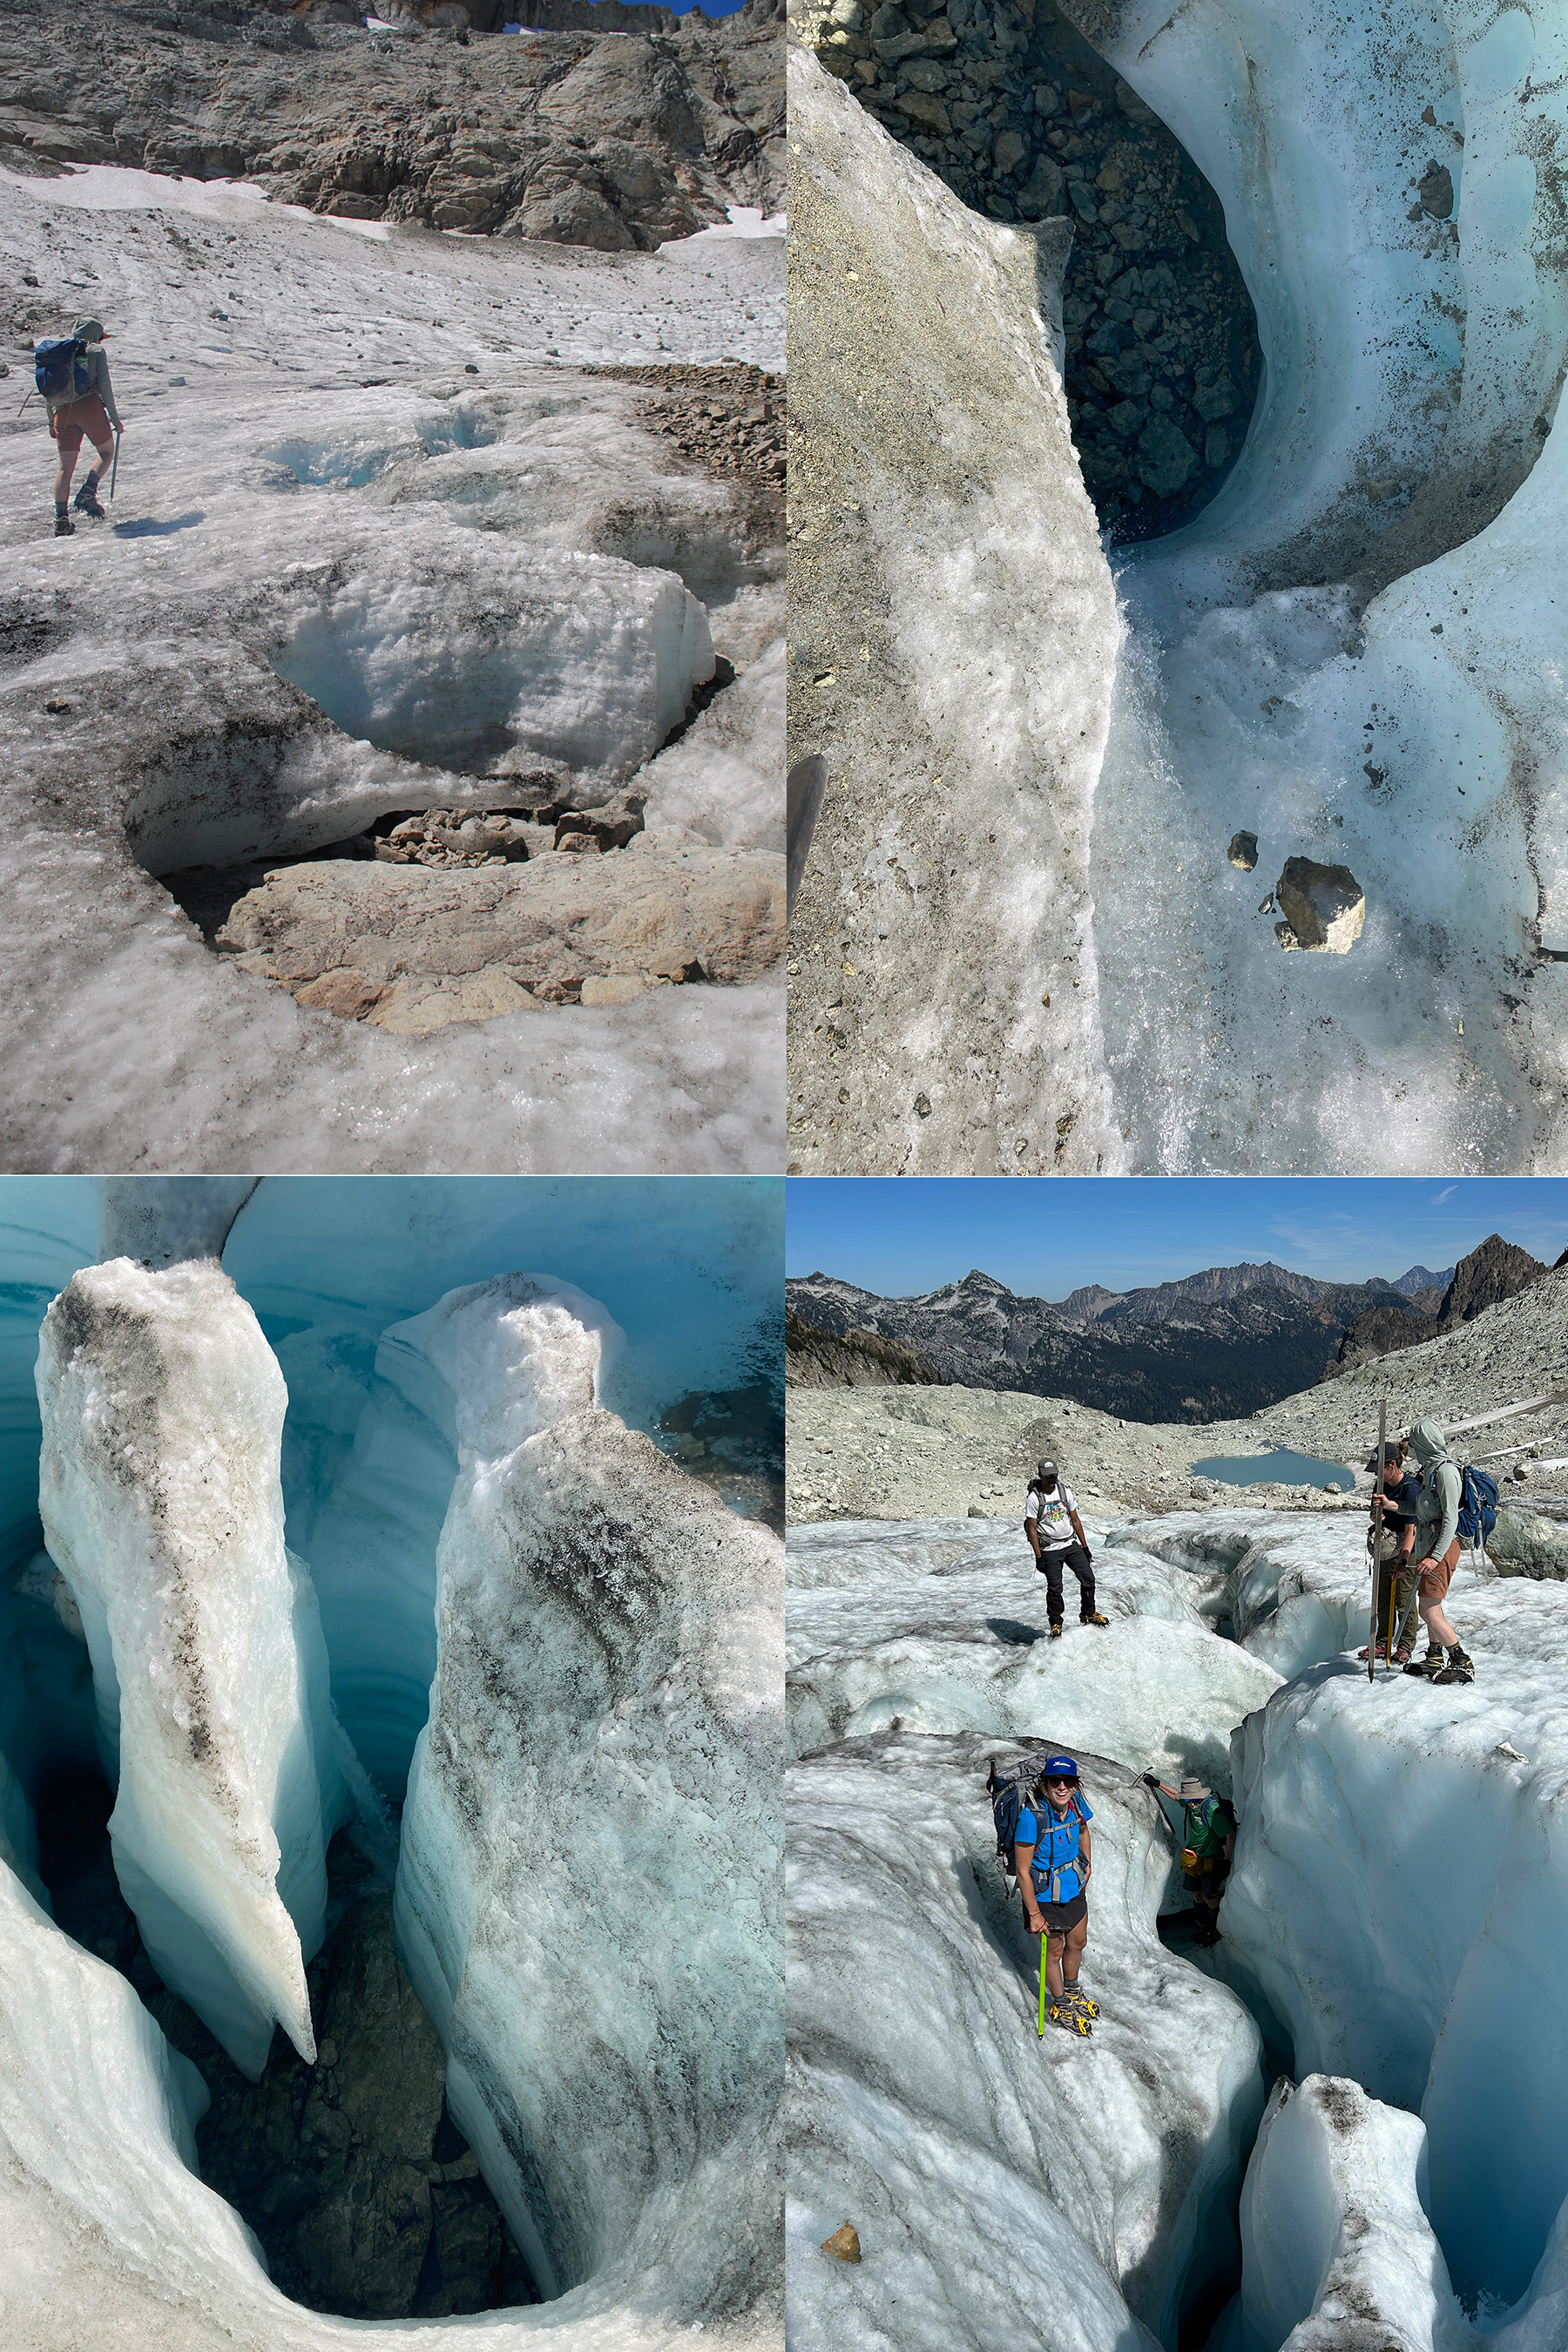
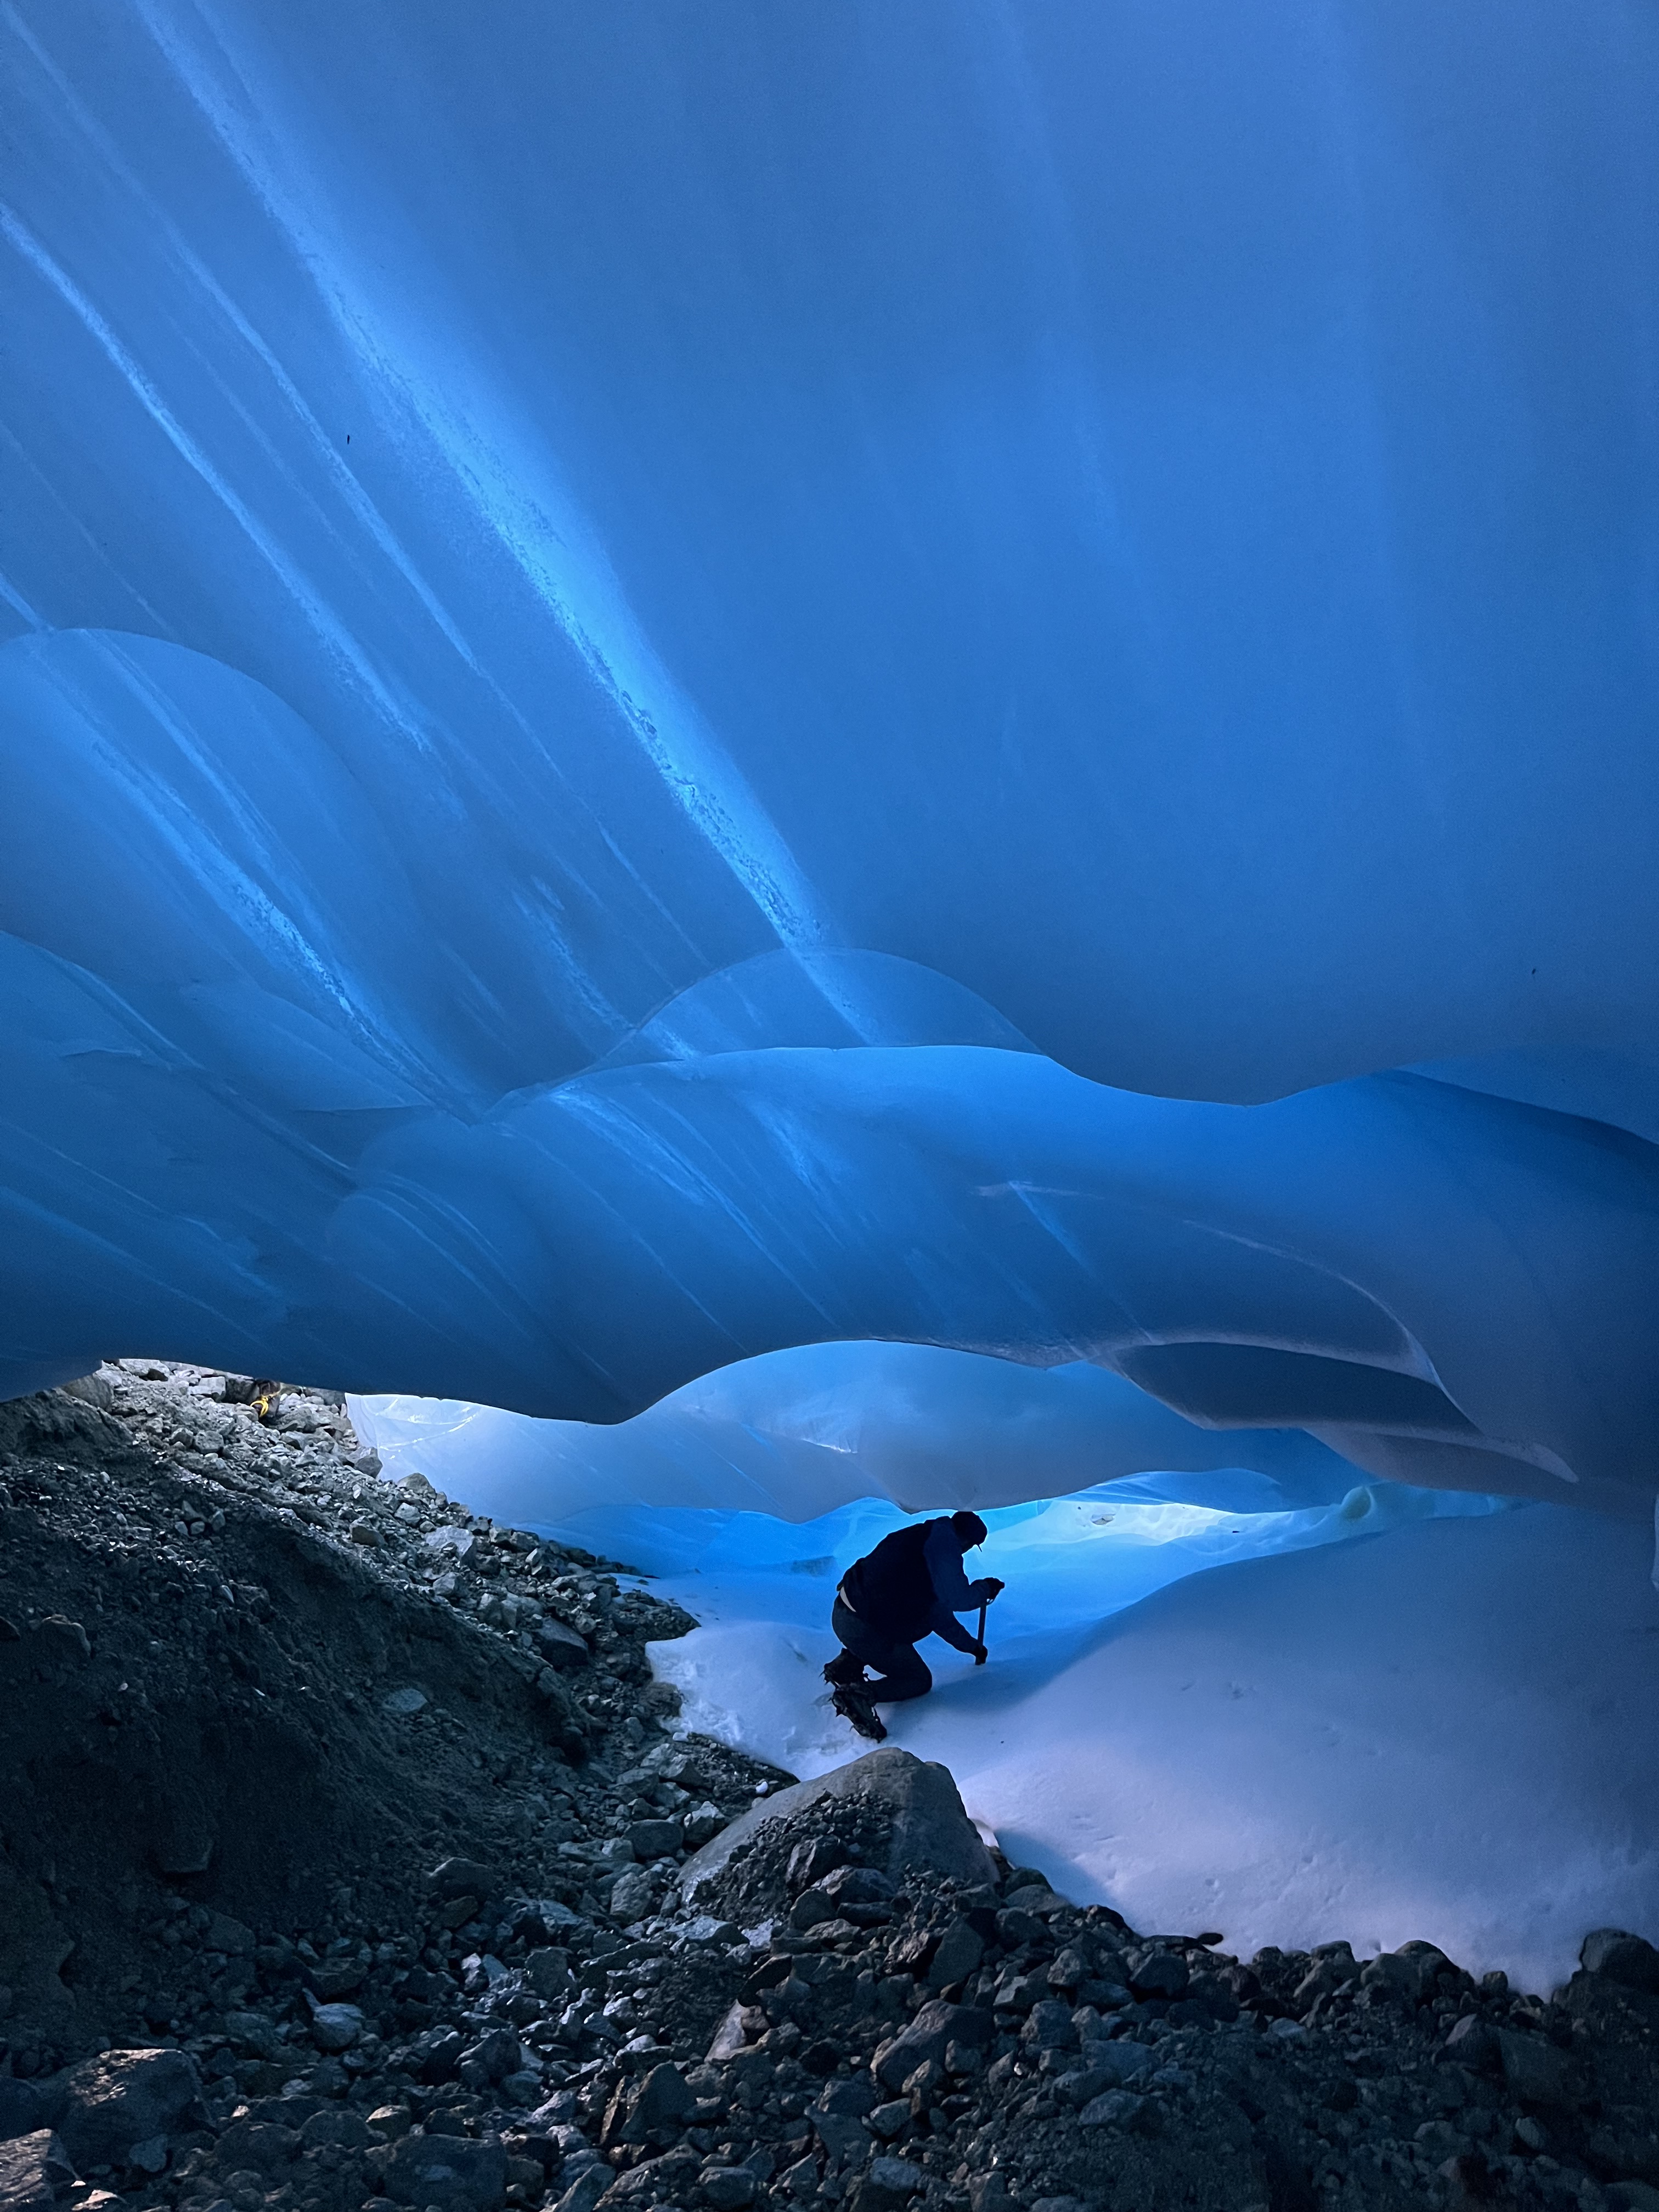
On Ice Worm Glacier the retreat of the top of the glacier has been faster than the terminus of the glacier. This summer we observed a dozen holes that reached the bottom of the glacier 4-6 m below, indicating how thin the ice is. There is no movement, the size and thickness are too low to generate future movement, hence this is no longer a glacier. A glacier is a body of snow and ice that is moving, this requires a persistent thickness of 20-30 m, which is typically associated with snow/ice areas of ~50,000 m² or larger. As a glacier becomes thinner or smaller than this movement will not be sustained. In this case an extensive ice worm population, that cannot migrate anywhere will be lost. The ice worms cannot survive in perennial snow/ice.

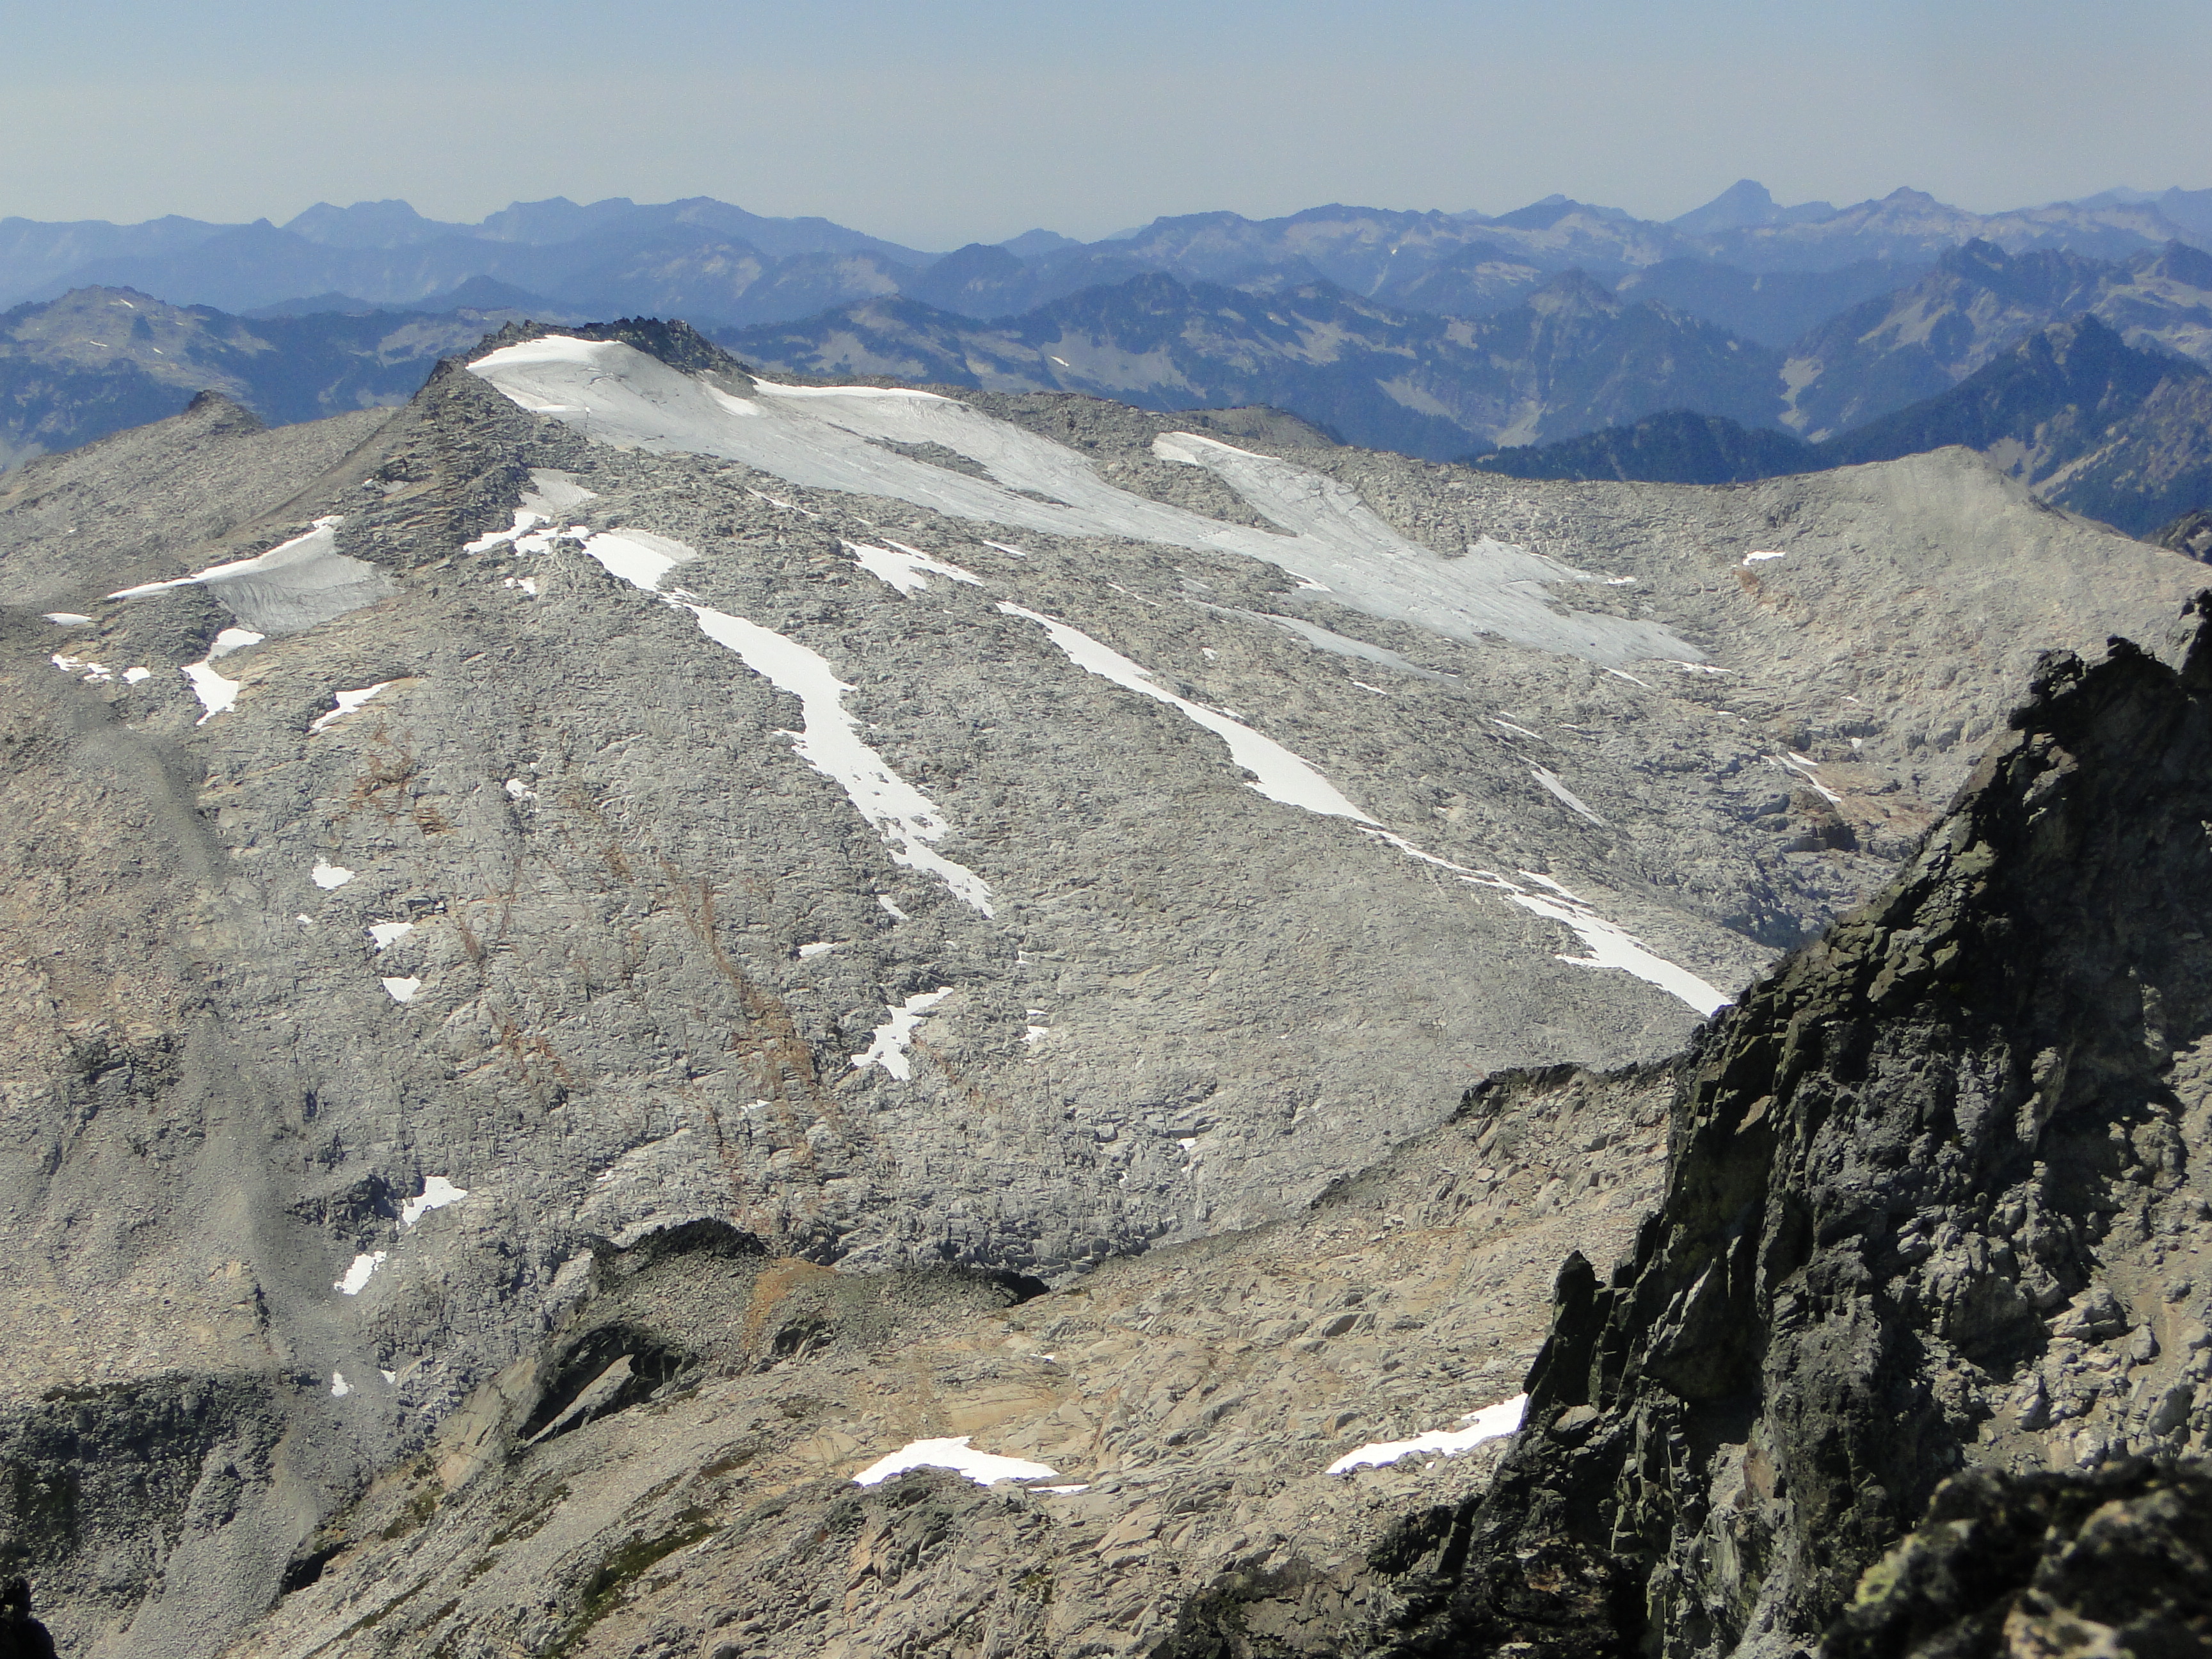
Hinman Glacier crossed that threshold either in summer 2021 or 2022 with no patch of ice exceeding 30,000 m². This had been the largest glacier in the region, but had no avalanche accumulation to supplement.

Daniels Glacier has a long terminus section that leads to rapid area loss with even a retreat of 20 m. This year the lowest 20% of the glacier is quite thin and much of this likely will melt out in the coming month. For the first time ever in our 40 years of observation there is no significant retained snow in early August. Glacier length has been reduced by 60% since our monitoring began.

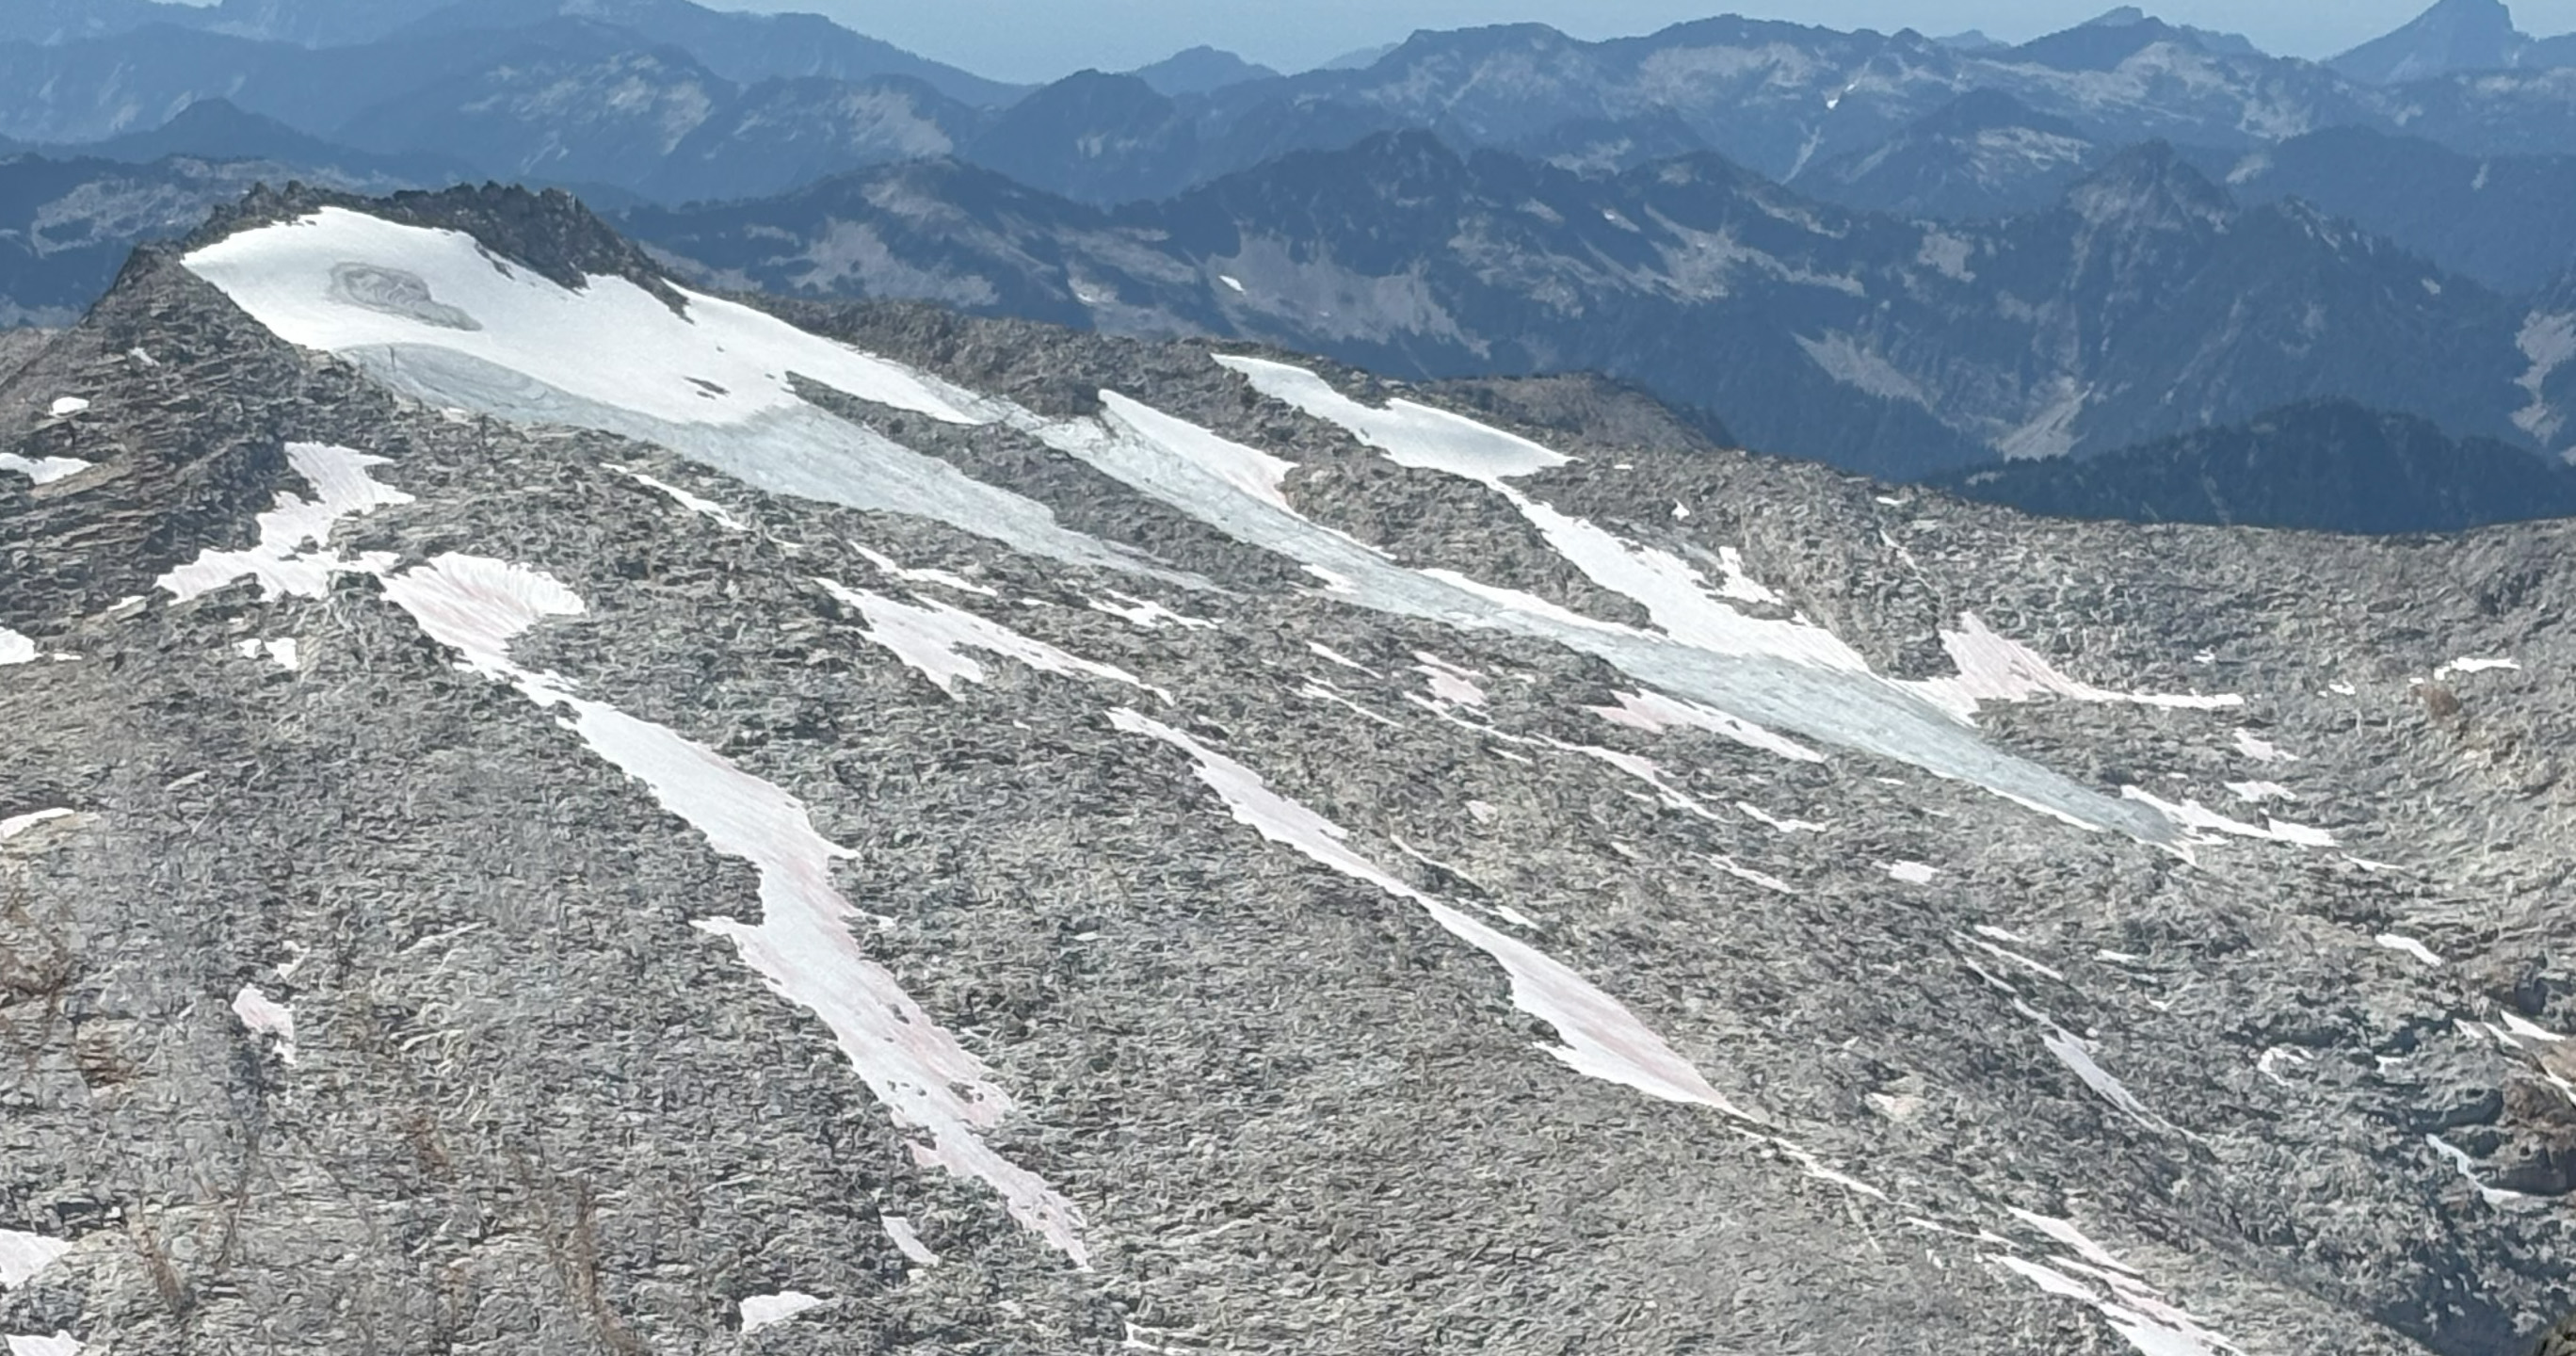
Lynch Glacier had filled Pea Soup Lake basin until the late 1970’s. After its rapid retreat exposed this beautiful new lake, the glacier retreated slowly at its terminus. However, the entire western third of the glacier is nearly gone, even up to the ridge top. This illustrates again that retreat does not always of the terminus.

Foss Glacier was a large slope glacier filling the northeast face of Mount Hinman in the 1980s. By 2005, the glacier had retreated exposing two new alpine lakes and was clearly on the path of Hinman Glacier. Fragmentation began in 2015 and has accelerated during the 2021-2023 period. This will no longer be a glacier either later this year or next year.

daniels-glacier-2022-2023

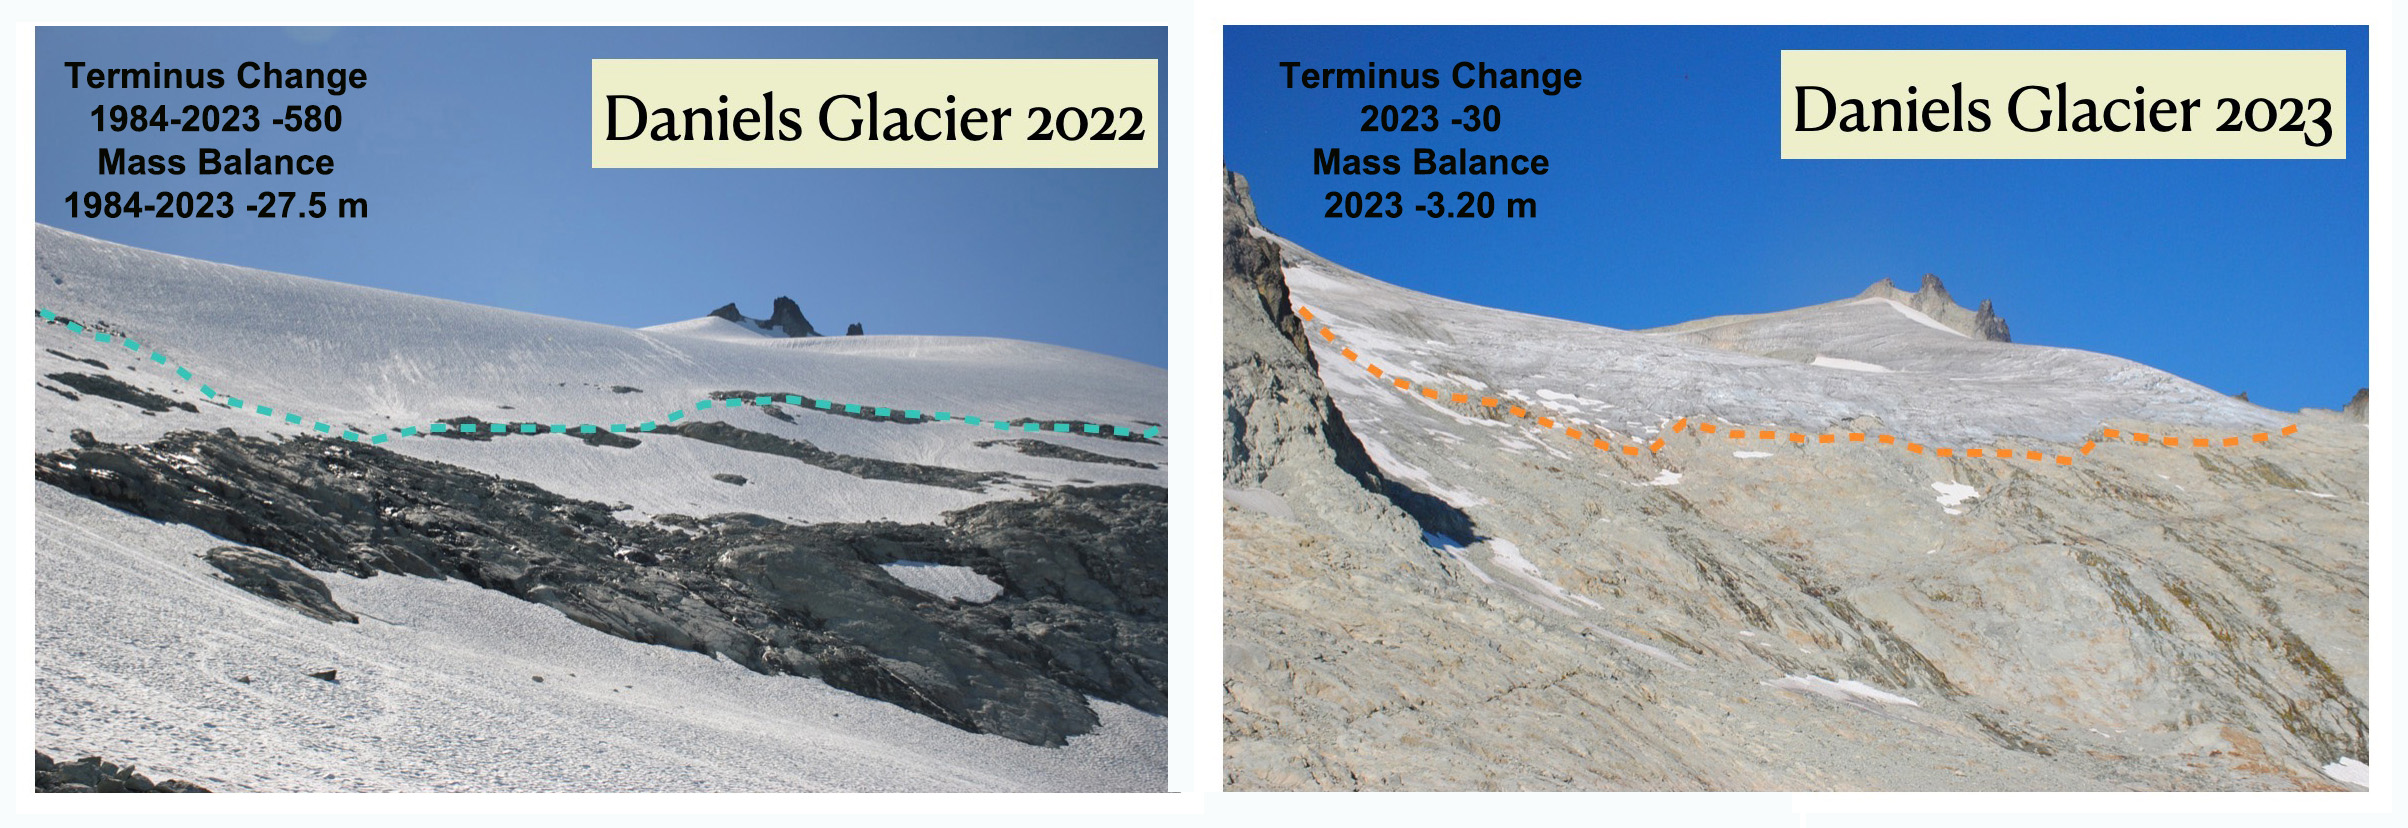
Daniels Glacier in 2023, less than 50% remaining from 1984. The glacier terminus has retreated 700 m, with the longest glacier section now at 450 m. Daniels Glacier on Aug. 14 2022 and Aug. 14 2023. In 2022 a late start to summer preserved snowpack, but summer conditions did not end until Octs. 21. (Jill Pelto, photographs). 

Daniels1990

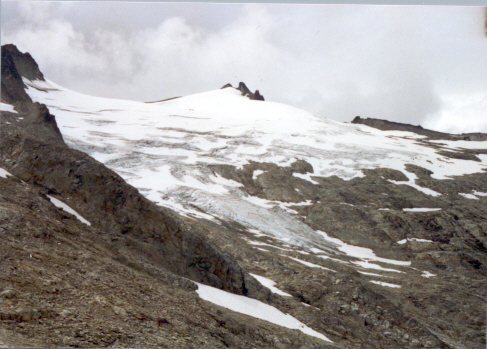
Daniels Glacier in 1990. This blue ice tongue is now completely gone. 

Daniels 2010 copy

Daniels Glacier indicating change from 1984 to 2010.

ice worm 821u

Ice Worm Glacier in 2013 area 0.08 km², 33% less than in 1984.

ice worm demise

Ice Worm Glacier in 2023 area 0.04 km², 67% decline since 1984 and 50% since 2013.

Ice worm glacier 1984-2023

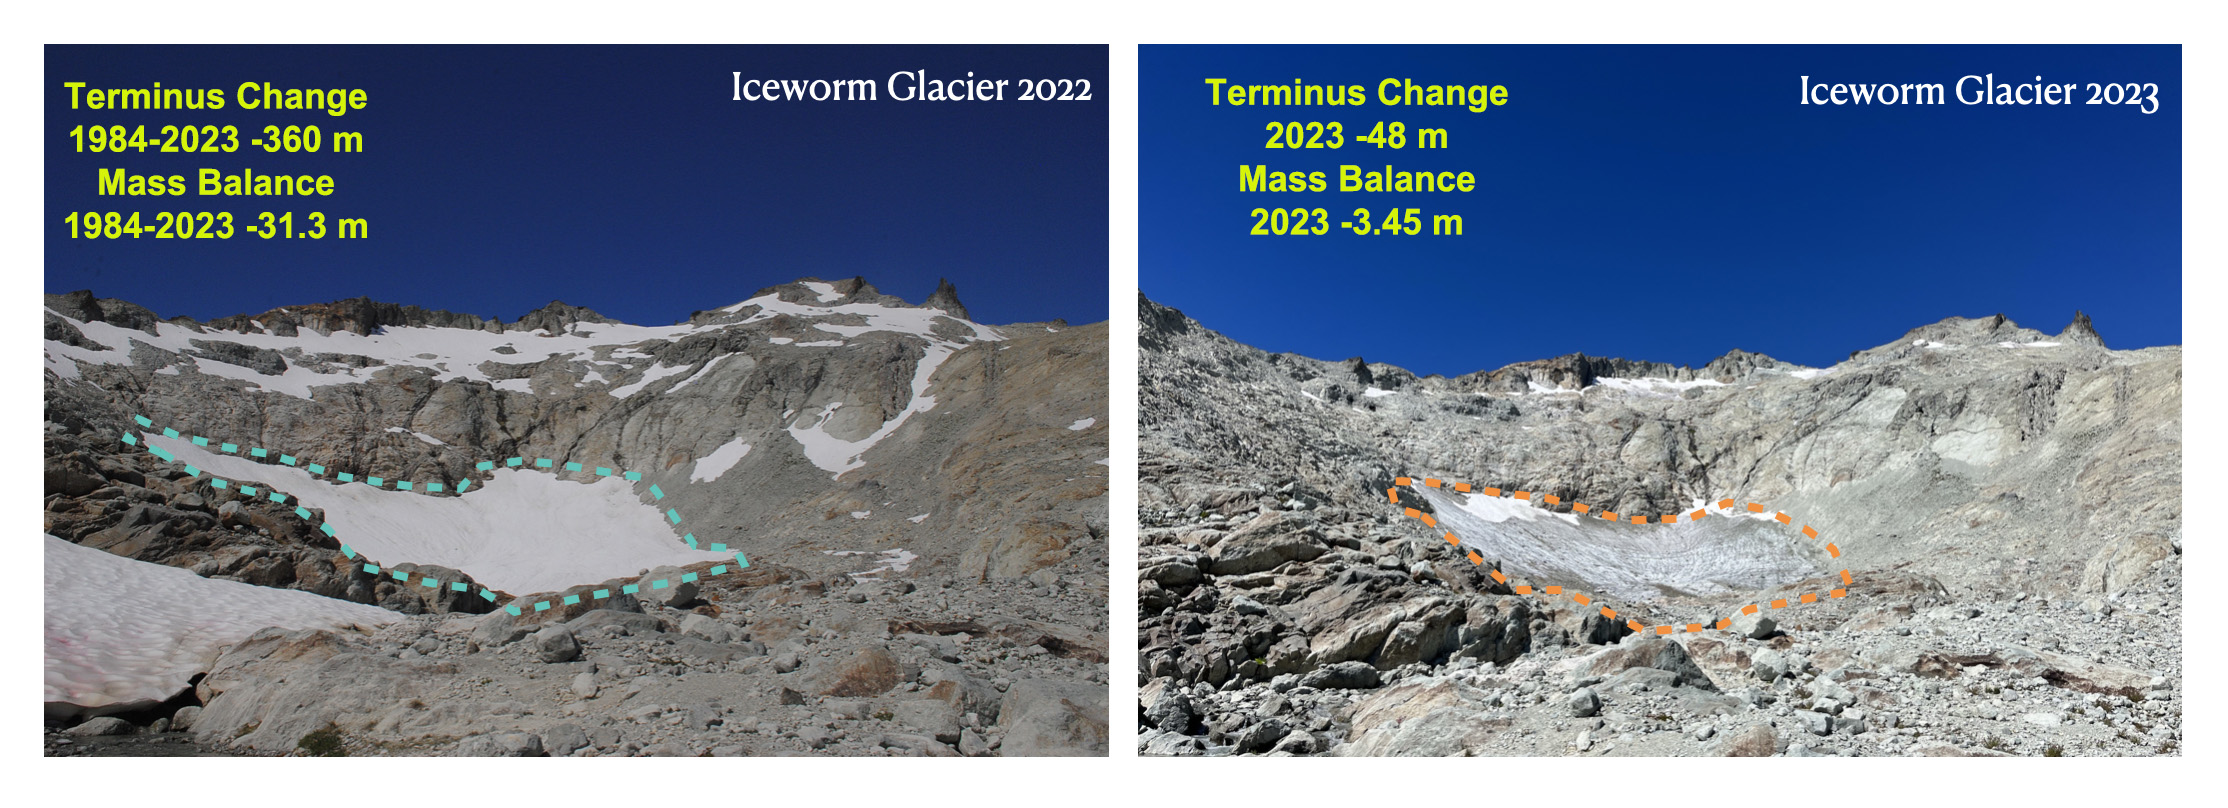
Ice Worm Glacier comparison Aug. 13 2022 and Aug. 13, 2023. Jill Pelto photographs.

Lynch glacier 1984-2023

Lynch Glacier in 2023 with west side melted out.

foss compare

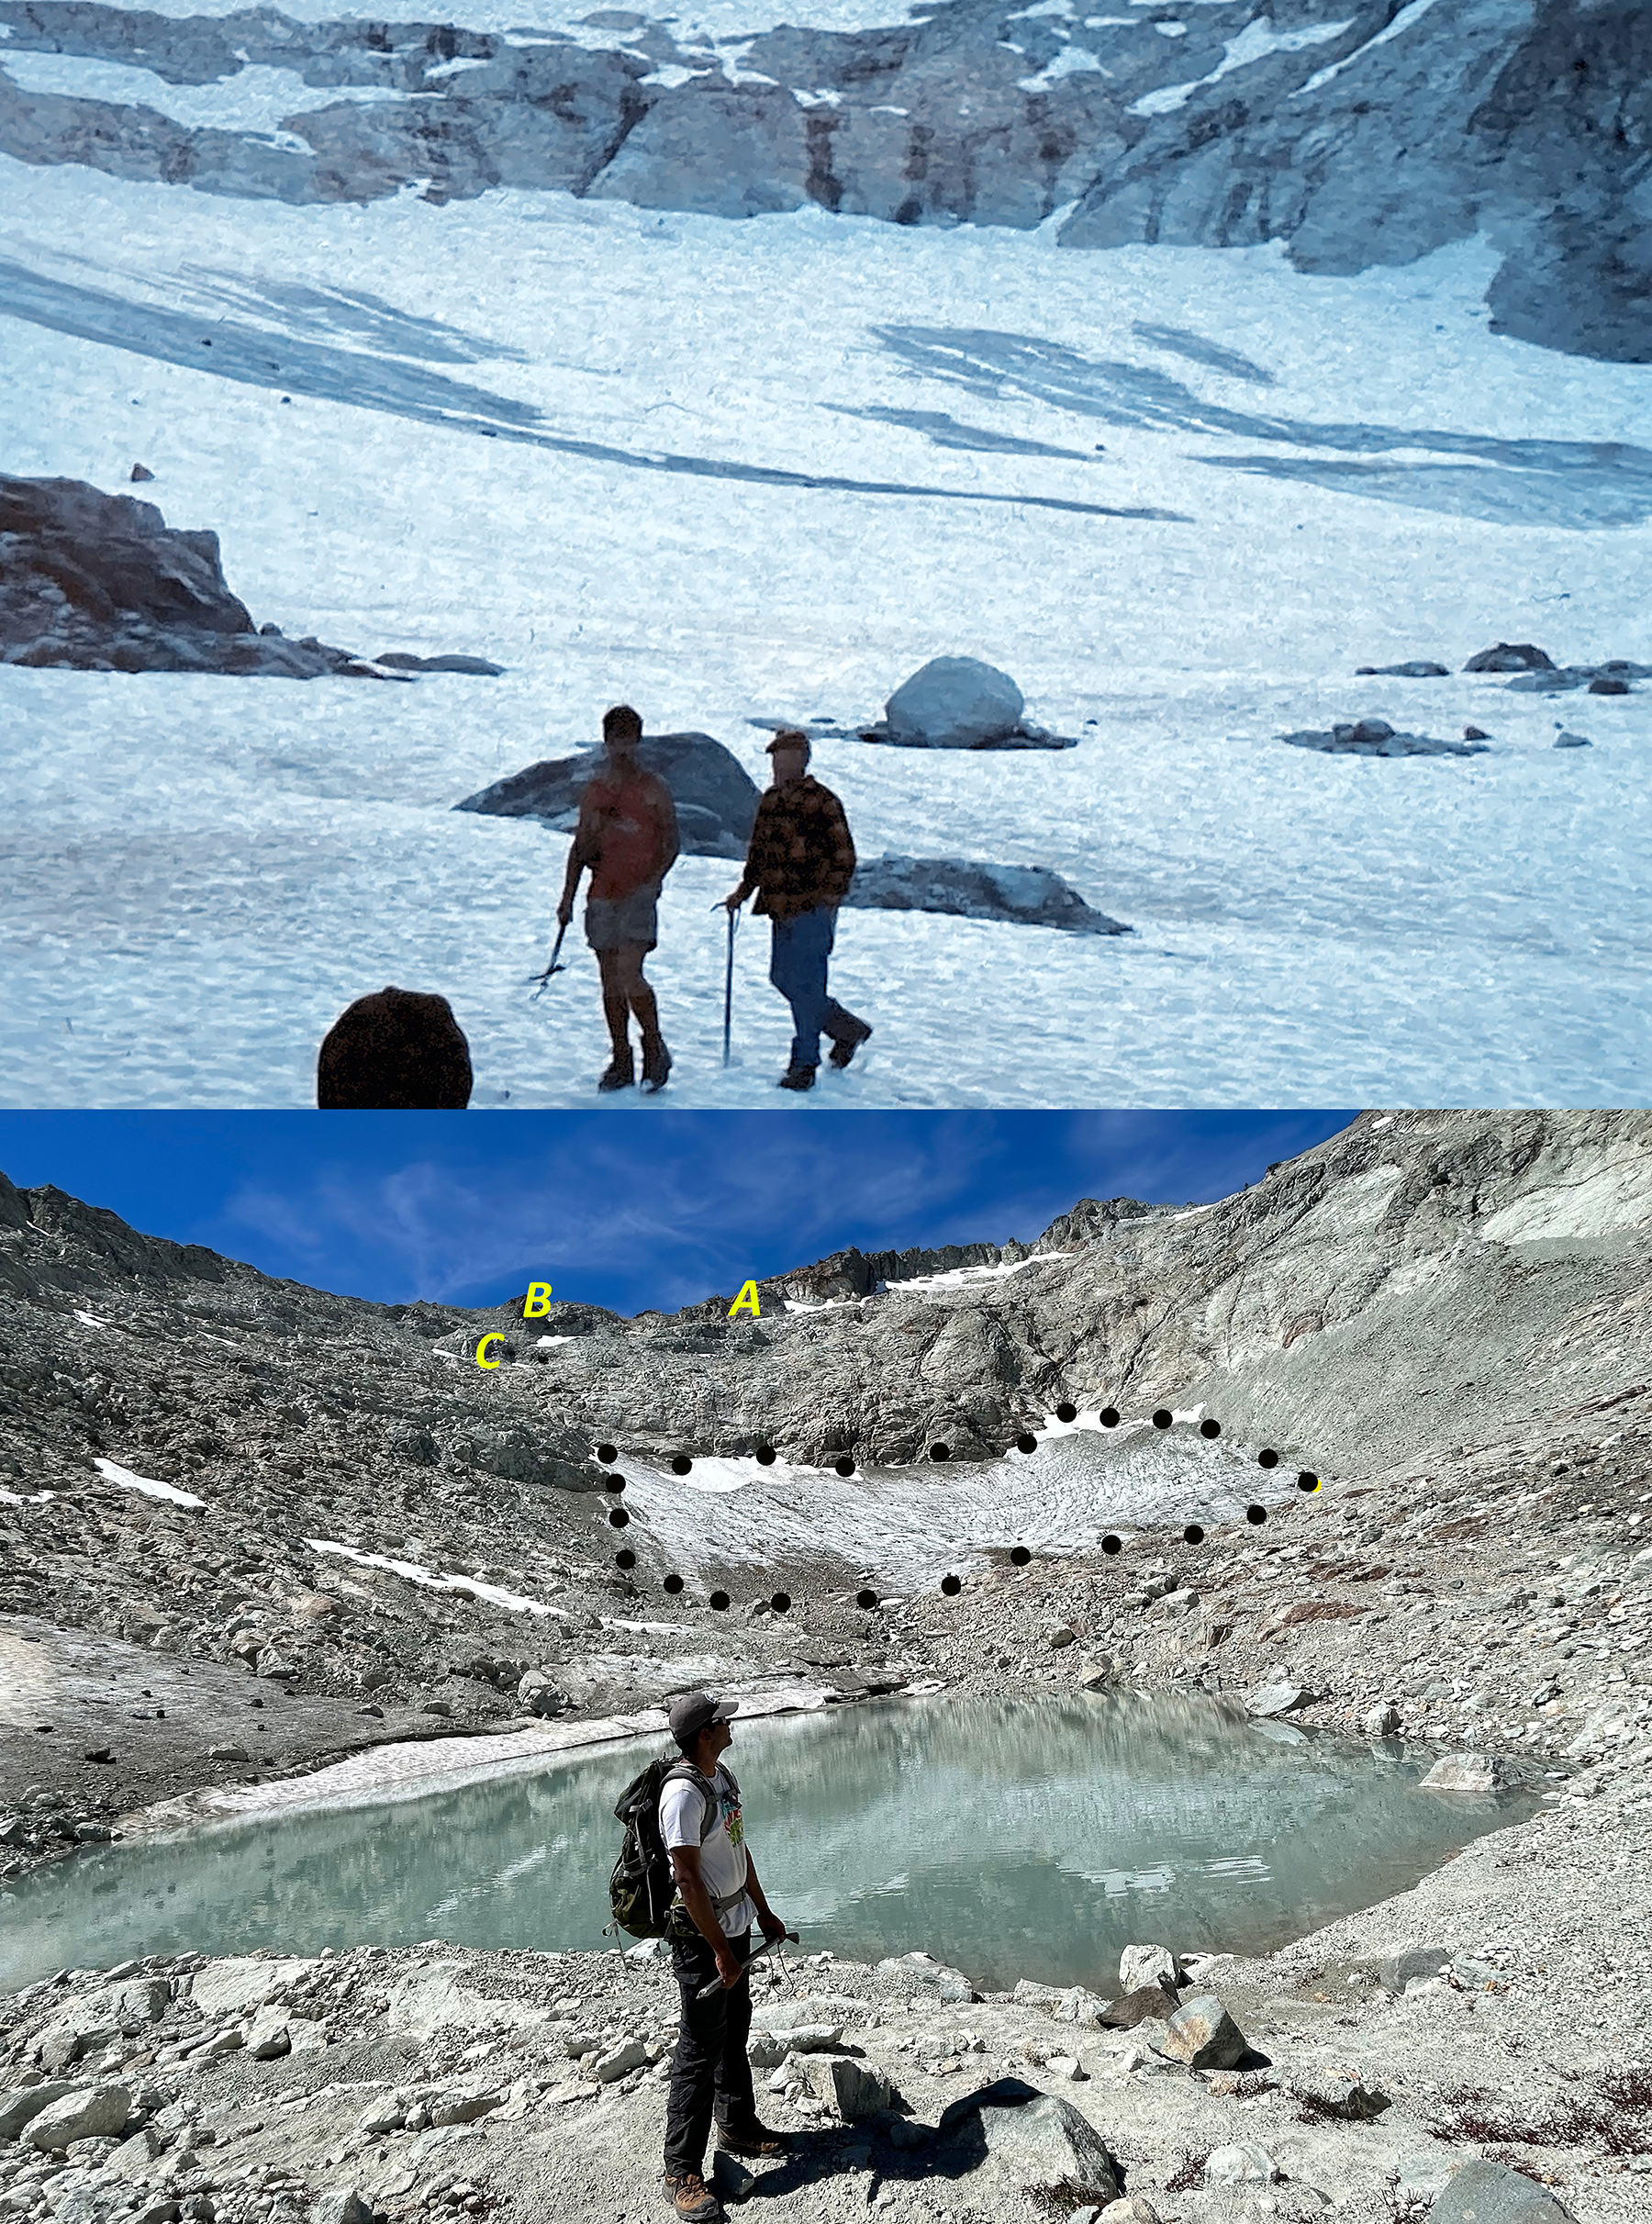
Foss Glacier covered the northeast slope of Mount Hinman in 1988 and by 2015 was only 50% of the  1984 size.

DSC05998

Foss Glacier in 2023, it is not some thin rapidly fragmenting sections of ice covering 0.14 km².

hinman glacier

Hinman Glacier in 1988 four separate ice masses.

Hinman glacier 1958-2022 copy

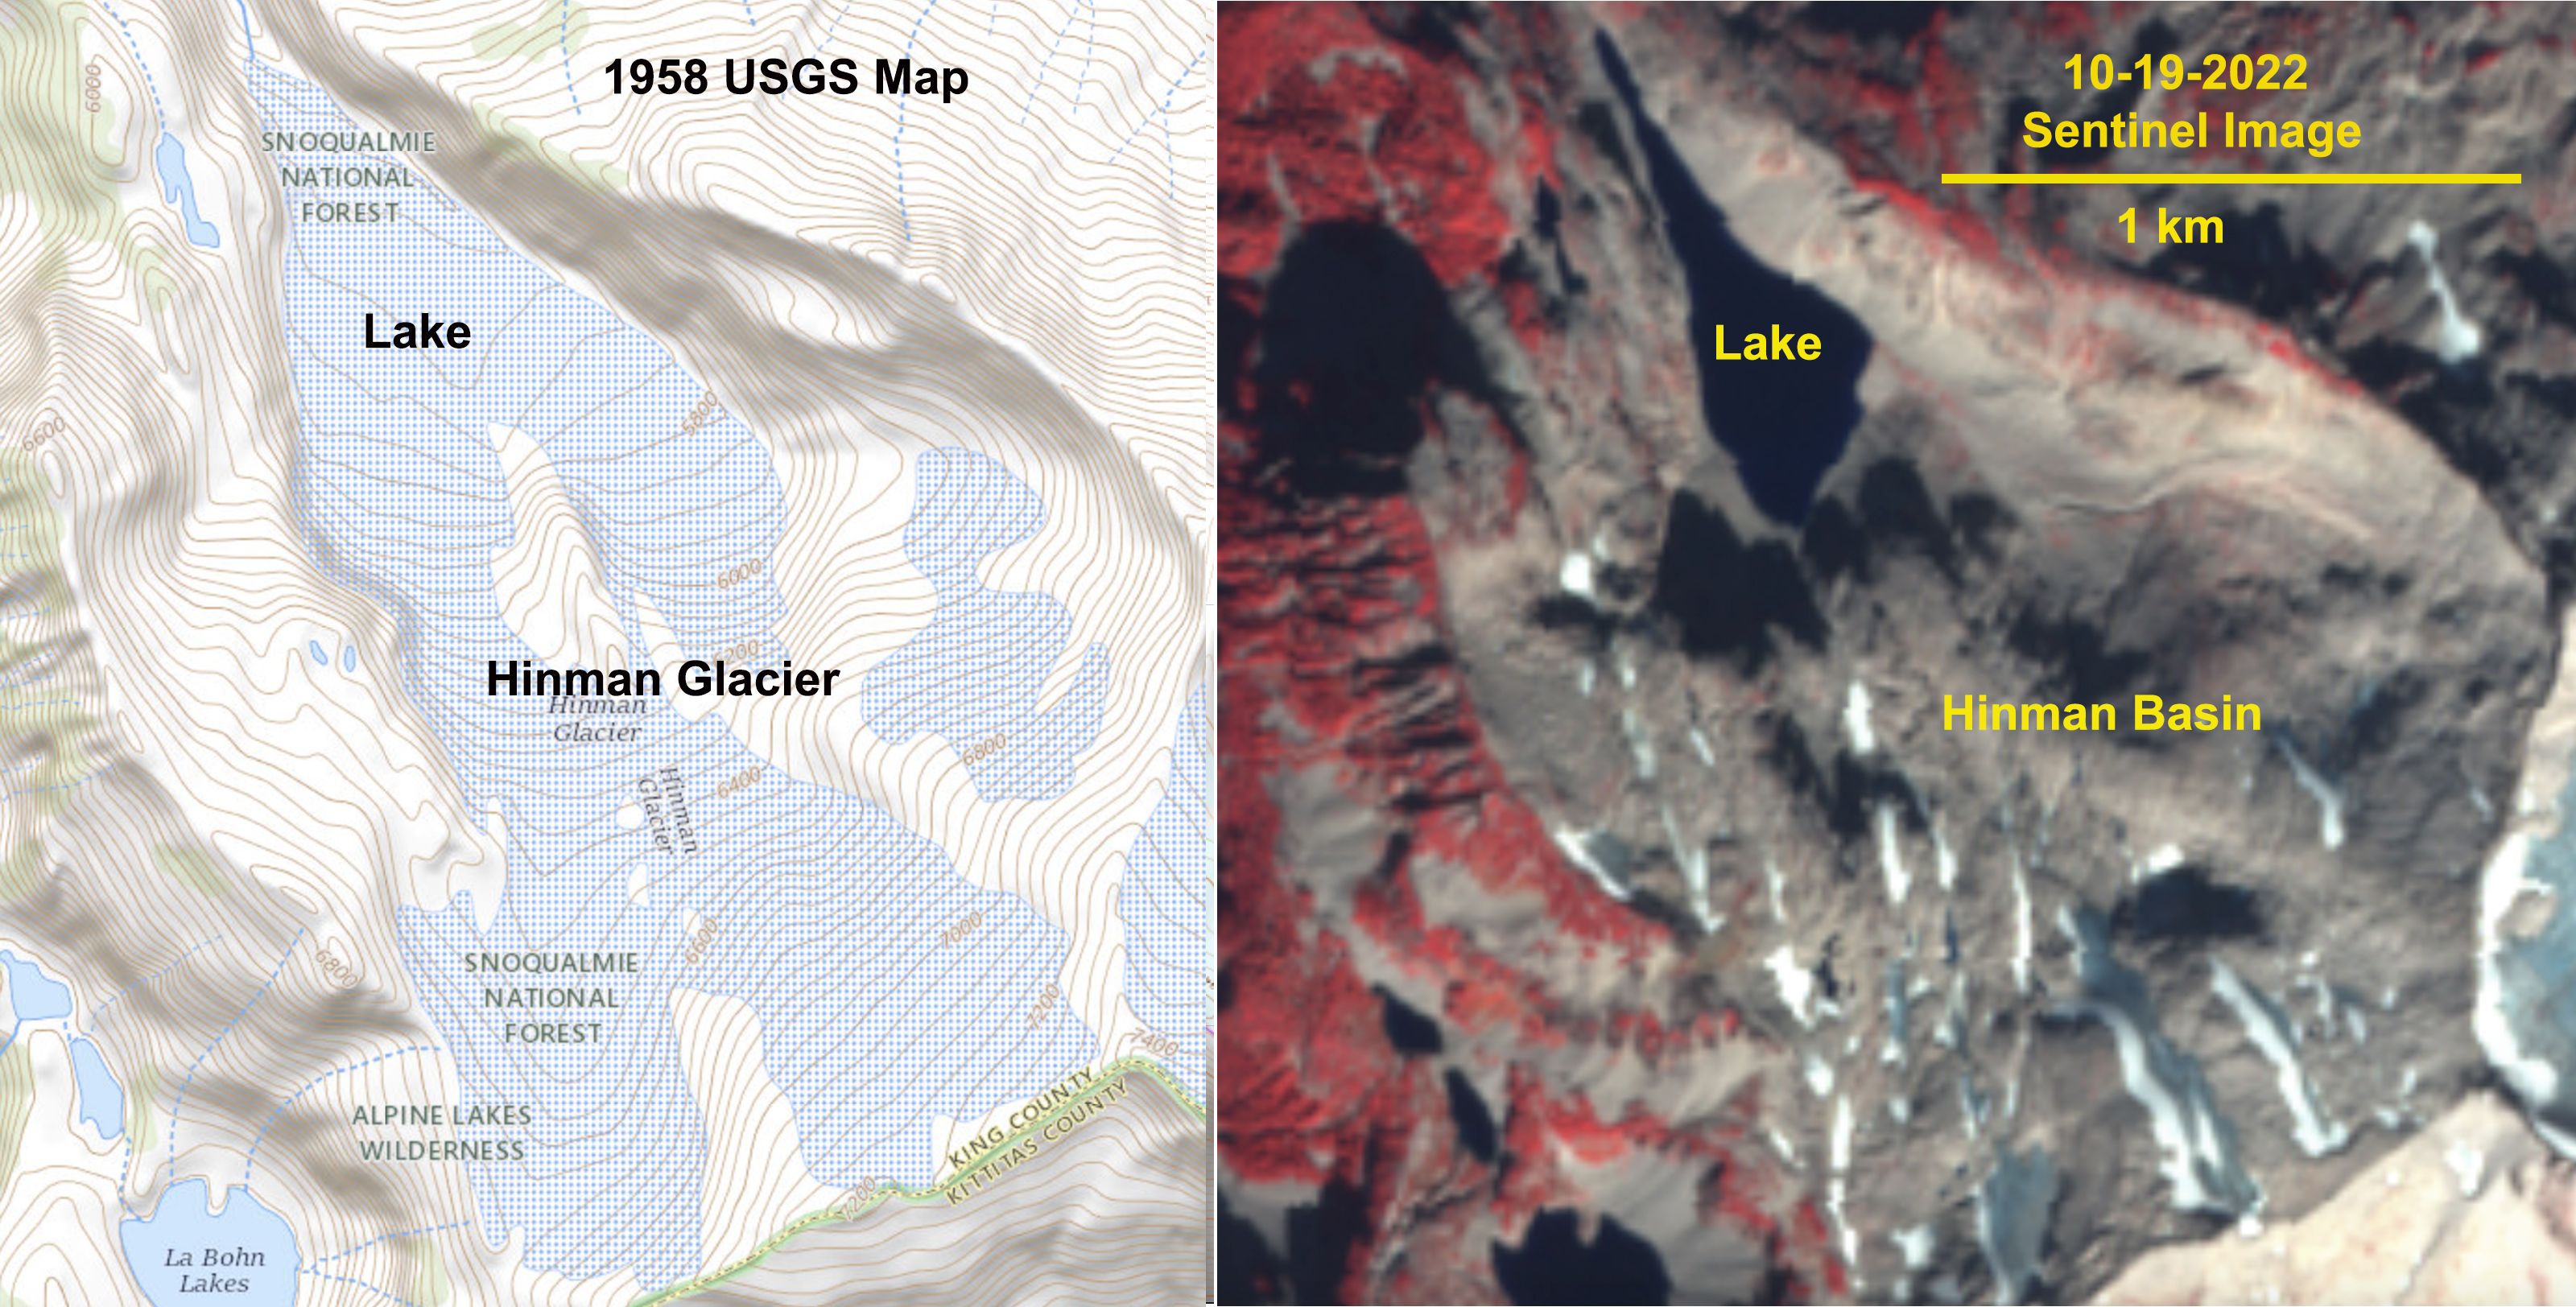
Hinman Glacier from 1.3 km² in 1958 to 0.04 km² in 2022.

The three largest glaciers on these mountains in 1958 fed the SkykomishRiver supplying 1.5 to 2 m³/sec durng the summer melt season (Pelto, 2011).  This summer we measured melt on these glaciers yielding 25-30% of this level.  The result has been declining flow during late summer low flow periods in the Skykomish River resulting in higher water temperatures. Daniels and Ice Worm Glacier feed the Cle Elum River, whose reservoir is an important resource for irrigation in the Yakima Basin. A key threshold of in-stream flow levels considered insufficient to maintain short term survival of fish stocks is below 10% of the mean annual flow. For the Skykomish River at the USGS Gold Bar site 10% of mean annual flow is 14 m3s-1. In the Skykomish River from 1958-2021 there were 344 melt season days with discharge below 14 m3s-1. Of these only 3 occurred before 1985, and 70% have occurred since 2000. Of more concern for aquatic life is the occurrence of extended periods of low flow. From 1929-2023 in the Skykomish River basin there have been 14 years where streamflow dropped below 14 m3s-1 for 10 consecutive days during the melt season, 1986, 1987, 1992, 1998, 2003, 2005, 2006, 2007, 2015, 2017, 2019, 2021, 2022 and 2023. All years occurring during our annual monitoring project, 6 in the last decade. In 2022 this occurred beginning on Sept. 9 after stream temperatures had declined from elevated levels. In 2023 flow dropped below this threshold on Aug. 13 and remains below this threshold coinciding with high water temperatures.

The Skykomish River was listed as impaired for temperature in a 2008 303(d) listing.  Several segments of the Skykomish River as well as its tributaries consistently exceed water quality temperature standards (King et al 2013). During select summer periods from 2001-2006, temperature monitoring in the Skykomish River at Monroe indicated that the average 7-Day maximum frequently exceeded the 16°C criteria between July and September in 2001-2006 (King et al 2013).

A water temperature sensor became operational in early July 2022 at the USGS Gold Bar site. The temperature exceeded 18oC for the first time on July 27. It surpassed 18oC diurnally on most days from July 27-September 7, 37 of 42 days. The TMDL for the Skykomish River indicates the maximum temperature should not exceed 16oC for 7 consecutive days. In 2022 16oC was exceeded continuously from July 26th-August 4th, August 14th-August 28th, and August 29th-September 4th. In 2023 the 16°C threshold was exceeded from July 28-Aug. 21. The reduced late summer glacier flow has reduced the ability of these ice masses to buffer both temperature and discharge during droughts. This same process has been observed in the Nooksack River (Pelto et al 2022).

The impact of glacier loss is not the only reason for declining streamflow, but it is a significant reason. The loss of glacier ice is thus causing issues that extend all the way to Puget Sound or the Columbia River system.

skybasemap

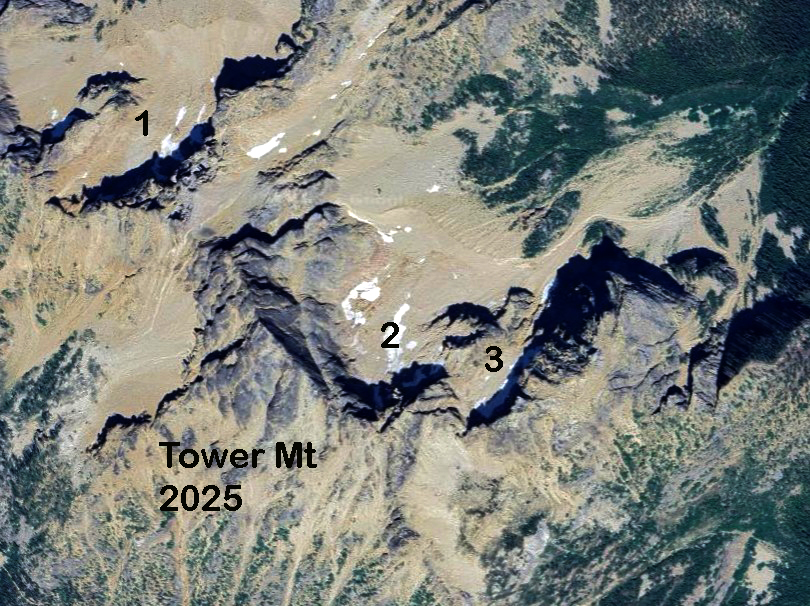
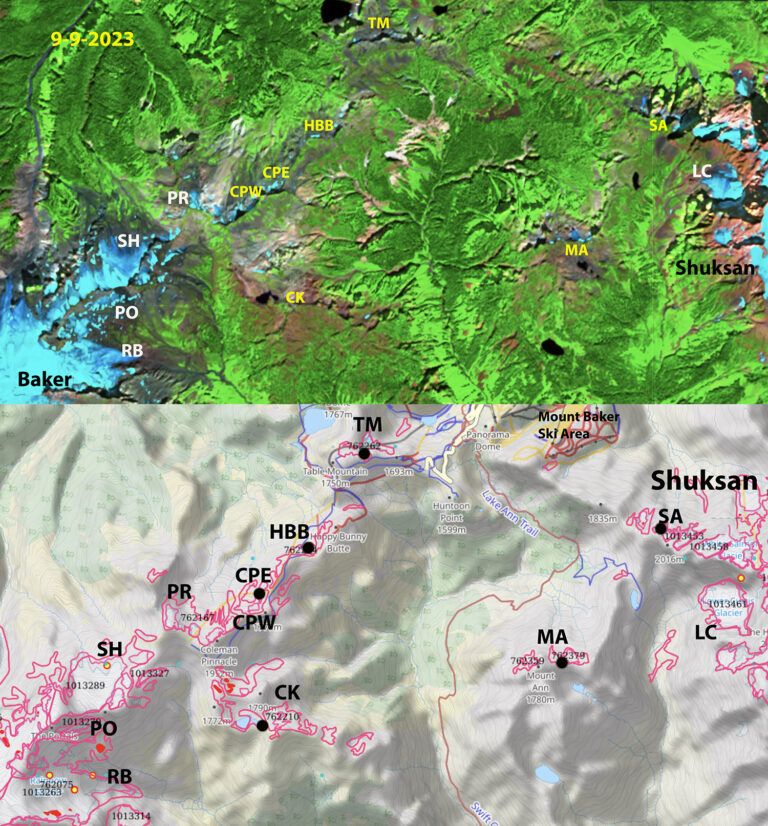
Skykomish River Basin, GB=Gold Bar, blue arrows indicate glaciers 1=Columbia, 2=Hinman, 3=Foss and 4=Lynch.

skykomish flow 2022

Temperature and discharge observations at the USGS Gold Bar site in late summer 2022.

skykomish 2023 temp and discharge

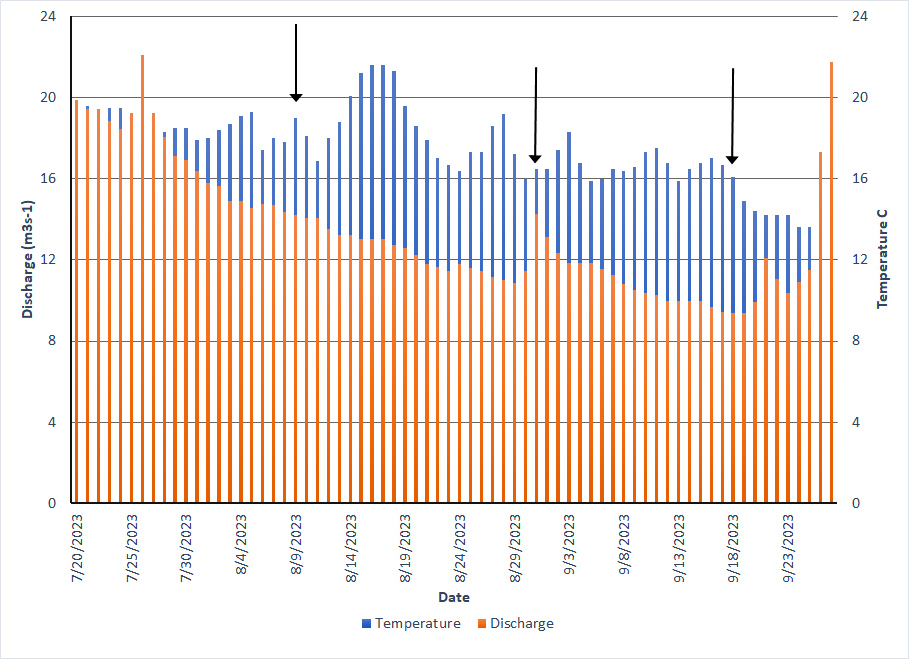
Temperature and discharge observations at the USGS Gold Bar site in late summer 2023.
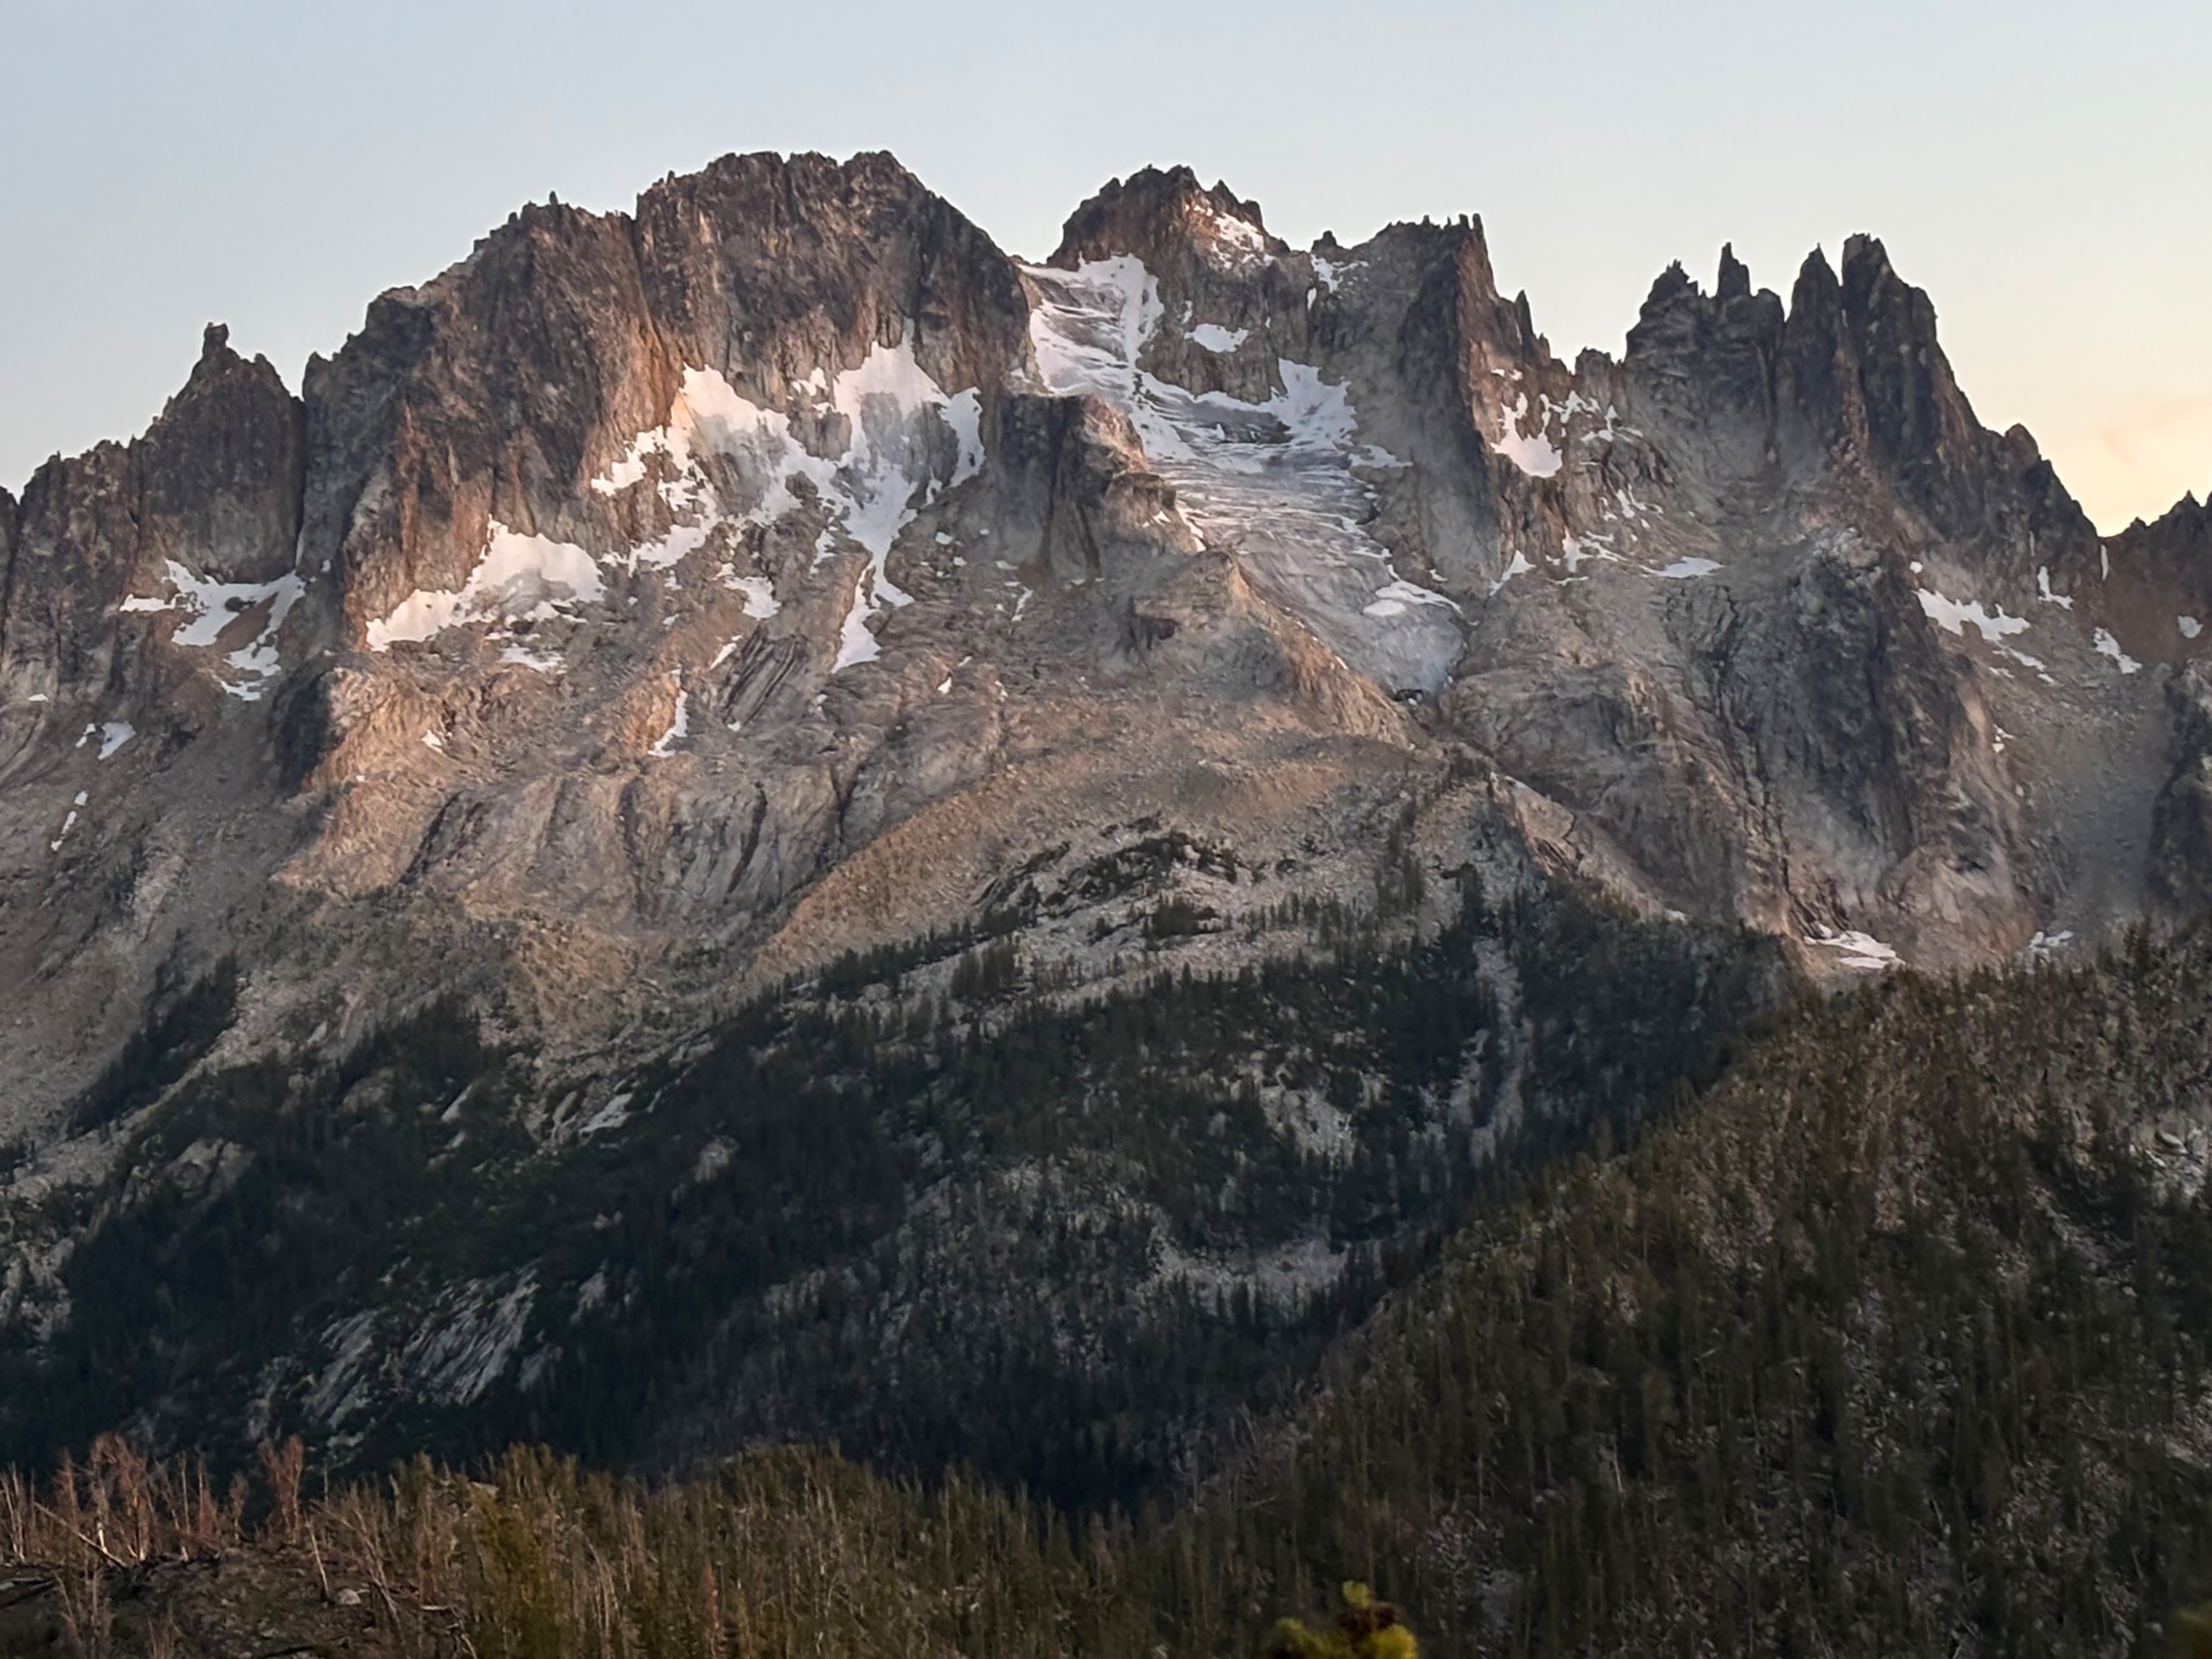
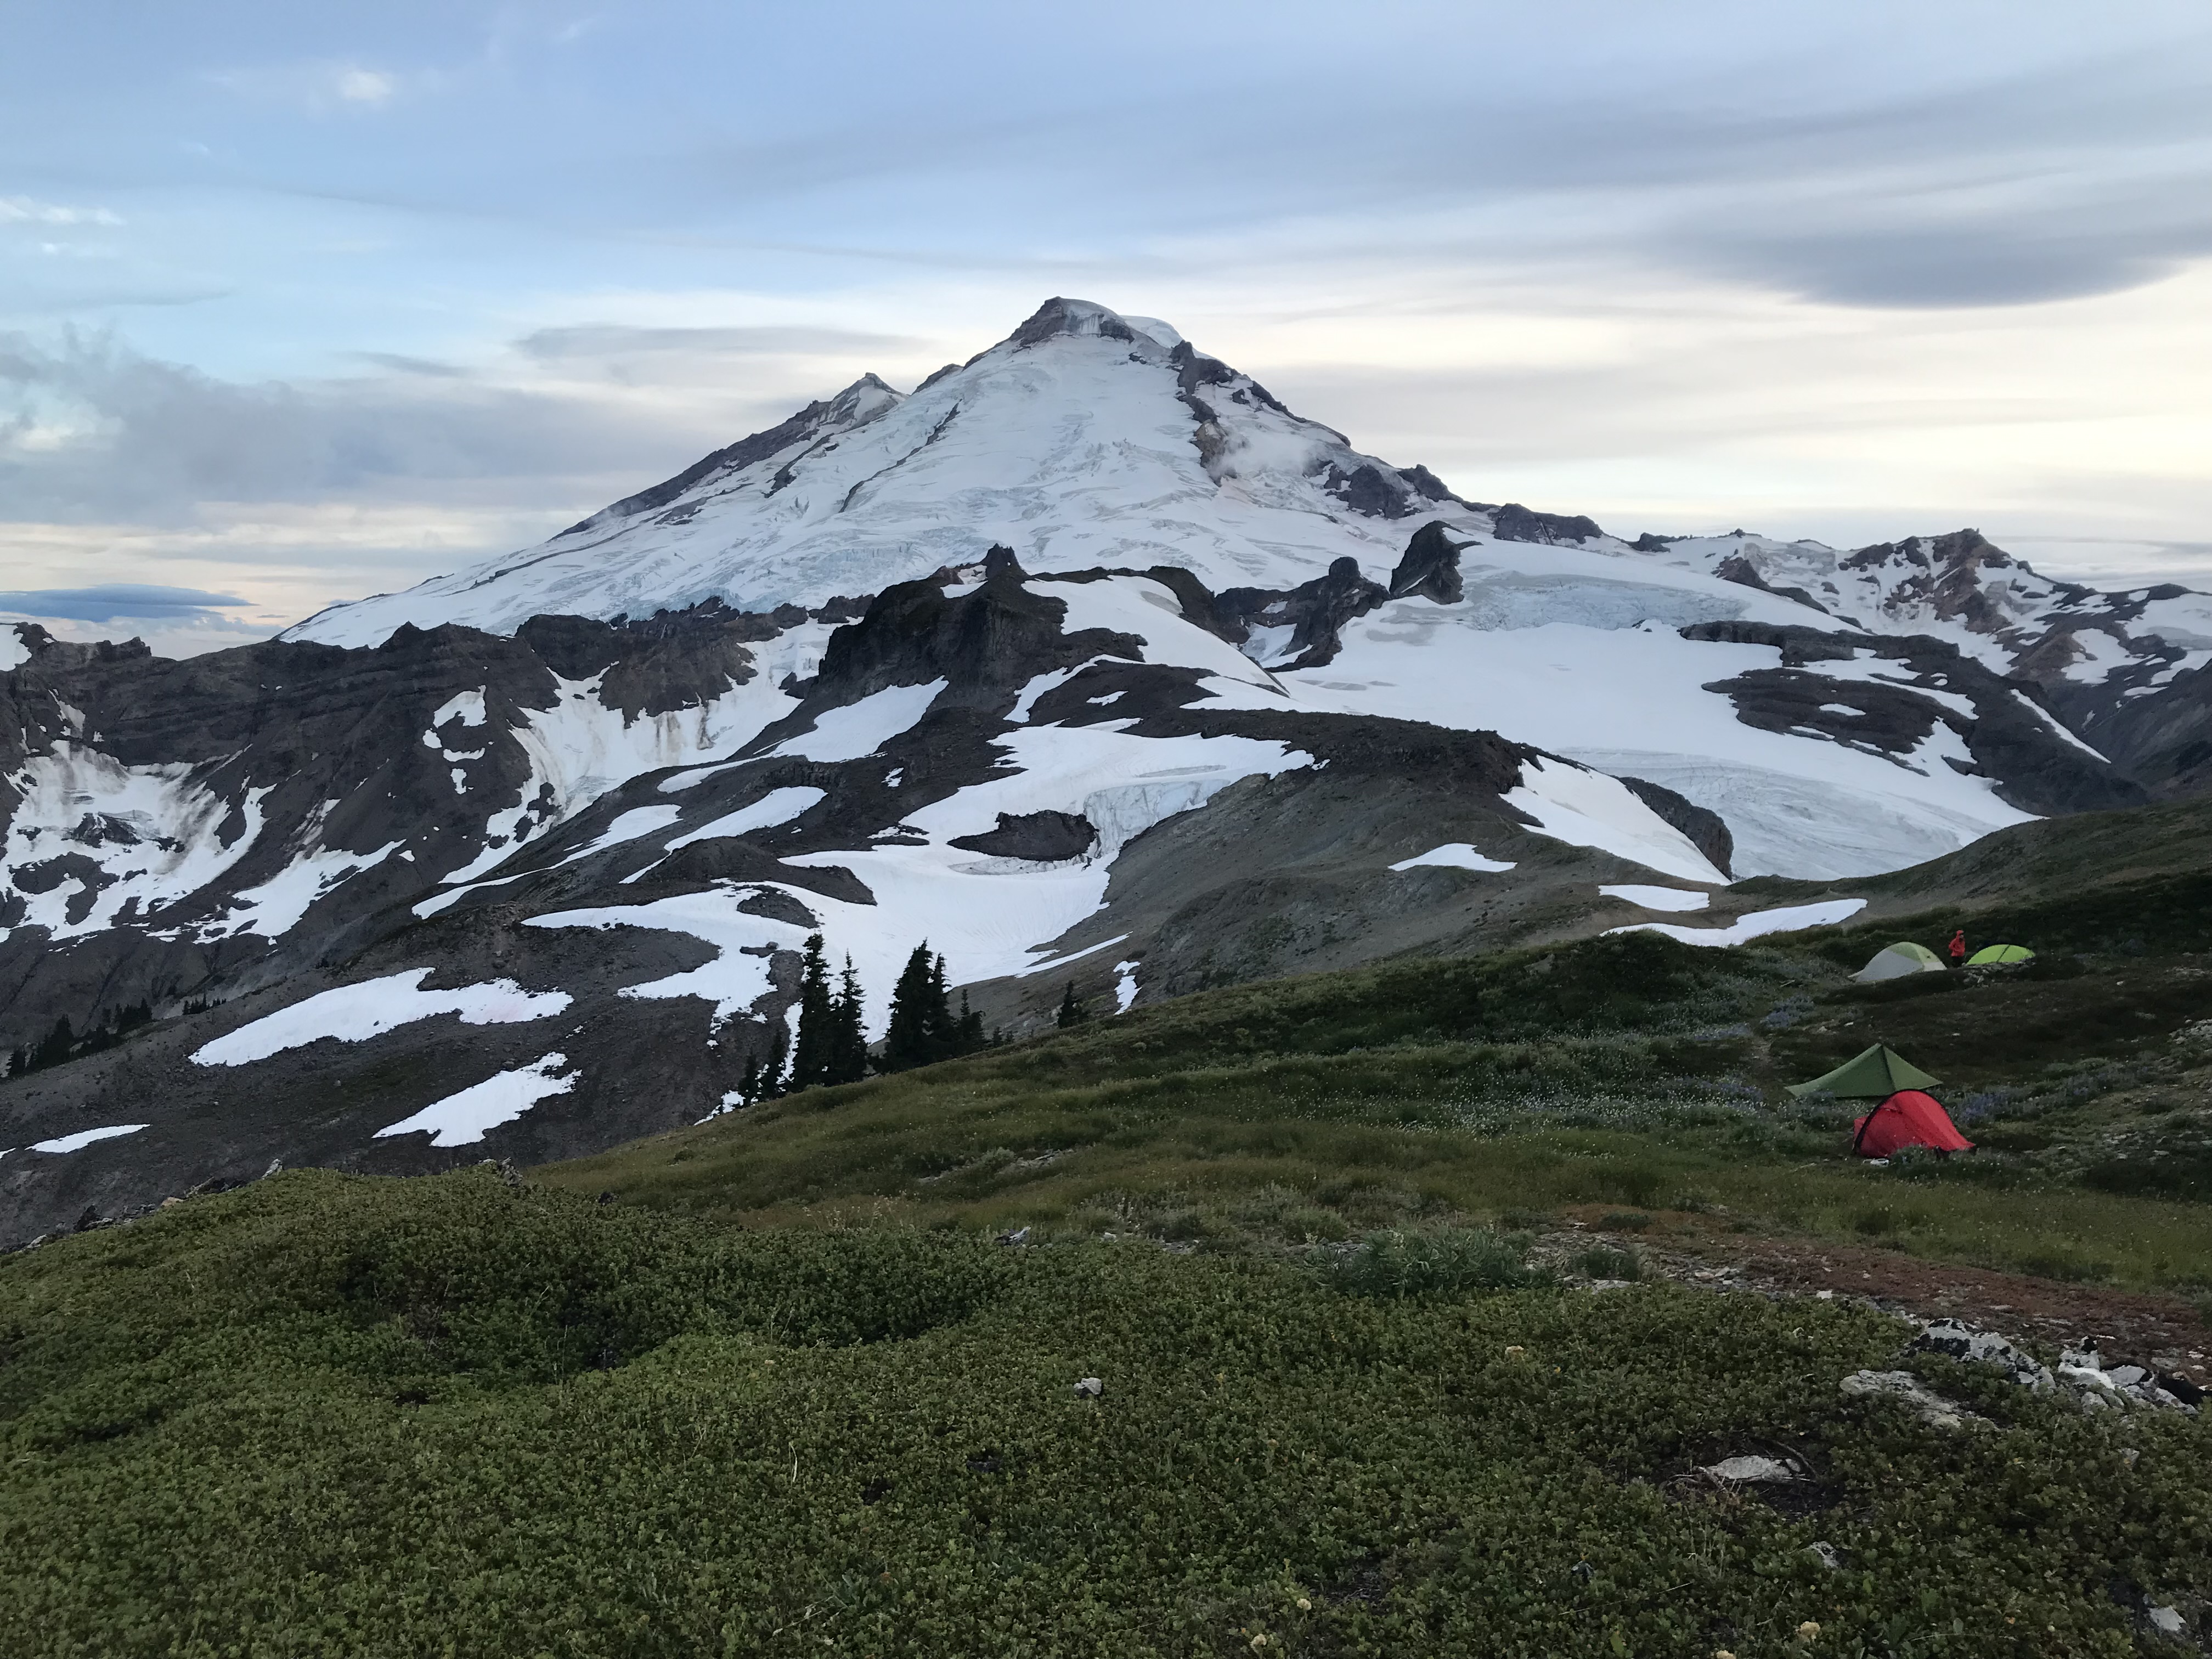
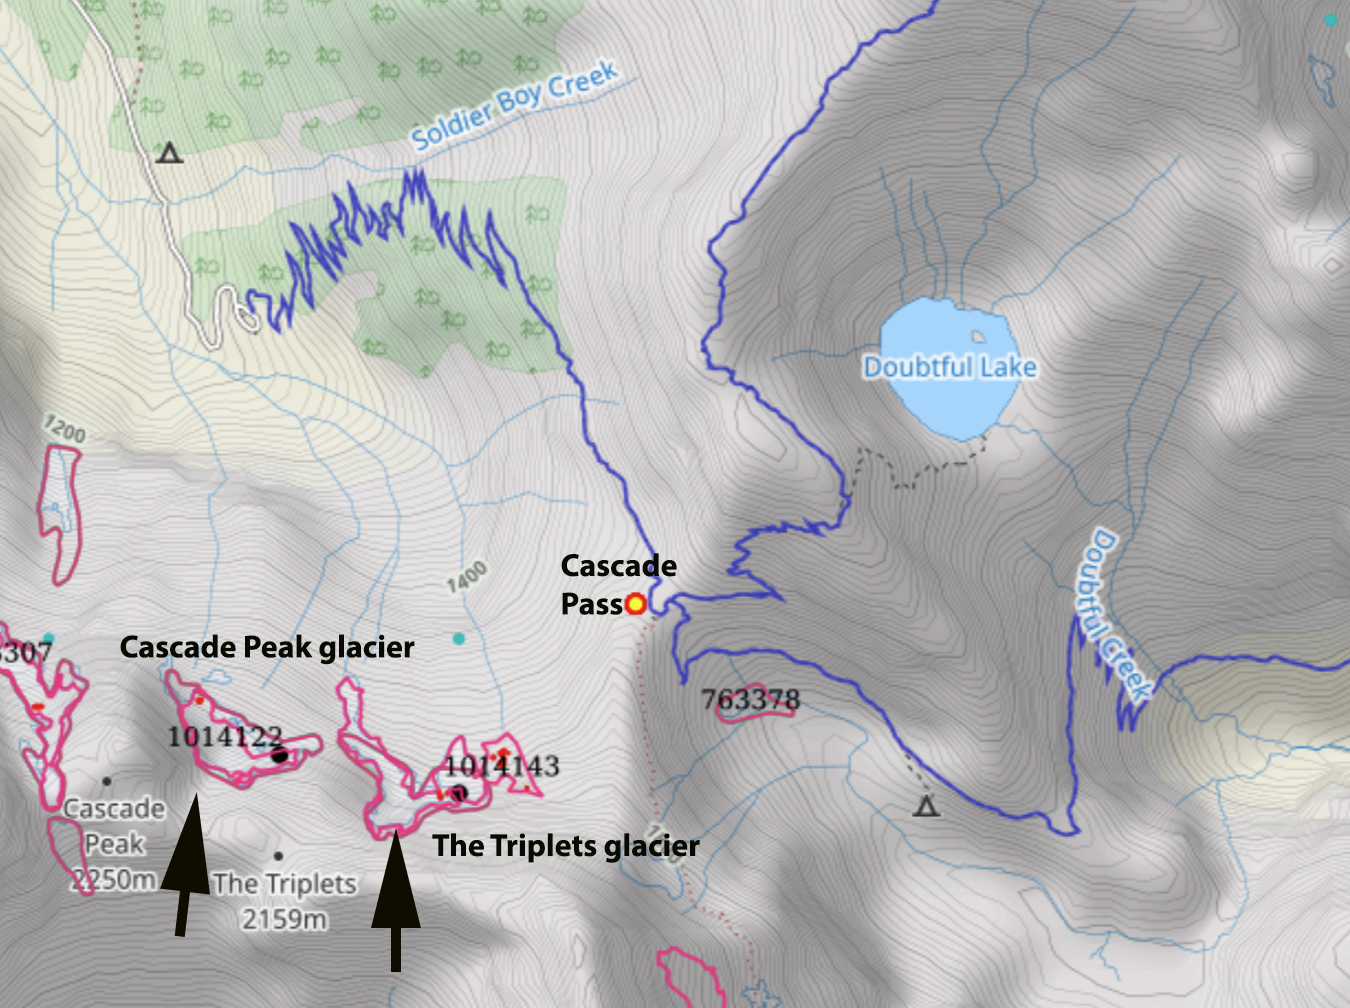
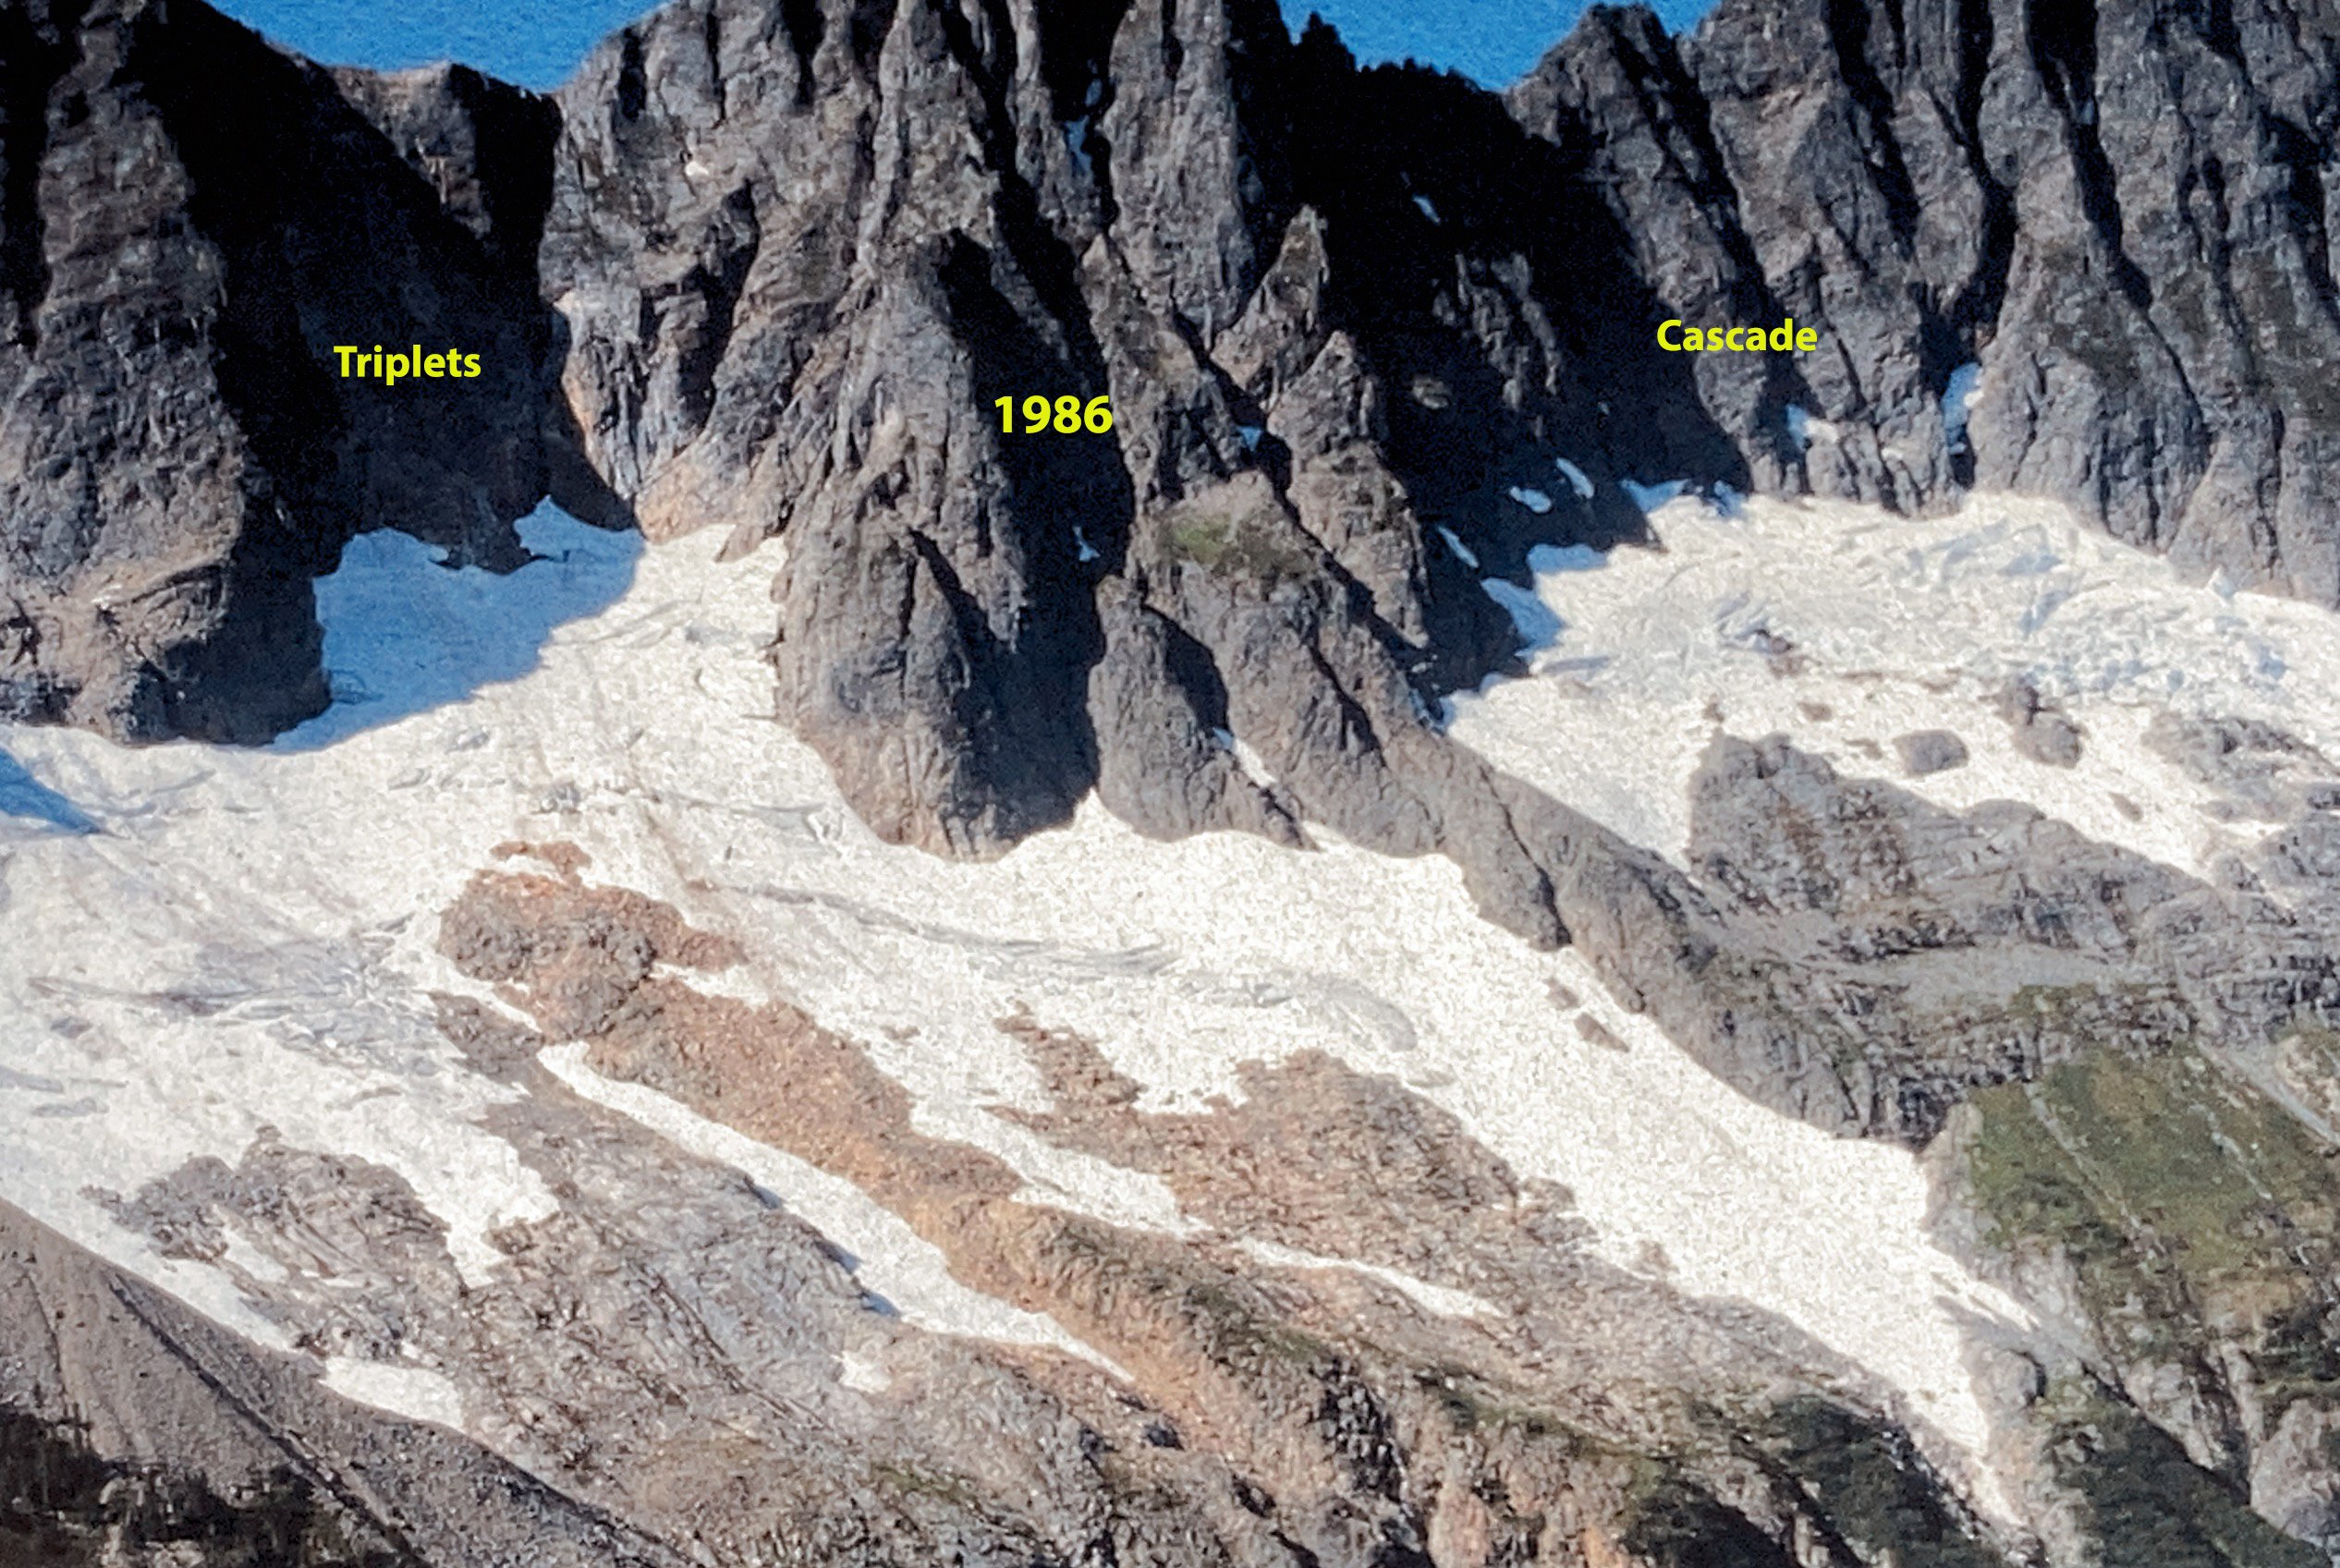
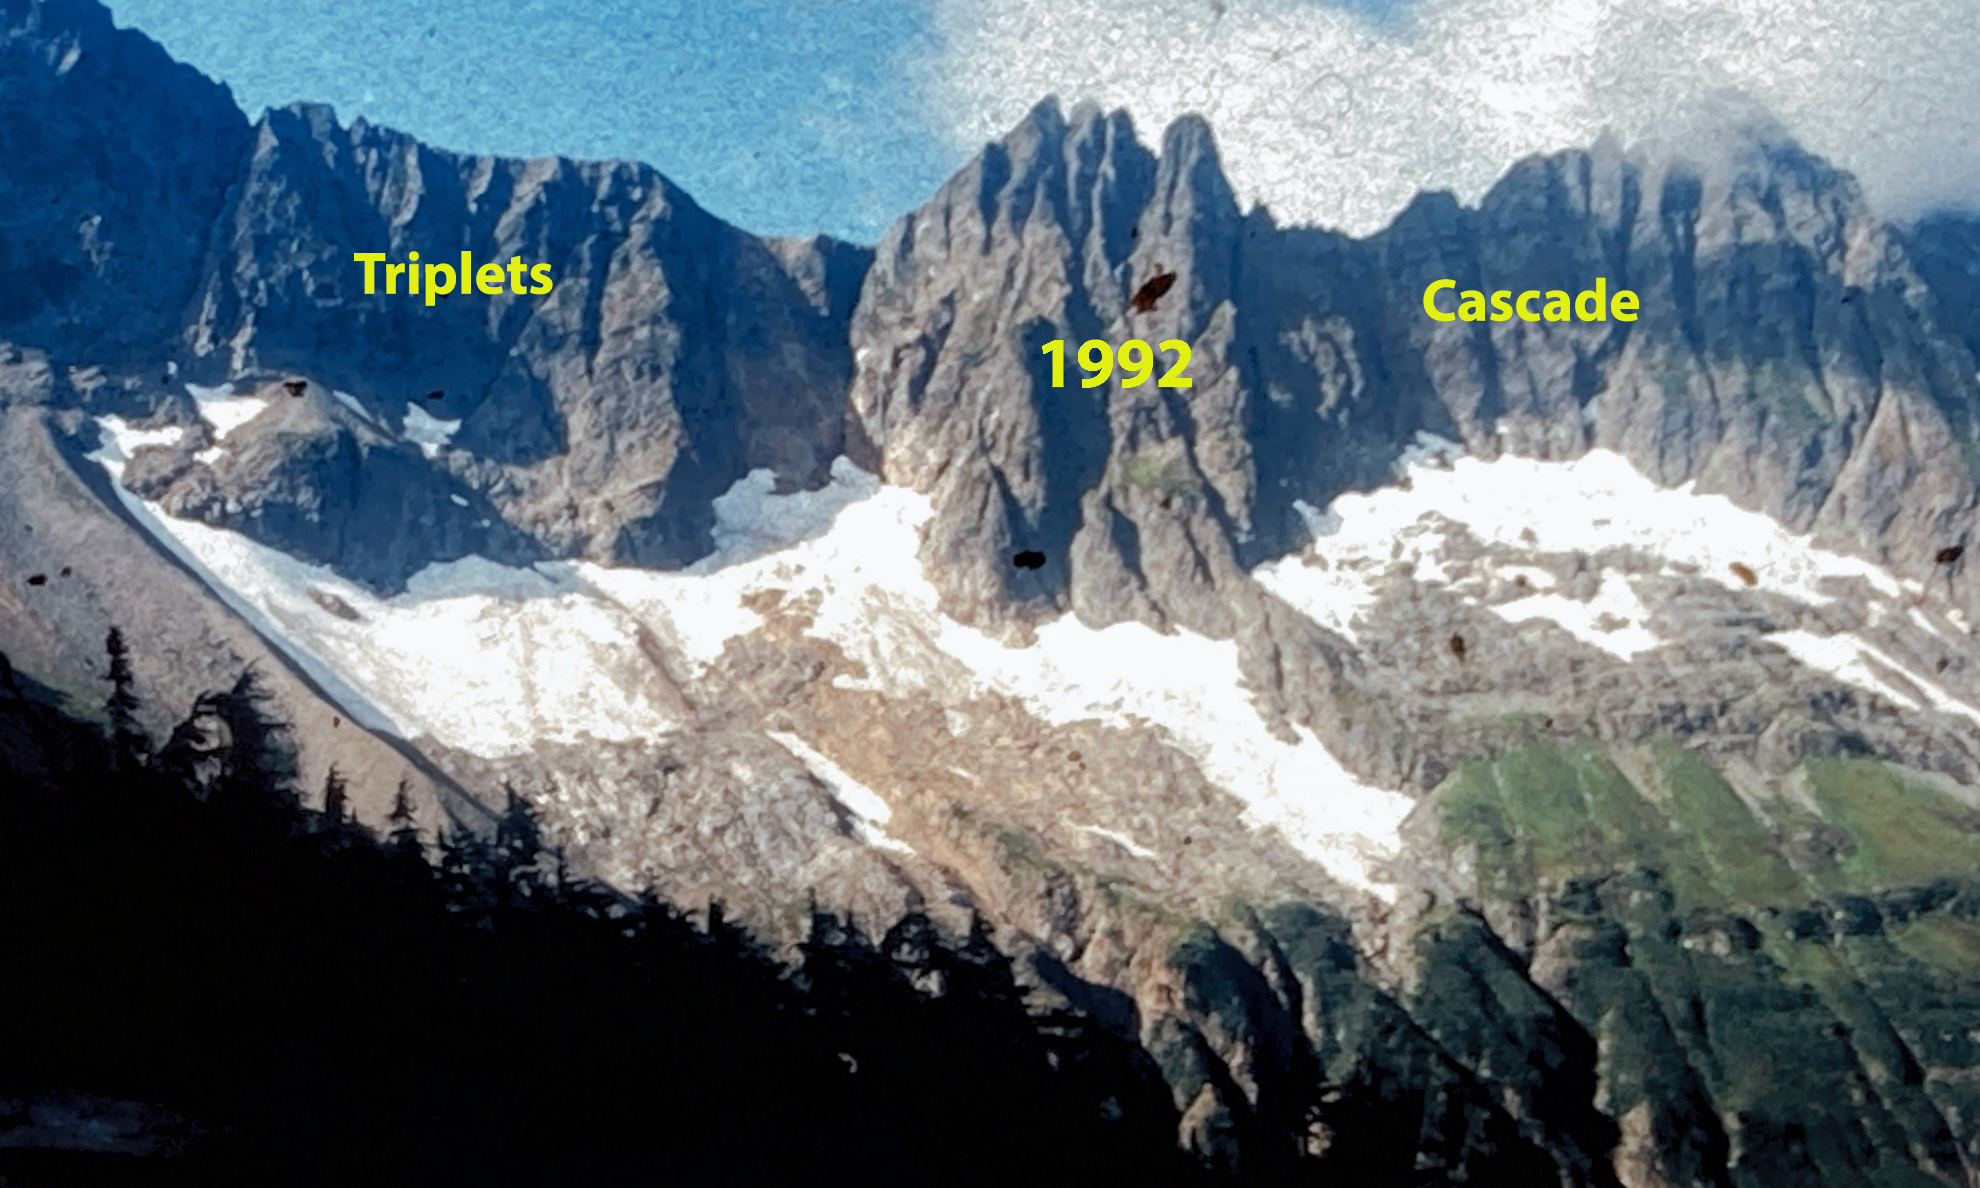
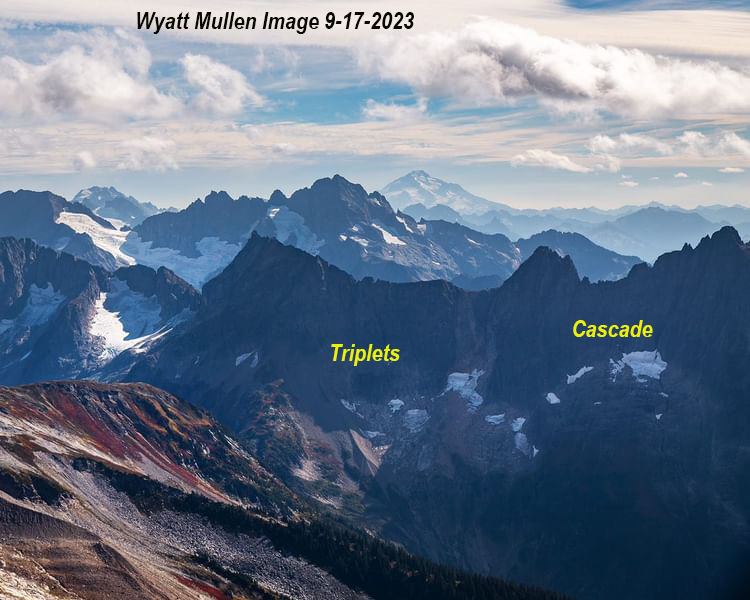
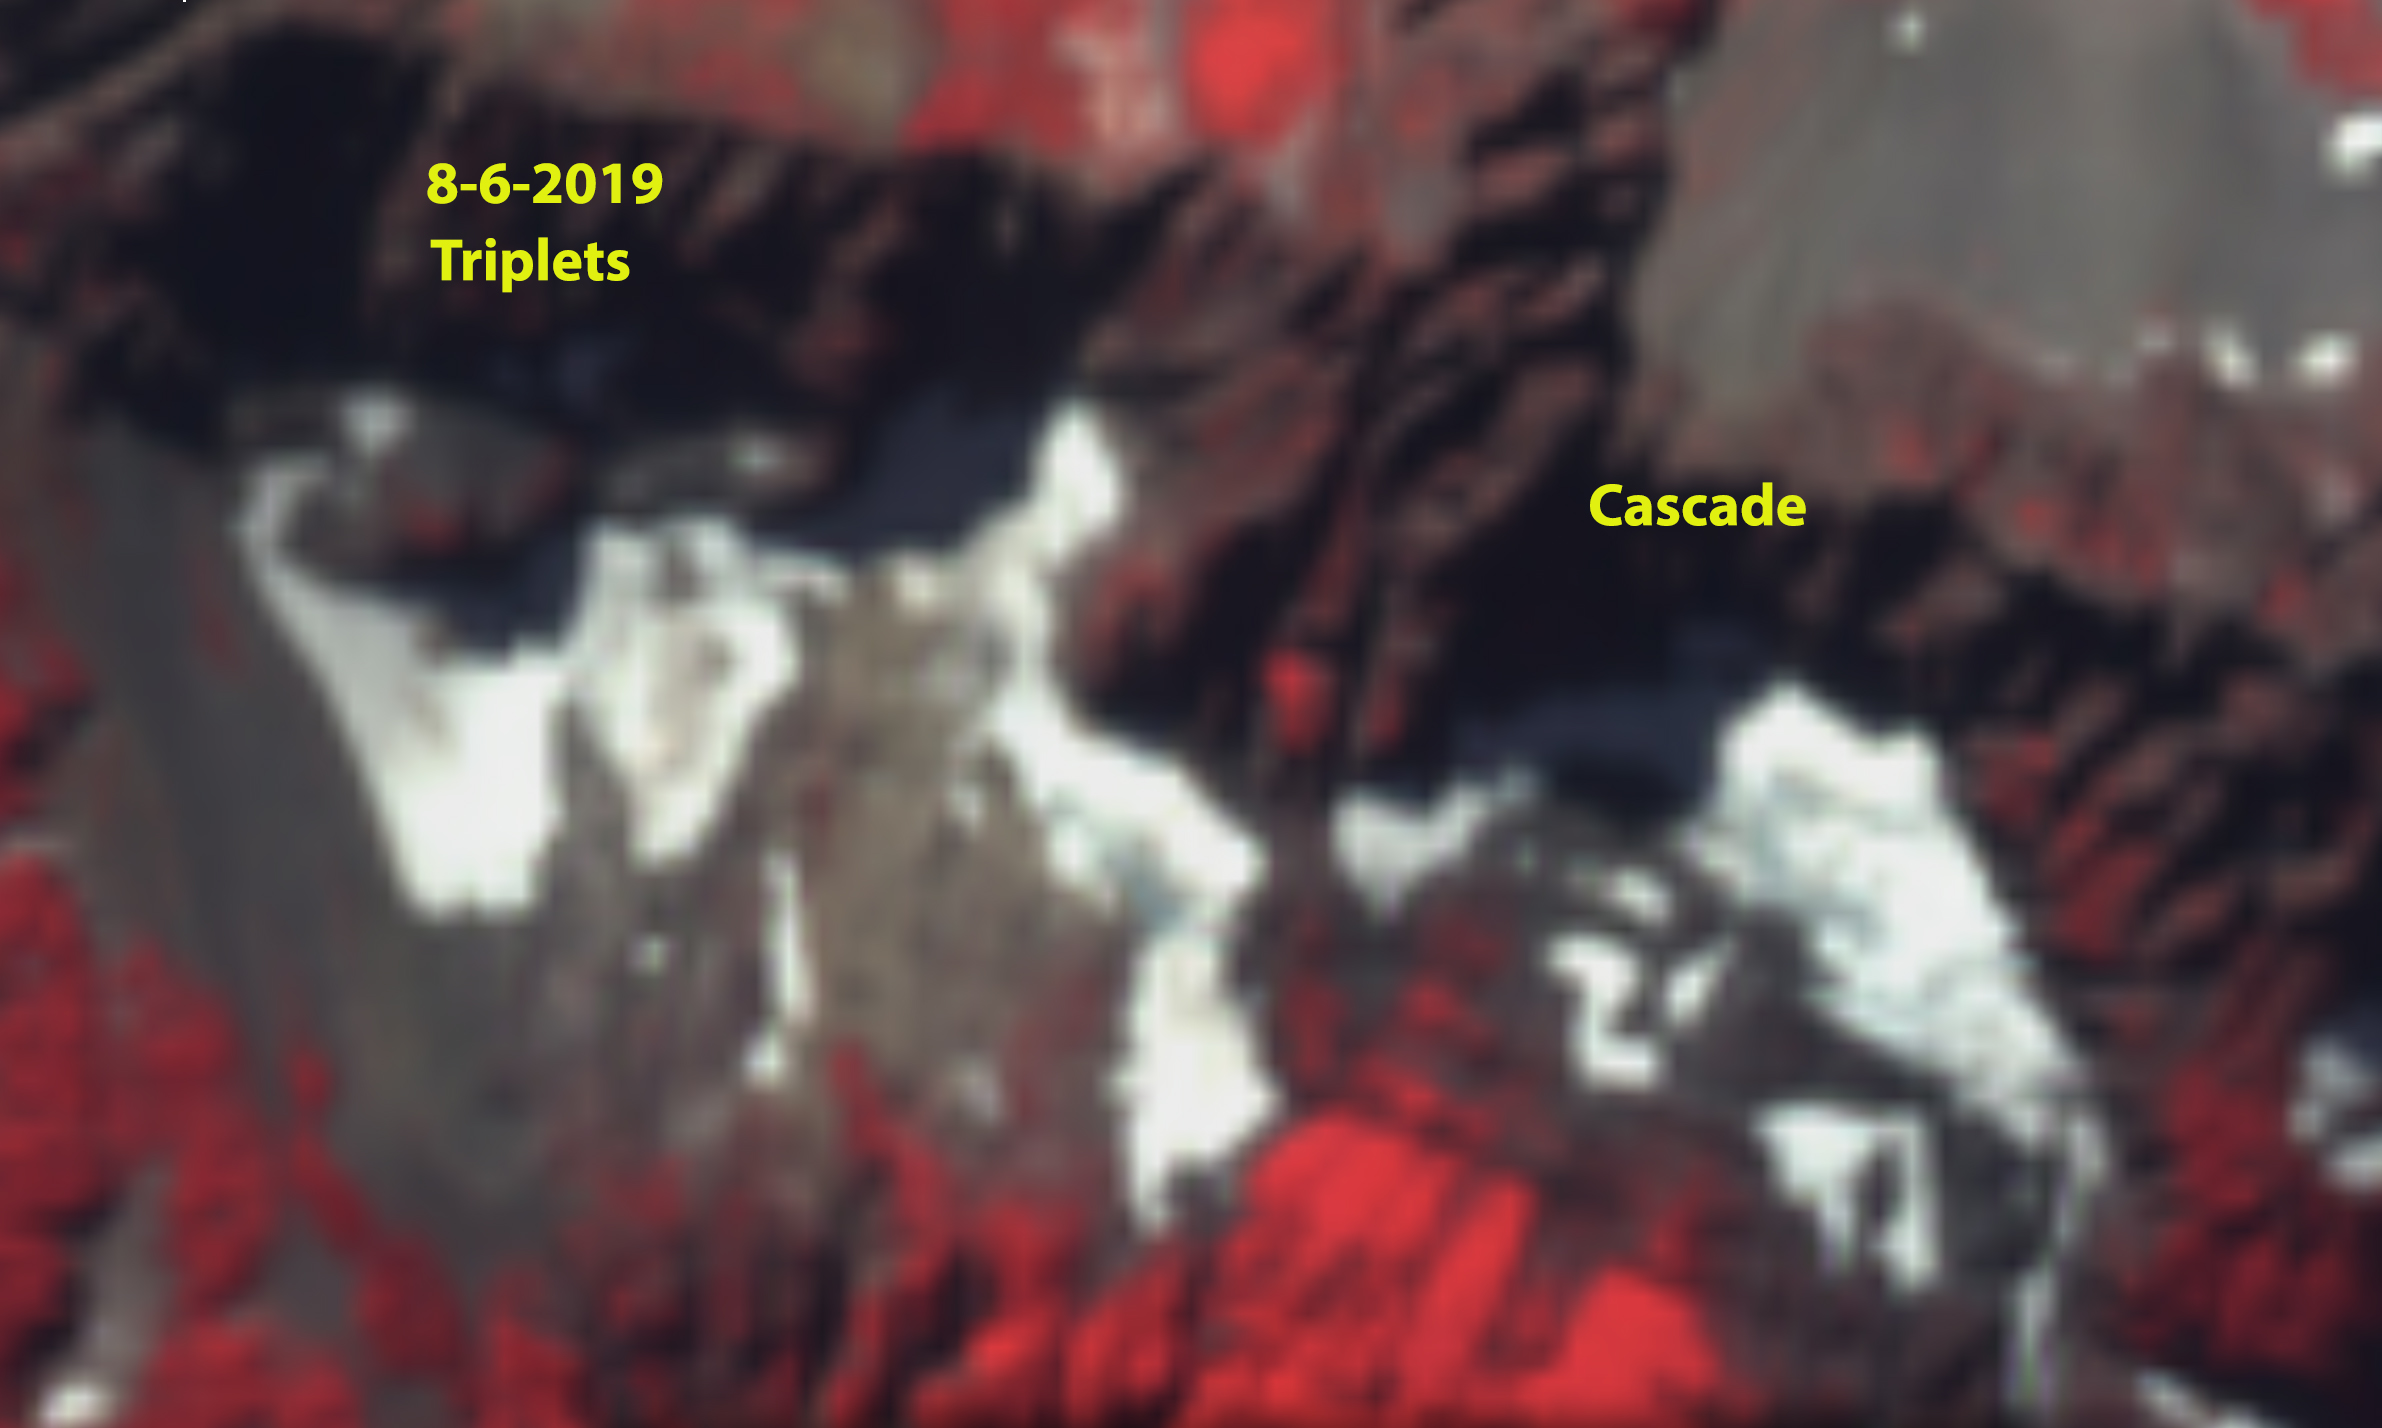
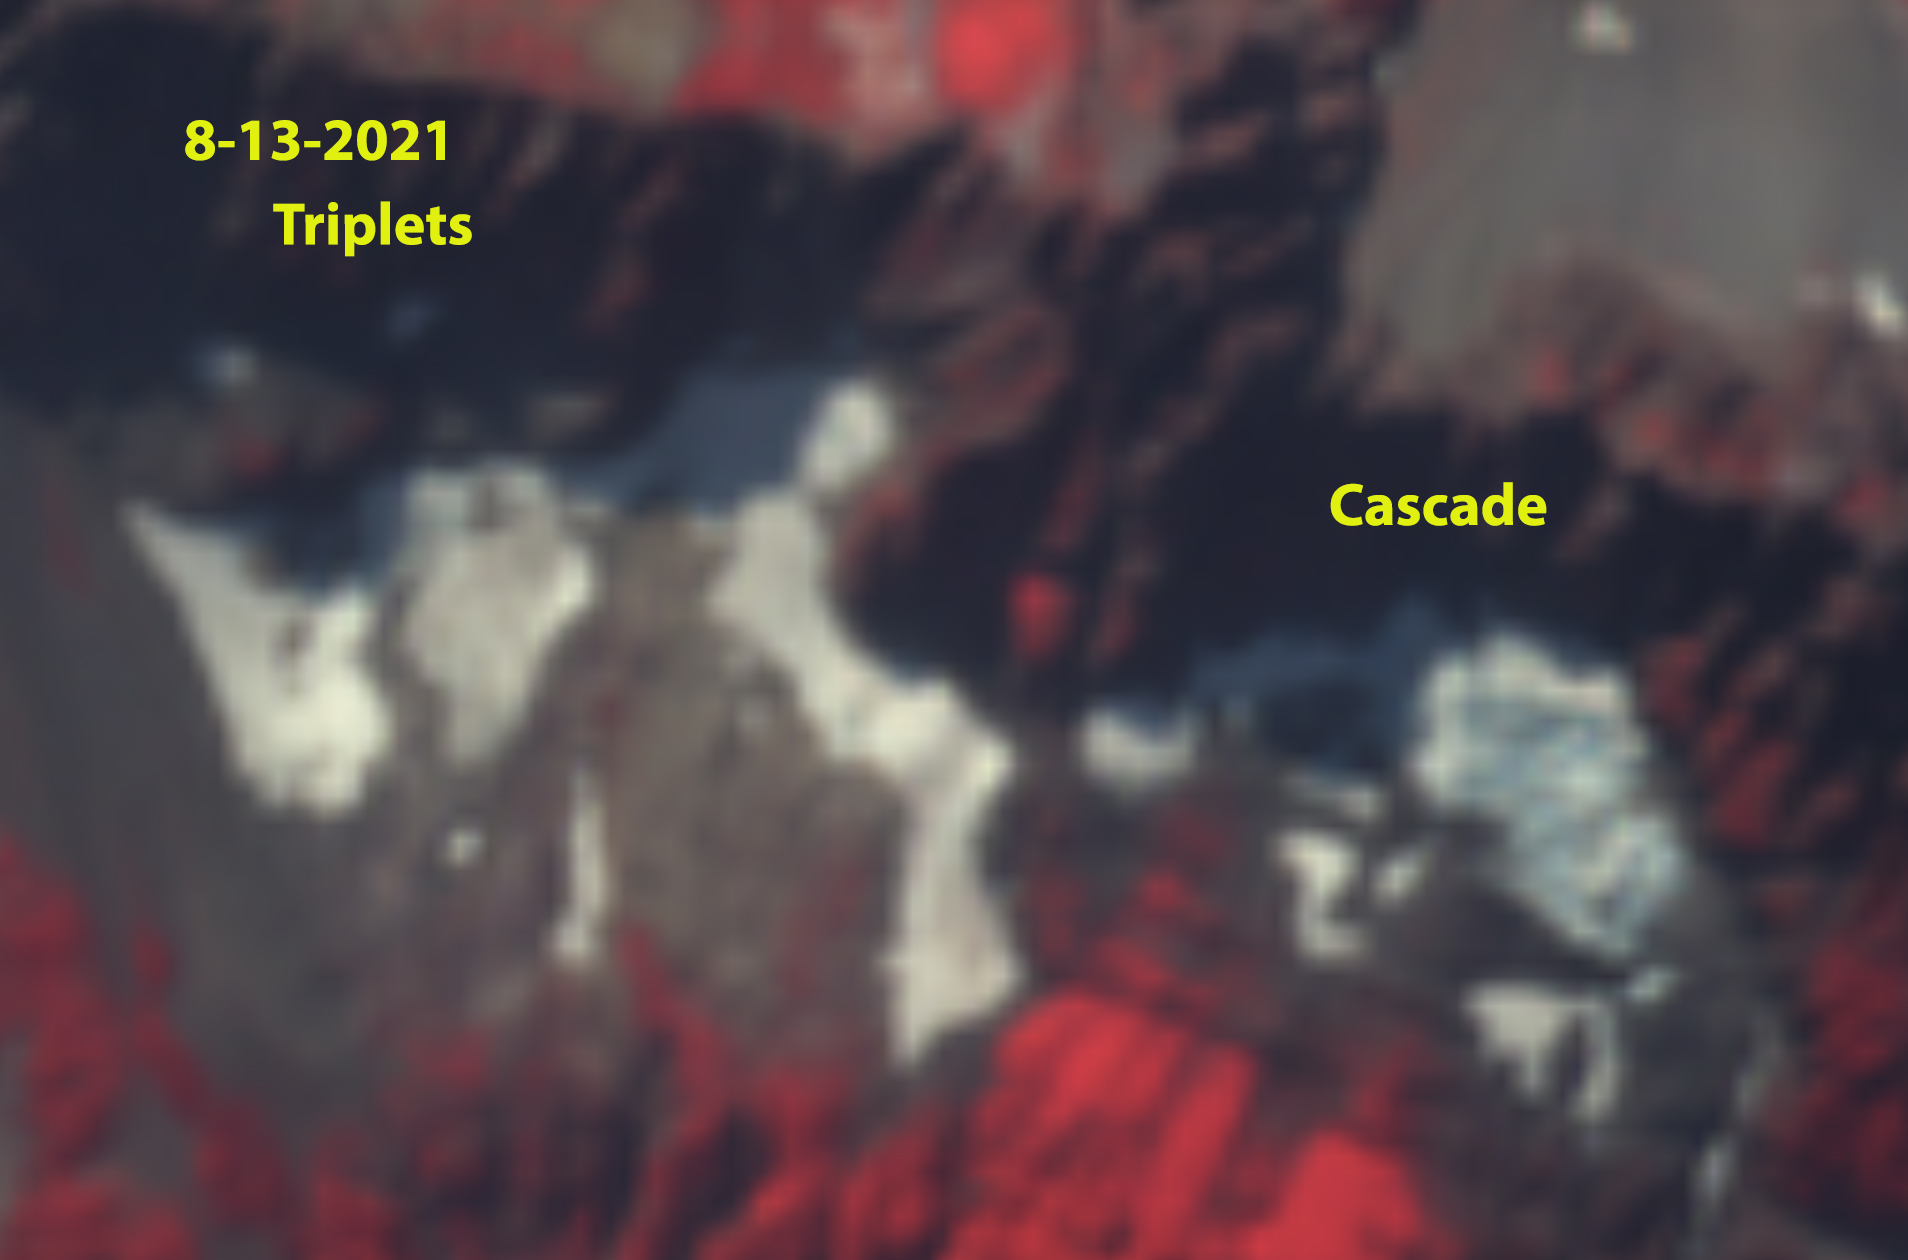
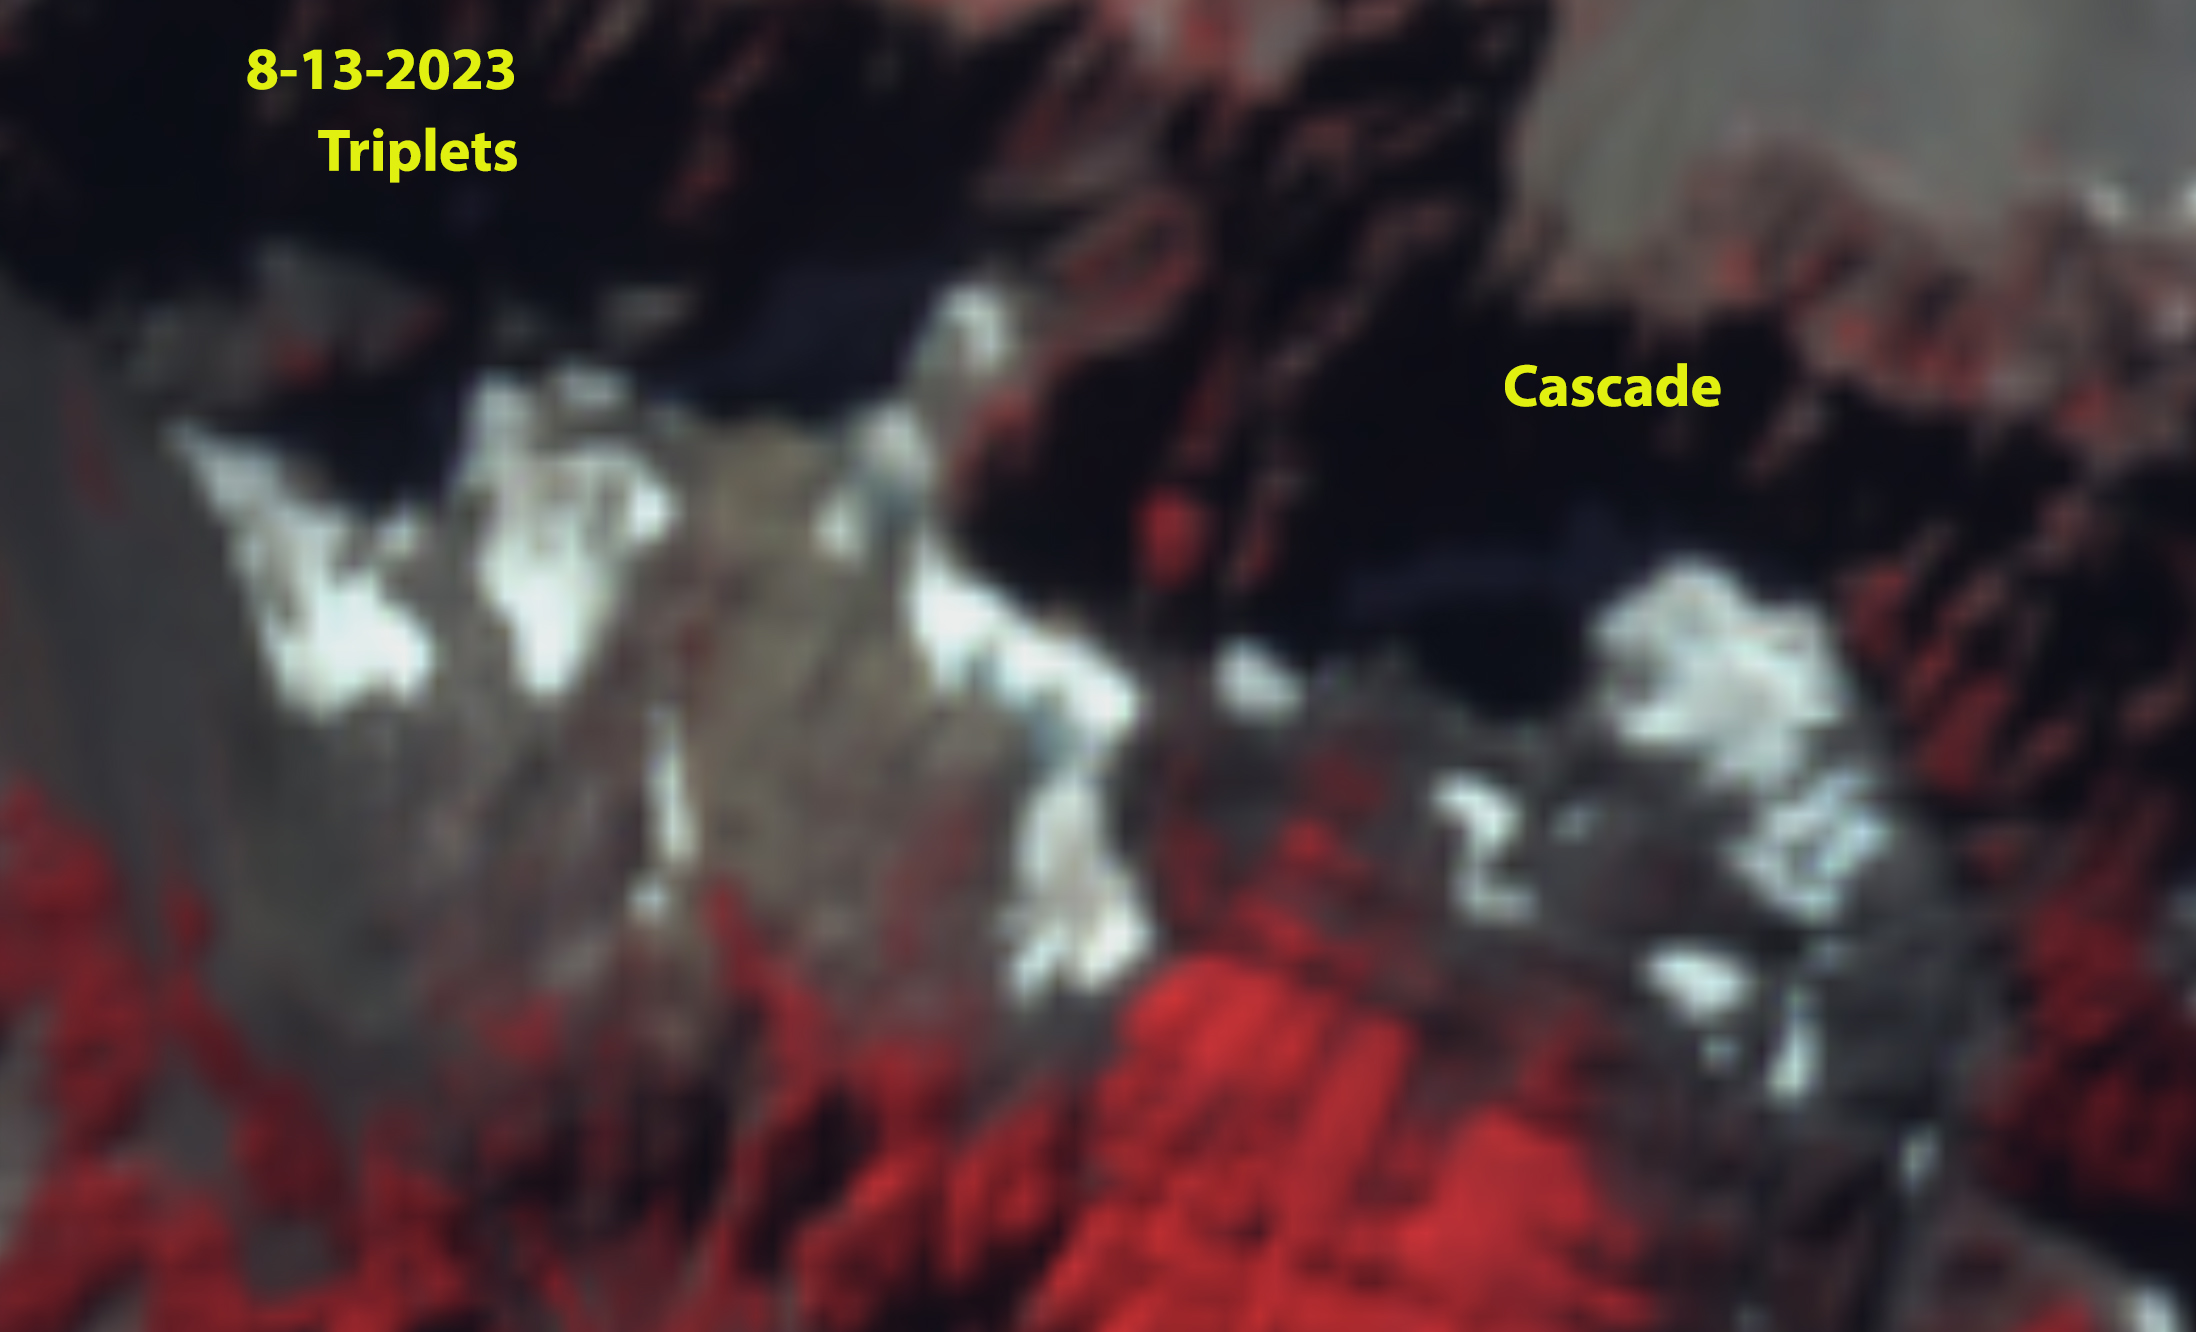
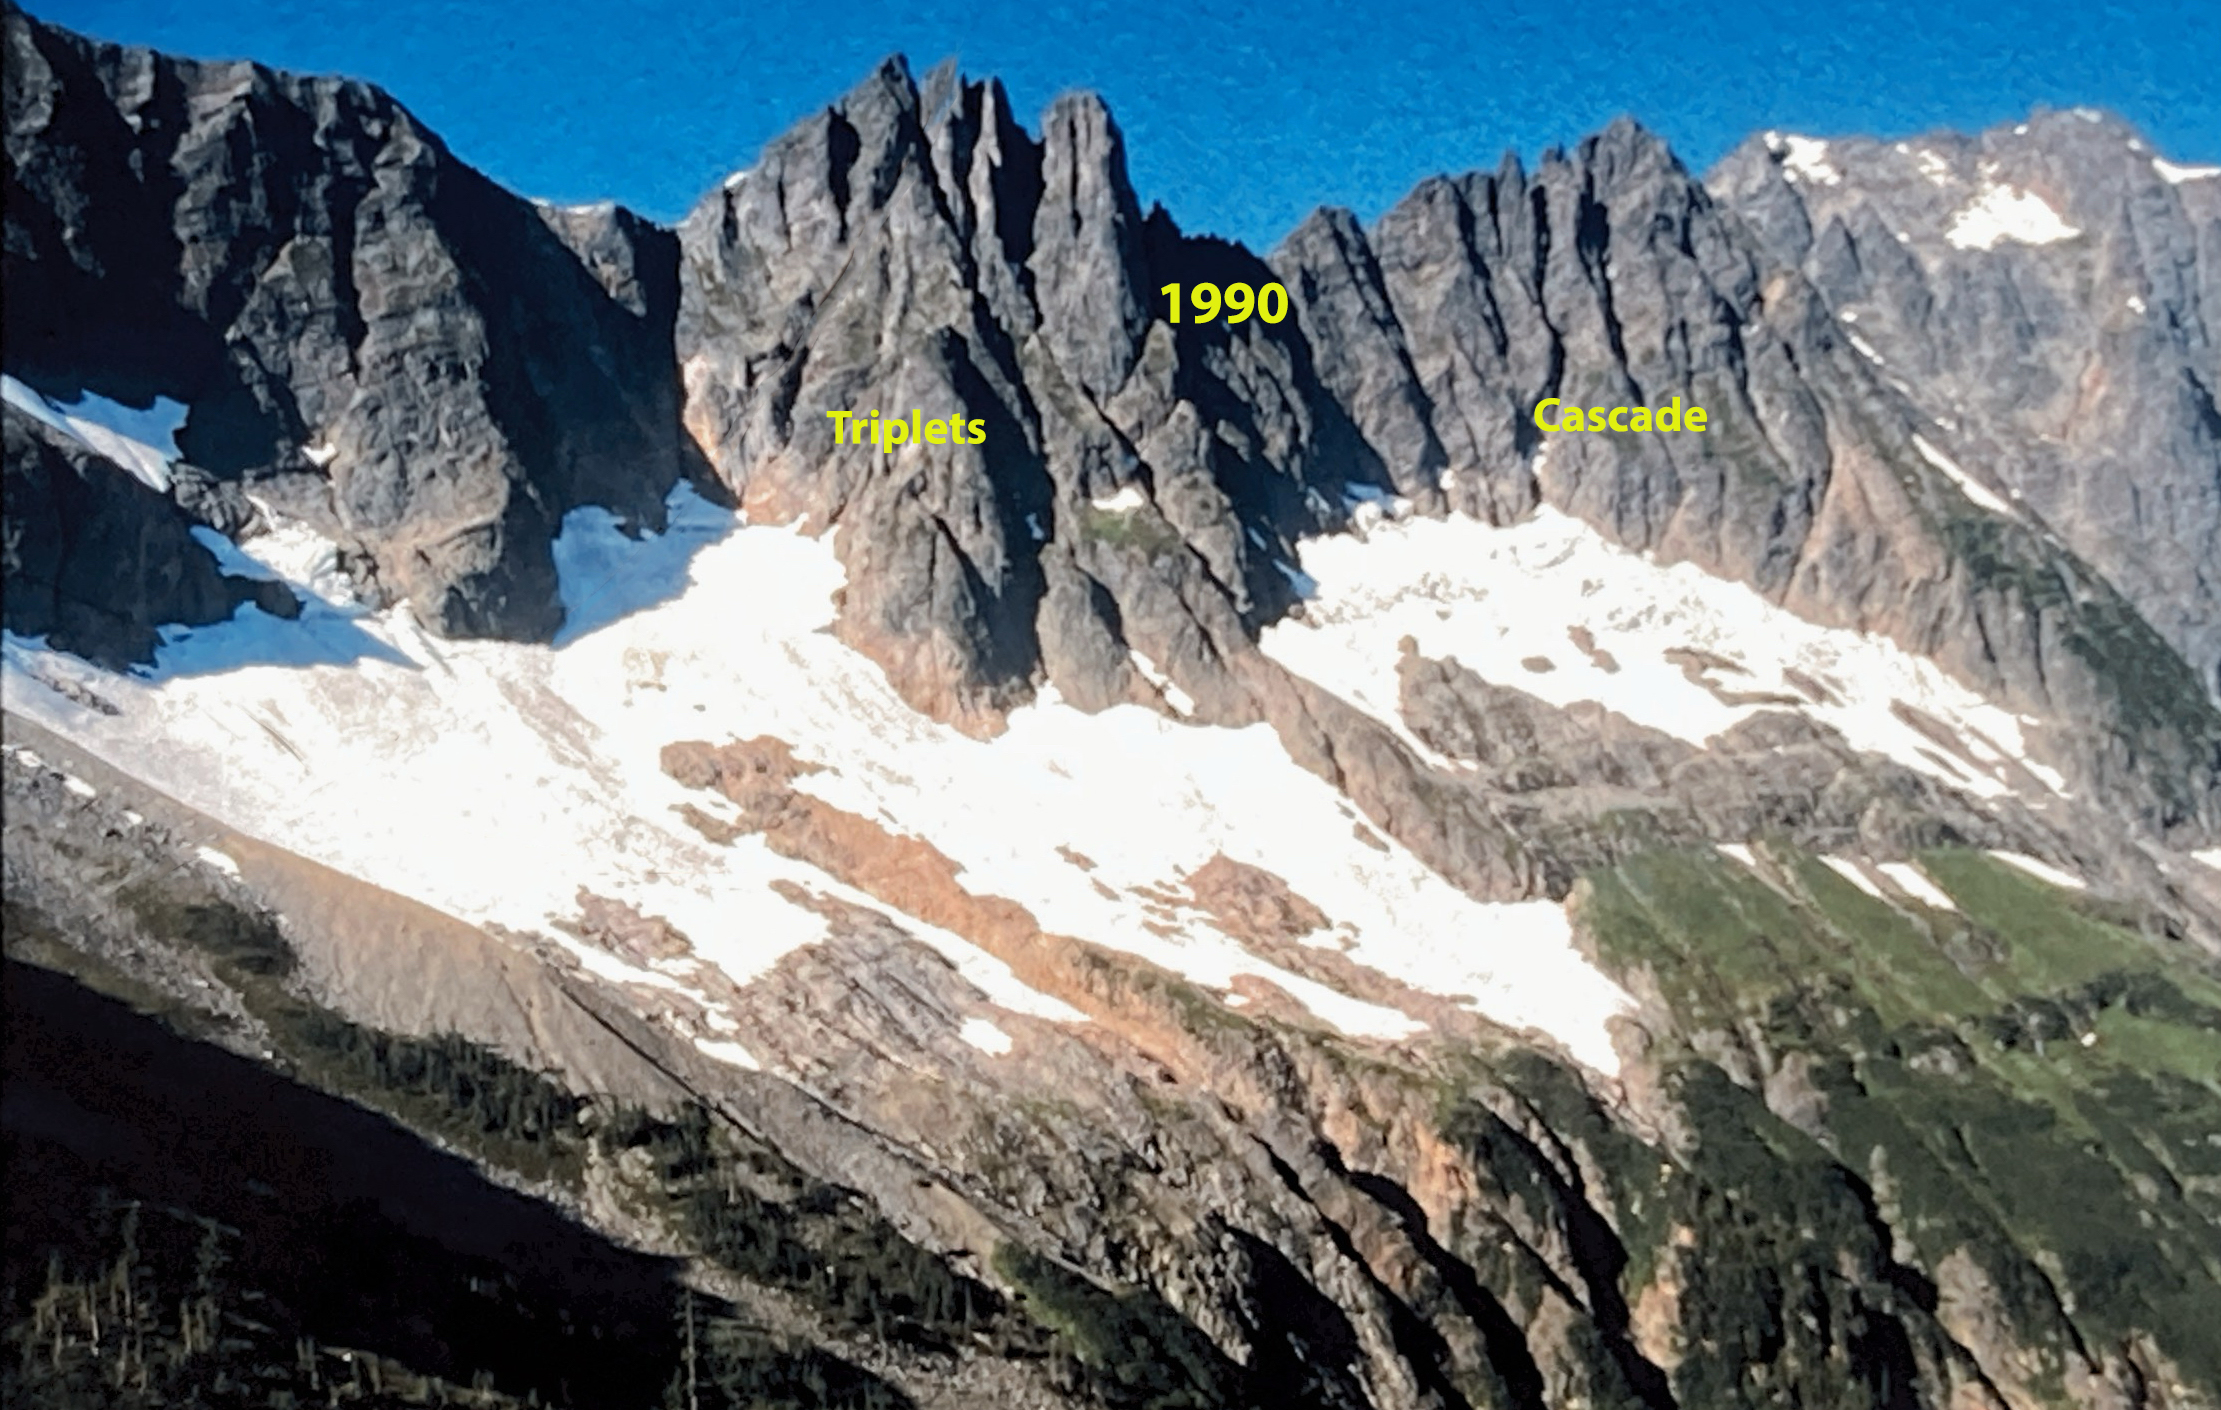