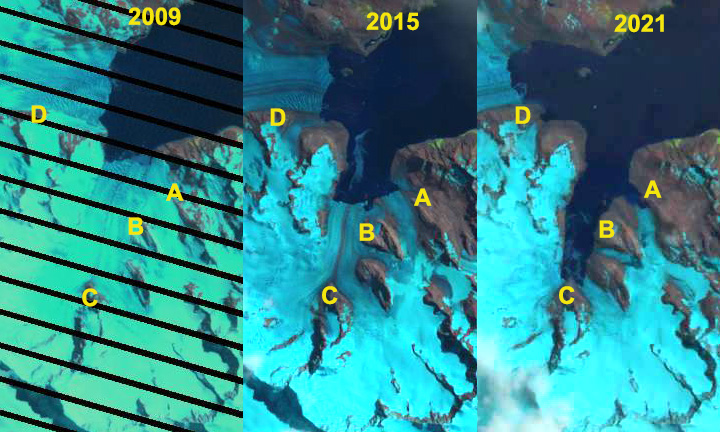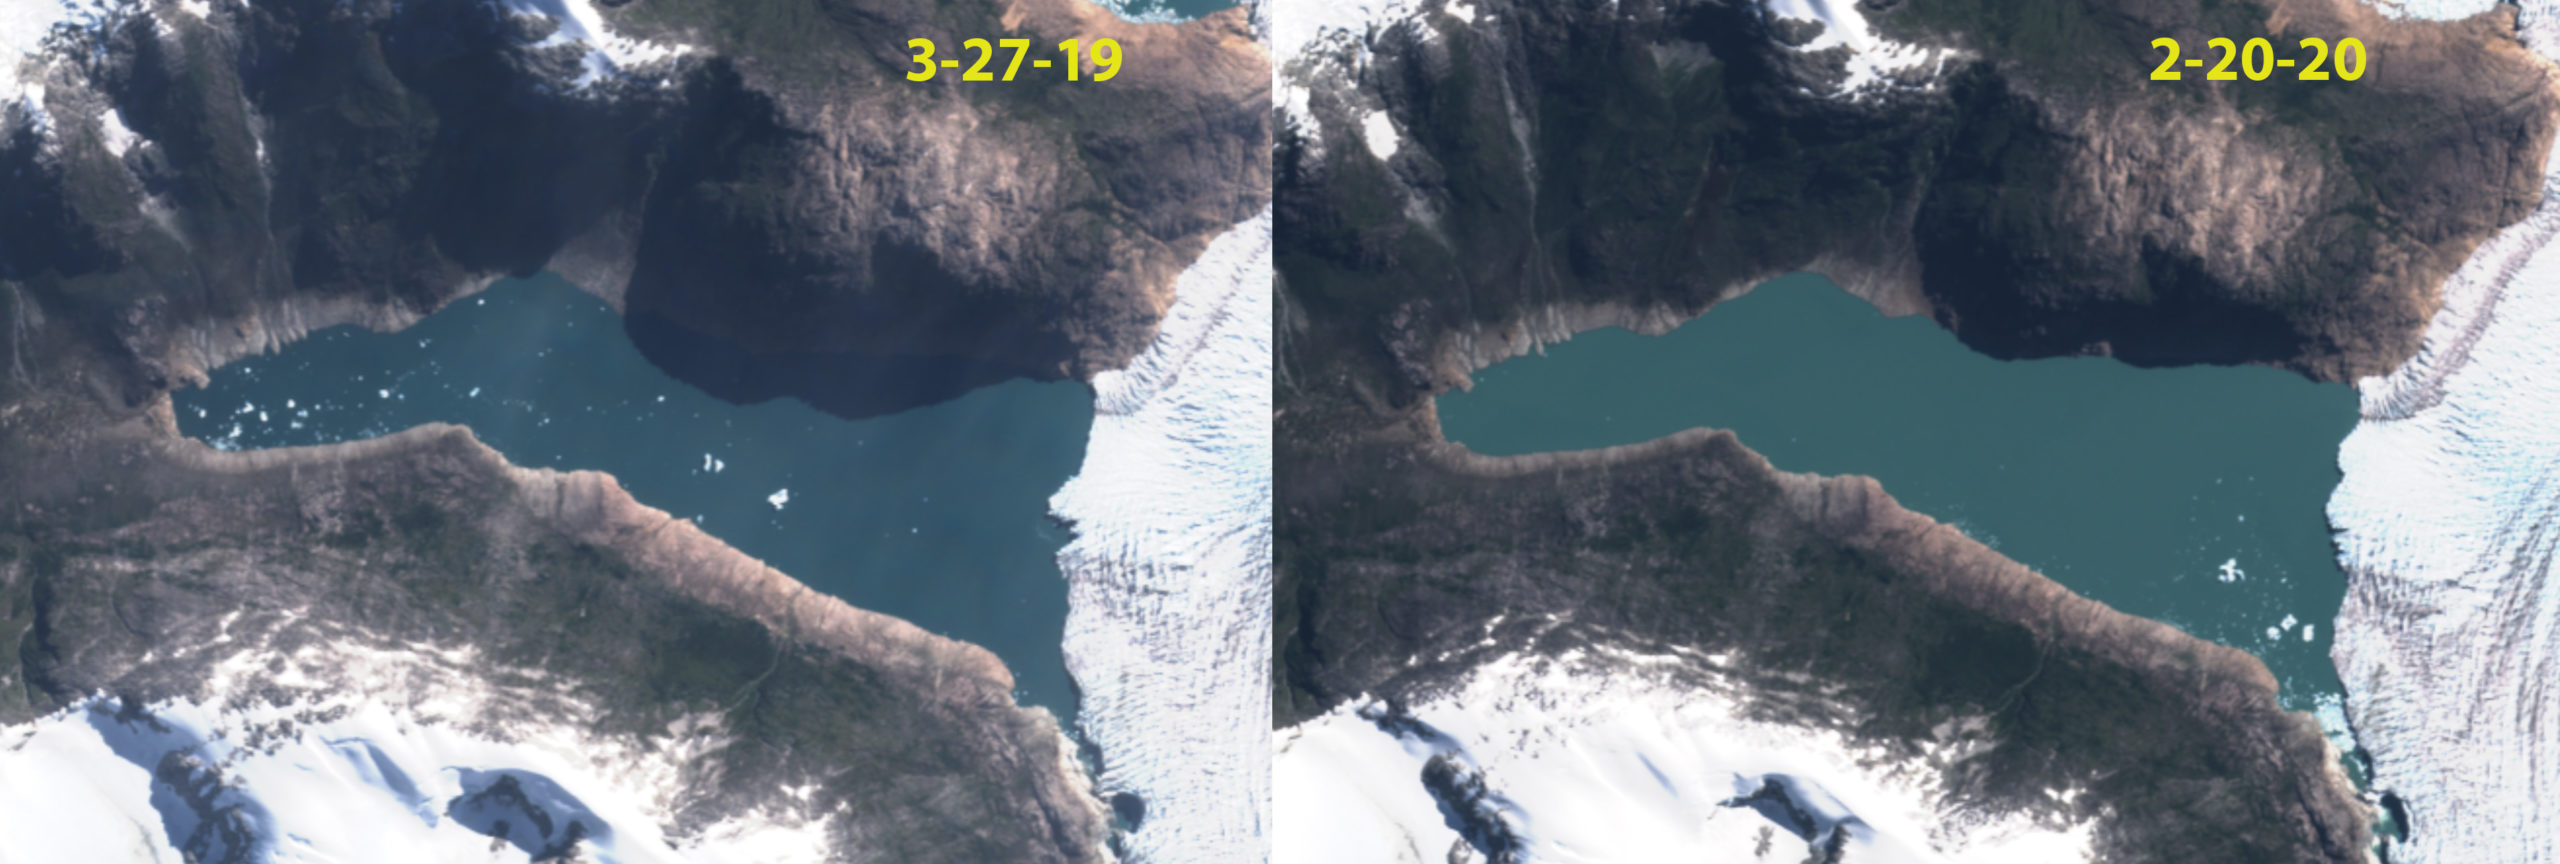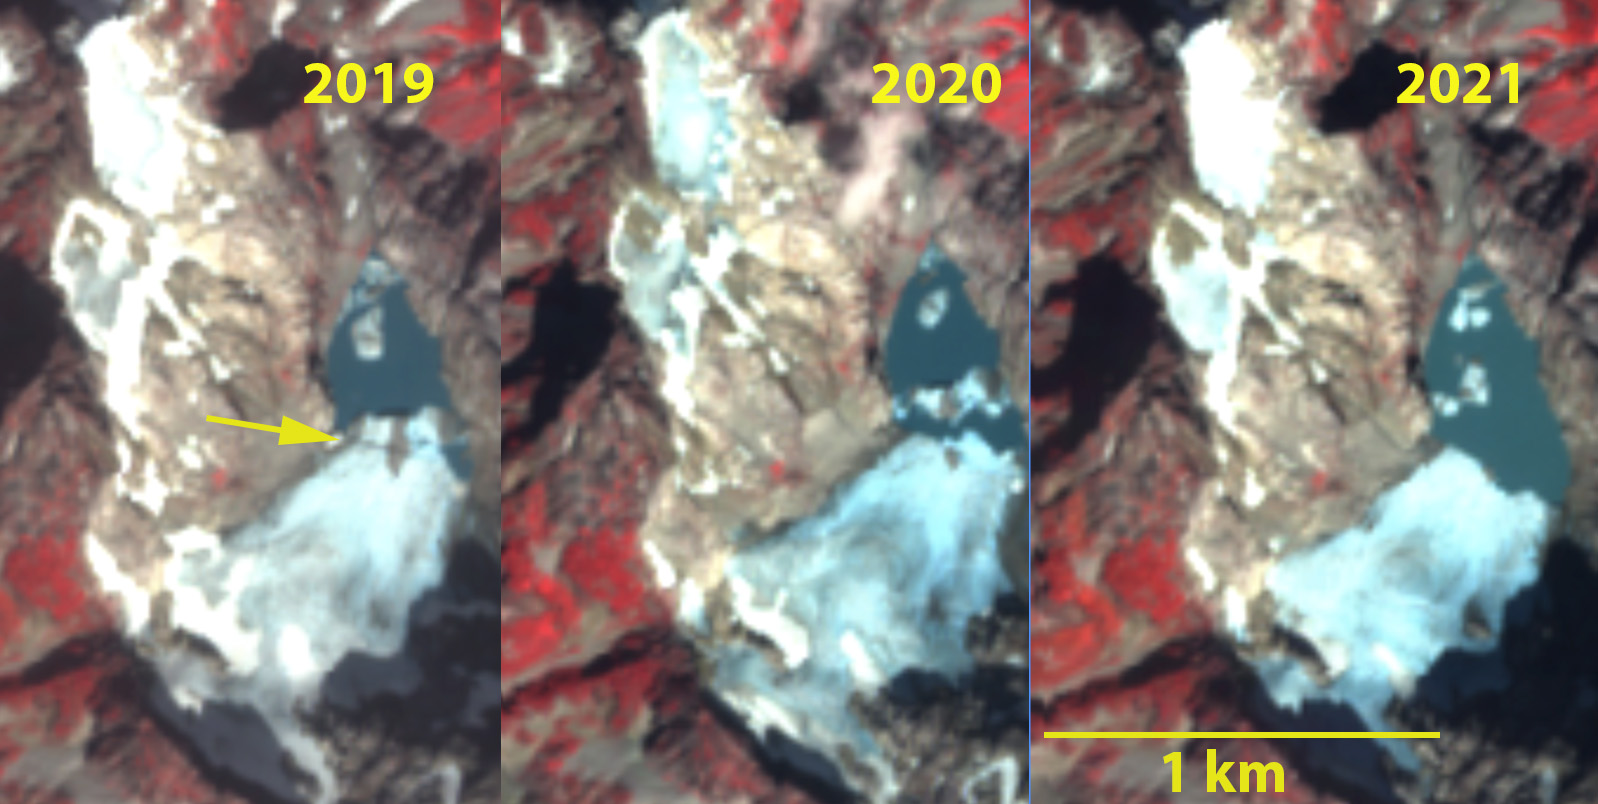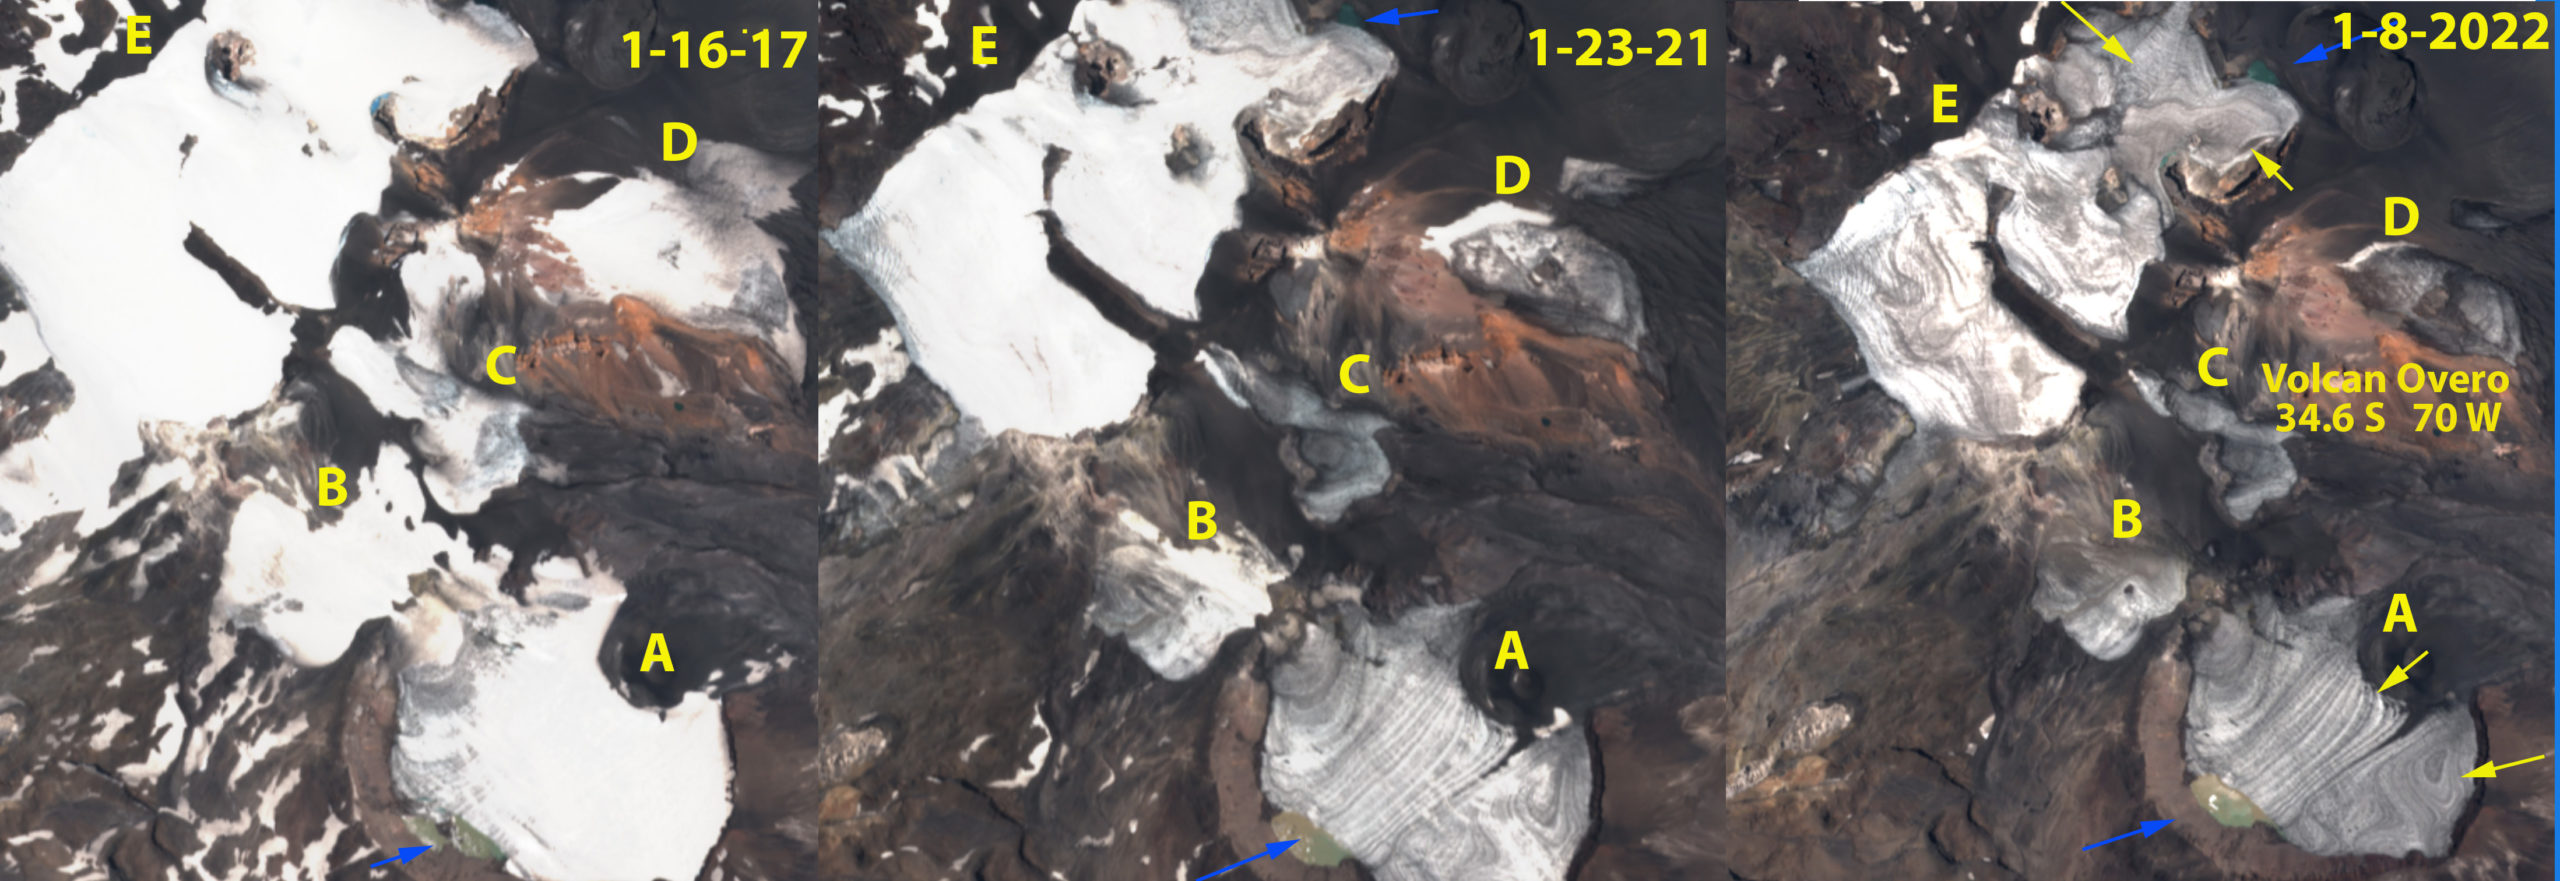
Volcan Overo glaciers in Sentinel images from January-2017, 2021 and 2022 illustrating fragmentation and no retained snowcover in 2022 with half the summer to go.
Volcan Overo is a 4619 m high Andean mountain in Argentina with a relatively low sloped broad summit region above 4000 m. This mountain has been the site of sulfur mining, with both an old tram and mining road leading to the summit region. The summit region is host to a glacier complex that is shrinking and fragmenting. In mid-January, 2022 the glacier has lost all of its snow cover. La Quesne et al (2009) reported significant annual thinning in the latter half of the 20th century on nearby glaciers in Argentina and Chile. Dussaillant et al (2019) identified a slower mass loss -0.28 m/year in this region from 2000-2018, than further south in the Patagonia Andes or north in the Tropical Andes. Here we examine Landsat images from 1986-2022 to identify longer term changes and with Sentinel images from 2017-2022 the recent changes including the impact of the recent January heat wave (Washington Post, 2022).
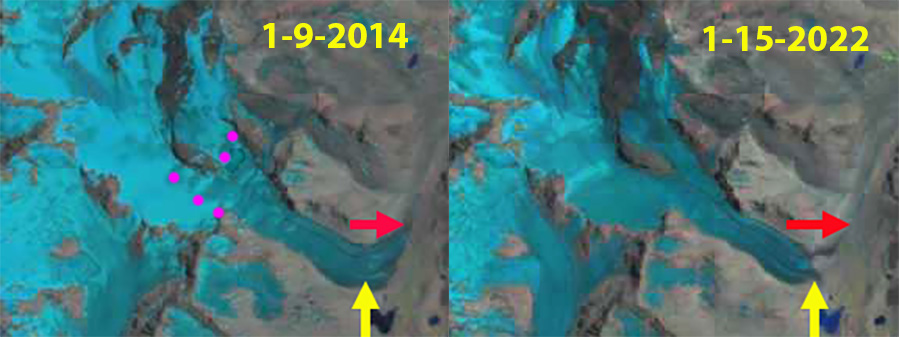
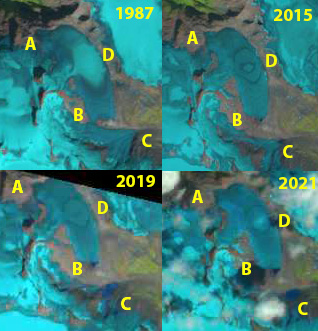
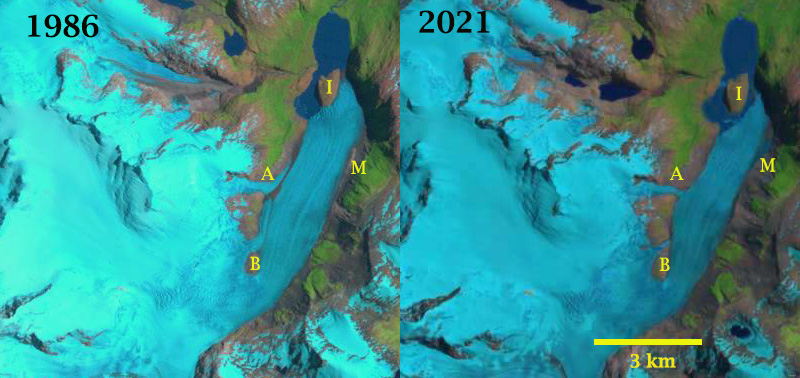
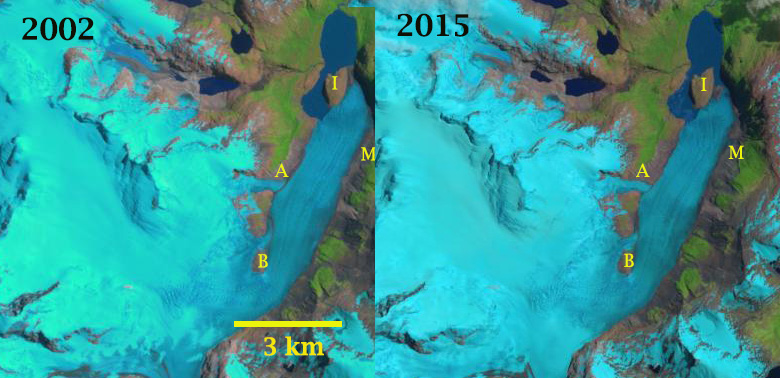
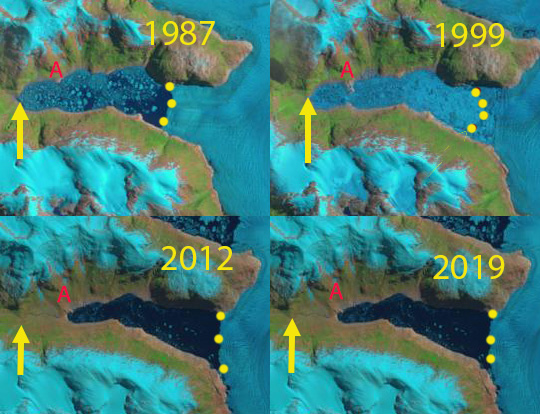
In 1986 there are four discrete glaciers around the caldera, covering ~12 km2 the largest E around the summit ranges in elevation from 4200-4500 m. D is an isolated area at 4000-4100 m. A,B and C is a single glacier extending from 3900-4300 m. F is an area of rapidly diminishing glacier ice. In the early February image snowcover is good across all ice areas except F. In 2003 there is limited evident change with good snowcover across all except D. By 2013 A, B and C have fragmented into three separate glaciers and F is nearly gone. Only E has significant snowcover. In 2022 C and D have declined to less than 50% of their 1986 area, the overall Volcan Overo glaciated area has decline to ~8.1 km2. It is not quite mid-summer on January 8, 2022 yet all snowcover has been lost from the glaciers of Volcan Overo. The glacier remnants at F are now gone.
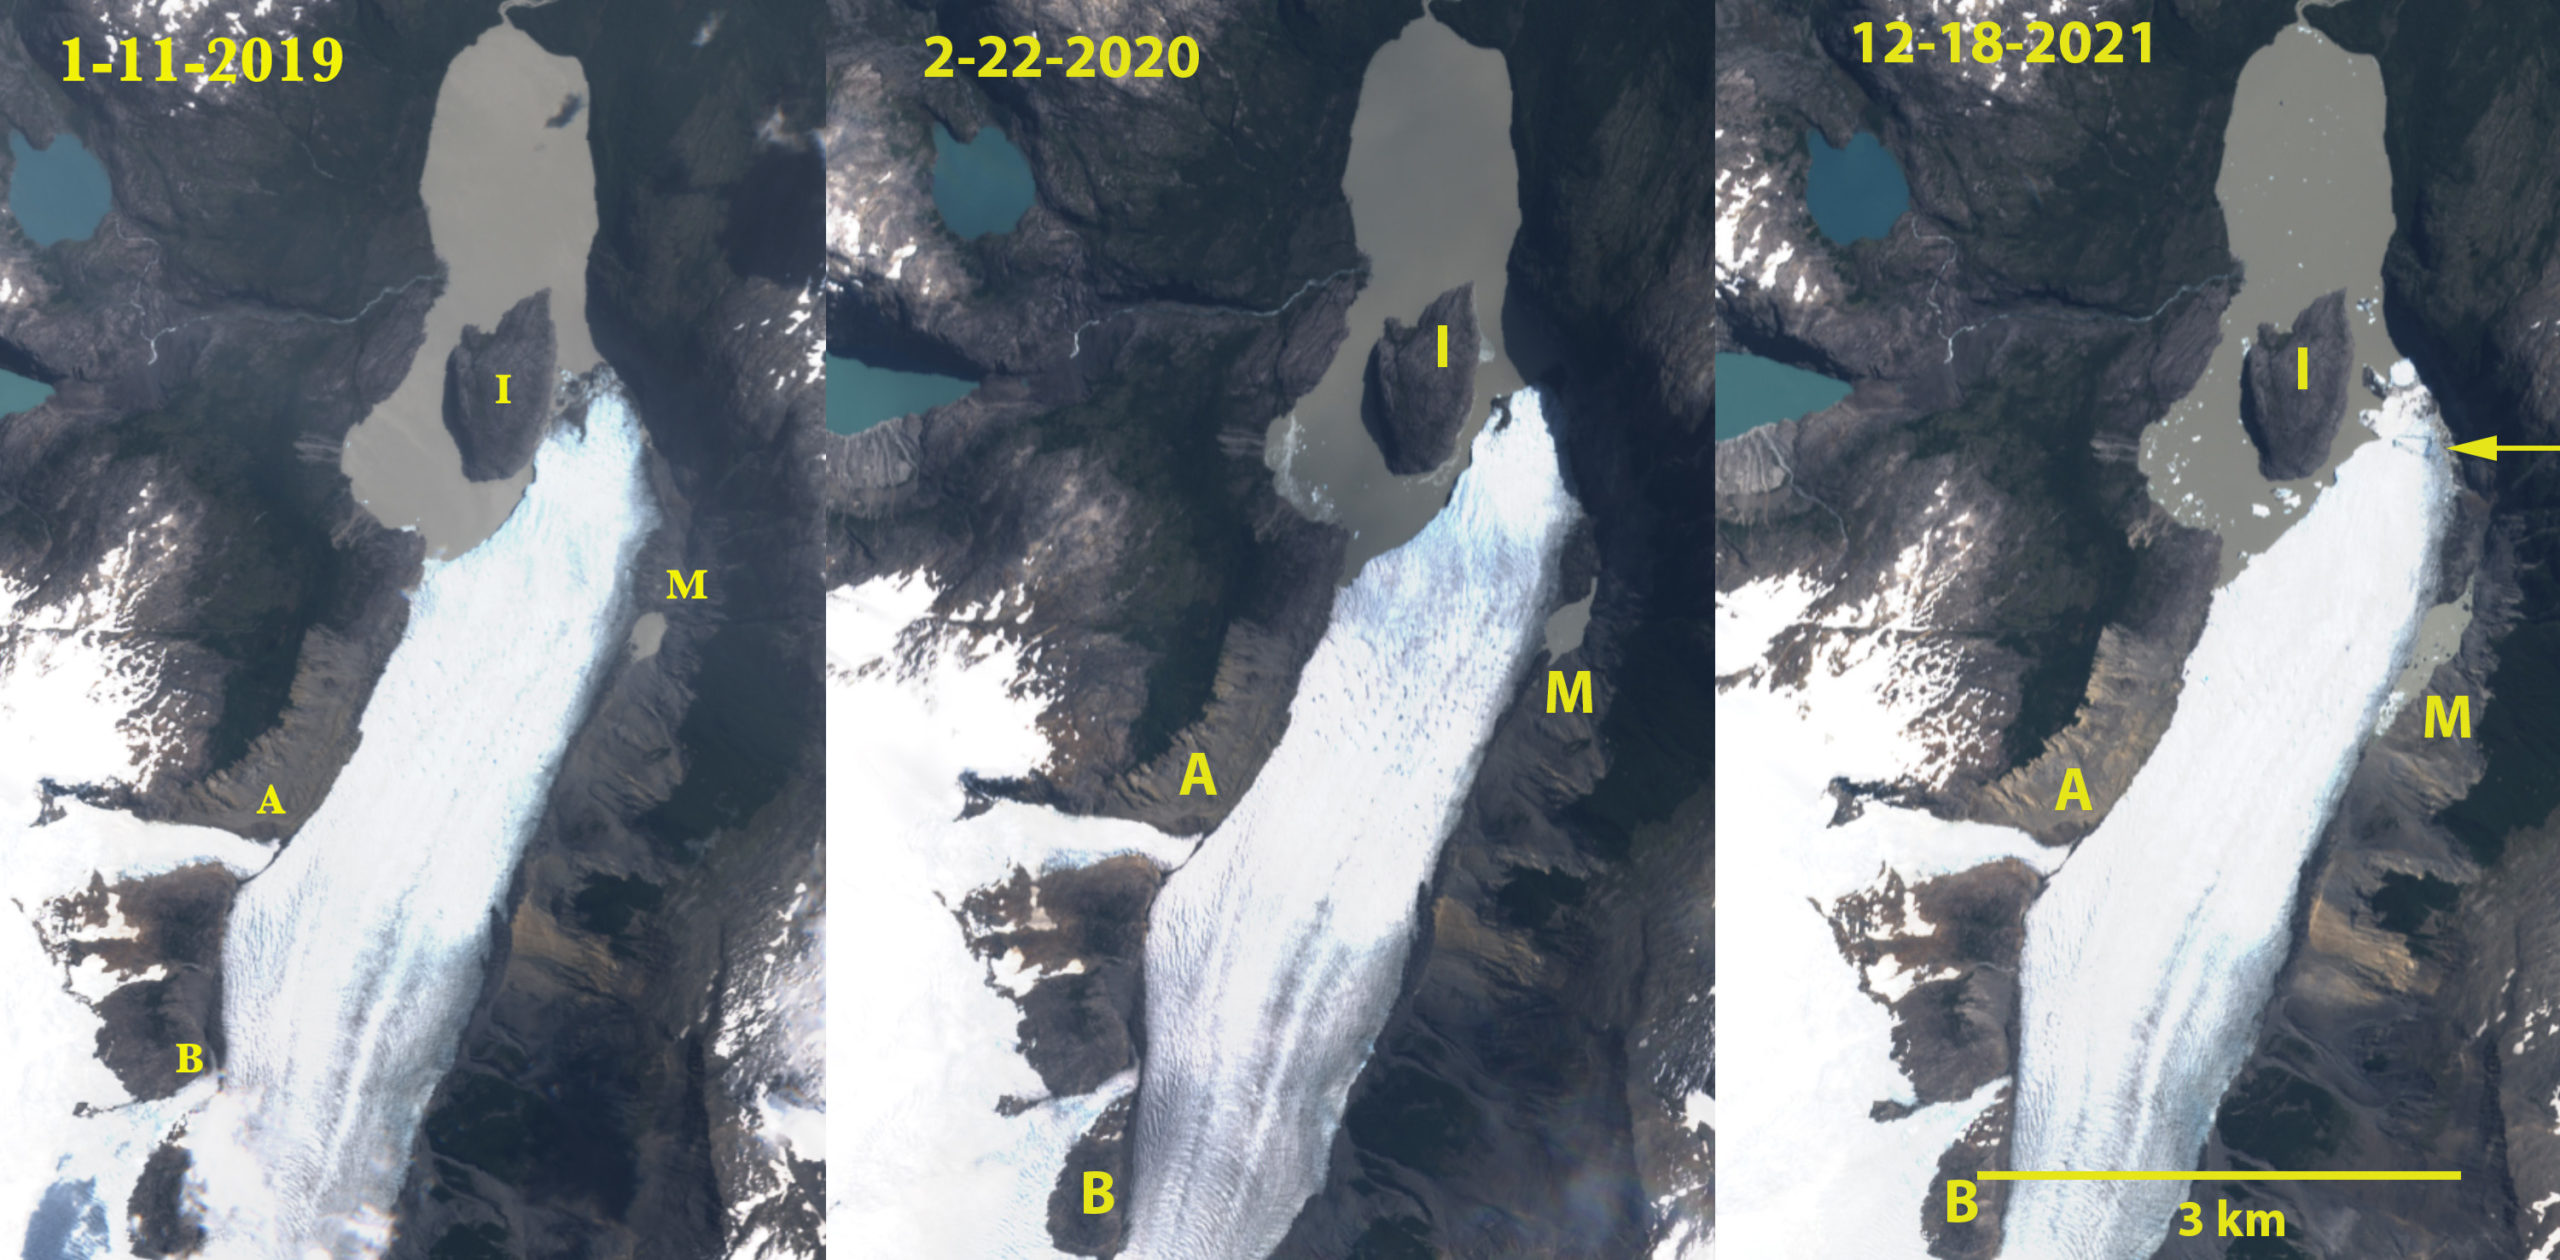
Sentinel images in January of 2017 indicate good snowcover across the caldera glaciers with a total glacier area of 9.4 km2. In January 2018 snowpack has been lost from A-D, exposing annual layers on A. Only the higher elevation E has retained snowcover. In January 2019 snowcover is good across all of the glaciers. In January 2020 snowcover is minimal on all glaciers except E. In January 2021 A, C and D have lost nearly all snowcover while B and E both are at least 50% snowcovered. In January 2022 there is no retained snowcover on any of the glaciers. The glacier area has been reduced as well. Glacier A, B, C and D no longer retain snowcover consistently and cannot survive current climate. Glacier B, C and D will continue rapidly diminishing. Glacier A is much thicker and will take longer to disappear. The persistent lack of an accumulation zone indicates the glacier cannot survive (Pelto, 2010). Glacier E continues to recede at a slower rate, and continues to maintain snowcover most summers, but not in 2022.
The minimal snowcover of January 2022 on Volcan Overo matches that of Corataderal Glacier, Chile 30 km due west.
.
Volcan Overo glaceir complex in Landsat images from 1986-2022. The three main glaciers in 1986 have fragmented into five glaciers by 2022 and one glacier (F) has disappeared. Glacier area declined by ~30% and no snowcover is retained in mid-January of 2022.
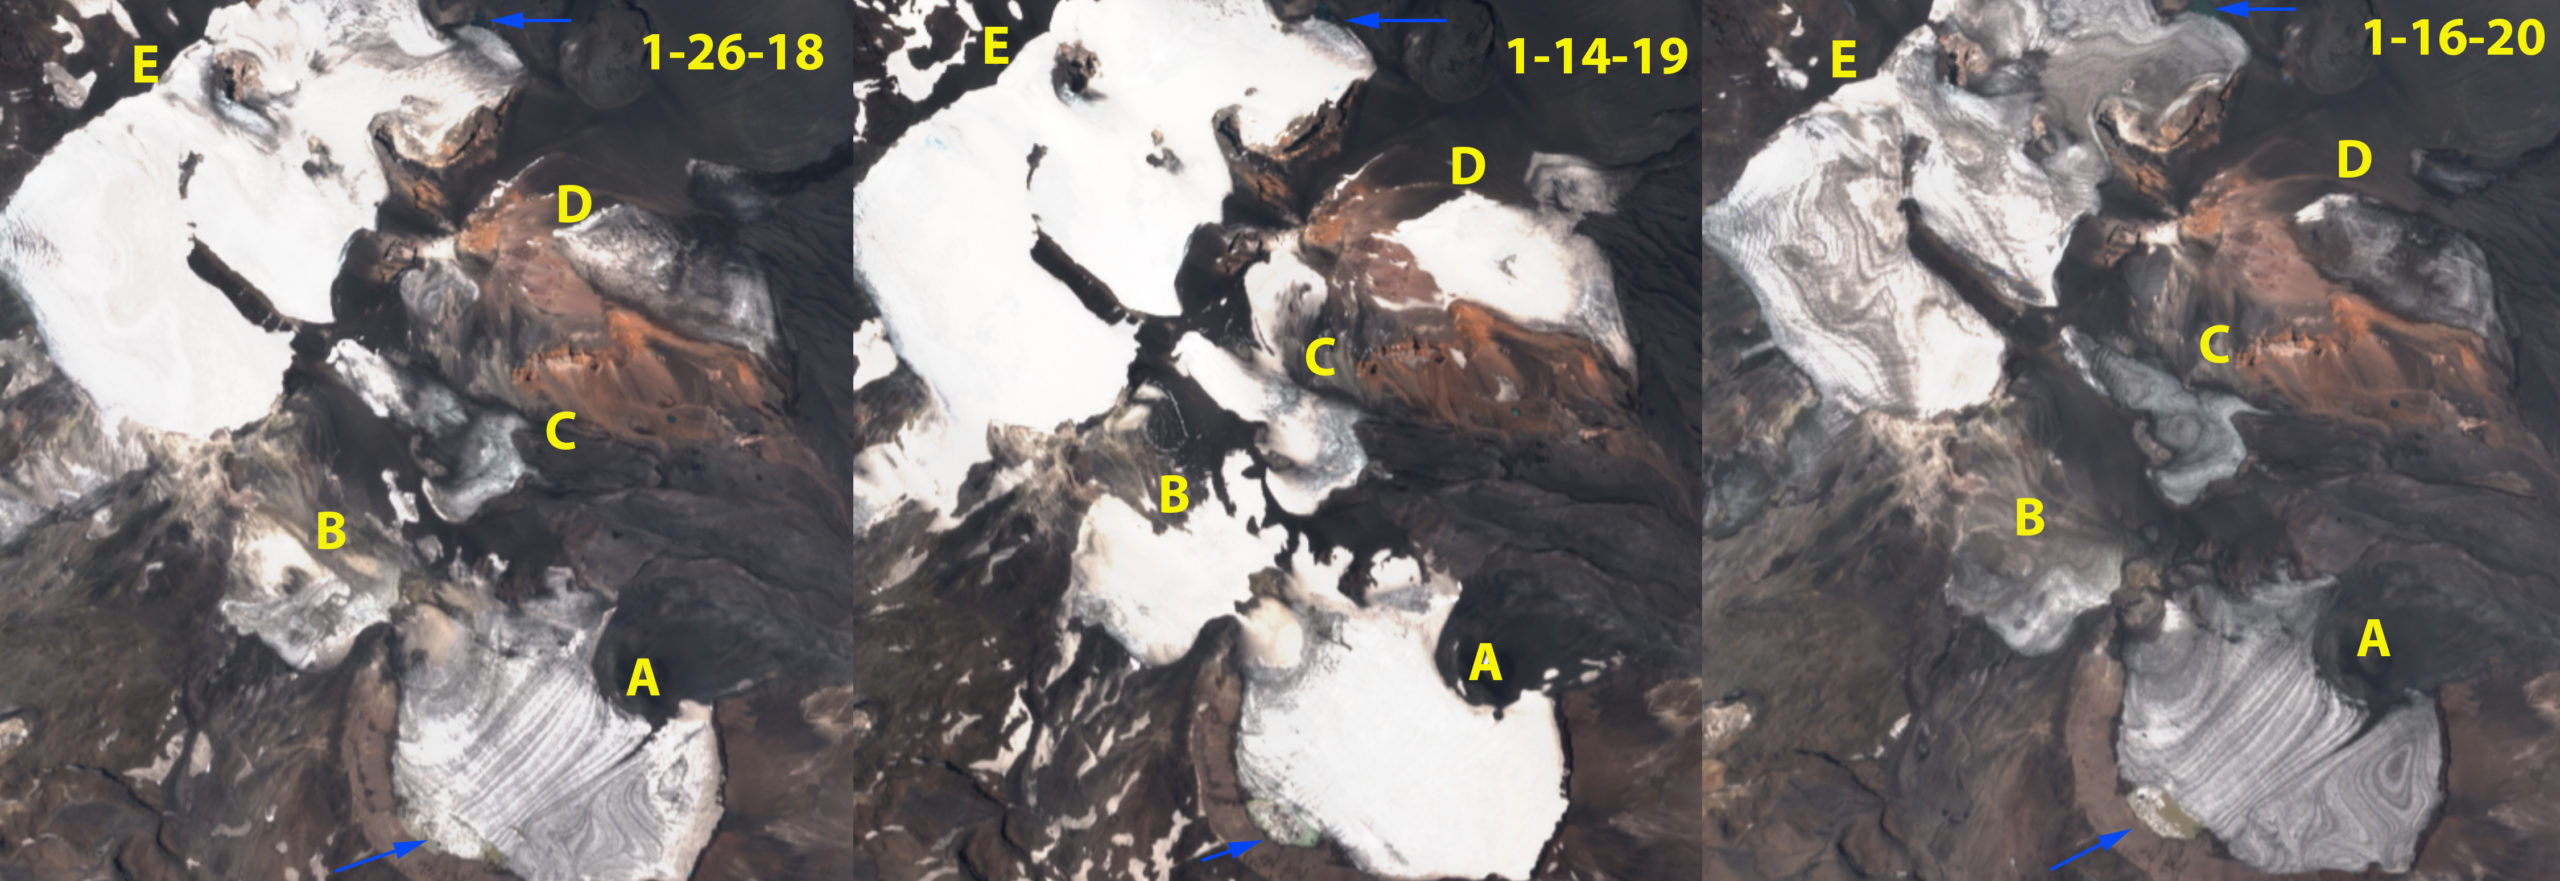
Volcan Overo glaciers in Sentinel images in January-2018, 2019 and 2020 illustrating fragmentation and snowcover.