Hofsjokull East is snow free on 8-17-2025 in this false color Sentinel image. This leads to ice melt, thinning and bedrock expansion at Point A-D.
Hofsjokull East, Iceland is a small ice cap east of Vatnajokull with a summit elevation of 1100 m. In the last decade the snow line has often been above the ice cap. The ice cap had an area or 4.97 km2 in 2003 declining to 2.51 km2 in 2023 (Iceland Glacier Viewer). In 2024 all 10 glaciers in Iceland had significant mass loss (Pelto, 2025).
In August 2020 the ice cap has lost nearly all of its snow cover, this occurred again in 2023 and 2024. The result in 2025 when the ice cap again lost all its snowcover, is significant glacier surface melt and thinning. This leads to expansion of bedrock. At Point A there has been rapid expansion of the bedrock knob. At Point B and C new bedrock has been exposed and rapidly expanded. At Point D a bedrock rib at the edge of the ice cap has spread into the ice cap.
The lack of snow cover indicates the ice cap no longer has an accumulation zone and cannot survive. In 2025 the ice cap area is 2.10 km2 . Ice cap area has declined by ~60 % in the last 22 years. The story here is similar to that at the larger Prándarjökull 10 km to the northeast. The summer of 2025 in Iceland was exceptional beginning with a May heatwave, followed by a July heatwave. The May heat wave led to high snow lines as summer began on Vatnajokull.
Hofsjokull East is nearly snow free on 8-14-2020 in this false color Sentinel image. Contrast the area of bedrock at Point A-Dto the 2023 and 2025 images.
Hofsjokull East is nearly snow free on 9-3-2023 in this false color Sentinel image. Point B and C now have evident bedrock areas.
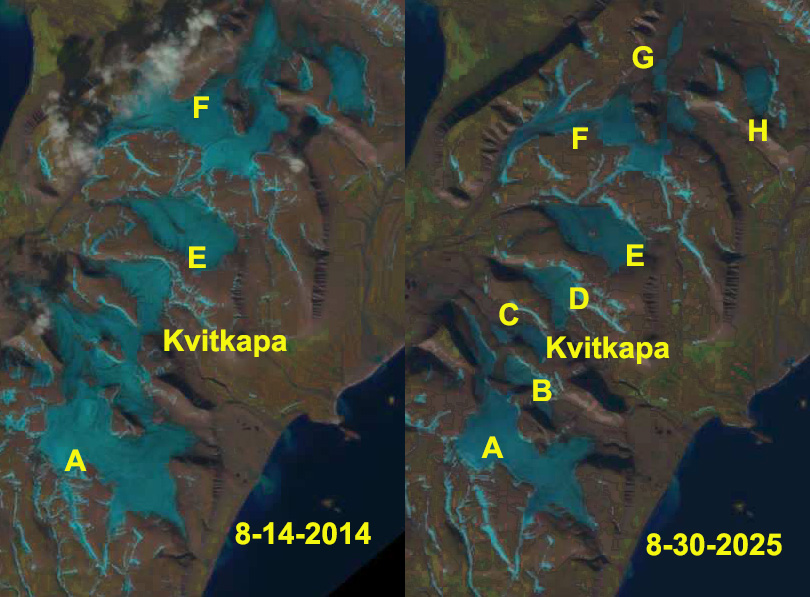
Kvitkapa in Landsat images from 2014 and 2025 indicating the fragmentation from 3 to 8 different glacier parts.
In 2022, 2023 and 2024 a number of ice caps and glaciers across Svalbard lost all snow cover, ie. Edgeøya 2022. The result by 2024 was that all firn cover had been lost as well on many of the ice caps of Edgeoya, such as on Digerfonna. This largely removes the ability of meltwater to refreeze. In 2025 we again see this playing out on the ice caps of Edgeøya. This all too familiar story indicates these glaciers lack a consistent accumulation zone that is essential for their survival
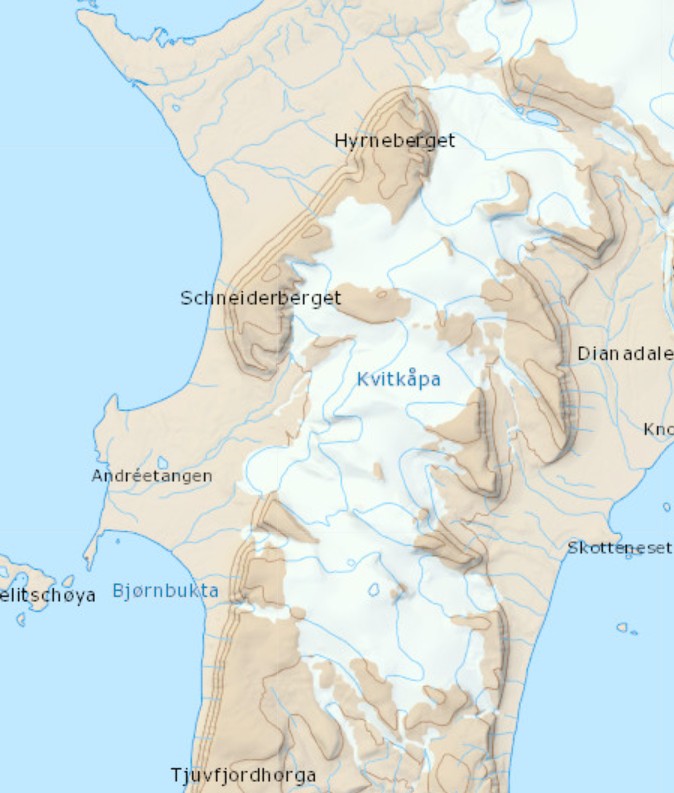
Map of Kvitkapa from TopoSvalbard indicating one interconnected ice cap in 2000.
Kvitkapa is an ice cap on a peninsula on the south coast of Edgeøya Island. In a map of this region from TopoSvalbard this is a single interconnected system of glaciers. By 2014 Landsat imagery indicates the ice cap has separated into three sections. By 2025 the ice cap has fragmented into eight different parts.
On the next peninsula to the east Kvalpyntfonna has also lost all snow cover again 2025.
Kvalpyntfonna in Landsat image from 2025 having lost all its snow coverand has no residual firn from previous winters either.
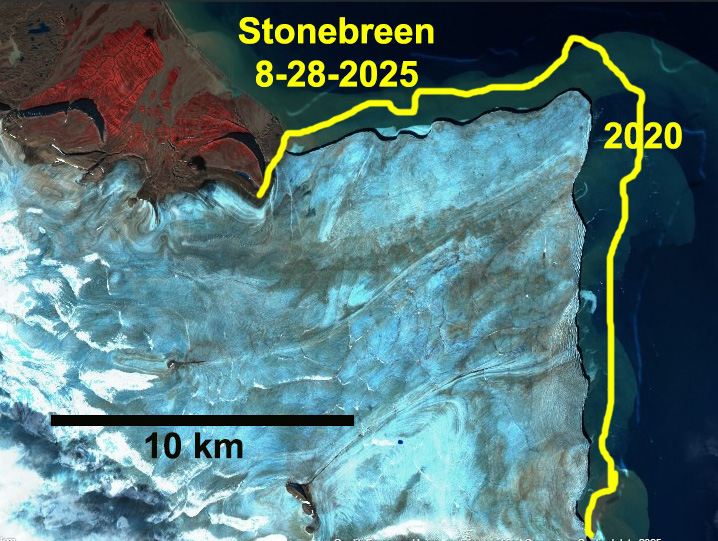
Further north and east on Edgeøya the Stonebreen ice cap has also losts its snow cover and firn cover driving thinning and retreat. The consistes loss of snow cover and resultant loss of firn cover, indicates that most ice caps Edgeøya cannot be sustained.
Stonebreen in false color Sentinel image illustrating retreat from 2020-2025. The lack of retained snow cover and residual firn will lead to continued rapid thinning and retreat.
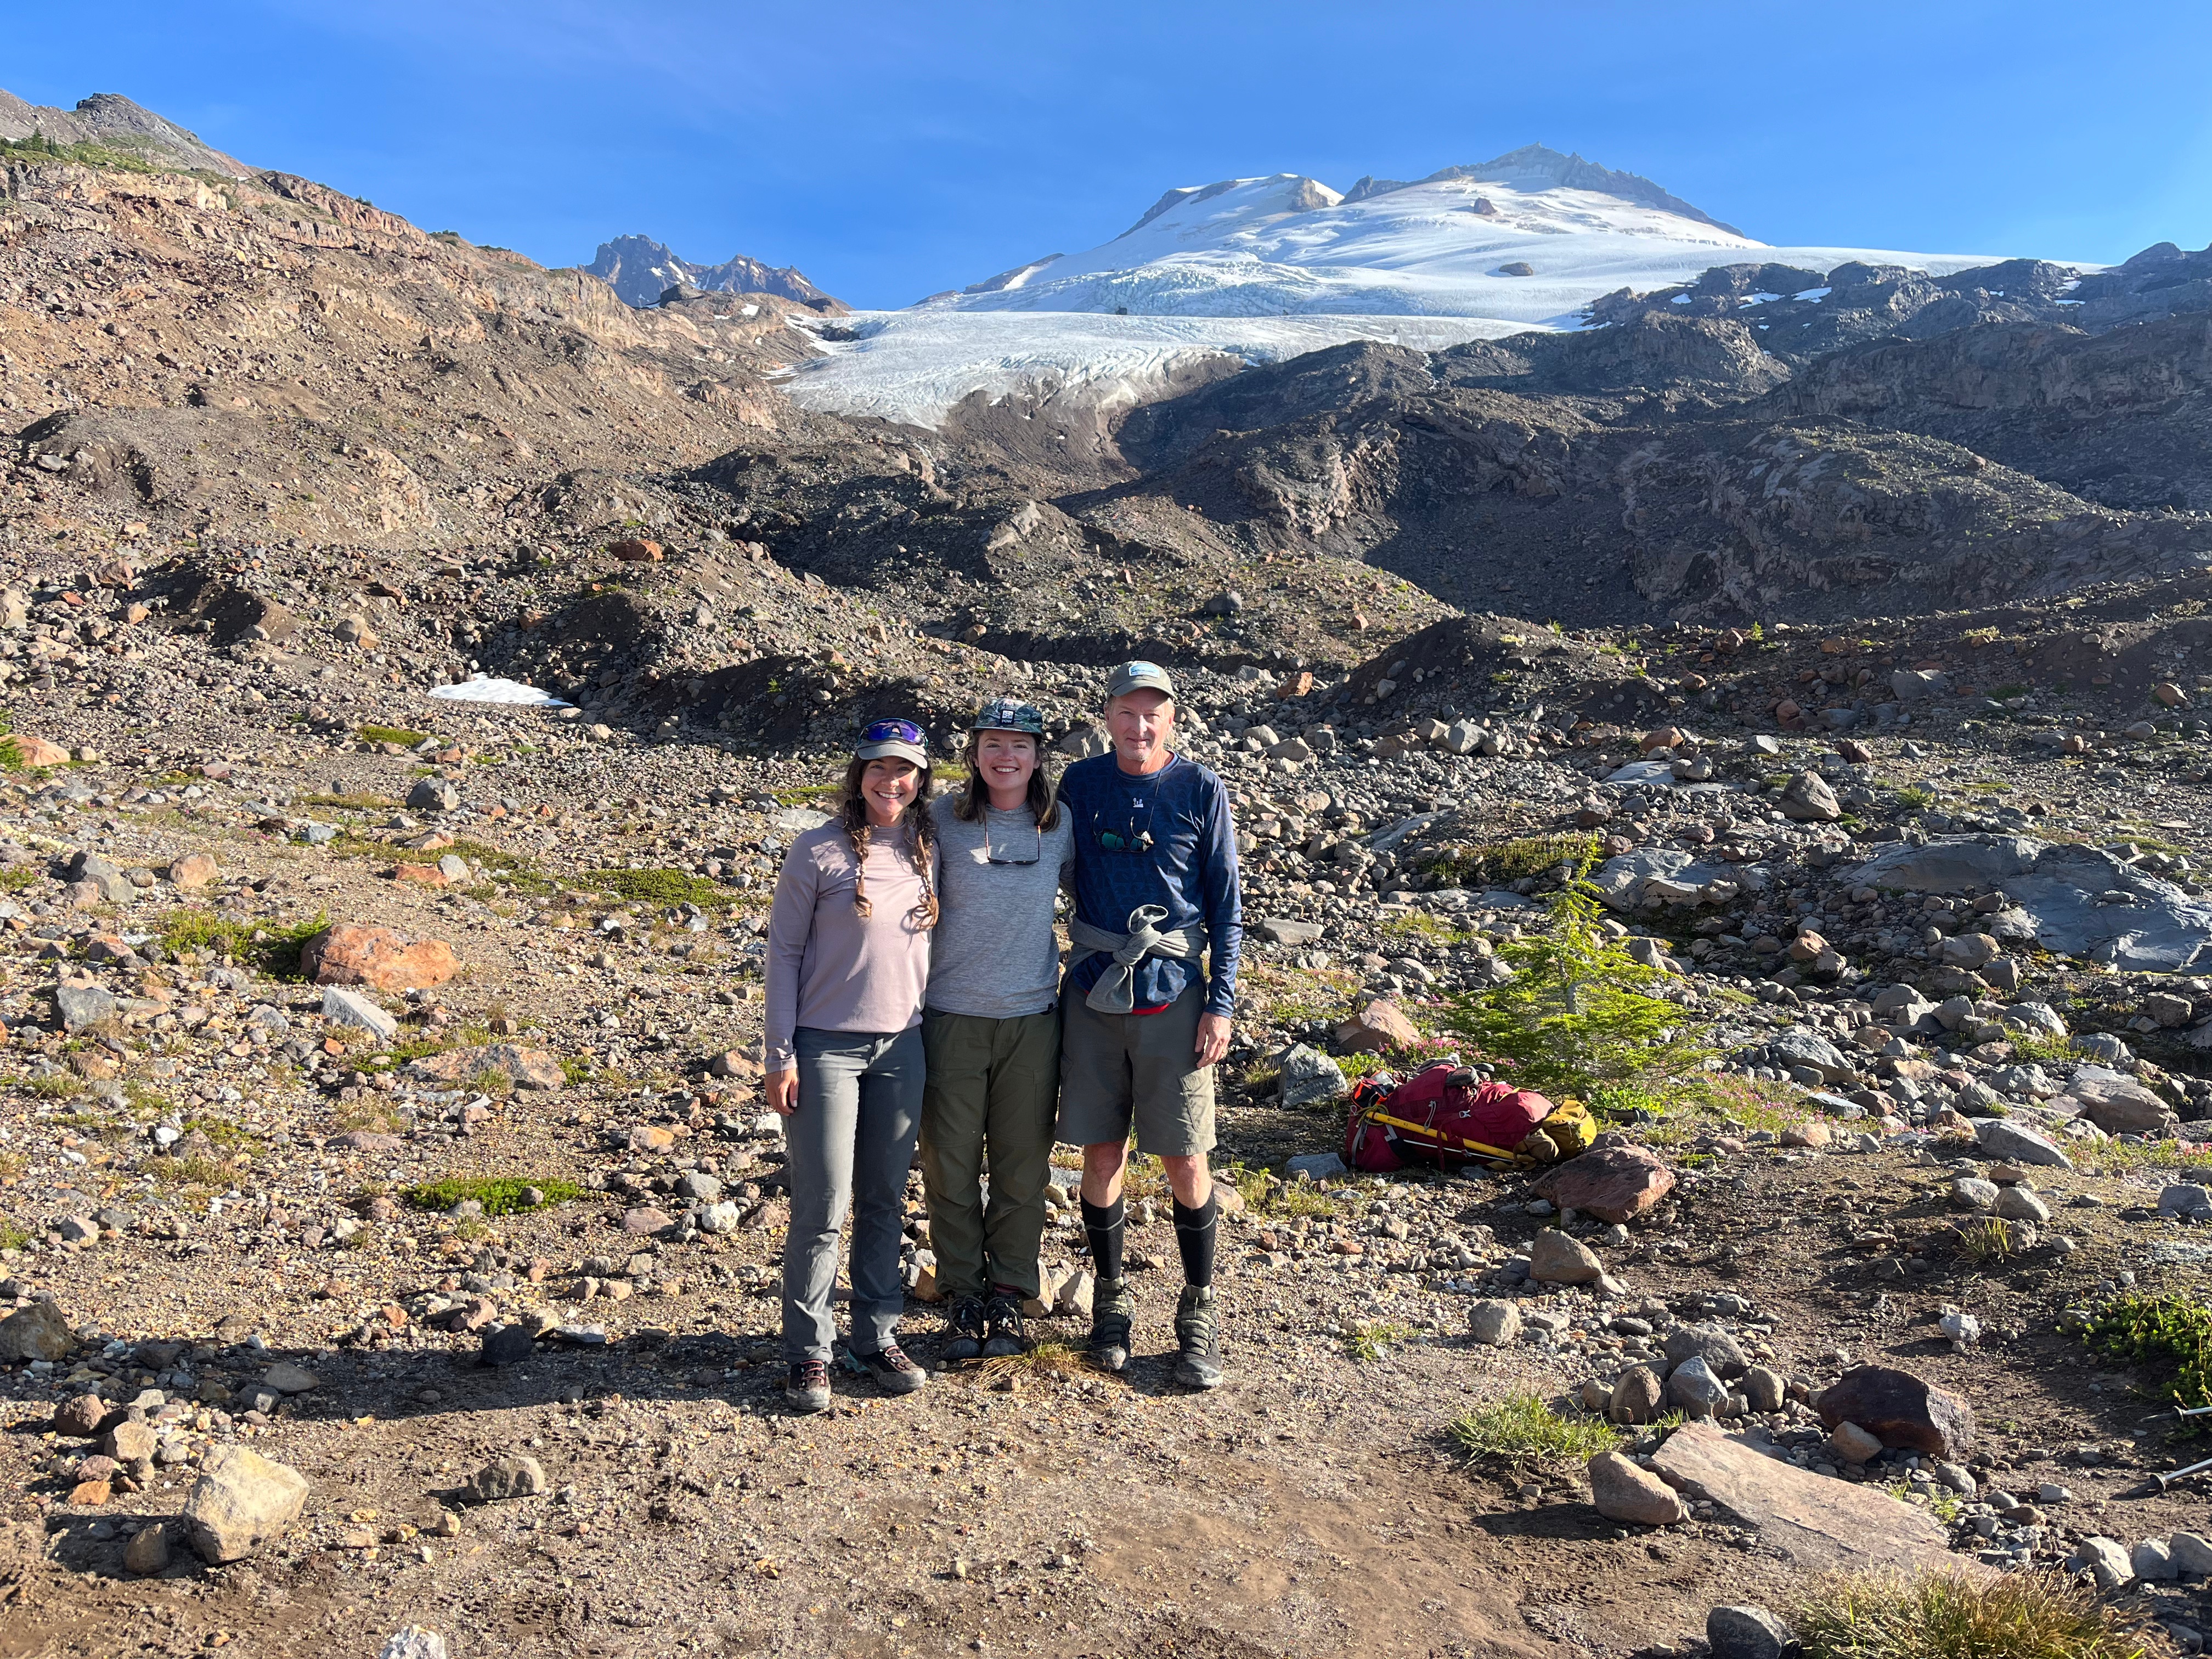
Field team Emmett Elsom, Mauri Pelto, Jill Pelto and Caitlin Quirk at Rainbow/Mazama Glacier saddle.
For the 42nd consecutive year we were in the field observing North Cascade glaciers. Our expedition of scientists and artists observes the response of the glaciers to climate change. In the last five years the glacier system in this mountain range is showing signs of collapse. The signs range from vanished glaciers, dwindling summer runoff, increased rockfall and serac instability.
Our first field area was Columbia Glacier, which feeds the North Fork Skykomish River. This is the largest glacier in the Skykomish River Basin and a World Reference glacier. We have observed ongoing retreat and accelerated volume loss, 50% of its volume lost in 42 years. The primary field team consiste of Emmett Elsom (field scientist), Caitlin Quirk (field scientist), Jill Pelto (art director) and Mauri Pelto (science director). In 2025 the new glacier lake that developd in 2010 continue to expand, a warmer Blanca Lake supported more algae, and the reduced glacier area provided notably less streamflow dring this the late July-August period.
Columbia Glacier 7-29-2025 with the expanding new lake and the thinning glacier that used to have a steep high terminus (Jill Pelto).
We next headed north to Lower Curtis Glacier on Mount Shuksan, which feeds into Baker Lake. We were joined by Katie Hovind (field scientist) and Margaret Kingston (oil painter). Leah Pezzetti, meteorologist and Nick Goldring videographer from KING5 in Seattle joined us.
The terminus of this glacier continues to thin, with the seracs becoming less imposing. The terminus front has diminished from over 45 m high, to 25 m. The glacier is thinning almost 1 m per year even in the accumulation area of the cirque basin. Glacier retreat has been 225 m since retreat began in 1986 across the wide terminus front.
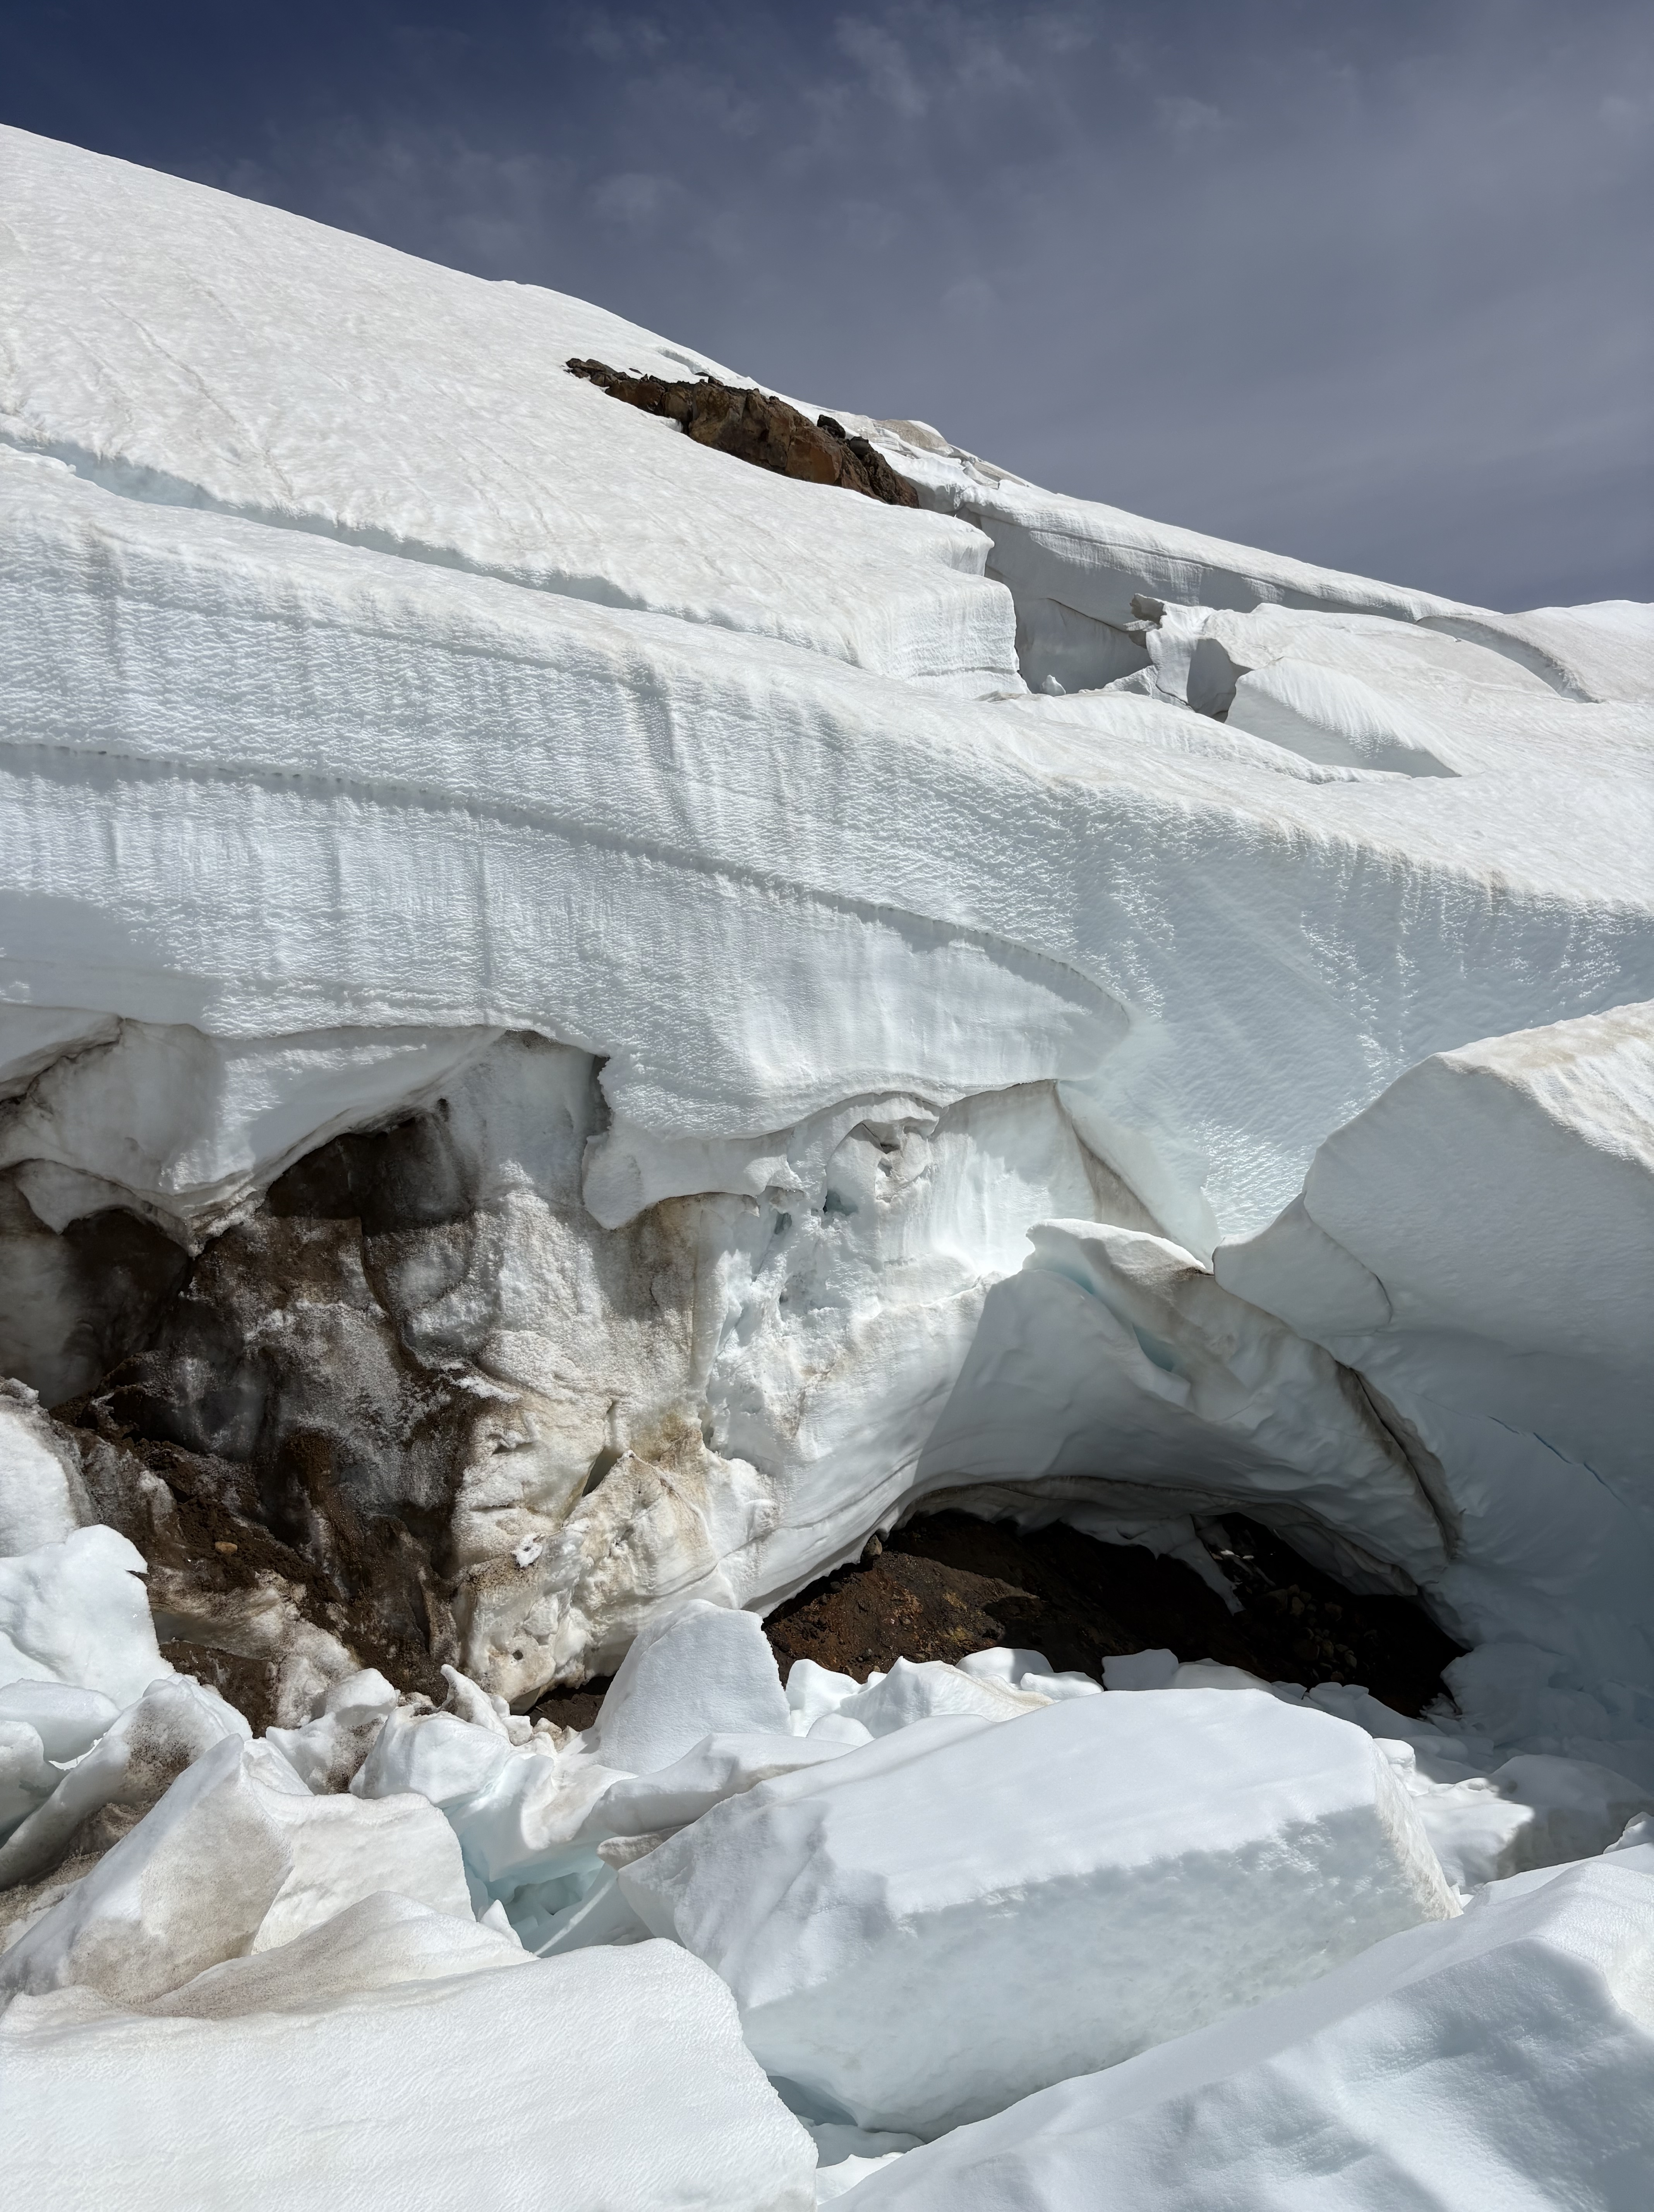
Next up was Sholes and Rainbow Glacier, both accessed from our camp on Ptarmigan Ridge. Claire Seaman (oil painter) joined our crew for both. Ben Pelto and Margot Pelto joined us for Sholes Glacier, along with their nine-month old daughter Wren, (my granddaughter). The Sholes Glacier has been rapidly thinning and losing area along its broad lower margin particularly in the last 5 years. The glacier has lost 0.25 km2 in this century along this margin, or 30% of the total glacier area. In 2023 we explored an ice cave that was over 100 m long. In 2025 this entire slope is devoid of ice. CBS Sunday News joined us on Sholes Glacier and captured well, what we do and how we combine art and science.
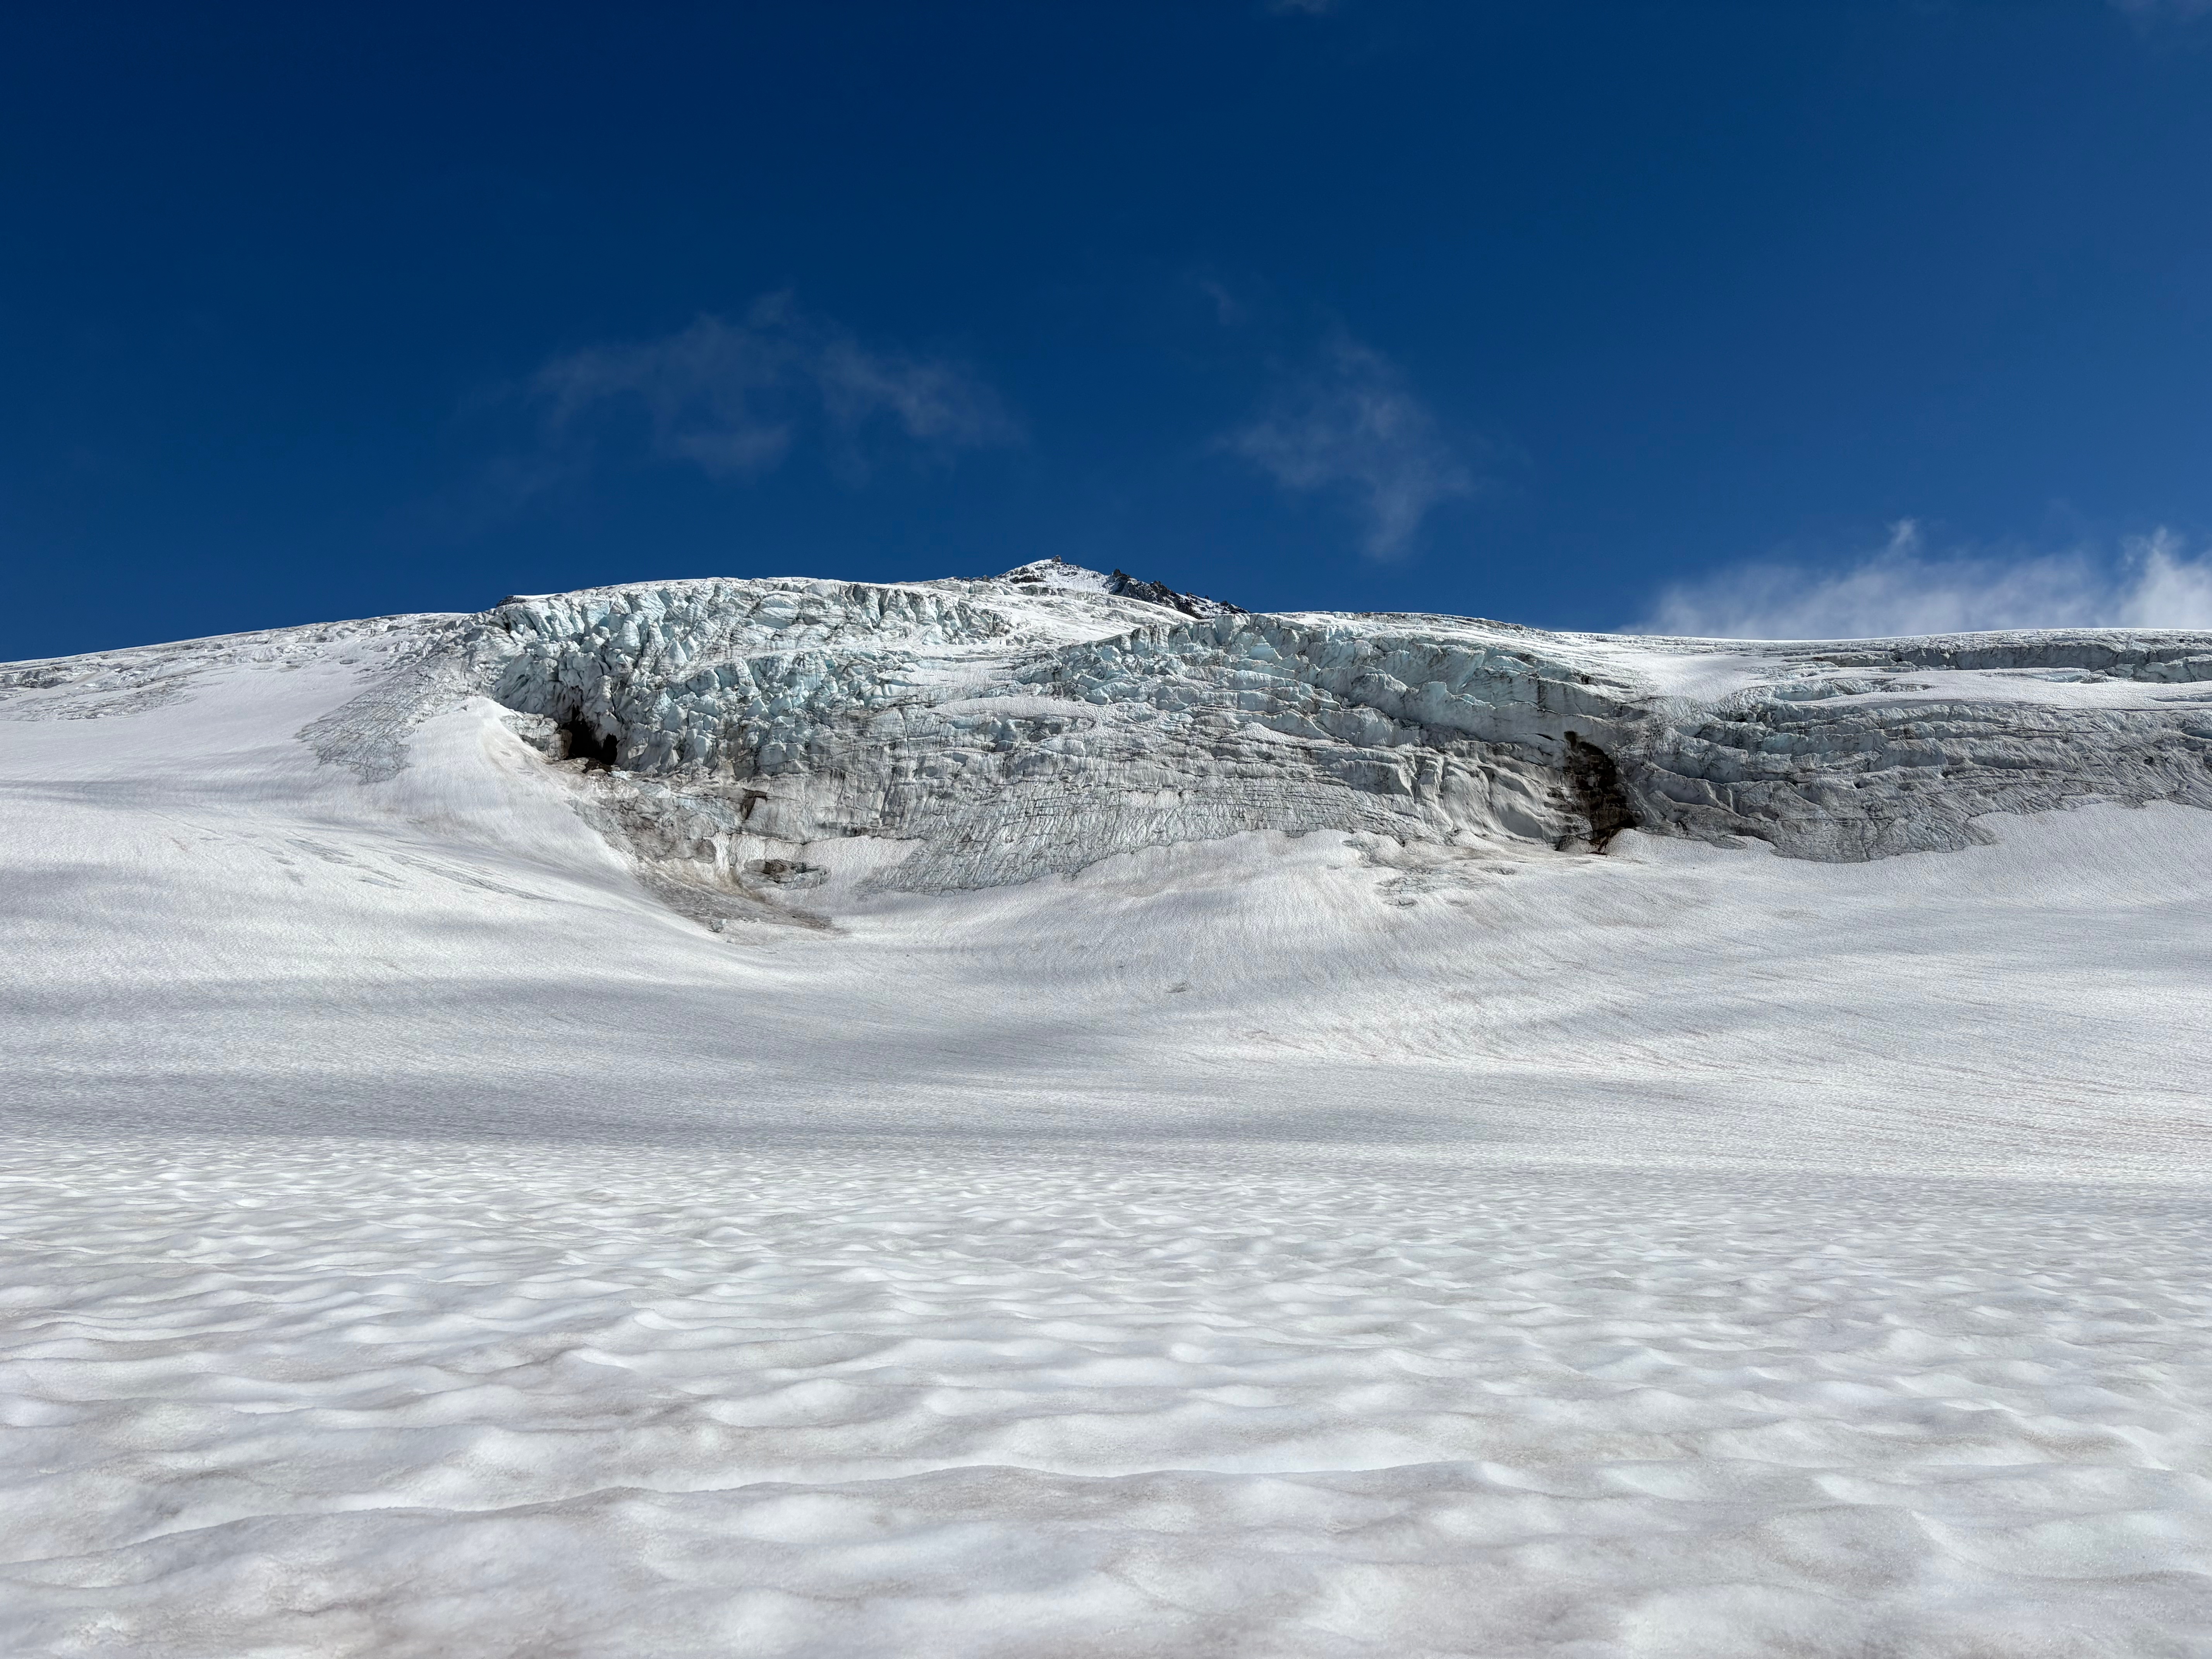
Rainbow Glacier descends from a saddle with the Mazama Glacier. This area consistently retains deep snow. This year the snowpack was 3.5-4.75 m deep in early August. Further down glacier, a series of bedrock knobs continue to emerge from beneath the ice, leading to steeper, thinner icefalls that leads to unstable serac conditions. The collapse of these seracs is predictable in terms of where. We did observe a large one. We descended to the terminus of the glacier. The glacier continues to retreat, with a retreat of 890 m since 1986. The glacier had been advancing prior to 1986.
Easton Glacier on August 9, 2025 from our research camp. In 1990 glacier ended at small ridge right behind our hats. Now glacier has receded 700 m (Abby Hudak, Jill Pelto and Mauri Pelto)
We circled to the south side of Mount Baker to examine Deming, Easton and Squak Glacier. Easton Glacier has retreated 705 m since retreat began in 1990. This year we continued to observe new bedrock emerging from beneath the glacier, including in the main icefall at 2000 m and as high as 2800 m on the glacier. This is also occurring on Deming Glacier. In both cases there is oversteepening in icefall areas leading to unstable seracs. On Squak Glacier we descended, what had been a crevassed icefall, that now is a steep ice ramp, to the terminus. This indicates limited velocity feeding the now nearly stagnant glacier tongue.
New areas of rock exposure emerging at base of main Easton Glacier icefall for the first time, at 2000 m.
Bedrock emerging at 2800 m on Easton/Deming Glacier. These features illustrate thinning is extensive even near the top of Mount Baker glaciers.
Our last stop was in the Alpine Lake Wilderness, and we were joined by Cal Waichler (wood cut printing) and Margaret Kingston. The glaciers of Mount Daniel and Mount Hinman have been in rapid decline this century. With six of the nine ceasing to exist by 2024. We continue to monitor Lynch and Daniels Glacier each year. Lynch Glacier continues to retain snowpack on the upper portion of the glacier, while losing 50% of its area since 1984. Daniels Glacier has lost 60% of its area since 1984 and is no longer retaining significant snow pack by the end of the summer. The retreat of area loss on Daniels Glacier has been 5% per year in the last five years. The runoff from glaciers into the Cle Elum Reservoir has diminished markedly in late summer reducing both runoff and increasing water temperatures. By late August Cle Elum Reservoir had dropped to 7% full, which will curtail water allocation to downstream Yakima Basin agriculture.
Descending onto Lynch Glacier, with Pea Soup Lake below. The glacier filled the lake until 1978.Daniels Glacier in 2025, illustrating the bare rock slope that was almost entirely covered by the glacier in 1984.The remaining fragments of Foss Glacier that has lost 80% of its area since we first mapped it in 1986.
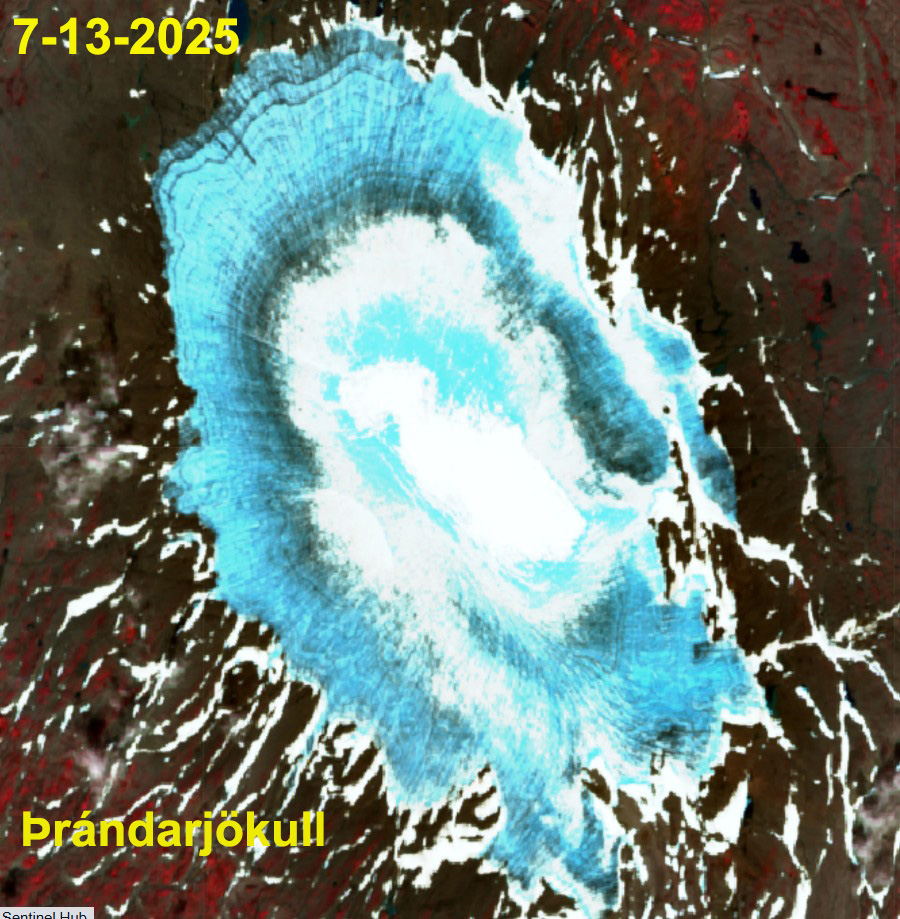
Prándarjökull on August 20, 2025 has no retained snowpack-with weeks left in the melt season (Sentinel false color image)
Prándarjökull is an icecap northeast of Vatnajokull that has a summit elevation of 1215 m, and a margin between 875 and 925 m. In 2003 the ice cap had an area of 17.3 km2, declining to 12.8 km2 by 2023 (Iceland Glacier Viewer). In 2024 all 10 glaciers in Iceland had significant mass loss (Pelto, 2025)
In 2021 the ice cap lost at least 90% of its snow cover as noted in the Sentinel image from 8-24-2021. In 2023 The ice cap again lost nearly all of its snow cover.
Prándarjökull on August 31, 2023 has only 5-10% retained snowpack-with weeks left in the melt season (Sentinel false color image)
The spring and early summer of 2025 was one of record warmth for Iceland. This led to a rapid rise of the snowline to 900-1000 m on Vatnajokull. By mid-July 60% of the Prándarjökull was snow free. There is an area of water saturated snow-light blue amidst the snowpack.
Prándarjökull on July 13, 2025 the ice caphas 40% retained snow cover-with weeks left in the melt season (Sentinel false color image)
By August 20, 2025 the ice cap had no snow cover. The early exposure of ice in recent years is leading to the continued recession of the ice cap and the intrusion of bedrock areas into the ice cap at Point A and B. At Point C in 2021 recent firn is exposed, that has melted away by 2025. The area of the ice cap has declined to 11.5 km2. There is no recent retained firn-indicating that in the last five year no snow cover has persisted to the end of this summer. This indicates the lack of an accumulation zone, without which the glacier cannot survive.
Prándarjökull on August 31, 2023 has only 5-10% retained snowpack-with weeks left in the melt season (Sentinel false color image)
2025 Field Season: For the 42nd consecutive summer we are heading into the field to measure and communicate the impact of climate change on North Cascade glaciers. This year an overall focus of the project is supporting the UN’s “International Year for Glaciers’ Preservation”. This means focusing on glaciers that have disappeared and are in critical danger of disappearing in the next decade. Jill Pelto, Art Director and Mauri Pelto, Science Director
This field season follows the 2021-2024 seasons that featured either historic heat waves and/or periods of extended warm weather. The heat led to a greater exposure of bare ice on glaciers with a higher albedo and greater density. The observed melt rates are 7-9 cm/day water equivalent during warm weather events vs 4-6 for snow surfaces. This led to substantial mass losses on North Cascade glacier for the four years of over ~6 m.
Science objectives: We will complete detailed measurements on 10 glaciers, three of which are part of the World Glacier Monitoring Service reference glacier network (48 glaciers globally), which have 30+ consecutive years of mass balance observations. This summer we will have an opportunity to assess the long-term ramifications of the 2013-2024 period of unprecedented mass balance losses and associated glacier changes, with detailed mass balance, crevasse depths and glacier surface elevation profiling. We also focus on the impact of diminishing glacier size on downstream runoff.
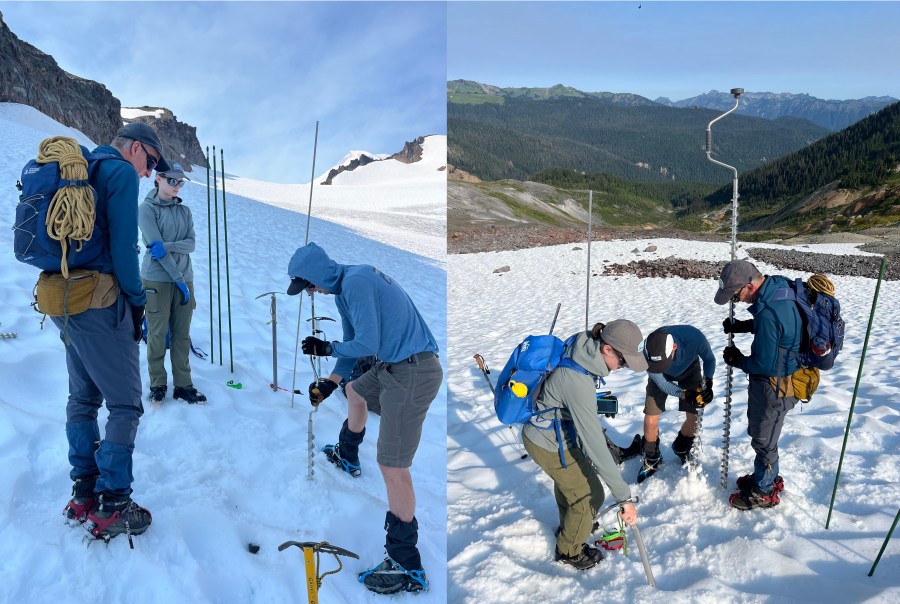
Drilling and emplacing ablation stakes on Sholes Glacier.
Art Objectives: We will collaborate with several artists who will join us for a portion of the field season. They will be able to create their own work about the landscape and the science or may join us for fieldwork and make plans for future artwork. We hope to use this art to share our research with a broader audience and highlight the beauty and importance of these places.
Cal Waichler Sketch of Lower Curtis Glacier.
Communication Objectives: We will leverage the brands of our expedition sponsors and the focus on vanishing glaciers that the UN brings this year. These organizations can help spread our message. We will utilize a combination of artists and scientists to tell the story.
From the Glaciers to the Sea: this is one of two paintings that tells stories of watersheds fed by North Cascade glaciers that flow out into the Puget Sound. The snowpack and glaciers in the mountains in this region provide crucial meltwater to river systems, many of which connect critically to the ocean.
Field Team 2025:
Jill Pelto (she/her) is an artist and scientist from New England who grew up loving winter sports and trips to the mountains. She incorporates scientific research and data into paintings and prints to communicate environmental changes. Her multi-disciplinary work weaves visual narratives that reveal the reality of human impacts on this planet. She completed both her B.A. degrees in Studio Art and Earth and Climate Science, and her M.S. focused on studying the stability of the Antarctic Ice Sheet at the University of Maine, spending two field seasons at a remote camp in the southern Transantarctic Mountains. Jill will be joining the project for her 15th field season. She is excited about continuing to document the change in North Cascade glaciers that she has witnessed each of the last ten years — through science and art.
Mauri Pelto (he/him)has directed the project since its founding in 1984, spending more than 800 nights camped out adjacent to these glaciers. He is the United States representative to the World Glacier Monitoring Service. For 15 years he has been author of the blog “From a Glacier’s Perspective”, and associate editor for three science journals. He is on the Science Advisory Board for NASA’s Earth Observatory. His primary position is Associate Provost at Nichols College, where he has been a professor since 1989. He either runs on trails or skis on alpine and cross country trails every day.
Emmett Elsom (he/him) is an environmental science student at Western Washington University from Portland, Oregon. Growing up mountaineering and backpacking in the Cascade Range, he developed a love for the region and a fascination with the complexities of its ecosystems. In 2024 he had an opportunity to work In the field with the Oregon Glaciers Institute, assisting with SNOTEL data collection and fieldwork. This year, he is looking forward to broadening his understanding of the ecological role of glaciers and their melt across the Pacific Northwest, and the power of utilizing art in science.
Caitlin Quirk (she/her) is a Masters student of Environmental Humanities at the University of Utah. She writes essays and poetry about socio-environmental justice, land relations, and political ecologies of climate change. Before graduate school, Caitlin worked as a mountaineering instructor and environmental researcher. Through these roles, she formed deep relationships with glaciers throughout the Pacific Northwest.
Katie Hovind (she/her) is an environmental science student at Western Washington University. She feels a deep connection to the Cascade mountains and their watersheds from growing up in this region, and hopes to share their beauty and importance with others. She was a field assistant with NCGCP last year, and is excited to continue collaborating this year to explore ways science and art can evoke caring—for protection of natural spaces and response to the climate crisis. This season, she will help conduct a vegetational succession study at the Easton’s terminus to observe the changing alpine plant growth in the wake of a receding glacier.
Margaret Kingston: is an oil painter and art educator from Winthrop, Washington. Originally from New Hampshire, she moved 3000 miles with her husband Jonathan Baker to the Methow Valley after visiting the North Cascades National Park. Landscapes of the Pacific Northwest have been her inspiration for the past 13 years, captured first through a photo then realistically painted on canvas. As a backcountry skier, hiker, and biker she captures the energy of places these activities take you. With funding from the Mary Kiesau Fellowship Grant, Margaret will plein air paint on site in honor of her friend Mary Kiesau. Her observations during time spent with the North Cascade Glacier Climate Project will be shared through the resulting artwork and at a community event in the Methow Valley. Learn more about Margaret Kingston’s work at MkOilPaintings.com
Claire Sianna Seaman (she/her) is a painter, filmmaker, and printmaker from Leavenworth, WA. She holds a BA from Smith College in Studio Art, with a concentration in Climate Change. She is currently earning her MA in Human Geography at the University of British Columbia. Claire has been featured in the Wild and Scenic Film Festival Art Exhibition and received an Artist Trust GAP Award. She worked with scientists from the University of Washington Climate Impacts Group to create an art piece that imagined climate resiliency in the Pacific Northwest. This piece is currently part of the 5th National Climate Assessment Art x Climate Gallery on display at the Smithsonian Natural History Museum in Washington, D.C https://www.clairesianna.com/
2025 Schedule
July 28: Hike In Columbia.
July 29: Columbia Glacier survey
July 30: Hike Out Columbia/Hike in Lower Curtis
July 31: Lower Curtis Glacier Survey
Aug. 1: Hike out, Hike in Ptarmigan Ridge
Aug. 2: Sholes Glacier
Aug. 3: Rainbow Glacier
Aug. 4: Rainbow Glacier
Aug. 5: Hike out. Hike in Easton Glacier (Resupply in Bellingham WA)
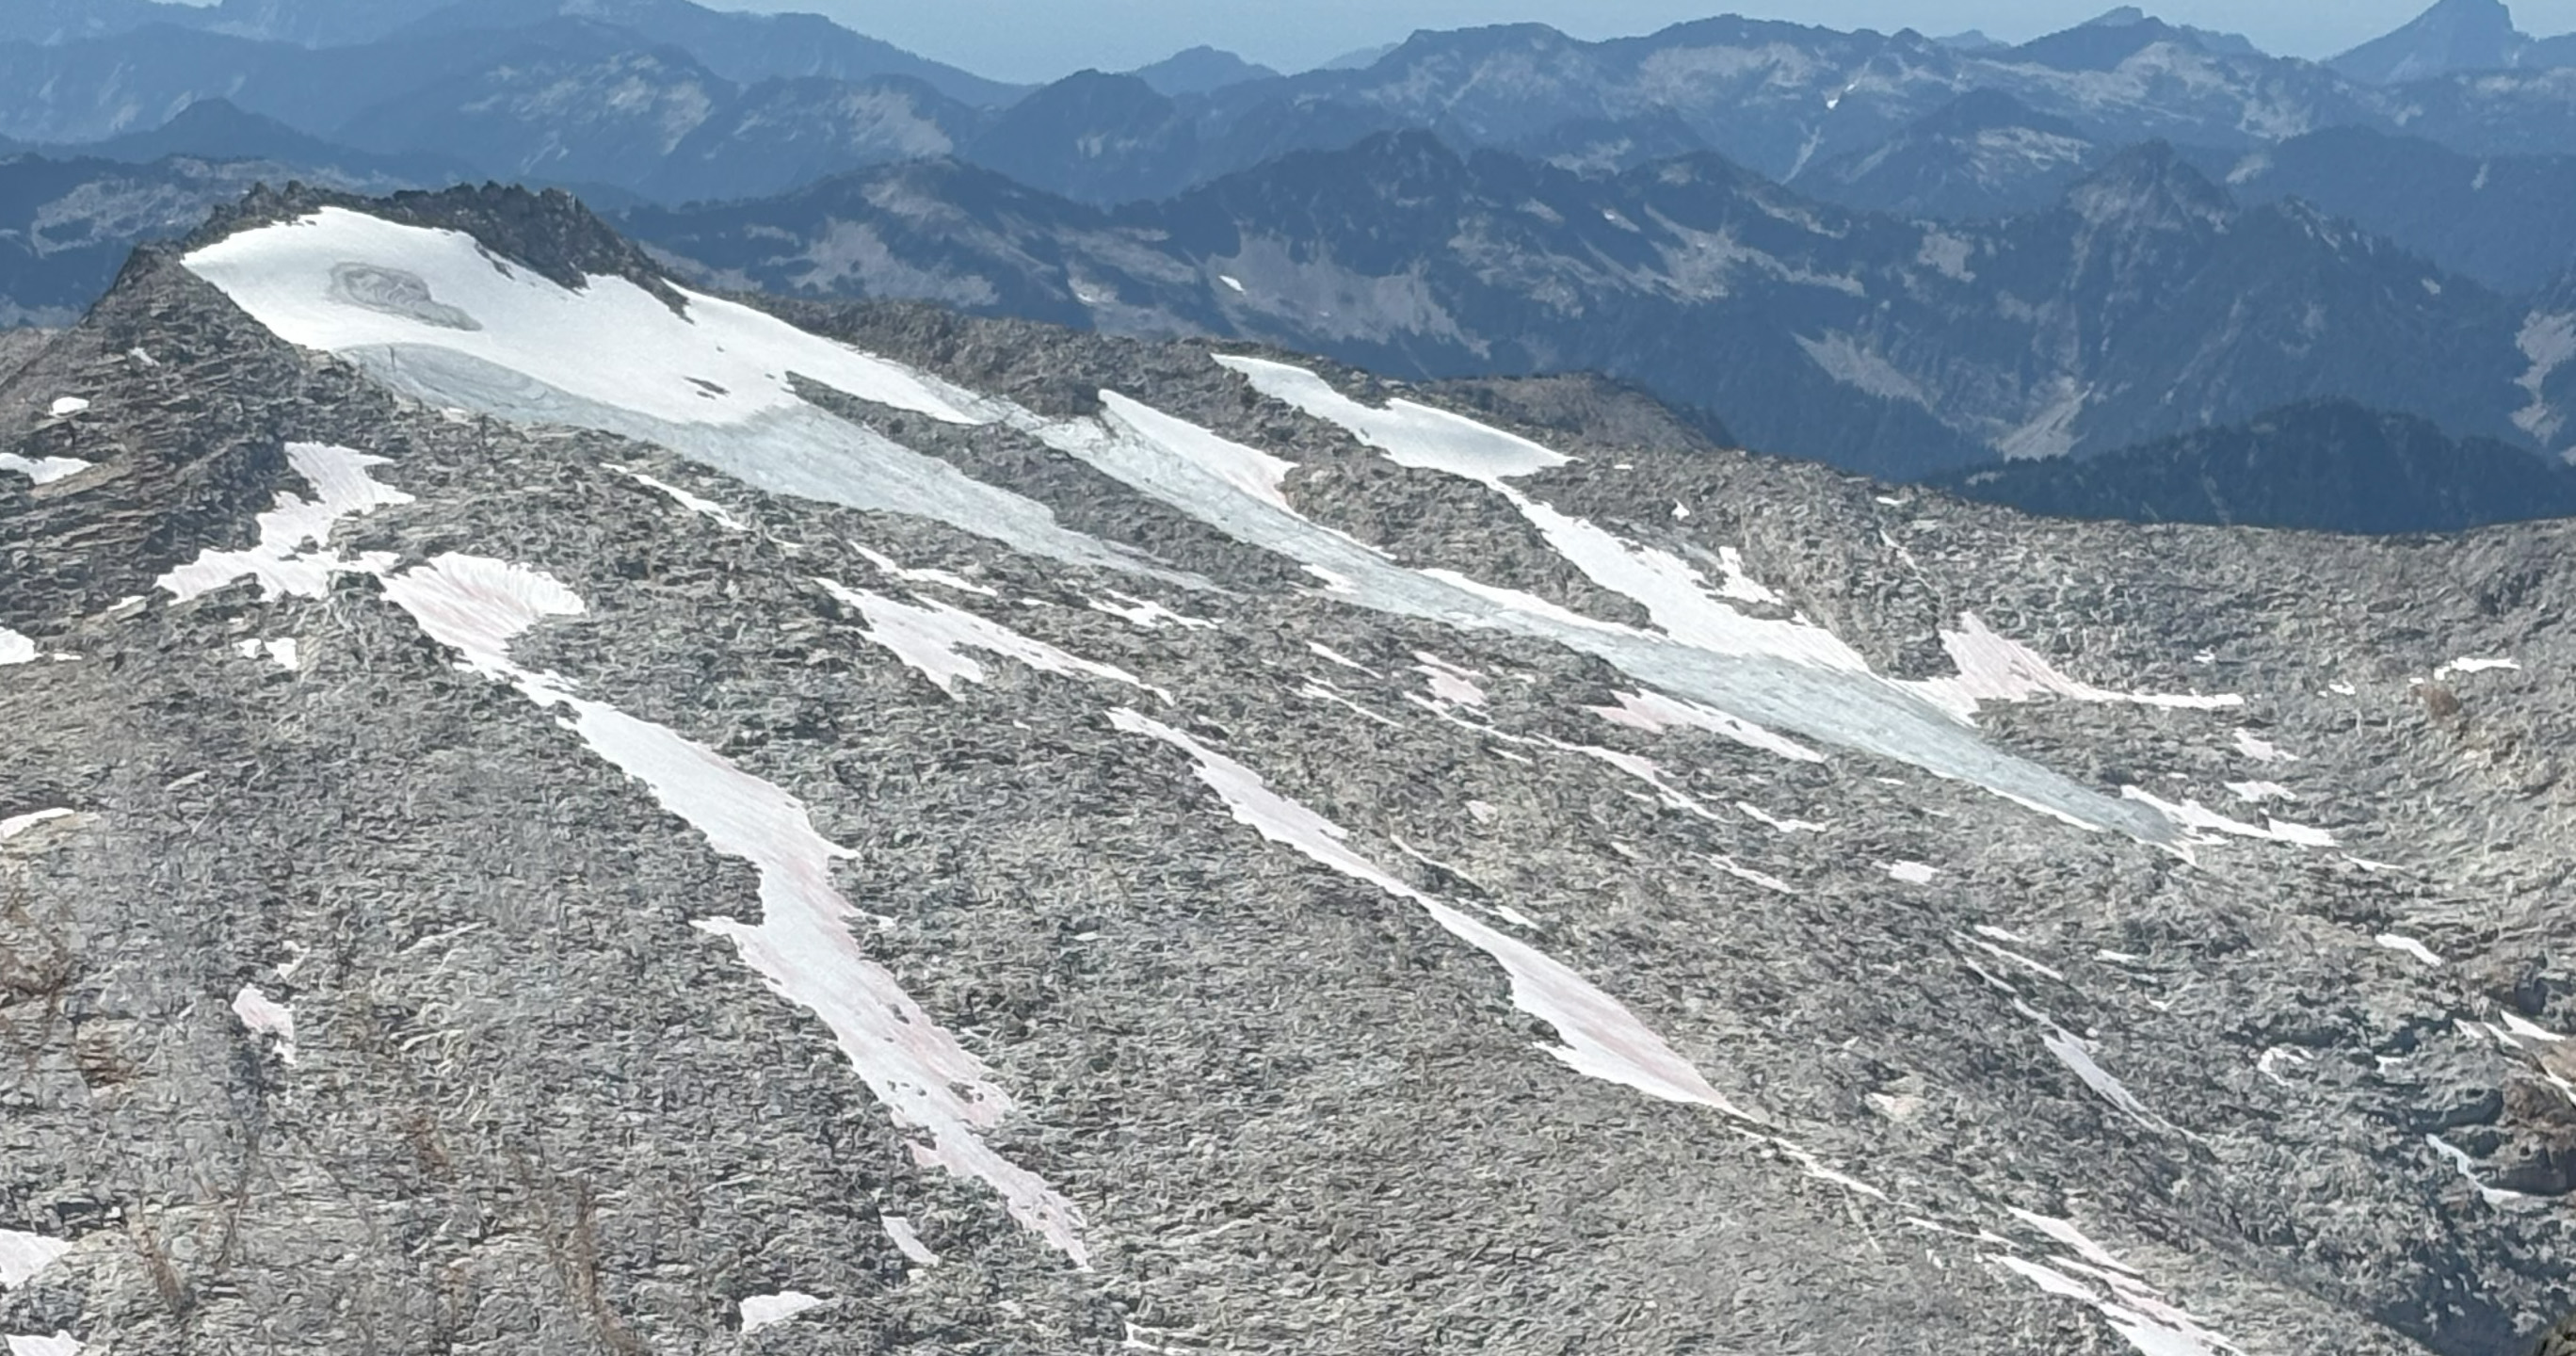
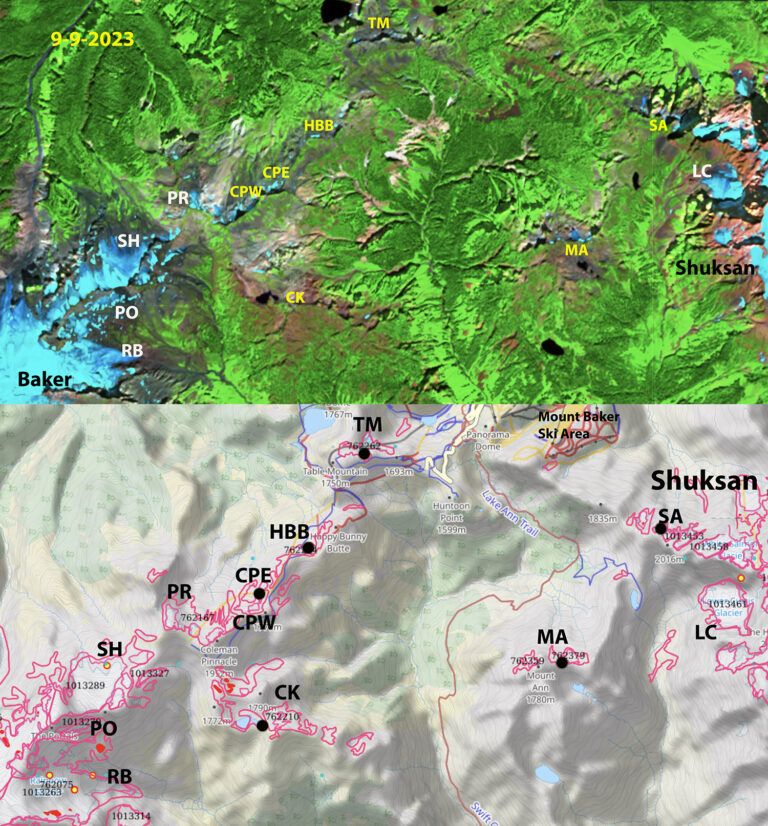
Glaciers on the ridge from Moutn Shuksan to Mount Baker that we observed to be active in mid 1980s, identified in GLIMS map below. Above Sentinel image from 9-9-2023. Glaciers that are no longer glaciers in yellow, seven of them including Mount Ann=MA, Shuksan Arm=SA, Coleman Pinnacle East/West=CPW/CPE, Camp Kiser=CK, Table Mountain=TM and HBB=Happy Bunny Butte. We still monitor each year Lower Curtis, Rainbow and Sholes.
The two most prominent mountains of the North Cascades Mount Shuksan and Mount Baker are connected by a ridge from Shuksan Arm to Ptarmigan Ridge. We visited 12 glaciers along and close to this ridge in the mid-1980s, to decide which to monitor annually. At that time each of these had active crevasses and significant area of glacier ice. We By the end of 2023 seven of the twelve glaciers are gone. We continue to monitor Lower Curtis, Rainbow and Sholes Glacier in detail. Portals and Ptarmigan Ridge Glacier which we visit every year, but do not assess in detail, will likely disappear in the next few years. Below is the evolving area and the date the glacier was lost, the area reported in the 1958/84 period and 2015 are from GLIMS and the 2023 area we determined from Sentinel imagery.
Glacier
GLIMS ID
Year Lost
1958/84 Area
2015 Area
2023 Area
Camp Kiser
G238275E48809N
1993
0.22
0.03
0
Happy Bunny Butte
G238277E48834N
2005
0.166
0
0
Table Mountain
G238295E48850N
2015
0.158
0
0.008
Coleman Pinnacle
G238269E48826N
2018
0.56
0.031
0.018
Mount Ann
G238341E48818N
2022
0.12
0.07
0.01
Shuksan Arm
G238362E48838N
2023
0.16
0.07
0.03
1963 image of Ptarmigan Ridge sent to me by Austin Post.
Ptarmigan Ridge glaciers in 1993-all small but still all nearly joined.
In 2024 the lack of glacier ice or perennial snow along Ptarmigan Ridge is evident.
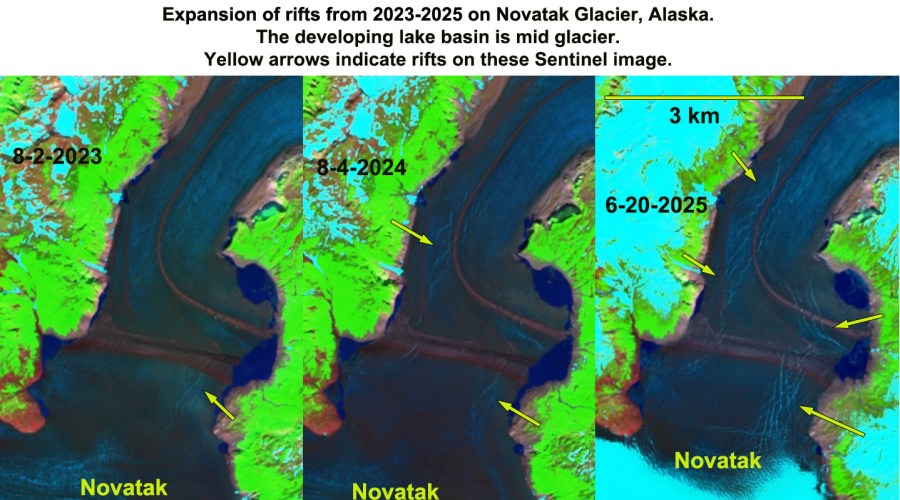
A network of extensive rifts have developed since 2023, yellow arrows. The fringing proglacial lake has not expanded. Rifting indicates uplift from partially floating glacier area.
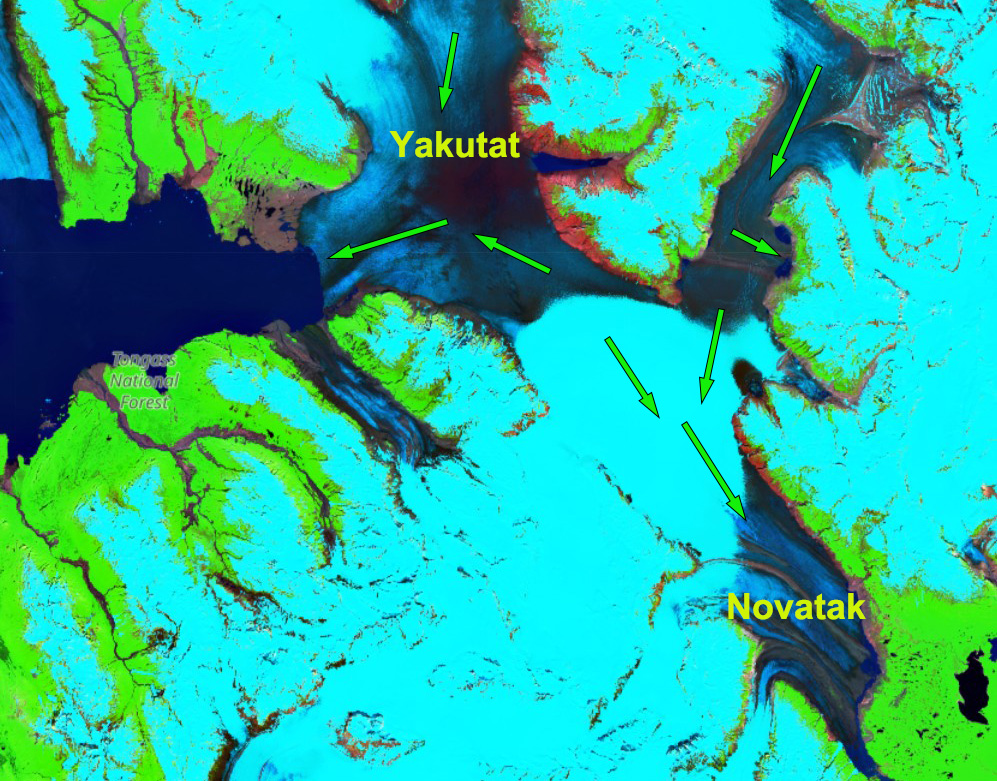
Ice flow in the region around the developing lake, which is near the boundary with Yakutat Glacier in Sentinel Image from June 20, 2025
Novatak Glacier is between the Yakutat and East Novatak Glacier in southeast Alaska. The glacier retreated 1 km from 1987-2023 (NASA EO, 2015). The majority of the accumulation zone of these three glaciers is below 1000 m, which has made them particularly vulnerable to the warming climate. The result has been expansion of the proglacial lake, Harlequin Lake, at Yakutat Glacier from 1984 to 2024 from 50 km2 to 108 km2 (Pelto & NASA EO, 2024). There was no lake in 1908.
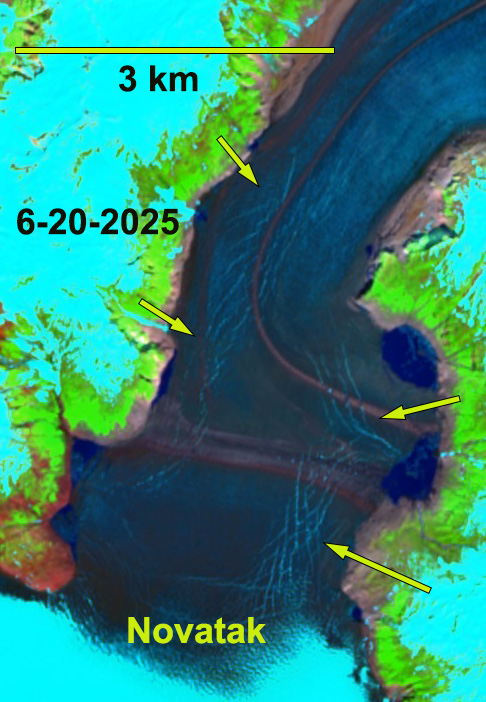
Novatak Glacier has been slow to form a substantial terminus lake unlike its neighbors, possibly because it lacks a sufficient basin. This has limited the retreat of this glacier as it thins. The developing rifts does show a large lake will form, with an area of 10-12 km2 . This will isolate the terminus from the main inflow to Novatak’s terminus, which will hasten a rapid meltdown. The rifts represent places where water level change causes flexure of the glacier, leading to their formation and expansion. They are not related to flow, but to uplift and down fall of ice where it is somewhat afloat. Rapid meltwater inflow to this basin will raise water level further stressing this region this summer. The degree of rifting indicates the ice is thin, but none are open enough to see water. This suggests breakup will not happen this summer. This type of rifting in 2010 and 2015 led to further breakups at Yakutat Glacier.
June 20, 2025 rifting of Novatak Glacier.The rifts represent places where water level change causes flexure of the glacier, leading to their formation and expansion. They are not related to flow, but to uplift and down fall.
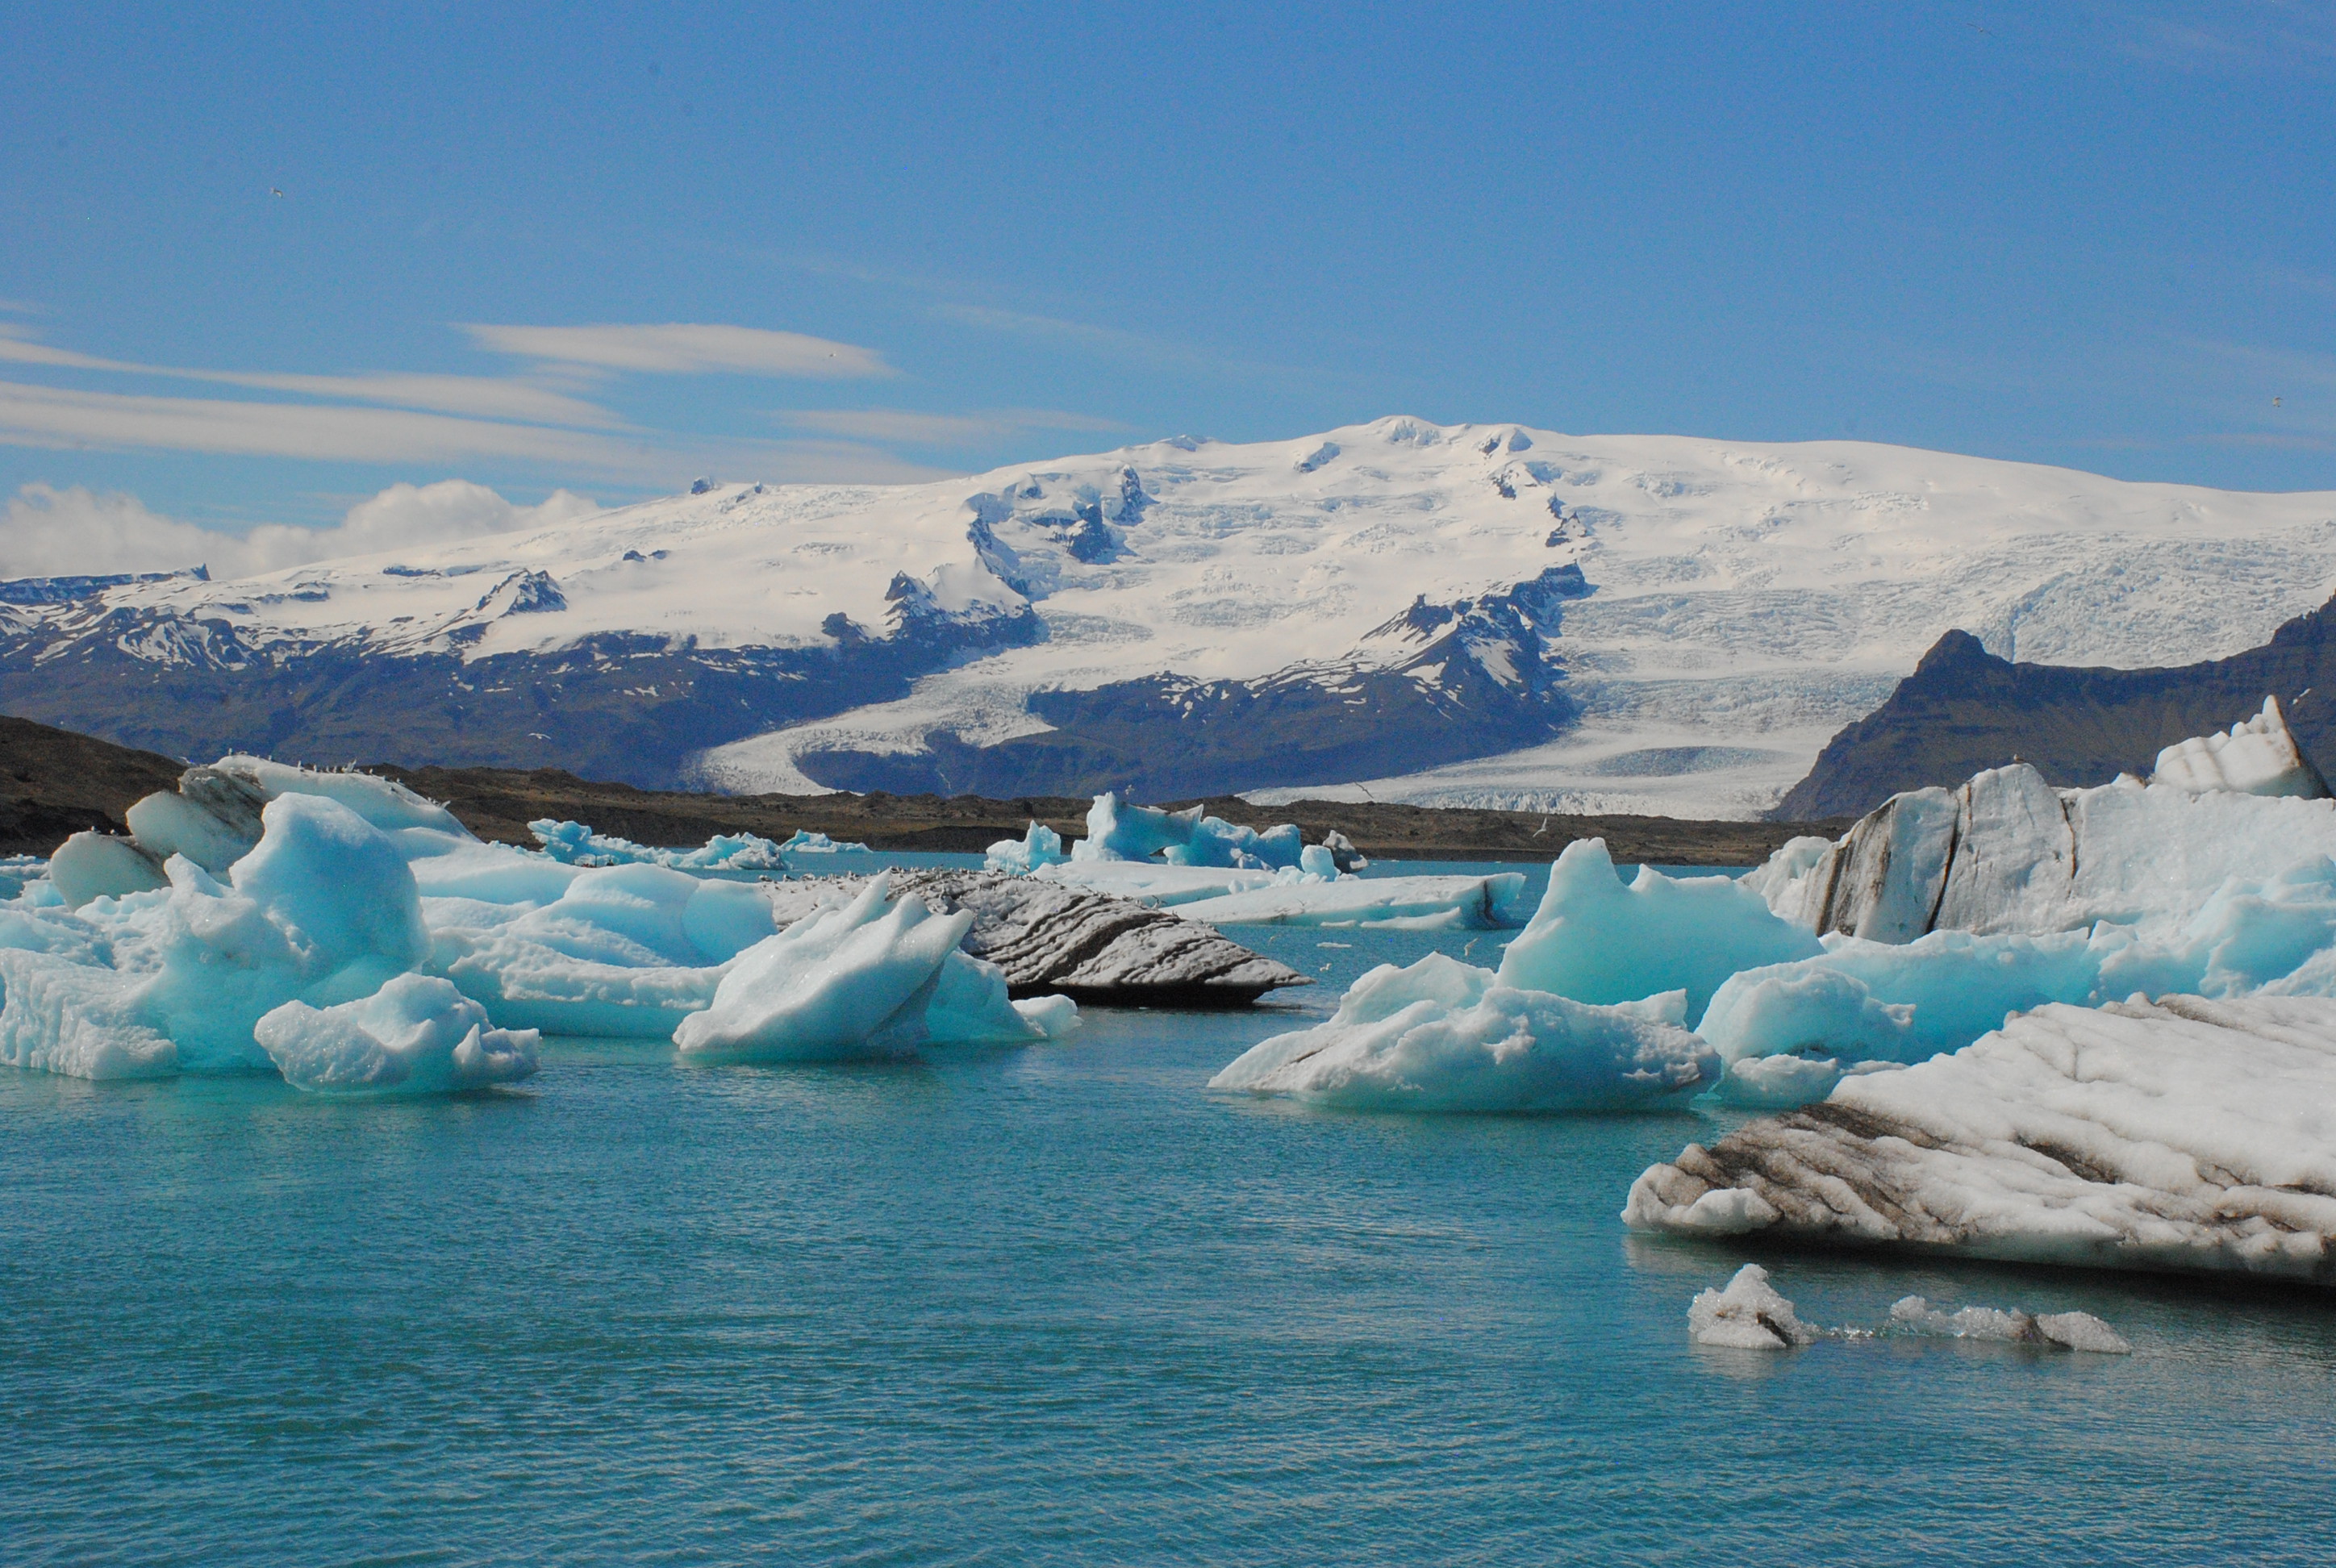
A view across Jokulsarlon Lagoon toward Fjalljökull and Hrutarjökull of the ÖræfajökullIce Capon May 25 above. Below, is Skalafellsjokull of Vatnajökull Ice cap on May 26 with Jill and Kevin Duffy in foreground next to lateral moraine (Jill Pelto). Öræfajökull is a connected to Vatnajökull.
Iceland experienced an unusually warm and sunny May, with record high temperatures averaging 10 C above average. This led to a rapid rise in the snow line to elevations more typical of late June than May on the ice caps in southern Iceland, here both Vatnajökull and its southern extension Öræfajökull. We use Sentinel images (Mauri Pelto annotated) and photographs from (Jill Pelto) to illustrate. The University of Maine Sea to Sky Experience explored Iceland in May, and Jill as the artist faculty for the program had a chance to see Iceland with blue sky days.Most days during my two weeks in Iceland were full sun with high temperatures from 10-15 C. The record heatwave reaching into the low 20 C range, rare even for summer here. The lower parts of outlet glaciers already were mostly bare ice, even though melt season should not really have begun yet. Locals were shocked by the weather, and most I heard from were not happy about it, even though it was “nice” out.
On May 20, 2025 the snow line on the southern part of the Öræfajökull Ice Cap averages 800 m, purple dots. SK=Skaftafells, SV=Svinafells, HR=Hrutarjokull, KV=Kviar, FJ=Fjalls, JL=Jokulsarlon Lagoon, H1=Southern Highway.
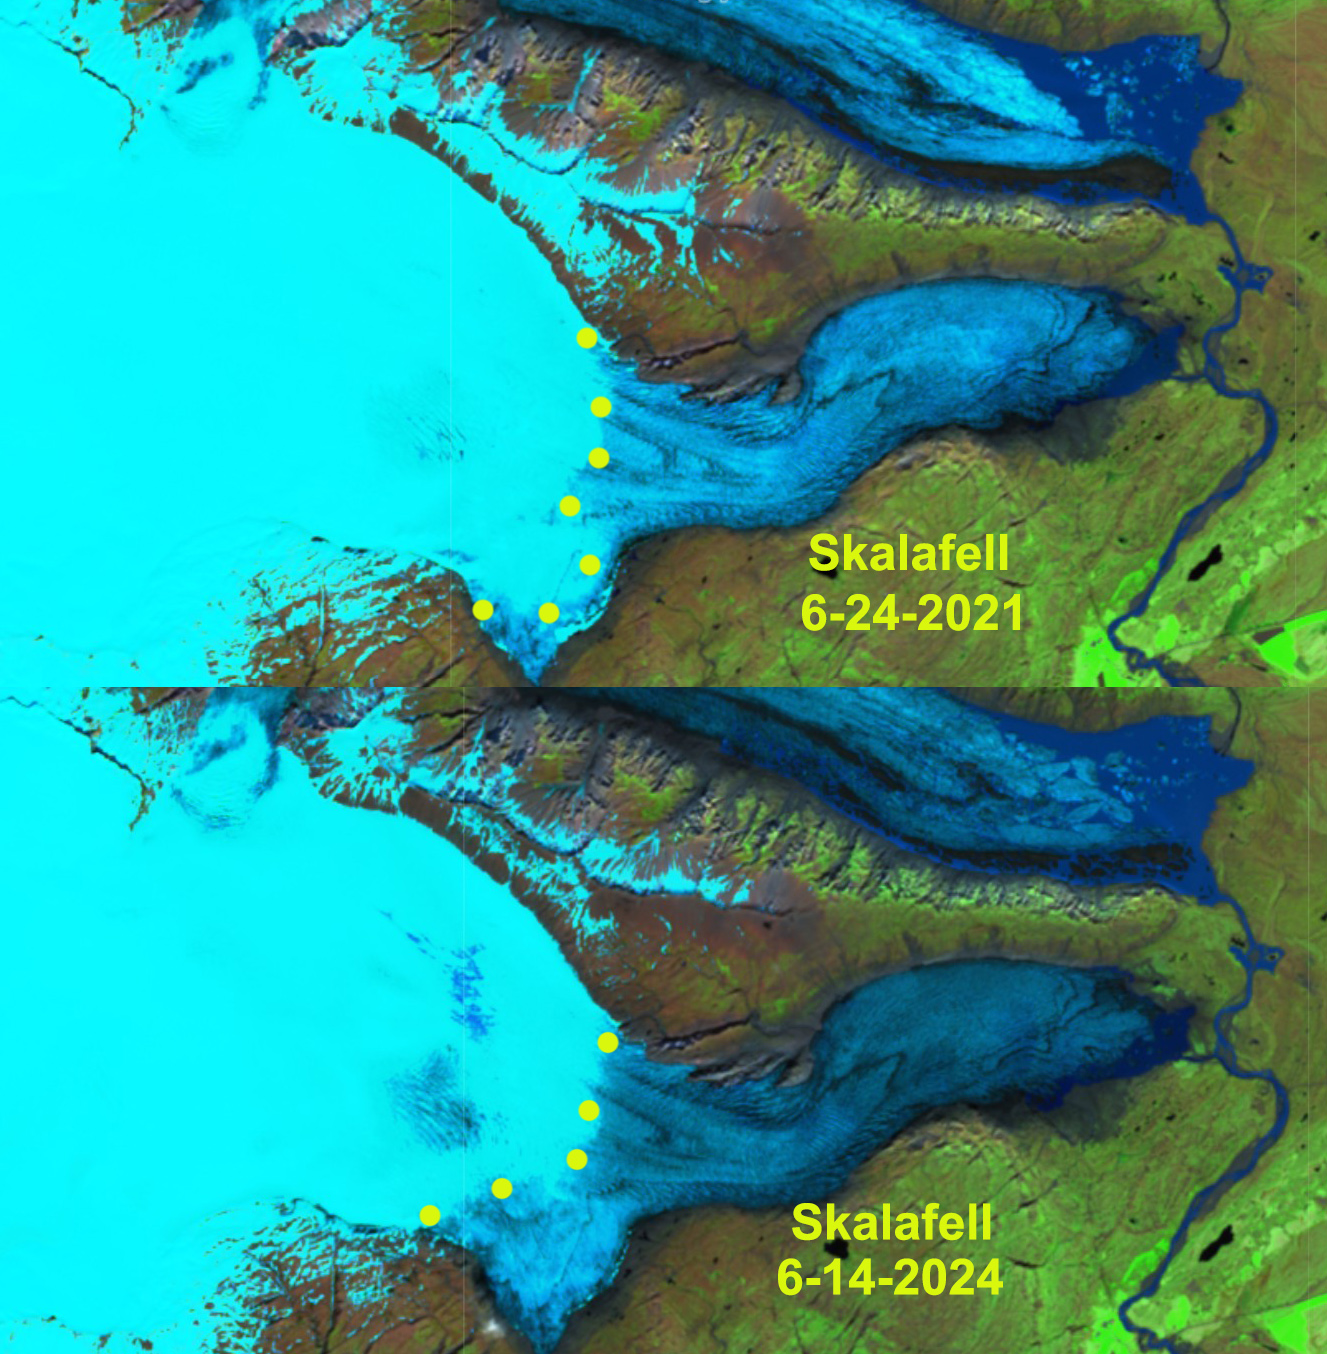
As May began conditions were typical with the snow line not far from the glacier terminus areas at 350-400 m, May 2 image of Skalafellsjökull. By May 20, the snow line had risen to 750-800 m, a rapid rise of ~400 m in three weeks, represents more than 50% of the rise that should occur by end of summer. By May 26, (Jill image) the snowline had risen further to 800 m+. This snow line elevation is above the typical elevation seen in latter June other years (see below). In 2024 all ten glaciers in Iceland had a negative mass balance (WGMS, 2025). The rapid melt in May 2025, indicates that 2025 will see similar widespread mass loss.
Hrutarjökull with snowline at 800 m on May 26, 2025.Skalafellsjökull on May 2 and 20, 2025 illustrating rapid snow line rise (yellow dots). Contrast that to the images from mid-late June in 2021 and 2024, below.
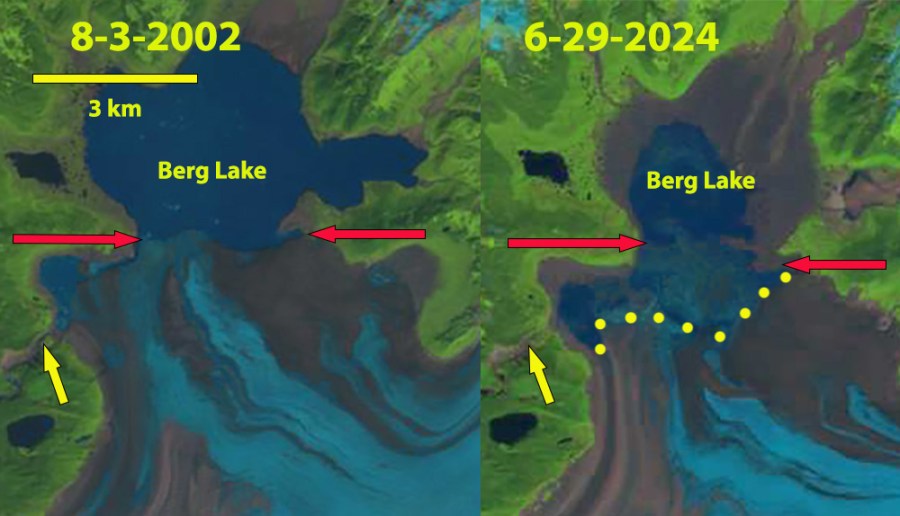
Berg Lake in 2002 and 2024 Lands at images. Red arrows illustrate 2002 margin, and yellow dots the 2024 margin after a retreat. Yellow arrows indicate the gorge that drained the lake periodically from the 1980s through 2013. Now it drains south sub-glacially into Pacman Lake and then into Bering Lake
Berg Lake is impounded by the Steller Glacier terminus. During the latter half of the 20th century and early 21st century this lake periodically drained west through a gorge to the Bering River. With retreat and thinning this outlet has been abandoned. Vegetation has regrown in portions of this channel area by 2024 illustrating this.
Berg lake and Steller Glacier terminus retreat from 2016 to 2018 in Landsat images exposing the former gorge exit, red arrow.
During the 1986-2022 period the full lake level declined, but the filled area of the lake remained close to 25 km2. The lake level decline led to abandonment of the gorge outlet and drainage south into Lake Ivanov (NWS, 2024). In 2019 this channel was also abandoned, and now the drainage goes directly from Pacman Lake into the Gandil River and then into the Bering River watershed (NWS, 2024). The rapid retreat of Steller Glacier terminus particularly on the western half of more than a kilometer from 2016 to 2018 has driven the continuation of outlet location shift. The speed of drainage from 2018-2021 caused significant flooding in the floodplain of the Bering and Gandil River, that has not been observed in 2022-2024.
Map of Berg Lake drainage path in 2024-yellow dots, false color Sentinel image.
The lake continues to fill each summer and drain in late summer, with drainage being in August of 2021 and 2022, and late July of 2023 and 2024 (NWS, 2024). It is evident that since the 2022 fill of 25 km2, that in 2023 and 2024 the lake did not completely fill before drainage, reducing flood hazards. The minimum lake size has declined as the water level has been reduced to 4 km2 by fall in 2022, 2023 and 2024. The lake depth is greatest in the glacier center, which drives greater calving and retreat. On May 19, 2025 filling is underway and the lake has an area of 6 km2.
Berg Lake in 2022 full in June and drained in October, false color Sentinel images.Berg Lake drained in September 2023, and filling in June 2024, false color Sentinel images.Berg Lake in fall 2024 drained and filling in May 2025, false color Sentinel images.
As April ends there is a sharp snowline ranging from 1200 m at Mount Baker to 1400 m at Cascade Pass. Above 1500 m the melt season is just getting started.
As the accumulation season comes to an end for North Cascade glaciers it is worth reviewing this winter and looking ahead with a forecast for glacier mass balance by the end of summer 2025. The winter of 2025 at NOAA’s Washington Cascade Mountain West Division 5 records indicate that this winter was below the declining trendline of total precipitation with a mean of 54.8 inches, down slightly from last year. Winter temperatures were again warm at 33.2o F but close to the expected rising trend line average.
The 1946 to 2025 winter (November-March) mean temperature and total precipitation for the Western Cascade Mountains-Division 5 weather stations.
The mean April 1 snow water equivalent (swe) at the six North Cascade Snotel sites with a consistent long term record was 0.72 m. This is below the declining trend line and 31% below the long term average for the 1946-2025 period. This is above the 2024 value, but in the lowest quintile. Mount Baker ski area has reported 585 inches of snowfall through April 21, which is ~30% percentile. April 1 swe is the key date for asssessment for winter snowpack water resources. For glaciers the accumulation season typically continues until the end or April or early May. This year snowpack depth at Mount Baker Ski Area (1280 m) increased from 148 inches on April 1 to 164 inches on April 9 and then declining to 119 inches by May 1 (80% of normal). A similar pattern was seen at Stevens Pass-Grace Lake station (1460 m) with snowpack depth on April 1 of 107 inches, increasing to 114 inches by April 9 and decreasing to 82 inches by May 1. These stations are several hundred meters below glacier elevations. At Lyman Lake Snotel (1800 m) snowpack SWE which most closely matches the glacier elevations was 40.1 inches rising to 42.5 inches by April 11 and declining to 35.9 inches by May 1, ~60% of normal. At the Middle Fork Nooksack site (1520 m) snowpack was 44.8 inches SWE on April 1, rising to 49 inches by April 11 and declining to 46 inches on May 1, 67% of normal . This illustrates that at glacier elevations snowpack would have also increased in mid-April, before a slow decline in the latter part of the month. There were a number of atmospheric rivers that drove a higher snowline than usual as May starts, but also led to a rapid increase in snowpack above the snowline.
The mean April 1 SWE from 1946-2025 at six long term SNOTEL stations: Stampede Pass, Fish Lake, Stevens Pass, Lyman Lake, Park Creek and Rainy Pass.
As the melt season begins, based on the above the winter snowpack on glaciers on May 1 are 70-80% of normal. Eric Gilbertson measured snowpack on the summit Colfax Peak at 17.3 ft (5.27 m) on April 18, 2025. This is a location that is to some extent wind scoured and would be less than the depth on the adjacent glacier, a normal year there is 8-9 m of snowpack at 2300-2800 m. On Eldorado Peak they found 25.3 feet on April 27, 2025. This is the depth expected for this location in a year with 75-80% of normal snowpack. It is a location that appears to balance enhanced deposition and scour. Weather conditions in the Pacific Northwest are forecast to have above average temperatures for the upcoming 90 day period. This combined with the below average snowpack on glaciers on May 1, will yield another year where ice thickness loss exceeds 1 m across the glaciers, as each of the last four years have. The average from 2014-2024 has been -1.41 m, which is a 1.5 thick slice of the glacier lost each year. The range expected this year is -1.2 m to -2.4 m. How much will depend on the specific weather and the frequency and intensity of heat waves.
Mean mass balance observed in the field annually by the North Cascade Glacier Climate Project.
Quelccaya Ice Cap in 2013 and 2024 Landsat images illustrating snow line at 5600 m in 2024 and retreat leading to lake expansion at Point A-E from 2013 to 2024.
Quelccaya Ice Cap (QIC) is located in the tropical Andes of southeast Peru. Along with Coropuna Ice Cap it is one of two large ice caps in the area. Lamantia et al (2024) observed a 37% decline overall QIC area from 1985-2022, and a 57% decline in snow covered area. They observe snow cover is particularly limited during El Nino events. Here we examine the particularly high snowline and resulting minimum snow cover on QIC in 2024.
Quelccaya Ice Cap in 2024 August false colar and October natural color Sentinel 2 images. Snow line is at 5600 m in October with 25% snowcover.
The 2023-24 winter season featured El Nino conditions. During spring 2024 El Nino ended and neutral conditions persisted through summer. By late August 2024 the snowline on QIC averaged 5500 m (false color Sentinel Image). By late September 2024 the snowline had risen to ~5600 m, leaving the southern 1/3 and eastern arm of QIC with no snow cover, Landsat image. Overall snowcovered area dropped to ~25%, much below the 75% needed to maintain the ice cap (Lamantia et al. 2024). Despite a few minor snow events that briefly covered the ice cap, in late October the snowline had returned to 5600 m with ~25% snow cover. This is the least extensive snow cover since satellite images allow for mapping in 1984, falling below 10km2 . This is lower than the mininmum of ~15 km2 observed in 2023, which along with 1986 and 2016 had featured the lowest snow covered area on QIC (Lamantia et al. 2024). During this late summer period much of ablation is from sublimation (Fyffe et al 2021).
The high snow line elevation of 2024 exposing the majority of the ice caps glacier ice surface, which melts more rapidly than snow cover, leads to rapid thinning and volume loss.
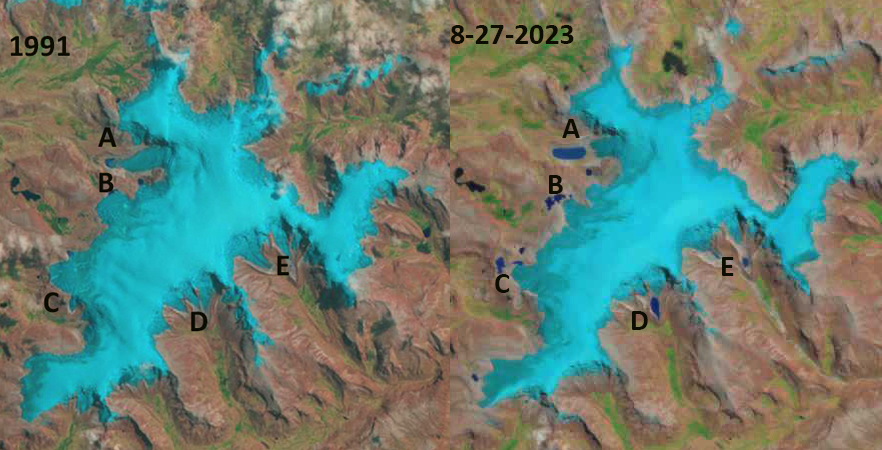
The series of lakes that began to develop after 1991 at the margin of the QIC have expanded, and now are separating from the retreating ice margin.
Quelccaya Ice Cap in 1991 and 2023 Landsat images illustrating snow line at 5500 m in 2023 and retreat leading to lake development at Point A-E from 1991 to 2024.
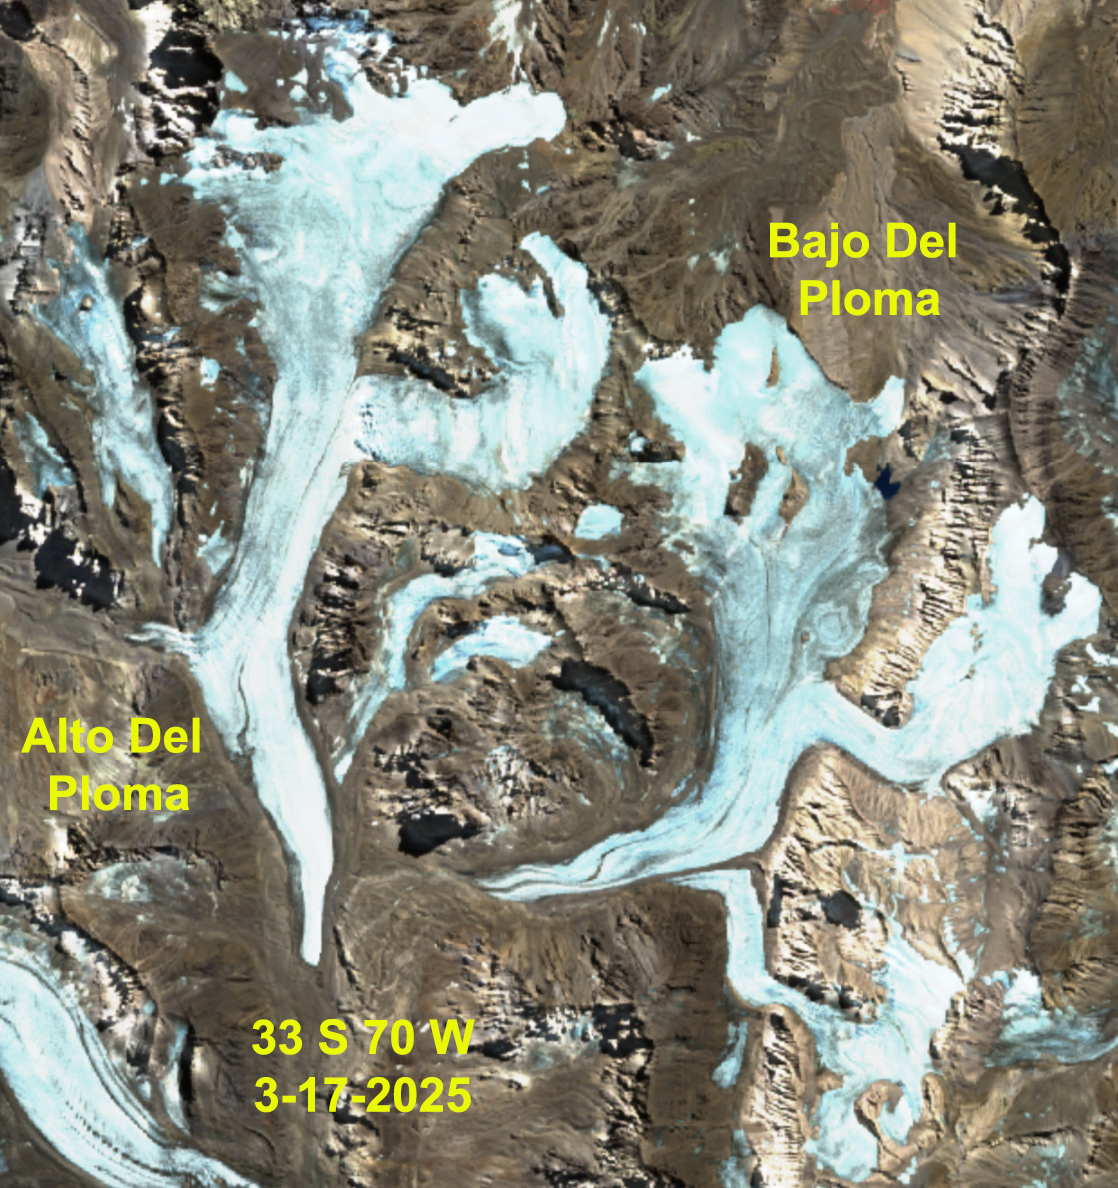
Alto and Baja del Plomo Glacier in false color Sentinel image from 3-17-2025, expanding bedrock areas amidst upper Baja del Plomo Glacier.
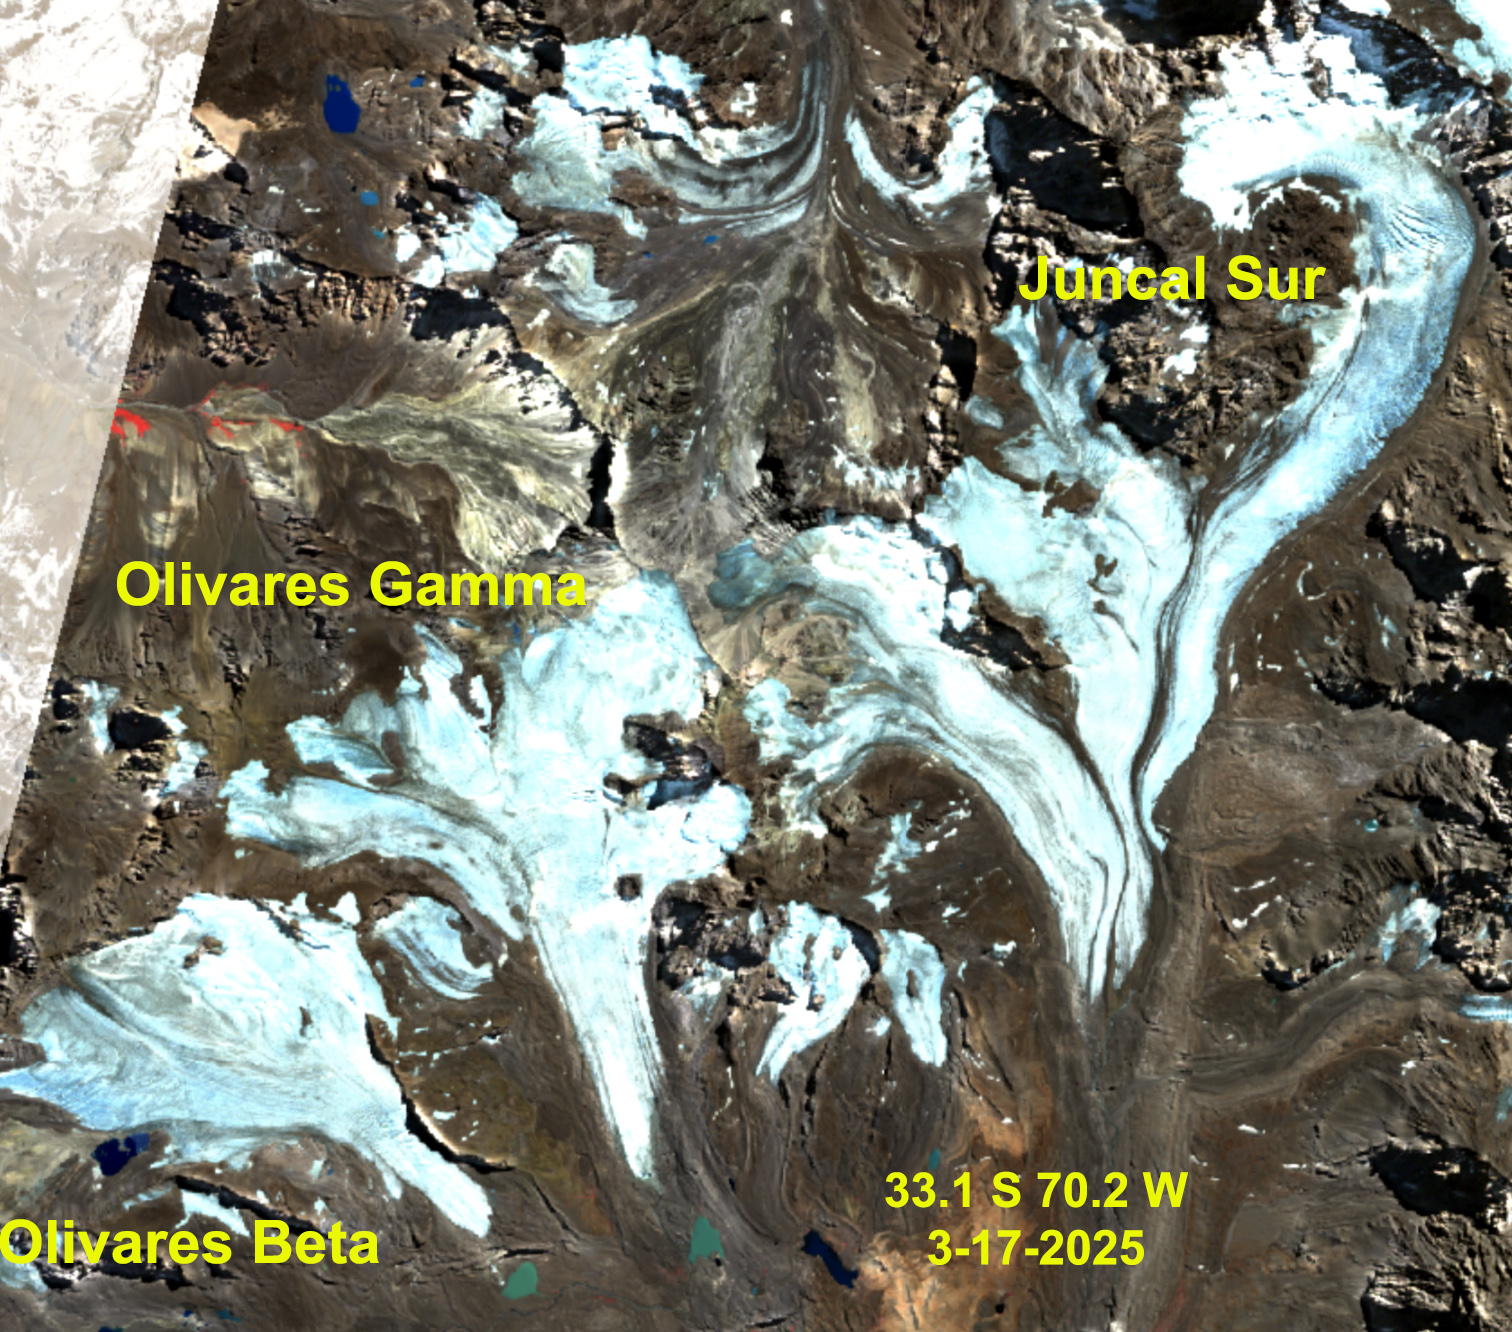
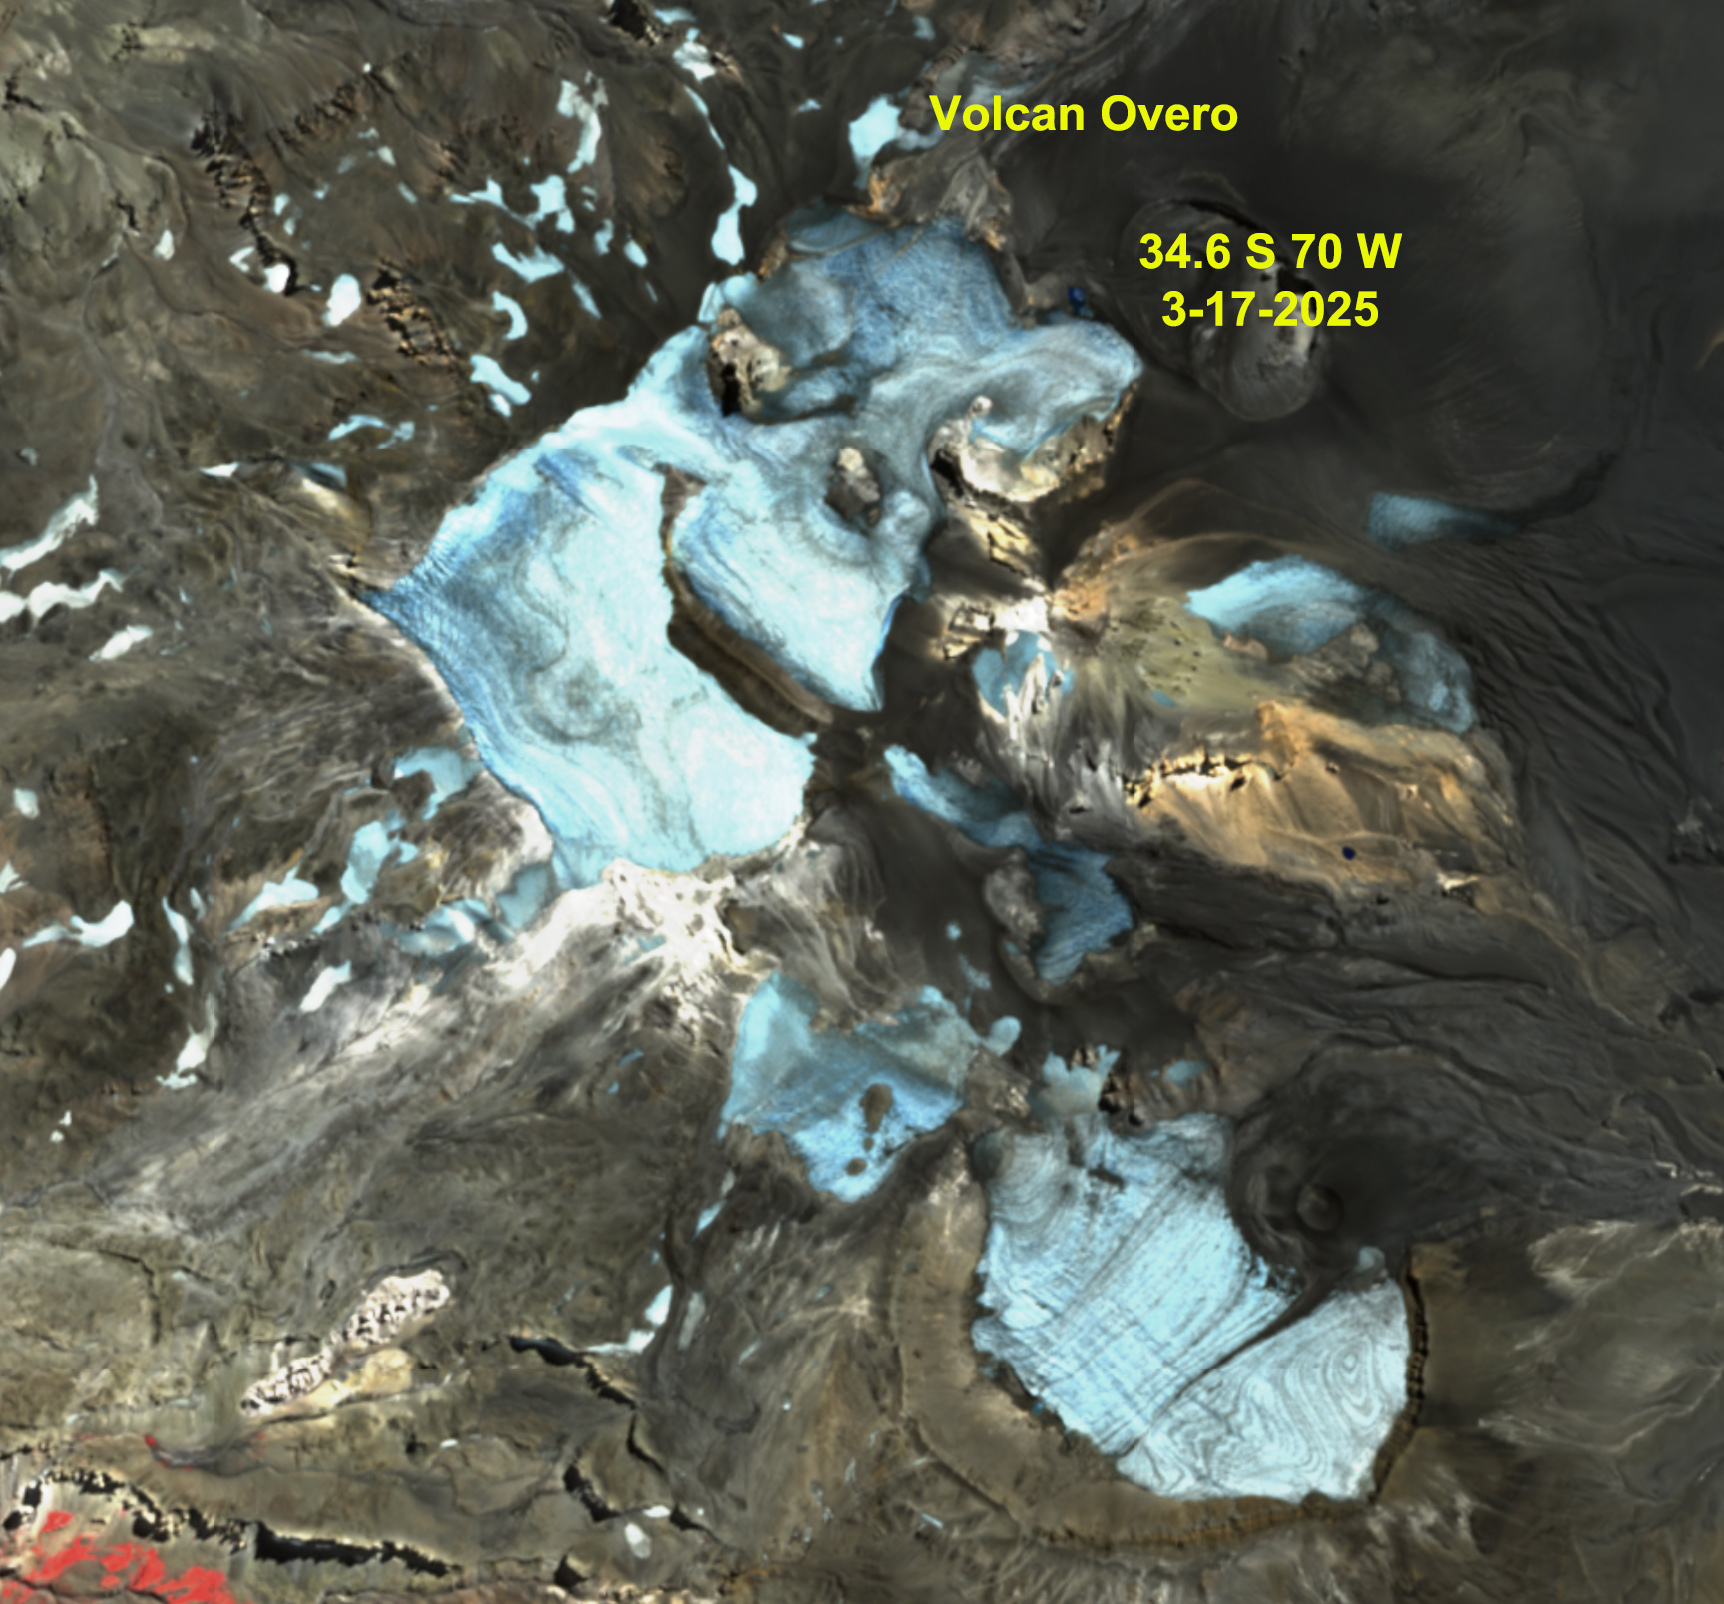
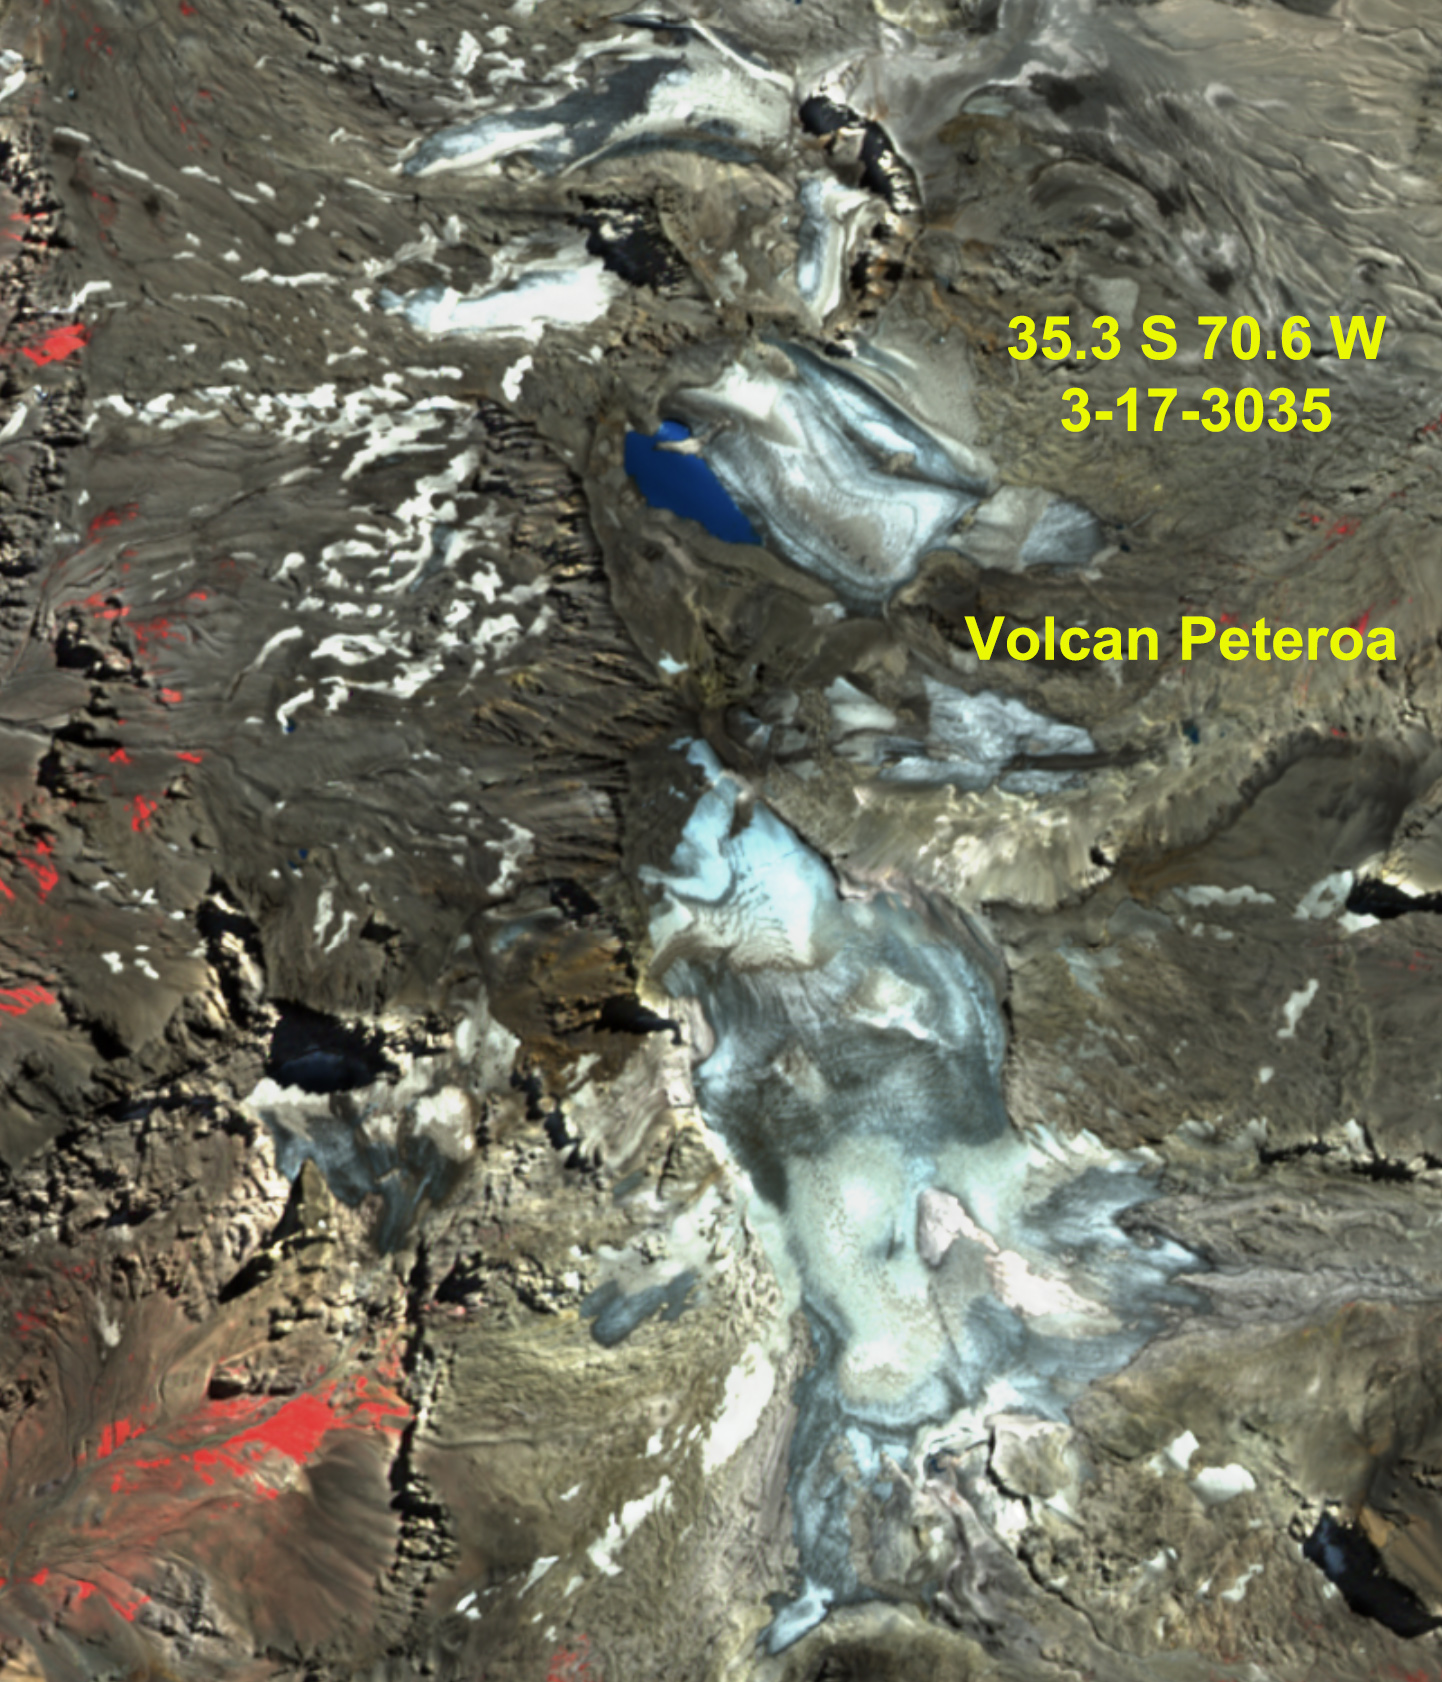
For an alpine glacier to thrive it must remain 50-60% snowcovered throughout the year, even at the end of the summer. To survive it must have consistent significant snowcover at the end of summer, indicative of a persistent accumulation zone (Pelto, 2010). In the Central Andes of Argentina and Chile I have chronicled the near total loss of snowpack, leading to dirty/dark snowcover free glaciers. in 2022 and 2023 (Pelto, 2023). In 2025 this pattern is again apparent. From north of Santiago at Olivares Glaciers and Alta/Baja de Plomo Glacier to east of Santiago at Volcan Overo adn Fiero Glacier to south of the Santiago region at Cobre Glacier and Volcan Peteroa we see glaciers in mid-March with less than 10% snowcover remaining. This is indicative that the 2024/25 mass balance period for the Central Andes will be one of significant loss.
Olivares Glaciers and Juncal Sur in in false color Sentinel image from 3-17-2025,Volcan Overo Glaciers in false color Sentinel image from 3-17-2025, continued fragmentation and expanded bedrock area amidst glaciers evident.Del Humo and Fiero Glacier in false color Sentinel image from 3-17-2025.CobreaGlacier in false color Sentinel image from 3-17-2025, is retreating both at the top (northwest) and terminus (southeast) of the glacier.Volcan Peteroa Glaciers in false color Sentinel image from 3-17-2025.