Pacliash Glacier, Peru Retreat and Lake Expansion

Retreat and lake expansion at Pacliash Glacier (PH) and Palcaruja Glacier in the Cordillera Blanca, Peru illustrated with 1988, 2000 and 2019 Landsat images.  Red arrow is the 1988 terminus, yellow arrow the 2019, purple dots are the snowline.

Pacliash Glacier is in the Cordillera Blanca of Peru, on the northeast flank of Palcaraju and Tocllaraju had until recently terminated in Laguna Pacliashcocha.  This region has seen substantial glacier retreat and area loss.  Glacier lakes have increased in number and expanded during this retreat.   Laguna Pacliashcocha is impounded by a glacier moraine that experienced a breach in 1997, resulting in minor GLOF in 1997 (Carey, 2010).  This led to the temporary drainage of this lake over the next several years (Carey, 2010).  Palmer (2019) reported on the expanding lake volume, continued GLOF hazard and engineering mitigation at the Palcacocha Lake that lies below the Palcaruja Glacier.  Veettil and Kamp (2019) note a 25% decline in glacier area in the Cordillera Blanca after 1987. Here we examine the rapid retreat of the glacier and the consequent expansion of the lake and the impact on GLOF potential.

In 1988 Pacliash Glacier terminated in the lake, which had an area of 0.1 km2 and was 0.4 km long. The lowest 2 km of the glacier was heavily snowcovered and the snowline is at 5000-5100 m.  In 2001 the lake had expanded to an area of 0.18 km2 and 1.0 km long, the snowline was at 5000-5100 m.  By 2016 the glacier has retreated from the lake and terminated 250 m from the lake margin.  The snowline is at 5300-5400 m.  In 2019 the glacier terminates 300 m from the lake margin, the retreat from 1988-2019 is 1500 m.  The lake is 1.25 km long and has an area of 0.28 km2 in 2019.  The snowline is at 5300-5400 m, the higher snowline is the driving force behind the retreat.  The smaller glacier yields less glacier runoff (Carey, 2010).  This is one of many clear examples of glacier watershed fed hydrologic systems and the connected social systems in the Andes being transformed by global change (Mark et al, 2017).

The GLOF threat in this case has declined as the glacier has receded from the lake and is ending on a slope that is not steep enough to easily have an avalanche travel across/from the glacier to the lake.  Palcaruja Glacier has experienced a similar retreat and lake expansion, but has a much steeper slope from the terminus to the lake, hence the avalanche risk into the lake generating a GLOF remains high (Palmer, 2019). Emmer et al (2016) notes that the number of GLOF’s were greater from moraine dammed lakes in the region early in the retreat phase in the 1940’s and 1950’s.  This suggest the moraines are becoming more stable with time since formation and glacier retreat.

Digital Globe image of Pacliash and Palcaruja Glacier in 2016, red arrow is the 1988 and yellow arrow the 2019 terminus.  Blue arrows show glacier flow direction. 


Darwin Glacier, Chile 1986-2020 Retreat Opens New Fjord Arm

Darwin Glacier in Landsat images from 1986 and 2020. Red arrow indicates 1986 terminus location, yellow arrow 2020 terminus location, purple dots the snowline.  Point 1,2 and 3 indicate the same specific location.

Darwin Glacier flows east from the main divide of the Cordillera Darwin entering the head of Fjord Parry. Here we examine changes illustrated by Landsat images from 1986-2020.   Melkonian et al (2013) note widespread thinning of four large glaciers in the Cordillera Darwin Range from 2000-2011; Ventisquero Grande, Marinelli, Darwin and Roncagli, while the Garibaldi Glacier increased in volume.  They note a maximum velocity of 9.6 m/day at Darwin Glacier and thinning of over 3 m/year during the 2000-2011 period, which emcompasses a period of rapid retreat noted below. Davies and Glasser (2012) note that during the 1870-2011 period the Cordillera Darwin area loss was most rapid from 1986 to 2001. Dussaillant et al (2019) note the mass loss for the central Cordillera Darwin at -0.4 to -0.6 m/year from 2000-2018.

In 1986 Darwin Glacier extended beyond the end of a southwest trending valley (Point 3) and had fully separated from the former tributary flowing eastward. Tributaries at Point 1 and 2 join the main glacier within a 2 km of the current terminus. The snowline is at 500 m. By 2000 the glacier had retreated into the southwest trending valley, with a peninsula emerging on the west side at point 3.  The snowline is at 500 m. By 2019 the glacier had retreated beyond the former tributaries at Point 1 and 2. The snowline in 2018 is at 750 m.  In 2020 the peninsula at Point 3 has greened up with new vegetation, the glacier has retreated 3100 m since 1986 exposing a new fjord arm. Point 2 is largely a glacier free valley bottom.  The snowline is at 800 m.  A further 1 km retreat will lead to another tributary separation much as has happened at Ventisquero Grande.

Darwin Glacier in Landsat images from 2000 and 2019. Red arrow indicates 1986 terminus location, yellow arrow 2020 terminus location, purple dots the snowline.  Point 1,2 and 3 indicate the same specific location.

GLIMS view of Darwin Glacier with 1986-2007 margins indicated (Bethan Davies delineated margins).  Flow arrows added.

Talking about Iceberg Melt Rates and Glacier Frontal Ablation: Seller and Heim Glacier, Antarctica

Figure 1: Study sites considered in this article: Seller Glacier and Heim Glacier (Landsat-8 image courtesy of the U.S. Geological Survey)

Post by Mariama Dryak

Iceberg melt is caused by the temperature of the water in which an iceberg floats and the velocity of the water flowing around the iceberg. As a result, iceberg melt is an excellent indicator for the ocean conditions in which an iceberg resides. Given the remote location of Antarctica, and the difficulty in taking direct oceanographic measurements immediately in front of glacier termini in Antarctica, icebergs near glacier fronts can act as a useful proxy for what the ocean conditions are in these areas, especially under changing climate.

Dryak and Enderlin (2020) compared remotely-sensed iceberg melt rates (2013 – 2019) from eight study sites along the Antarctic Peninsula (AP) to glacier frontal ablation rates (2014 – 2018) where they overlapped in time and found a significant positively correlated relationship between the two. In general, iceberg melt rates were found to be much lower on the eastern AP where ocean waters are characterized as very cool relative to the heterogeneous, but generally warmer, waters on the western AP–where iceberg melt rates were higher. When we take a closer look at the data and consider what this means in the context of a stratified water column, the iceberg melt rate magnitudes also make sense relative to one another and what is known of regional ocean conditions.

Here we take a look at the results from two of those study sites: Seller Glacier and Heim Glacier.

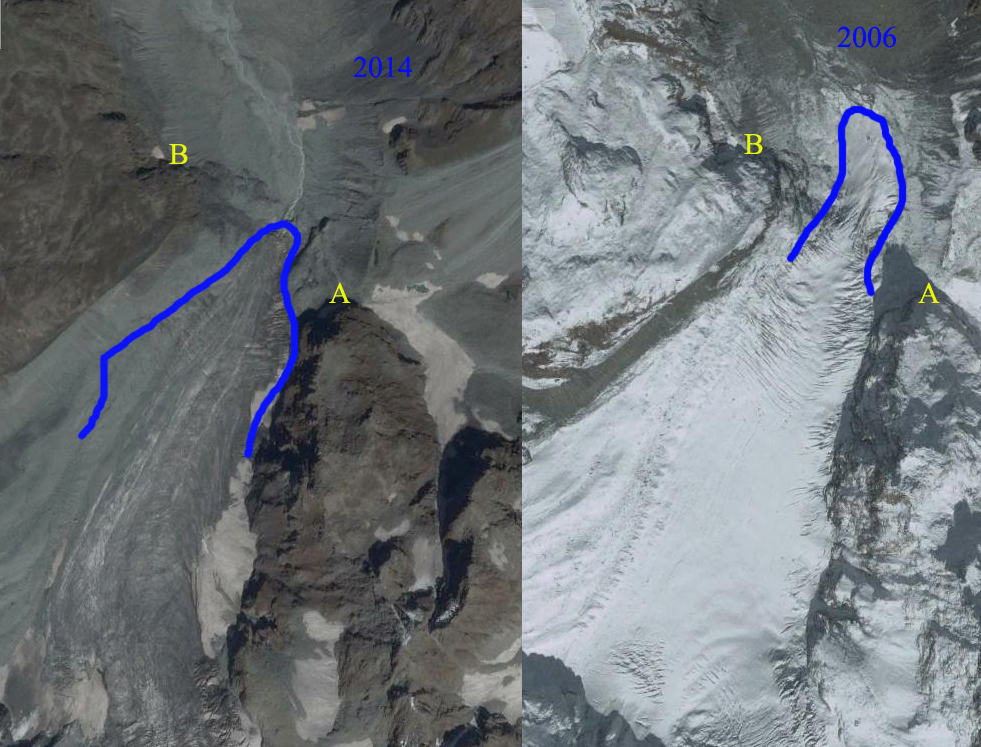
Seller Glacier is the southernmost study site considered in our study on the Antarctic Peninsula, and produces very large, sometimes tabular icebergs with relatively high mean melt rates. Figure 2 indicates the changes in the same iceberg at two points in time. These icebergs are larger than and different in style to all of the other study sites, with the Seller Glacier terminus also being the widest of all the glaciers considered in the study. Due to the large area of the icebergs produced, we know that the keel depths of these icebergs also extend deep into the water column (See Table 1, Dryak and Enderlin, 2020), contacting warm subsurface waters (and some contacting Circumpolar Deep Water (CDW)) as characterized by Moffat and Meredith (2018) in Figure 3 below. In the upper layers these icebergs also sit in the very cold Winter Water (WW) layer and expanded section of Antarctic Surface Water (AASW) prevalent in the Seller region.

Figure 2: An iceberg from Seller Glacier in 2014 and later in 2016. Mean submarine melt rates for the Seller Glacier icebergs from this time period were 6.54 cm/day (Imagery © [2019] DigitalGlobe, Inc.)

Figure 3: Figure 3 from Moffat and Meredith (2018).

Frontal ablation rates at Seller Glacier are higher than expected given iceberg melt rates at the other sites on the western Antarctic Peninsula (Figure 4). Dryak and Enderlin (2020) suggest this to be because of a long-term dynamic adjustment of the Seller Glacier in response to the collapse of the Wordie Ice Shelf, which occurred between 1966 and 1989 (Vaughan, 1991)-a similar case to the sustained elevated velocities witnessed at Crane Glacier on the eastern Antarctic Peninsula following the collapse of the Larsen B Ice Shelf in 2002.


Figure 4:     Scatterplot of iceberg melt rates and frontal ablation  for nearby glaciers over near-coindicdent time periods. Symbols indicate median frontal ablation rates. Figure 8 from Dryak and Enderlin (2020)

In contrast, the study site at Heim Glacier, north of Seller Glacier, contains smaller, shallow icebergs with low iceberg melt rates on par with iceberg melt rates found on the eastern Antarctic Peninsula. The glacier that produced the sampled icebergs, though not the smallest of the sites sampled, produces icebergs small in area that often do not last from one season to the next. The keel depths of the sampled icebergs at Heim Glacier likely do not reach below the cold WW layer (Table 1, Dryak and Enderlin, 2020), terminating in the very cold water layer or above in the compressed and comparatively cool AASW. However, the Heim study site is also located near the Marguerite Trough, an area of deep bathymetry known for the presence of warm waters, so the low melt rates here may be surprising to some without taking a closer look at the specific locale. Our study suggests that the bathymetry of the area in which the icebergs reside might be sheltered due to the presence of Blaiklock and Pourquoi Pas Islands, which may deflect warmer waters from reaching the Heim Glacier.

Frontal ablation rates at Heim Glacier are low, and of a similar magnitude to eastern Antarctic Peninsula sites, corresponding in magnitude to the low iceberg melt rates for the site as well (Dryak and Enderlin, 2020; Figure 8).

Overall, this paper re-emphasizes the importance of considering the ocean’s role in forcing changes on glaciers that terminate in the ocean around Antarctica, especially under changing climate. With the ocean acting as a large sink for excess heat in the atmosphere, evaluating the consequences of the storage of this heat in the ocean is essential when attempting to understand the feedback mechanisms associated with such change. The moral of the story is that we must keep one eye on the ocean going forward and how it could lead to changes in glacier dynamics, which could lead to changes in the contributions of glaciers to sea level and the marine ecosystems that exist within the ocean.

For full results and discussion of all of the study sites considered along the western and eastern sides of the Antarctic Peninsula, read the full Dryak and Enderlin (2020) article in the Journal of Glaciology.

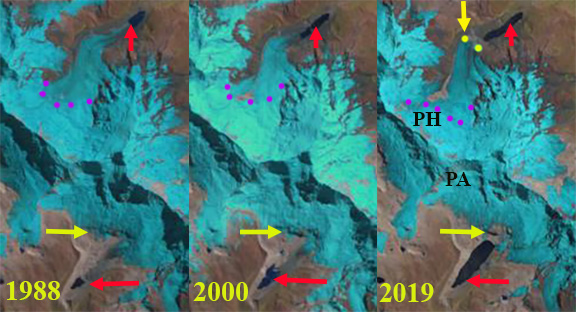
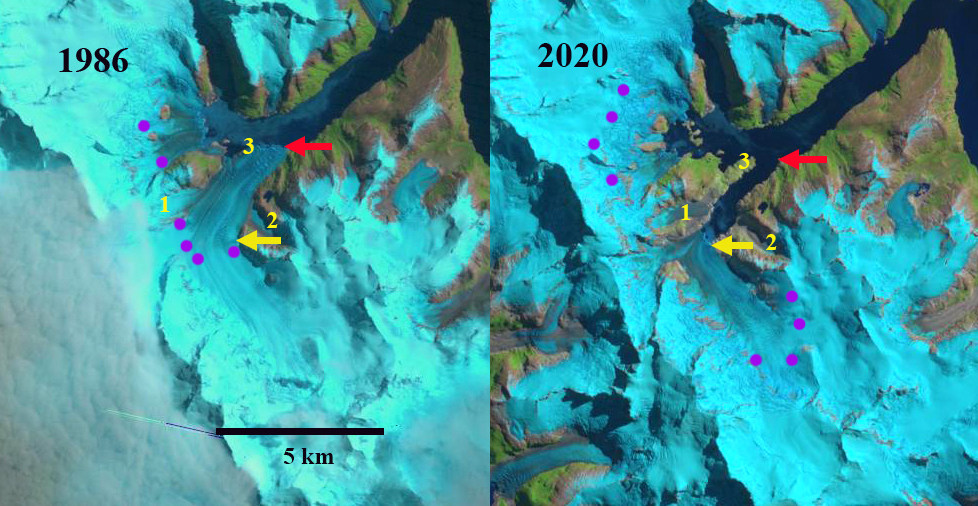
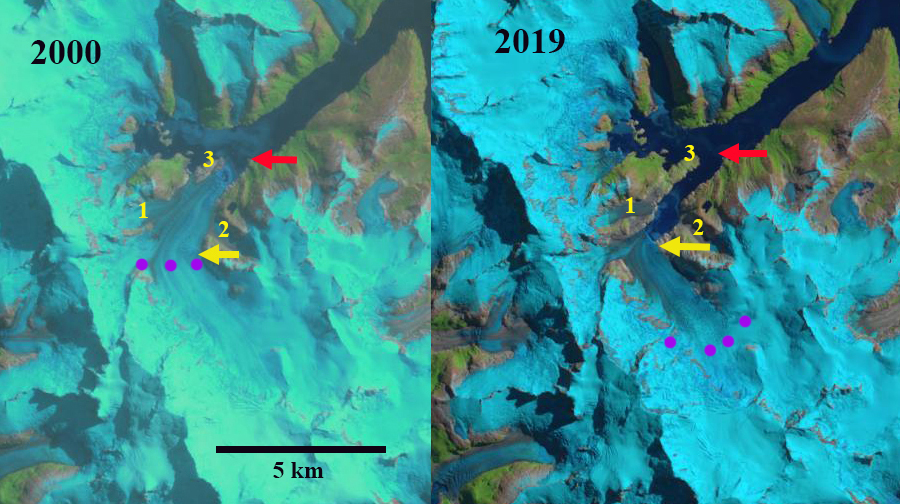
*Note the Seller Glacier like many others in the region have experience rapid retreat in the last 30 years, Fleming Glacier, Sjogren Glacier and Boydell Glacier.

Frank Mackie Glacier, BC Retreat Forming Lake

Frank Mackie Glacier, British Columbia in Landsat images from 1987 and 2019.  Red arrow is the 1987 terminus location, yellow arrow the 2019 terminus location and purple dots the snowline. Point 1-3 are specific locations where bedrock exposure has expanded.

Frank Mackie Glacier is at the headwaters of the Bowser River which flows into Bowser Lake and the Nass River in NW British Columbia. The glacier has repeatedly advanced across the Bowser River valley in northwestern British Columbia into standing forests to impound Tide Lake during the Holocene (St. Hilaire and Smith 2015).  They reported that the last advance creating the lake ended around 1930 when the lake drained catastophically.  The Nass Riverhas significant salmon populations with the Coho Salmon populations doing well with ove 150,000 returning spawners annually, which is above the historic average Nass River salmon.  Chum Salmon are significantly below the historic average near historic lows in recent years (Salmon Explorer).

In 1987 the glacier extends across a basin in the valley bottom terminating at bedrock knob,  1 km south of a proglacial lake.  The snowline is high at 1600 m.  Point 1 is a narrow bedrock ridge and limited bedrock is exposed at Point 2 and 3.  By 1997 the glacier had retreated into a developing proglacial lake basin, there is not lake just some small fringing areas of surface water. The snowline is at 1600 m, with the bedrock ridge at Point 1 having expanded in width and the amount of bedrock exposed at Point 2 having increased significantly.  In 2007 the terminus has retreated into the expanding lake that now has an area of ~0.8 km2.  The snowline is at 1500 m.  In 2018 the snowline by Aug. 26 is at ~1800 m, which is near the crest of two of the three main trunks. By 2019 the lake has expanded to an area of ~1.8 km2. The retreat from 1987-2019 is  1900 m.  The snowline is reaches the divide of two of the three main trunks of the glacier, slightly higher than in 2018 at +1800 m (see below).  There are some small high elevation mountain sides feeding the glacier that have retained snowpack. The consistently high snowline underscores the mass loss of the glacier that is driving retreat. For a glacier in this region to be in equibrium it needs at least 55% of its area (AAR) to be in the accumulation zone.  In 2018 and 2019 this area is below 20%.

The snowline was also a record high on the Juneau Icefield in both 2018 and again in 2019 (Pelto, 2019). Menounos et al (2018) identify large mass balance losses from 2009-2018 in this region.  The nearby Porcupine Glacier has experienced an even more rapid retreat.

Frank Mackie Glacier, British Columbia in Landsat images from 1997 and 2007.  Red arrow is the 1987 terminus location and yellow arrow the 2019 terminus location. Point 1-3 are specific locations where bedrock exposure has expanded.

Map of Frank Mackie Glacier (FM) with adjacent Berendon (B), Clara Smith (SC) and Knappi (K) Glaciers indicated.  Blue arrows indicate flow direction.  The map indicates the terminus position close to the 1987 position.

Frank Mackie Glacier  (FM)snowline on 8/26/2018 and 8/29/2019 in Landsat images-purple dots indicate the snowline, B=Berendon Glacier, K=Knappi Glacier.

Huron Glacier Retreat, Livingston Island, Antarctica 2001-2020

Huron Glacier (H) and Kaliakra Glacier (K) in 2001 and 2020 Landsat images.  Extensive retreat at bedrock locations Point A and B with limited retreat at C and D.

Livingston Island, Antarctica is part of the South Shetland Island chain and is primarily covered by glaciers.  At the eastern end is Huron Glacier. Huron Glacier and the adjacent Kaliakra Glacier are tidewater outlet glaciers terminating in Moon Bay on the east end of Livingston Island. Molina et al (2007) noted that persistent warming had led to mass loss  from 1956-2000 on Johnson and Hurd Glacier further west on the island. Osmanoglu et al (2014) observed the velocity and frontal ablation rates of Livingston Island glaciers.  Frontal ablation includes losses from calving and surface melting of the ice face from contact with the ocean and air.  They observed that frontal ablation losses were the same magnitude as surface ablation. Huron Glacier had the highest frontal ablation by a significant amount from 2007-2011 and the higest location of velocity at 250 m/year.  Here we examine Landsat images from the 2001-2020 period to illustrate the retreat of the glacier fronts in Moon Bay.

In 2001 the icefront is 3 km beyond Point A a bedrock knob at the end of a ridge, 3.5 km beyond Point B also bedrock at the end of a ridge, 1800 m beyond Point C and 1500 m beyond Point D.  Snowcover extends to the ice front.  In 2004 there is not a significant change in the ice front position and snowcover again extends to the ice front.  By 2015 the ice front has retreated to within 1 km of Point A. In March 2018 there is evident ablation in the lowest reaches of Huron Glacier.  In February 2020 the ice front has retreated to the bedrock knob at Point A , a 3000 m retreat since 2004. The ice front is 2 km from the bedrock ridge at Point B, a 1500 m retreat since 2004. The ice front retreat on the north side of Kaliakra at Point C has retreated 400 m since 2004.  Retreat on the south margin of Huron Glacier at Point D has retreated 500 m.  Surface melting is also evident in 2020 from Point B to the ice front, with a lateral moraine exposed as was the case in 2018. The 2020 melt season featured record high temperatures in this region of Antarctica leading to high surface melt, such as at Eagle Island Ice Cap.  Surface melt on Livingston Island is less extensive than on the Warsaw Icefield on King George Island  (Petlicki et al, 2017). Retreat of Huron Glacier has been more rapid than on other glacier fronts on Livingston Island this is reflective of the higher frontal ablation rate, which is significantly due to its high velocity.  Osmanoglu et al (2014) note a significant summer velocity increase on Livingston Island glaciers, will increased melt enhance basal water pressure and velocity or lead to a more mature drainage reducing basal water pressure limiting summer velocity increases? The retreat of the calving front is similar to that of Endurance Glacier on Elephant Island.

Huron Glacier (H) and Kaliakra Glacier (K) in 2004 Landsat image and 2015 Landsat image based contour map from Antarctic REMA Explorer.  

Huron Glacier (H) and Kaliakra Glacier (K) in 2018 Landsat image portrayed in Antarctic REMA, note surface melt and lateral moraine material near Point A and B.

Vern Ritchie-Battle Glacier, British Columbia Retreat, Lake Growth, Snowline Rise

Vern Ritchie (VR) and Battle Glacier (B) in 1987 and 2019 landsat images.  Three proglacial lakes have expanded at Points 2-5. WN=West Nunatak Glaier, Y=Yakutat Glacier N=Novatak Glacier, purple dots indicate snowline and green arrows indicate glacier flow direction.

Vern Ritchie and Battle Glacier flow from the Alaska/Canada border of the St. Elias Mountains towards the Alsek River. In 1987 the two glaciers that share both an accumulation zone and a terminus area terminated in small proglacial lakes at 240 m.  The main flow path of  Battle Glacier connects to West Nunatak Glacier and Novatak Glacier, Alaska at a low elevation saddle at 750-800 m. The Vern Ritchie Glacier is 45 km long and extends north parallel to the border to an elevation of 1800 m. A portion of this higher elevation accumulation is separated by a nunatak at Point 1  at ~850 m and joins the Battle Glacier 20 km from the terminus. Here we utilize Landsat images from 1987-2019 to identify the impact of climate change on these two glaciers. Trussel et al (2015) noted an extremely high thinning rate of 4.4 m/year on the adjacent Yakutat Glacier from 2000-2010, and it retreated 7 km losing 45 km2, of area from 2000-2018 (Pelto, 2018). Glaciers of the Glacier Bay region lost ~0.6 m/year from 1995-2011 (Johnson et al 2013).

Un 1987 Vern Rithcie Glacier’s northern terminus near Point 4 rested on an outwash plain. The southern terminus near Point 3 terminated in a 2.5 km2, proglacial lake. Battle Glacier terminated in a narrow fringing proglacial lake with an area of less than 1 km2.  The divide between Battle Glacier and West Nunatak Glacier was in the ablation zone.  The connection at Point 6 to Novatak Glacier is km wide. The snowline in 1987 on Vern Ritchie Glacier was at 1000 m.  In 1998 both lakes had expanded significantly as thinning and retreat accelerated.  The snowline is at 800 m in early August on Vern Ritchie Glacier and is at 750 m on Battle Glacier covering the divide with West Nunatak Glacier. At Point 6 the connection to Novatak Glacier remains wide. By 2015 a proglacial lake had formed at the northern terminus at Point 4 with an area of ~2 km2. The southern terminus glacial lake has expanded to ~6 km2, and has several large icebergs evident. Battle Glacier at Point 5 now terminated in a ~5 km2 lake that has a few icebergs. The snowline is at 1100 m on Vern Ritchie Glacier.

In 2018 and again in 2019 record snowline elevations since 1946 were noted at Taku Glacier near Juneau, AK (Pelto 2019).  In 2018 the nearby Lowell Glacier exhibited a substantial snow swamp (NASA, 2019).  The snowline was the highest observed on Vern Ritchie Glacier at 1340 m. At Point 6 the connection to Novatak Glacier continues to narrow.  The Vern Ritchie northern terminus lake has expanded to 2.7 km2.  The southern terminus lake in 2019 has an area of ~7 km2, a 225% increase since 1987, and again has several icebergs.  Battle Glacier has receded to Point 2 a retreat of 3800 m since 1987 and the lake now has an area of ~6 km2 . The lake also has several significant icebergs.

The main portion of Battle Glacier is fed by flow from the divide region with West Nunatak and Novatak Glacier, which is no longer retaining accumulation on a consistent basis and this portion will melt away.  The connection to Vern Ritchie at Point 1 remains wide, but there is a sill here, that is becoming more evident indicating a reduction in flow.  Vern Ritchis continues to retain snowpack on the upper reaches of the glacier. The retreat of this glacier is less spectacular than nearby Melbern Glacier or Yakutat Glacier.

Vern Ritchie (VR) and Battle Glacier (B) in 1998 and 2015 landsat images.  Three proglacial lakes have expanded at Points 2-5. WN=West Nunatak Glaier, Y=Yakutat Glacier N=Novatak Glacier, purple dots indicate snowline and green arrows indicate glacier flow direction.

Canada Topographic map of the terminus region from Atlas of Canada 

Kolahoi Glacier Retreat and Lidder Watershed Changes, Kashmir

Kolahoi Glaciers (G1 and G2)  in 1993 and 2019 Landsat images.  Red arrow indicates 1993 terminus location and yellow arrow the 2019 terminus location.  The purple arrow indicates a debris covered area of a tributary to G1 that does not have active flow and will be disconnected. A new terminus is forming at yellow arrow left of purple arrow.  Purple dots is snowline.

The Kolahoi Glacier in Kashmir is known as the—”goddess of light”—Gwash Brari. The glacier descends the north side of the mountain with two tongues of the glacier merging above the terminus. The glacier drains into the Lidder River and then the Jhelum River system.  A publication out this week in Water from Irfan Rashid, Ulfat Majeed, Sheikh Aneaus at the University of  Kashmir and Mauri Pelto at Nichols College examined the retreat of the two largest glaciers on Mount Kolahoi, decline in Lidder River streamflow below the glaciers and changes in agricultural land use in the Lidder watershed.

Change in glacier extent of G1 and G2 from 1962-2019 a ~24% decline.

For the Kolahoi Massif climate warming has led to a cumulative deglaciation of ~24% from 1962-2018.  The terminus of  the two largest glaciers G1 and G2 retreated at a rate of 18.3 m/year and 16.4 m/year from 1962-2018 accelerating substantially after 2000. Our analysis identified an upward shift of ELA (end of summer snowline) by ~120 m that indicates an expanding ablation zone and mass loss from the glacier.  The 1993 snowline above is at 4300 m, in 2001 at 4450 m, in 2015 at 4450 m and in 2018 and 2019 at 4650 m, not all of the images are at the end of the melt season. The negative glacier mass balance  prevalent over the region will continue to drive the glacier recession and result in growing season glacier runoff declines. The Landsat images from 1993, 2001, 2015, and 2019 indicate retreat, snowline rise and that the east and west branches of G1 are about to separate.  G1 has been harder hit because less of the total glacier area has remained above the snowline in the accumulation zone than at G2. The higher snowlines have also driven less ice flow which reduces crevassing as the glacier thins and flow is reduced, note adjacent to  Point A between 2006 and 2014.

Terminus of G1 in 2006 and 2014 Digital Globe images, thickness is reduced near Point A and creveassing.

Kolahoi Glaciers (G1 and G2)  in 2001 and 2015 Landsat images.  Red arrow indicates 1993 terminus location and yellow arrow the 2019 terminus location.  The purple arrow indicates a debris covered area of a tributary to G1 that does not have active flow and will be disconnected.  Purple dots is snowline.

The streamflow measured at 5 sites in the Lidder watershed show statistically significant depleting trends that have been a factor in forcing extensive land system changes downstream. At Aru station 8 km below G1, 17 of the last 20 years have had streamflow below average  of 447 m3/sec.  At Gur 68 km downstream from G1 streamflow has been below average 18 of the last 20 years. Stream discharge is reduced here from Aru averaging 183 m3/sec, reflecting the impact of irrigation on reducing flow. Lidder River has  a 4.5 MW Pahalgam Mini Hydel Project, located  ~30 km downstream of G1 snout. The Jhelum River has several large operating hydropower stations and several more under construction including the Karot Hydropower Project a 720 MW run of river project.

Lidder River Annual Mean Streamflow at Aur 8km from glacier and Gur 68 km from glacier.

The area under agriculture in Lidder watershed shrunk by 39% during the same period.  There was a massive expansion of 176% in orchards extent and 476% in built-up areas respectively from 1980-2018. The conversion of irrigation intensive agriculture lands, mainly rice paddy to orchards is attributed to economic considerations and depleting streamflows reported in the region. In the bottom image you can see the appearance of orchards, individual trees evident at Point A-C along with more housing development such as at Point D.

Downstream land-use changes in Lidder watershed between 1980 and 2018.

Images of the same location in 2001 and 2019 in the Lidder Valley. Point A-C are locations that were rice paddies and are now orchards. PointD is an area of increased housing development.

Neumayer Glacier 8.8 km retreat 1999-2020 Fjord Expansion

Neumayer Glacier (N) in 1999 and 2020 Landsat images. Red arrow is 1999 terminus position, pink arrow 2016 terminus location and yellow arrow March 2020 terminus location. K=Konig and T=Three Brothers Tributary, L=glacial lake.

Neumayer Glacier, South Georgia  is a calving glacier that has been retreating rapidly since 1993 that was dynamically connected to the Konig Glacier along its southern margin just where the glacier turns northeast  The glacier ends in a fjord that until recently was too short to be given a name, that empties into Cumberland Bay.  Gordon et al., (2008) observed that larger tidewater and sea-calving valley and outlet glaciers generally remained in relatively advanced positions until the 1980’s.  After 1980 most glaciers receded; some of these retreats have been dramatic (NASA, 2017).  The BAS has a mapping function that provides glacier front positions since early in the 20th century (Cook et al 2010). For Neumayer Glacier the 1938 position is 3.5 km down fjord from the 2006 position. There was essentially no retreat up to 1974 and limited retreat up to 1993. Here we examine 1999-2020 Landsat imagery to identify glacier change.

In 1999 and 2002 the glacier extends passed the junction with Konig Glacier terminating in 2 km wide calving front. By 2002 the glacier had retreated 0.5 km, by 2006 1.8 km, by 2011 3.0 km and by 2016 5.3 km.  A glacier dammed lake (L) along the north shore of the fjord no longer exists in 2016 and one tributary from the south is no longer connected. The glacier appears to have retreated into a deeper section of the fjord then where it ended from 1970-2002. The glacier is on the verge of separation into two main tributaries, Konig and Neumayer. In 2016 the calving front is 1.6 km long for Neumayer.  Konig Glacier has a 1.3 km long tidewater front, but has limited calving. In 2018 I reported that the glaciers had separated (Pelto, 2018), with Neumayer Glacier still being in rapid retreat and Konig Glacier changing little. A tributary (T) from the south that parallels the Three Brothers Range, is still connected to Neumayer Glacier. In January 2020 the glacier remains connected to tributary (T). By early March 2020 the glacier has further retreated separating from tributary (T).  The total retreat from 1999-2020 is 8.8 km, a retreat rate of over ~420 m/year. In the BAS map it is evident that there is a smaller slope change 2 km from the current terminus and a large slope change 5 km from the current terminus.  The former may represent the end of the fjord or at least a significant shallower.  The latter slope change is certainly the end of the low slope valley reach of the glacier, whether that be a shallow fjord or not. This is one of the most dramatic South Georgia glacier retreats along with Ross and Hindle Glacier (Pelto, 2017). Cook et al (2010) noted the average retreat of glaciers in this area of South Georgia of 60 m/year for the

Neumayer Glacier (N) in 2002 and 1-2020Landsat images.Red arrow is 2002 terminus position, pink arrow 2016 terminus location and yellow arrow March 2020 terminus location. K=Konig and T=Three Brothers Tributary.

Neumayer Glacier (N) in 2016 and 2018 Landsat images. Red arrow is 2002 terminus position, pink arrow 2016 terminus location and yellow arrow March 2020 terminus location. K=Konig and T=Three Brothers Tributary.

Neumayer Glacier (N)  in South Georgia GIS Map from the BAS showing terminus change. 

Rainbow Glacier Fieldwork 8-7-2018

The video is of a single day of field work on Rainbow Glacier on 8-7-2018.  This was our 702nd day of fieldwork during the project that began in 1984.  On this day the field team consisted of Mariama Dryak, Erin McConnell, Jill Pelto and Mauri Pelto. Rainbow Glacier is a valley glacier on the northeast flank of Mount Baker, a stratovolcano and the highest mountain in the North Cascade Range, Washington.  The glacier begins at a saddle at 2200 m sharing a divide with Mazama and Park Glacier.  The glacier descends from the saddle through an icefall at 1950 m into the Rainbow Creek valley terminating at 1400 m.  The consistent accumulation area extends from 1800 m to the saddle region above 1950 m. The glacier tongue features a deeply incised supraglacial stream channel.  From 1984-2018 cumulative mass balance loss has exposed several bedrock knobs along the southern margin of the glacier.

Runoff from the glacier drains into Baker Lake, a reservoir for the Baker Dam hydropower facilities that have a generating capacity of 215 MW. Rainbow Glacier advanced during the 1950-1979 period building a terminal moraine.  At the time of the first field season in 1984 the glacier was still in contact with this moraine.  From 1984-2018 the glacier has retreated 620 m. In 2018 the mass balance was -0.53 m.

Terminus of Rainbow Glacier in 2018


Figure 1 is a map of the Rainbow Glacier indicating the mass balance measurement network.


Mass balance map of Rainbow Glacier in 2017 with mass balance isoline in m of water equivalent (Map by Ben Pelto)

San Lorenzo Sur Glacier, Argentina Retreat 1986-2020

San Lorenzo Sur Glacier in Landsat images from 1986 and 2020.  Yellow arrow is the 2020 terminus location, red arrow the 1986 terminus location, purple dots indicate the snowline. Point A indicates a location at 1400 m where debris cover has expanded.

San Lorenzo Sur Glacier is the main eastern outlet glacier of the Monte San Lorenzo range on the Chile-Argentina border. This Argentina glacier flows east from the border separating into an eastern (sometimes referred to as Rio Lacteo Glacier) and southern terminus tongue, that in 1986 terminated in two small developing proglacial lakes. From 1985 to 2005/2008 Monte San Lorenzo glaciers lost 18.6% of their area (Falaschi et al 2013). In this region glaciers thinned by ~0.5 m/year from 2000-2012 with most of the thinning on  San Lorenzo Sur Glacier occurring on the lower sloped valley section below 1400 m (Falaschi et al 2017). The glacial history of the region has been documented with detailed visual depictions including dated Holocene moraines and trimlines encircling the developing proglacial lakes by Davies et al (2020), see below example. Here we examine the changes in San Lorenzo Sur Glacier from 1986-2020 using Landsat images.

In 1986 the southern terminus ended in a 0.5 km2 proglacial lake, while the eastern terminus ended in a developing proglacial lake of 0.2 km2.  The snowline is at 1350 m and widespread debris cover begins below 1300 m, with Point A being above this elevation.  By 1999 retreat has led to lake expansion at the southern terminus to 0.8 km2 and 1.1 km2 at the eastern terminus.  The snowline is at 1600 m.  In 2016 debris cover has expanded to Point A and the snowline is at 1800-1900 m.  There are numerous small icebergs in the proglacial lake in front of the eastern terminus.  By 2020 the southern terminus has retreated 2.5 km since 1986, and the proglacial lake now has an area of 3.3 km2.  The eastern terminus has retreated 2.9 km since 1986 and the lake now has an area of 3.2 km2.  Debris cover is now widespread at Point A indicating the ablation zone expansion. The lower 2 km of the southern terminus is a heavily debris covered relatively stagnant zone, poised for retreat. The eastern terminus has a stagnant zone that is 0.5 km wide indicating more limited near term potential for retreat and lake expansion.  The snowline is again at 1800-1900 m.  The elevation of snowline is not sufficient to maintain the larger valley tongues of the glacier. The expansion in area and elevation of debris cover has been observed on Northern Patagonia Icefeld glaciers as well (Glassser et al, 2016), for example on Exploradores Glacier.

Retreat here follows that of adjacent Caluqueo Glacier and the Sierra de Sangra region, Argentina and glaciers of the Northern Patagonia Icefield, such as Fiero Glacier and Acodado Glacier.

San Lorenzo Sur Glacier in Landsat images from 1999 and 2016.  Yellow arrow is the 2020 terminus location, red arrow the 1986 terminus location, purple dots indicate the snowline. Point A indicates a location at 1400 m where debris cover has expanded.

In the map above from Davies et al (2020) GIS app.  The Black arrows indicate dated locations on moraines from ~2000-5000 years ago, while the green arrows indicate deglaciation dates from the Little Ice Age period. Yellow arrows on right hand image indicate Holocene moraines.

Calluqueo Glacier, Chile Retreat 1986-2020

Calluqueo Glacier in Landsat images from 1986 and 2020.  Yellow arrow is the 2020 terminus location, red arrow the 1986 terminus location, purple dots indicate the snowline. Point A-D indicate bedrock areas that have expanded with glacier thinning.

Calluqueo Glacier is the largest glacier of the Monte San Lorenzo range on the Chile-Argentina border. This Chilean glaciers flows west from the border and in 1986 terminated in Lago “Calluqueo”. From 1985 to 2005/2008 Monte San Lorenzo glaciers lost 18.6% of their area (Falaschi et al 2013). In this region glaciers thinned by ~0.5 m/year from 2000-2012 with most of the thinning on Calluqueo Glacier occurring below 1300 m (Falaschi et al 2017). The glacial history of the region has been documented with excellent visual depictions including moraines and trimlines encircling Lago Calluqueo by Davies et al (2020), see below example. Here we examine the changes in Calluqueo Glacier from 1986-2020 using Landsat images.

In 1986 Calluqueo Glacier terminated in Lago Calluqueo at an elevation of 450 m, with a 750 m wide calving front in the 1.7 km 2 glacial lake.  Lago Calluqueo is impounded by a stabilized moraine complex, see map below. The snowline was at 1400 m with Point A, B and C locations of limited bedrock exposure in 1986. By 2000 the glacier had retreated to the western shore of the lake that had expanded to 3.0 km2.  The snowline in 2000 was at 1700 m.  In 2019 the glacier has receded from the lake shore far enough so it no longer has any direct interaction or avalanche potential into the lake. The snowline in 2019 is at 1750-1800 m.  By 2020 the glacier has retreated 1500 m since 1986 to an elevation of 700 m, in the vicinity of bedrock knob Point D that emerged from beneath the ice. The bedrock ribs at Point A, B and C have all expanded by more than 100% since 1986 as the glacier thins. The snowline in 2020 is at 1750-1800 m.

Calluqueo Glacier will continue to retreat given the ongoing thinning and recent persistently high snowline +1700 m elevations. The glacial history and landforms generated in this region are illustrated by Davies (2018). Retreat here follows that of the Sierra de Sangra region, Argentina and glaciers of the Northern Patagonia Icefield, such as Fiero Glacier and Acodado Glacier.

Calluqueo Glacier in Landsat images from 2000 and 2019.  Yellow arrow is the 2020 terminus location, red arrow the 1986 terminus location, purple dots indicate the snowline.

In the map above from Davies et al (2020) GIS app.  1) Cosmogenic Be10 based dates, 2) Sandur, 3) Glacial Trimline, 4) Glacial Moraine, 5) Lichenometry based dates, 6) Empty Cirque. Martin et al (2019) identify 3 and 4 as being of Holocene age formation.

 2) Sandur, 3) Glacial Trimline, 4) Glacial Moraine.  Point A-D same as in top image.

Yalik Glacier, Alaska Retreat and Lake Expansion 1986-2019

Yalik Glacier (Y) in 1986 and 2019 Landsat images.  Red arrow is the 1986 terminus location and yellow arrow the 2019 terminus location. Petrof Glacier (P) is the western neighbor.

Yalik Glacier drains an icefield on the Kenai Peninsula, glaciers draining east are in the  Kenai Fjords National Park, which has a monitoring program.  From 1950-2005 all 27 glaciers in the Kenai Icefield region examined  retreated (Giffen et al 2014).  Yalik Glacier retreated 1057 m from 1950-1986, a rate of-29 m/year and 797 m from 1986-2000, a rate of 57 m/year (Giffen et al 2014).  Here we update the retreat using Landsat images from 1986, 2000, 2018 and 2019.

In the 1950 USGS map of the region Yalik Glacier terminates on a braided outwash plain, and does not have a proglacial lake.  By 1986 there is a 300-400 m wide fringing proglacial lake particularly on the eastern margin with an area of 0.6 km2. The glacier has retreated from the outwash plain into the developing proglacial lake basin.  By 2000 the proglacial lake has expanded to 1.3 km2 due to the ~800 m retreat.  In 2018 the proglacial lake has expanded to 2.1 km2 and a second proglacial lake has formed on the eastern margin.  This proglacial lake will merge with the main lake as the terminus retreats from a peninsula extending from the eastern margin. A bedrock knob has emerged east of Point 1 indicating substantial glacier thinning since 2000. In 2019 the total proglacial lake area is 2.4 km2.  The glacier has retreated 1500 m since 1986 and 700 m since 2000, the latter period has a retreat rate of 34 m/year.  The former braided river  that exited the glacier is now a single meandering stream channel as it leaves the proglacial lake. The retreat of Yalik Glacier is more than nearby Grewingk Glacier and less than nearby Excelsior Glacier.

What is driving the retreat is continued warming including warm summers.  The glacier generated few icebergs during this retreat, indicating melting not calving is the key factor. The 2019 Alaska Climate Review indicates 2019 was the state’s warmest year, see Anchorage example from this report below. Temperatures in nearby Homer averaged 4.2 F above normal with June-August averaging 4.4 F above normal.  These conditions also led to forest fires in the area reducing the 2019 image clarity due to forest fire smoke from the Swan Lake fire that burned ~167K acres.

Yalik Glacier in 2000 and 2018 Landsat images.  Red arrow is the 1986 terminus location and yellow arrow the 2019 terminus location. Point 1 is west of a bedrock knob that has emerged due to glacier thinning.

USGS map of Yalik Glacier in 1951

From the 2019 Alaska Climate Review .