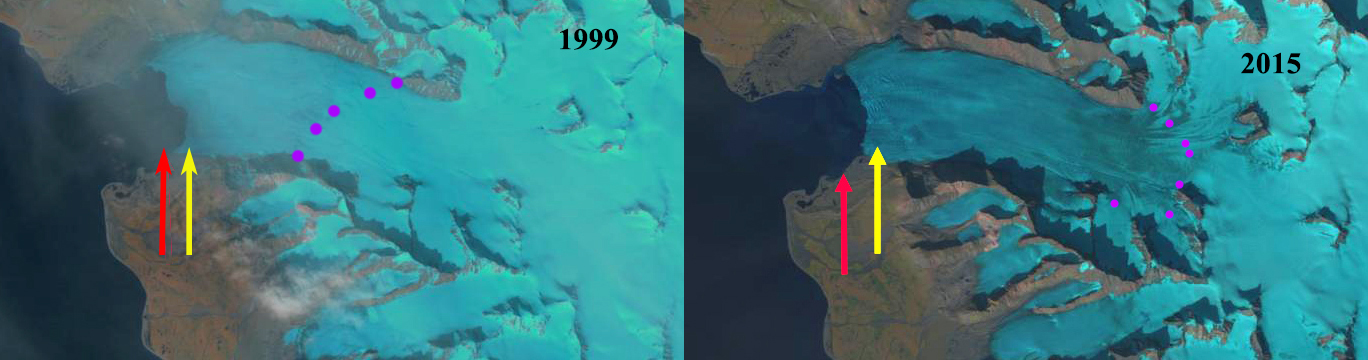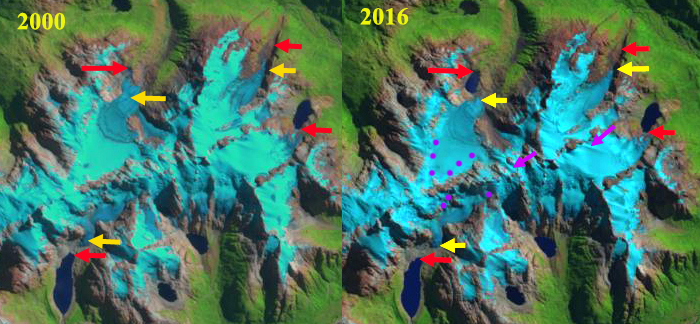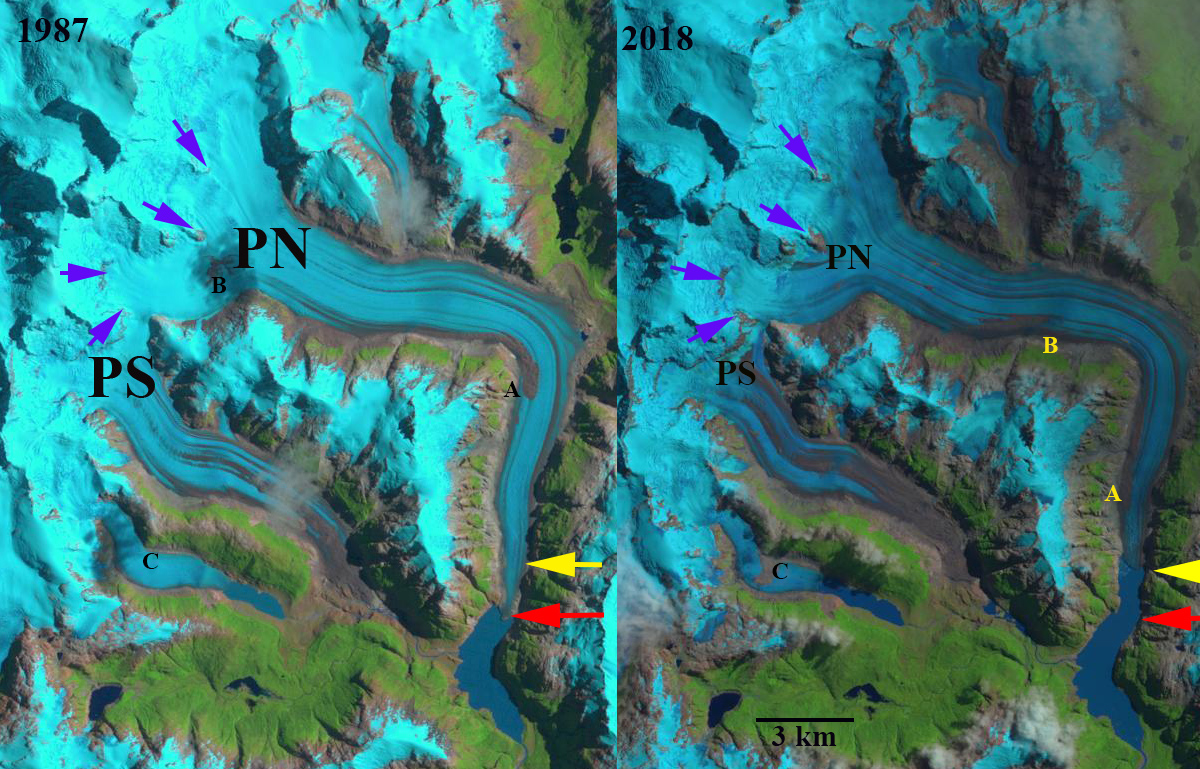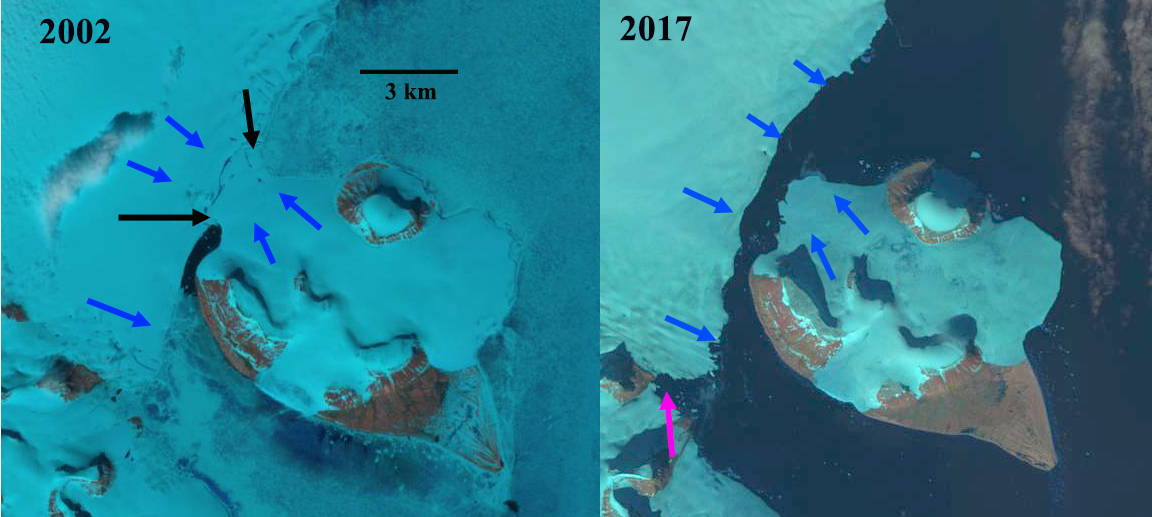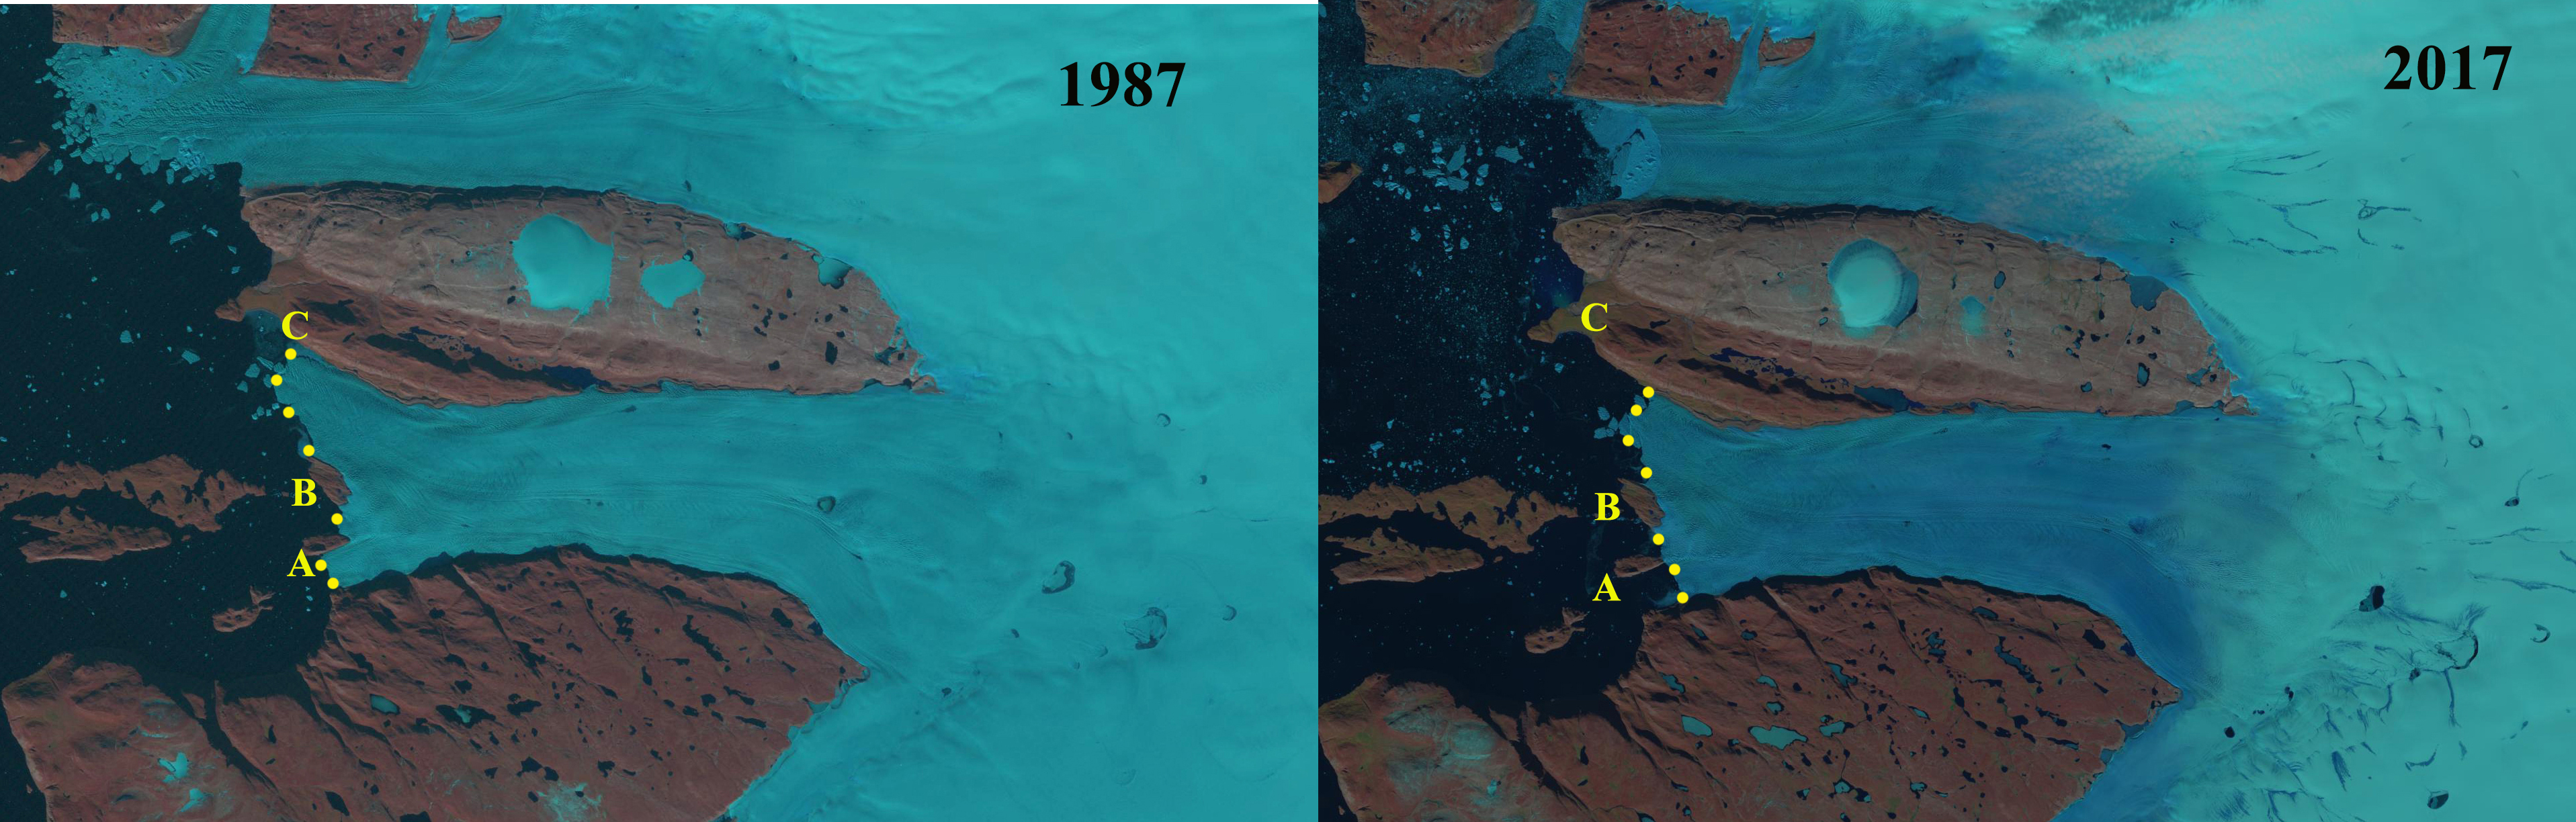
Heilprin Glacier in 1987 and 2017 Landsat images. The ice front is shown with yellow dots. Island A, Island B and Point C also are noted. Island A and B both have reduced ice contact, but remain as important pinning points. How much longer for Island A? Retreat from 1987-2017 is 1.6 km to the south, 1.1 km in the center and 2.2 km on the northern margin.
Heilprin Glacier is an outlet glacier in northwest Greenland. Along with the neighboring Tracy Glacier it drains ~12,000 square kilometers of the ice sheet into Inglefield Bay. Hill et al (2017) note that neither glacier has a floating tongue and that Tracy Glacier has retreated faster. The velocity of Tracy Glacier is also higher than Heilprin Glacier, with most of the calving front exceeding 1200 m/year (Joughin et al, 2010). Heilprin Glacier has a only a narrow section on the northern side that exceeds 1000 m/year (Joughin et al, 2010). Sakakibara and Sugiyama (2018) examined glacier velocity and frontal positions of 19 glaciers in the region including Tracy and Heilprin Glacier. They observed that retreat began in ~2000 which coincided with a regional rise in summer mean air temperature. The outlet glaciers also accelerated and those that did had the greatest acceleration generally retreated the most. Here we examine Landsat images from 1987-2017 illustrating terminus changes.
In 1987 The Heilprin Glacier front was 12 km long with two islands providing pinning points and separating the terminus into three calving regions. The southernmost was south of Island A, Lille Matterhorn, which was 1.7 km wide and extended 1.6 km west from the east end of Lille Matterhorn, total ice contact was 2.4 km. Island B was in contact with the ice on the east side from the southwest to the northwest corner, 3.5 km. The northern segment was the longest calving front at 5.6 km ending at Point C. By 1998 the glacier southern segment at Island A had changed little. Island B was still in contact with the ice along its east side from the southwest to northwest corner. The northern segment had retreated from Point C by 1.4 km. In 2009 retreat south of Island A has begun. In 2017 at Island A the glacier was barely in contact with the island with the southern most calving section having retreated 1.5 km since 1987. Island B was still in contact with ice on the east side from the southwest corner, but no longer at the northwest corner. retreat from the northwest corner is 1.1 km. The total contact with Island B in 2017 is 2.6 km, 70% of the 1987 contact. At Island A the contact is 0.2 km a 90% reduction since 1987. When Island A separates the loss of this pinning point will enhance retreat of the southern section of the ice front. The northern margin near Point C has retreated 2.2 km since 1987. Sakakibara and Sugiyama (2018) identify a velocity change in the terminus reach of 13 m/a from 2000-2014. They also note the retreat rate increased to 109 m/year from 2000-2014.

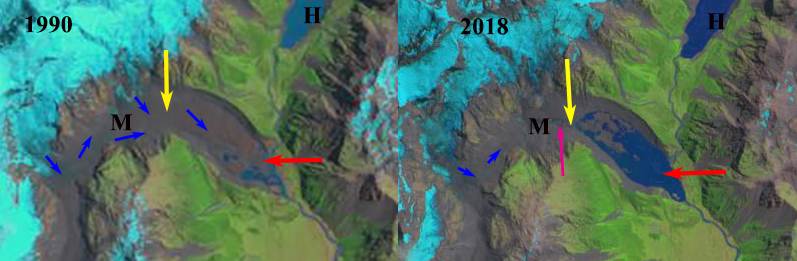
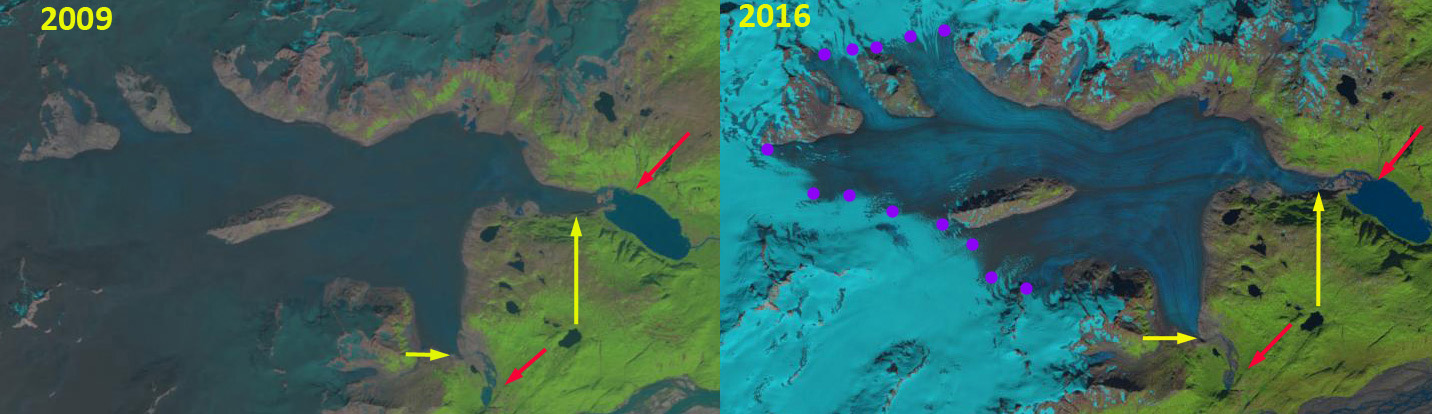
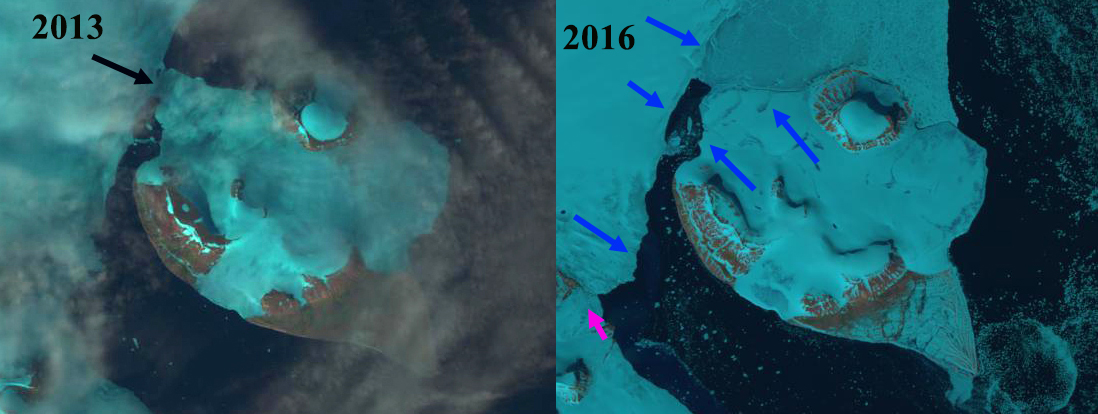
Heilprin Glacier in 1998 and 2009 Landsat images. The ice front is shown with yellow dots. Island A, Island B and Point C also are noted.
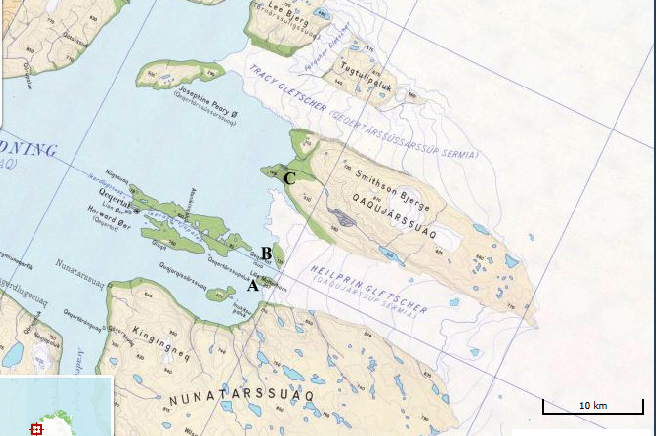
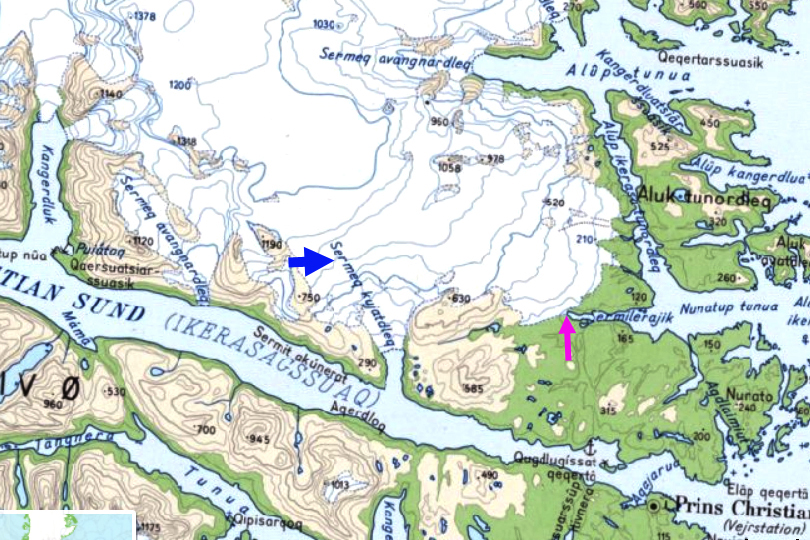
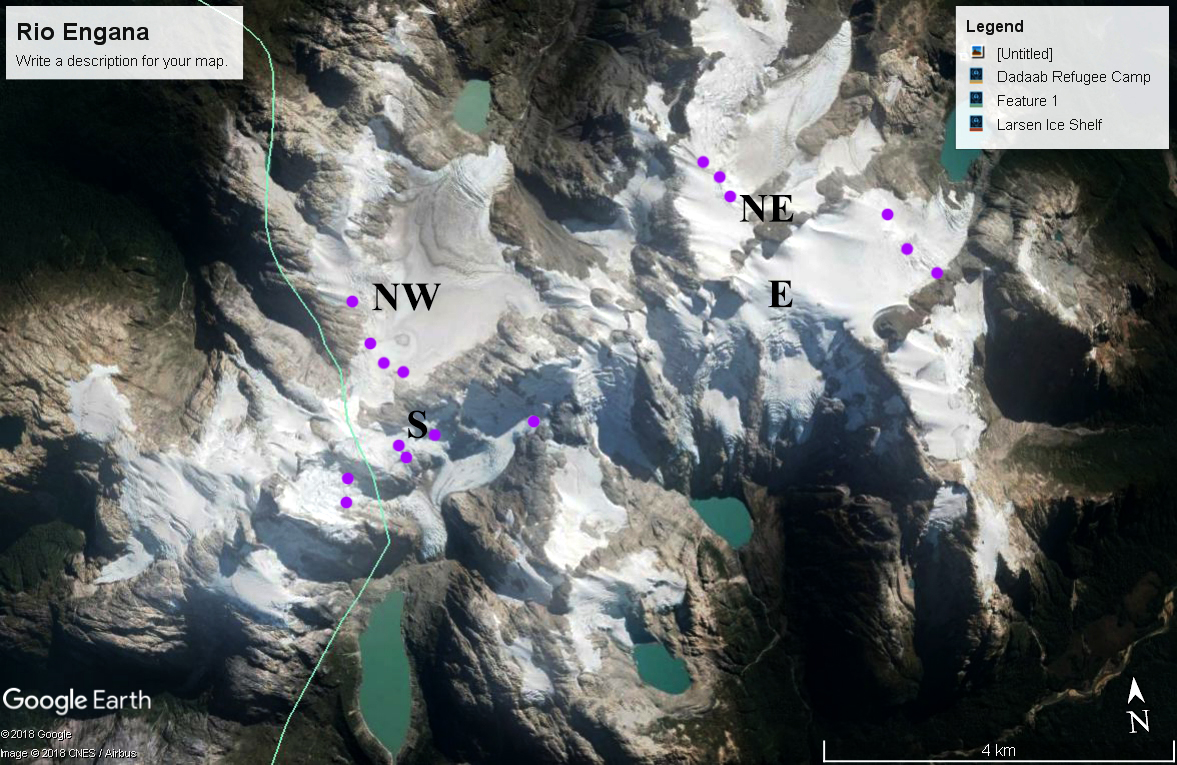
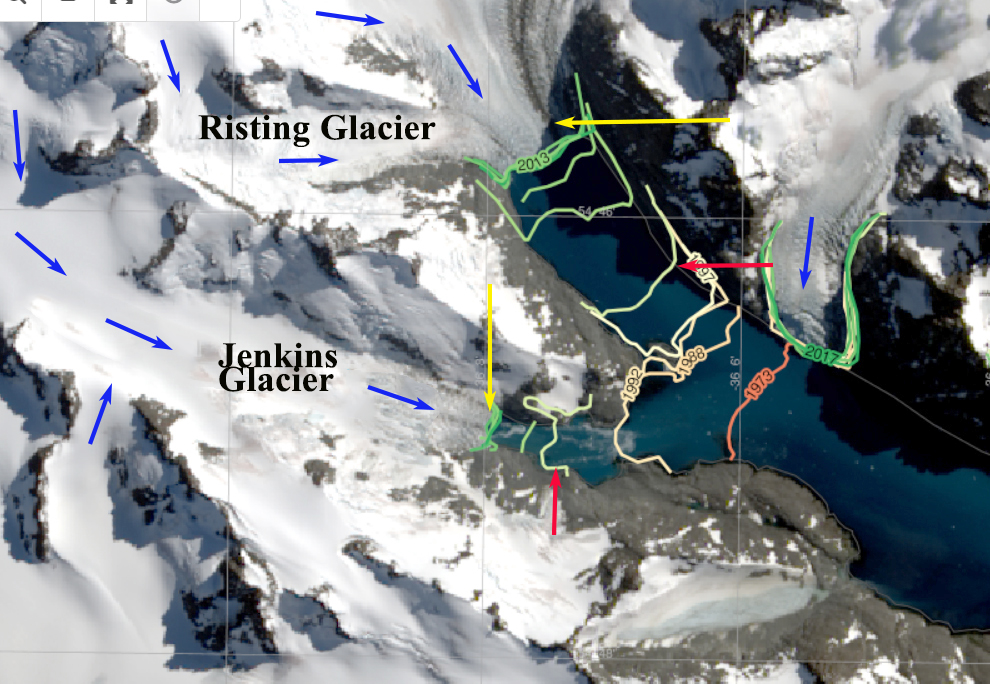
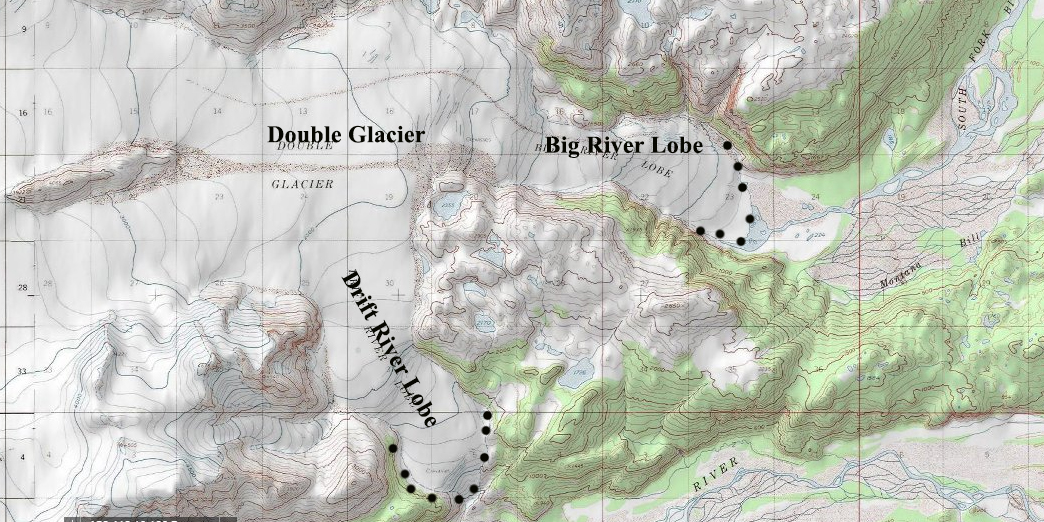
Nuna GIS map of the region indicating Island A and B and Point C. The margin here is from before 2000.