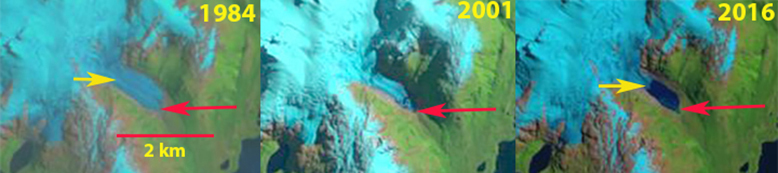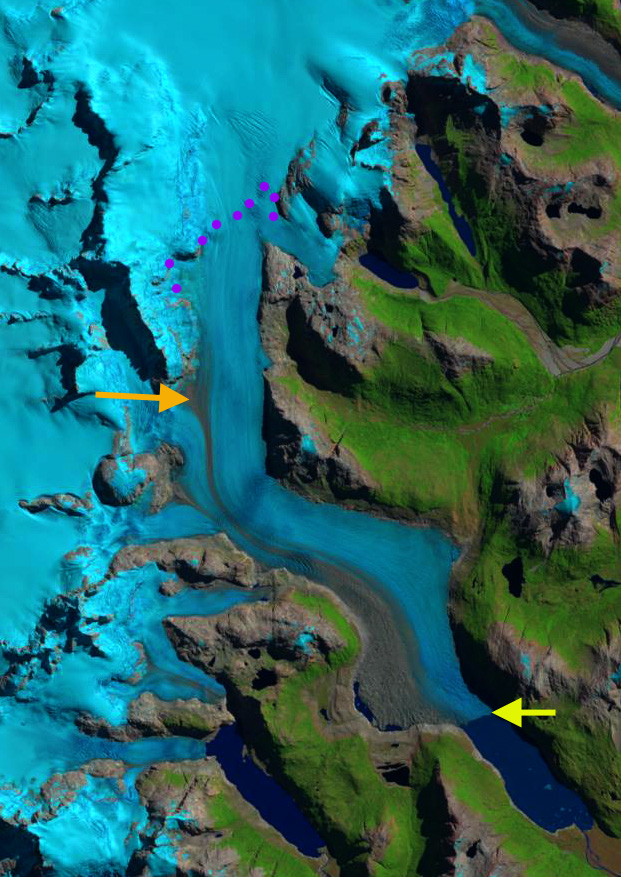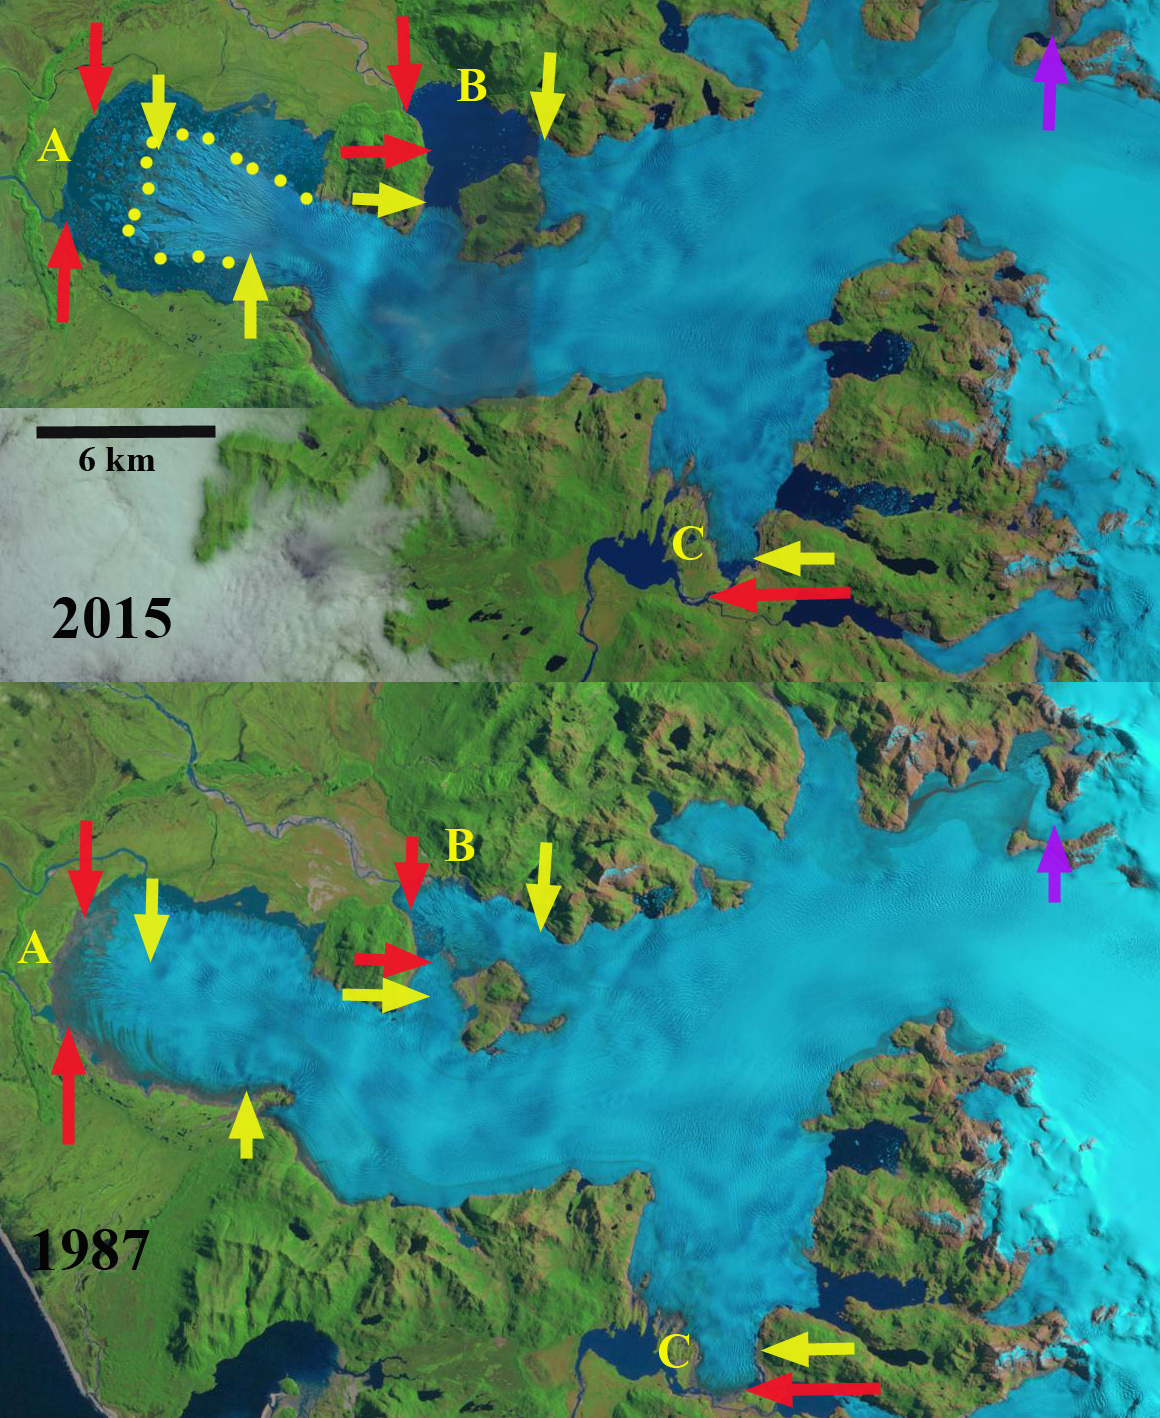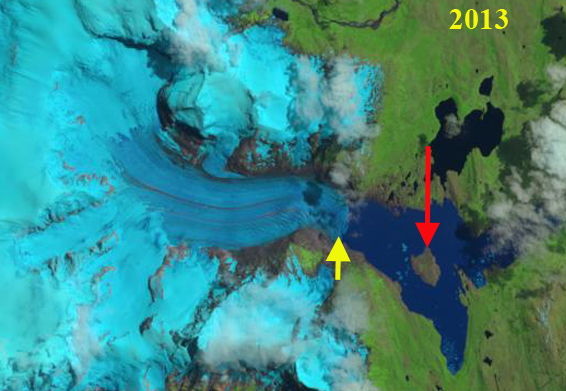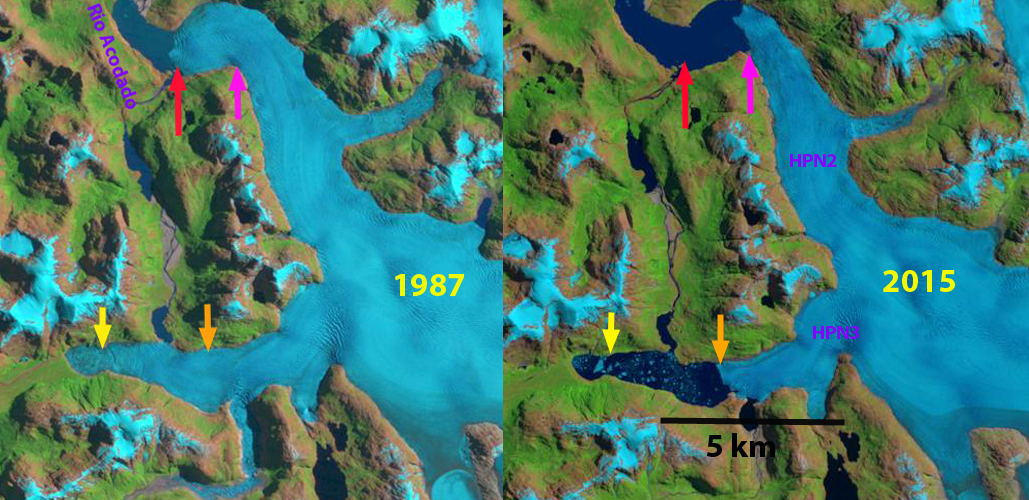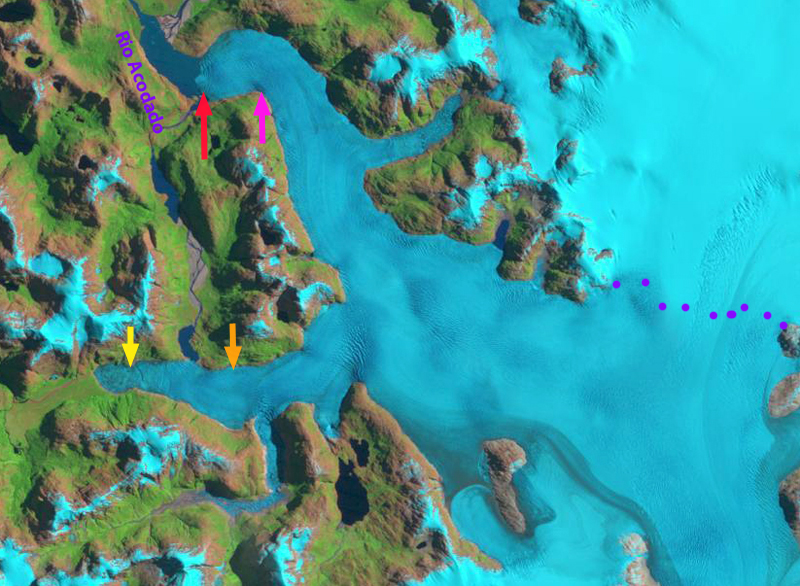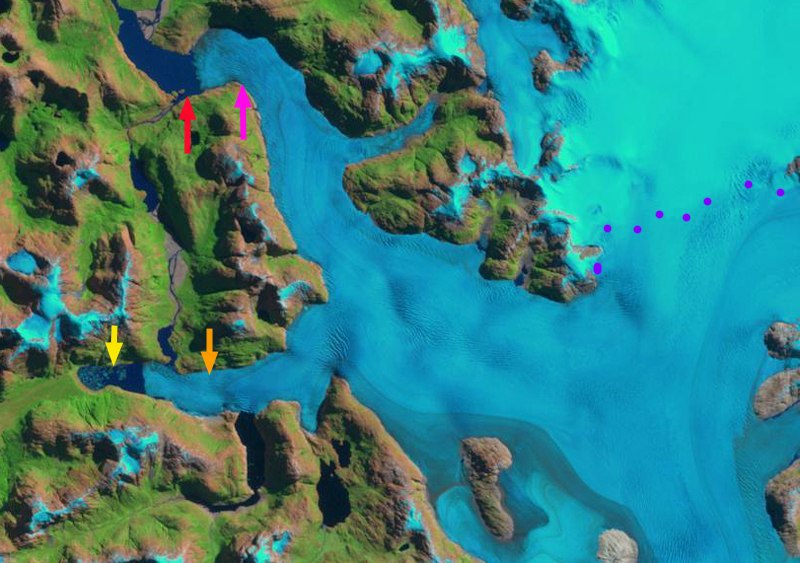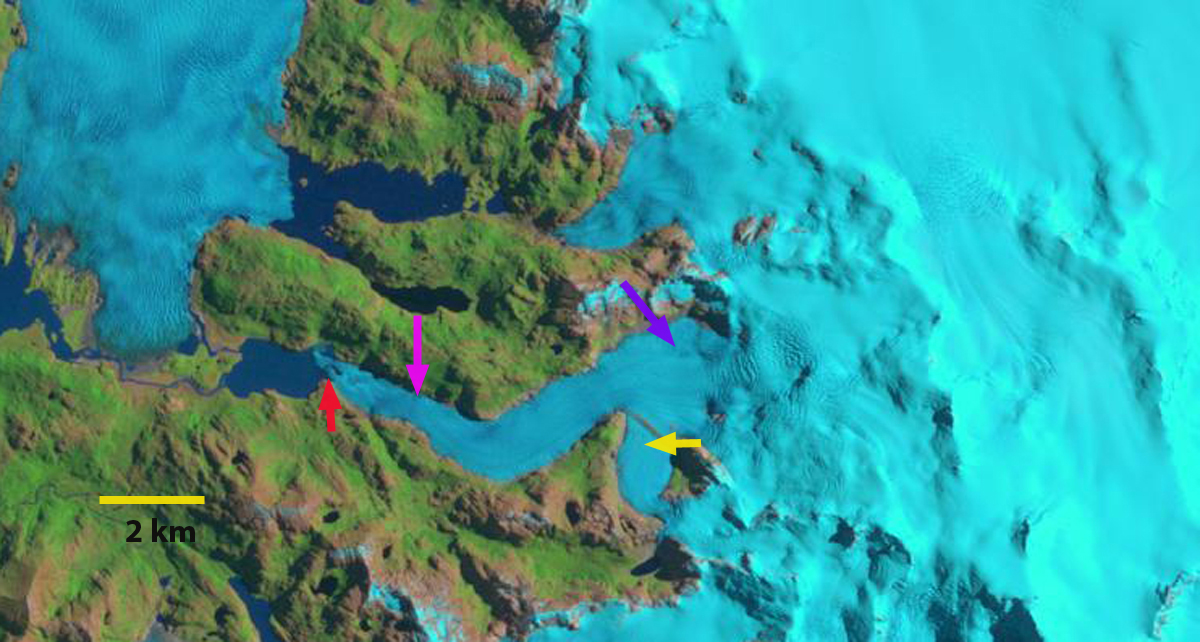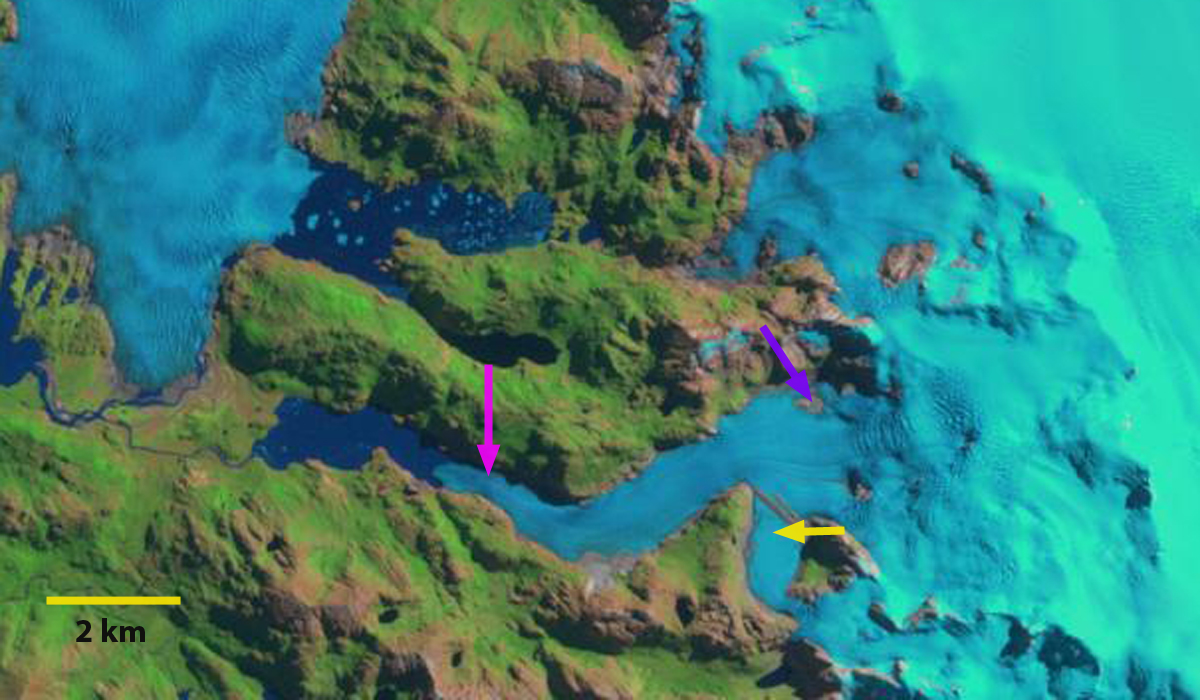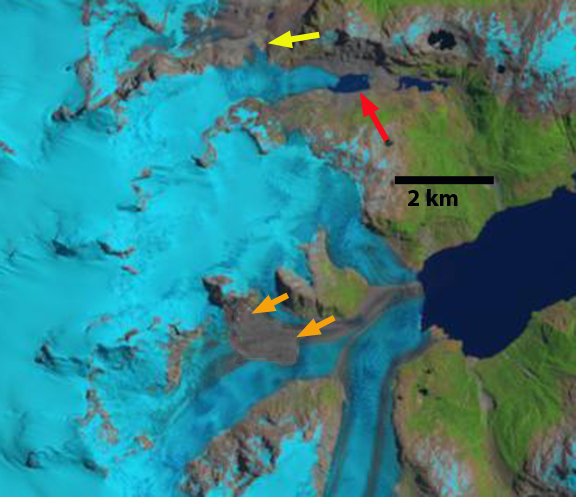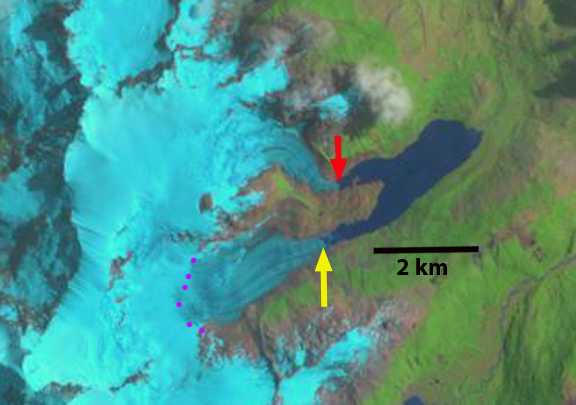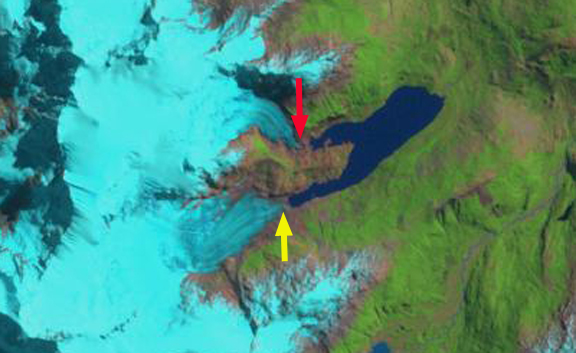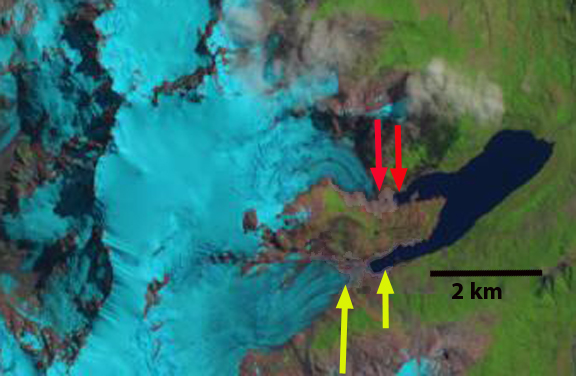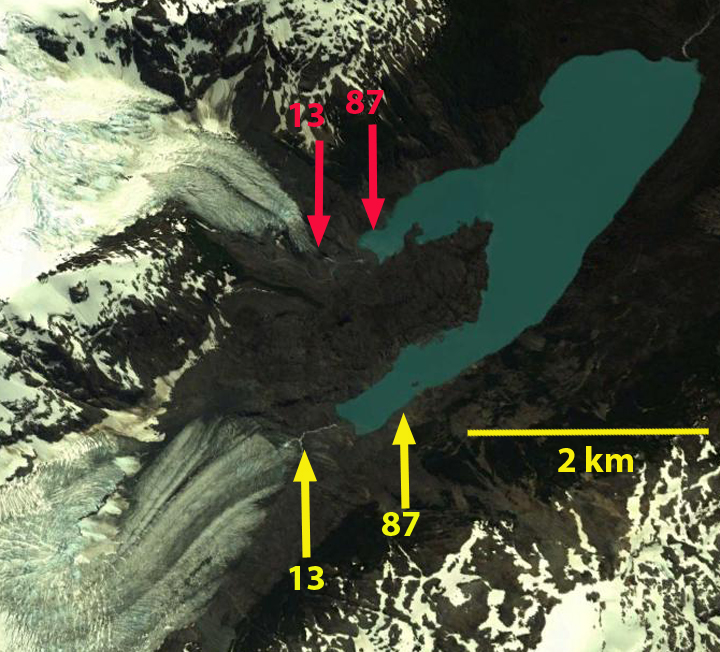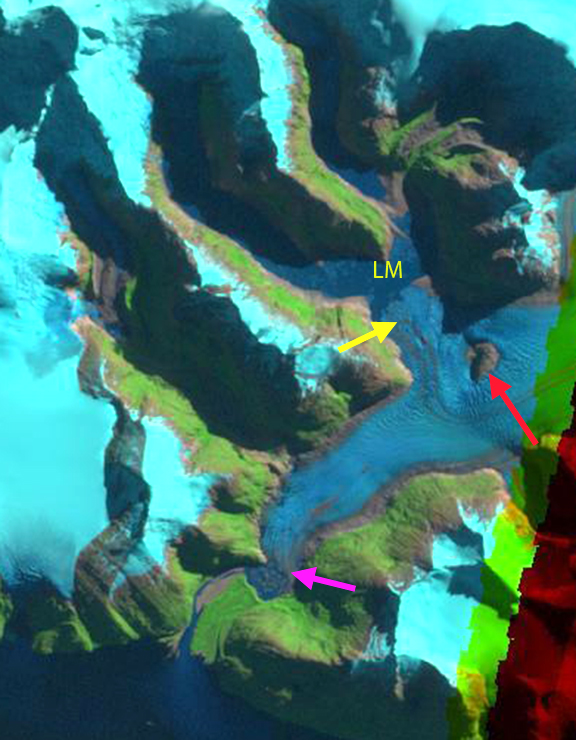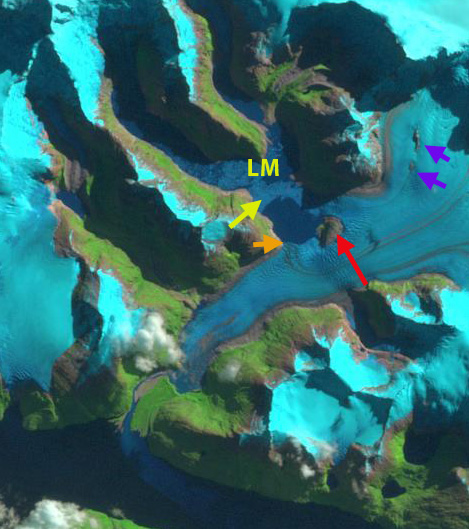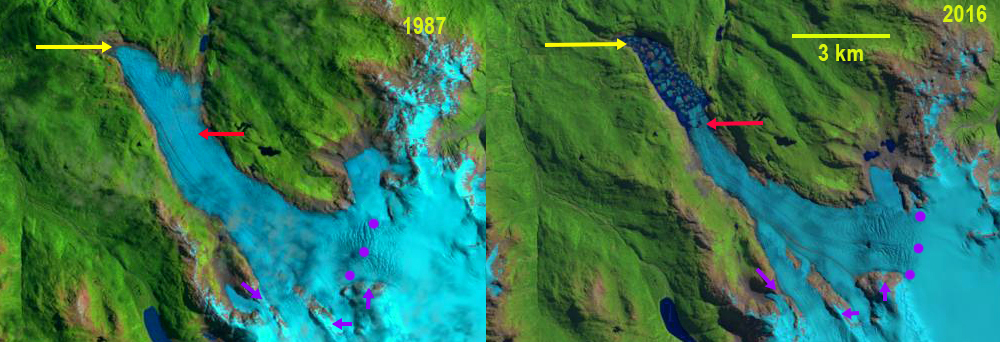
Erasmo Glacier, Chile, comparison in 1987 and 2016 Landsat images. The red arrow indicates the 2016 terminus and the yellow arrow the 1987 terminus location. Purple dots indicate the snowline and purple arrows locations of upglacier thinning.
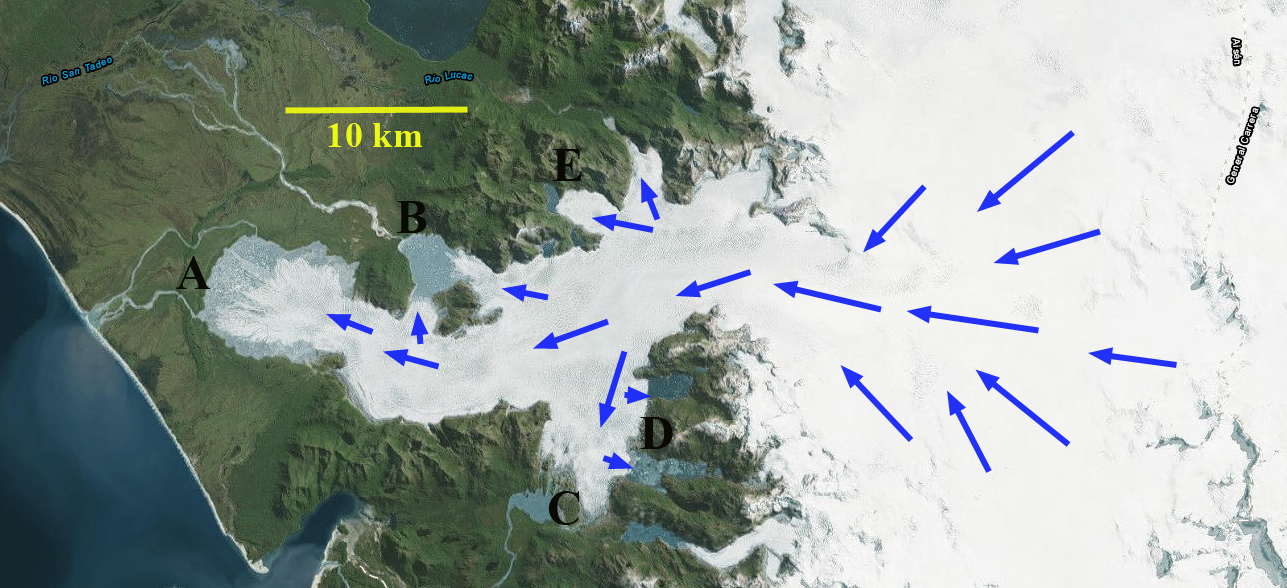
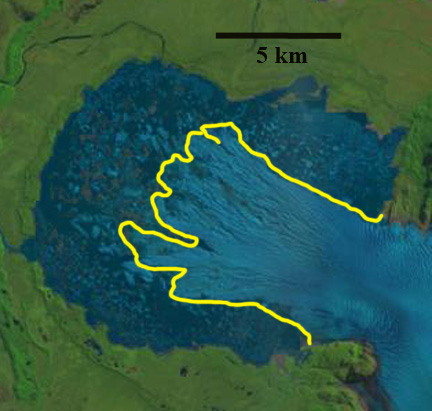
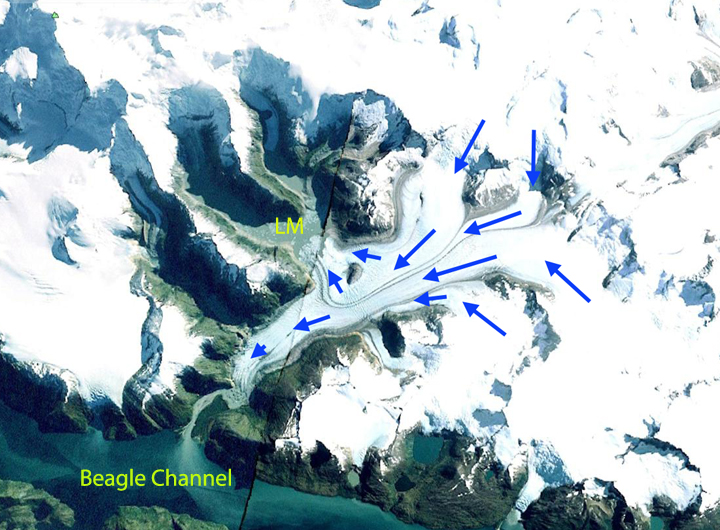
Cerro Erasmo at 46 degrees South latitude is a short distance north of the Northern Patagonia Icefield and is host to a number of glaciers the largest of which flow northwest from the mountain. This is referred to as Erasmo Glacier with an area of ~40 square kilometers. Meltwater from this glacier enters Cupquelan Fjord, which is host to farmed salmon. This remote location allows Cooke Aquaculture to protect its farm from environmental contamination. Runoff from Erasmo Glacier is a key input to the fjord, while Rio Exploradores large inflow near the fjord mouth limits inflow from the south. Davies and Glasser (2012) mapped the area of these glaciers and noted a 7% decline in glacier area from 1986-2011 of Cerro Erasmo. The recent retreat of the largest glacier in the Cerro Erasmo massif indicates this area retreat rate has increased since 2011. Paul and Molg (2014) observed a more rapid retreat in general of 25% total area lost from glaciers in the Palena district of northern Patagonia from 1985-2011, a region at 43-44 south, north of Cerro Erasmo.
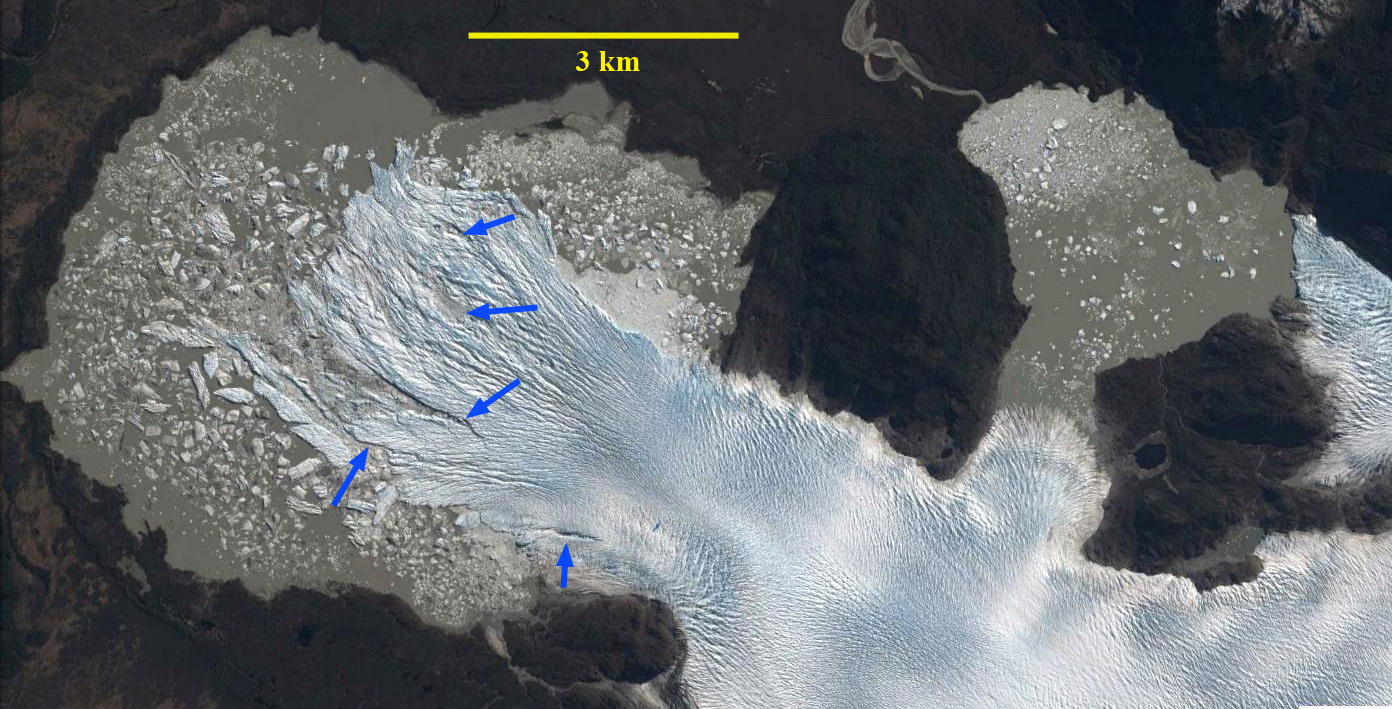
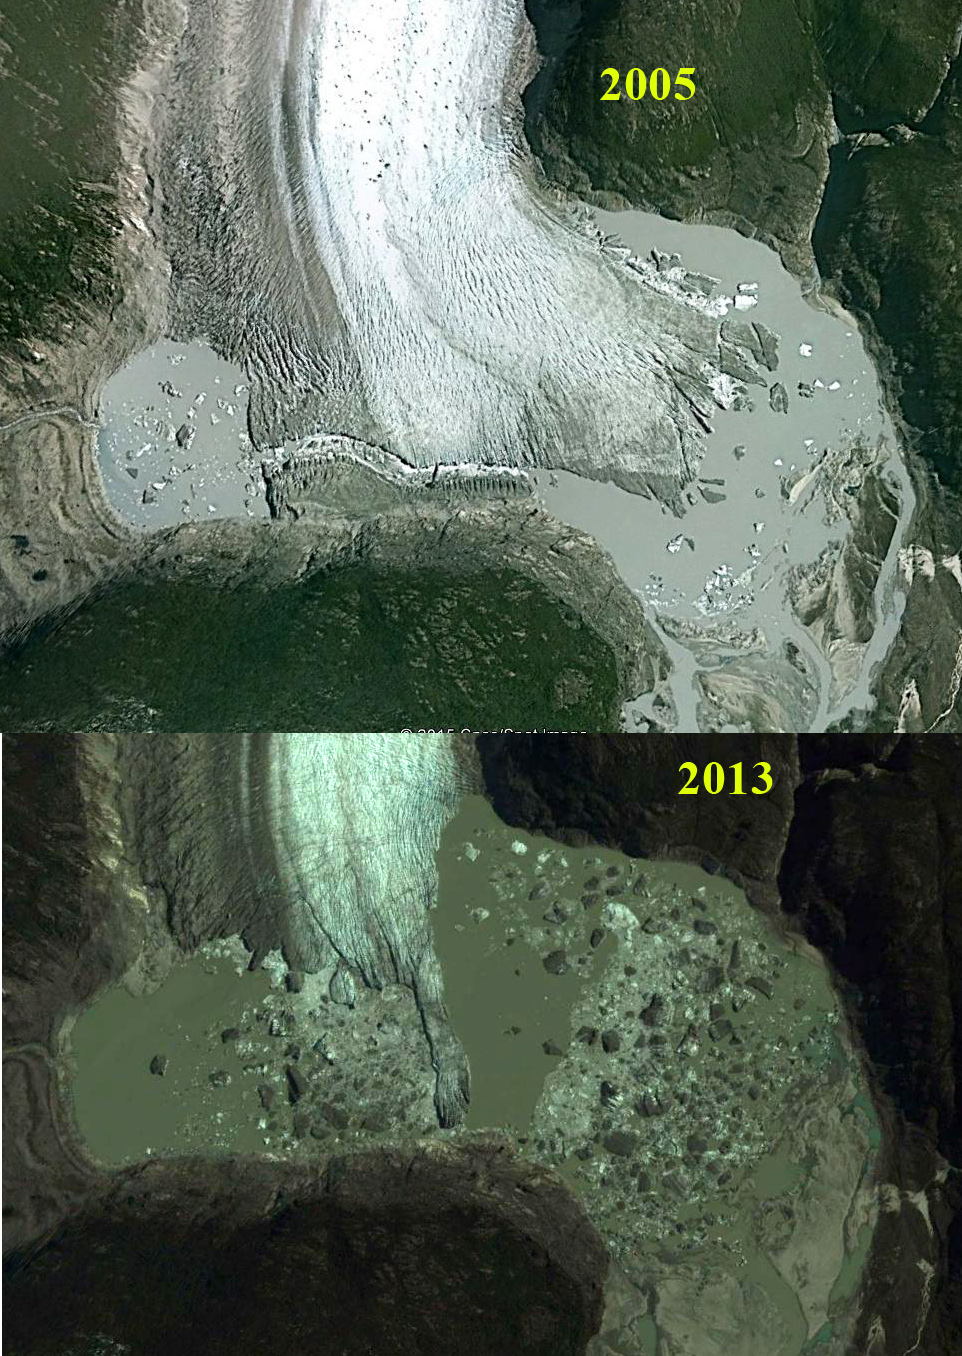
In 1987 Erasmo Glacier had a land based terminus at the end of a 6 km long low sloped valley tongue. The snowline was at 1100 m. In 1998 there is thinning, but limited retreat and the snowline is at 1250 m. In 2001 a lake has still not formed and retreat is less than 500 m since 1987. By 2013 a proglacial lake has formed and there are numerous icebergs visible in the lake. The snowline is at 1200-1250 m in 2013 at the top of the main icefall. In 2015 a large lake has formed and the snowline is at 1200 m again at the top of the icefall. By 2016 the terminus has retreated 2.9 km since 1987 generating a lake of the same length. The collapse is ongoing as indicated by large icebergs in the lake. The snowline in 2016 is at 1200 m at the top of the icefall The purple arrows indicate locations of expanded bedrock amidst the glacier since 1987. Each location is above 1000 m indicating upglacier thinning and reduced retained snow accumulation is driving the retreat. The west most purple arrow indicates where a glacier formerly was joined to the Erasmo Glacier and is now separated. The retreat is consistent with retreat documented at Reichert Glacier, Hornopirén Glacier and Cord.illera Lago General Carrera Glacier. The rapid retreat will continue until the head of the developing lake basin is reached.
[ngg_images source=”galleries” container_ids=”12″ display_type=”photocrati-nextgen_basic_imagebrowser” ajax_pagination=”1″ template=”/nas/wp/www/sites/blogsorg/wp-content/plugins/nextgen-gallery/products/photocrati_nextgen/modules/ngglegacy/view/imagebrowser-caption.php” order_by=”sortorder” order_direction=”ASC” returns=”included” maximum_entity_count=”500″]