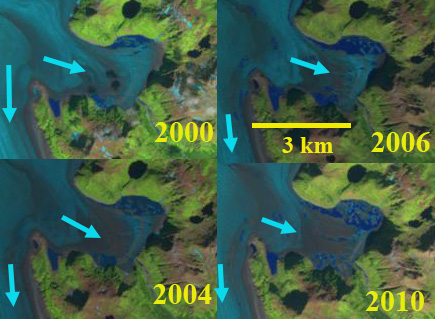
Leningradskiy Ice Cap north to south strip in 2000 and 2020 Landsat images illustrating thinning leading to separation of parts of the ice cap at Point 1 and 4 and expansion of bedrock leading to merging bedrock regions at Point 1 and 2. R=snow/firnpack saturated with meltwater and consequent potential refreezing. S=superimposed ice development from surface refreezing.
Leningradskiy Ice Cap is oriented east to west across Bolshevik Island in the Svernaya Zemlya Archipelago of the Russian Arctic. Annual snowfall on the ice caps is limited ~0.4-0.5 m (Sharov and Tyukevina, 2010). During the brief summer melt season from June-late August, much of the melt is refrozen within the snow/firnpack or as superimposed ice (Bassford et al 2006). The low snowpack makes the glaciers vulnerable to warm summer conditions. The summer of 2020 has been remarkably warm in the Russian High Arctic leading to high melt rates and surface mass balance loss as shown by Xavier Fettweise MAR model. Here we examine Landsat images from 2000 to 2020 to identify a pattern of thinning on the northern margin of the ice cap.
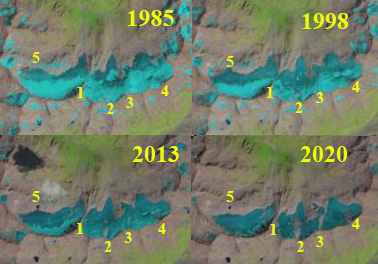
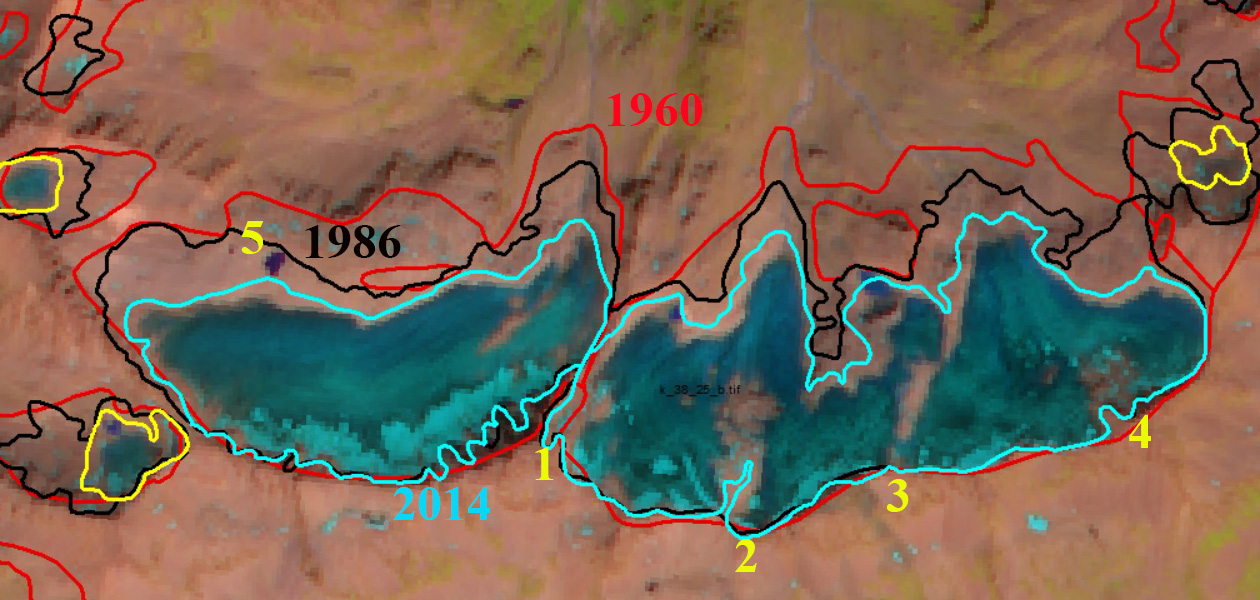
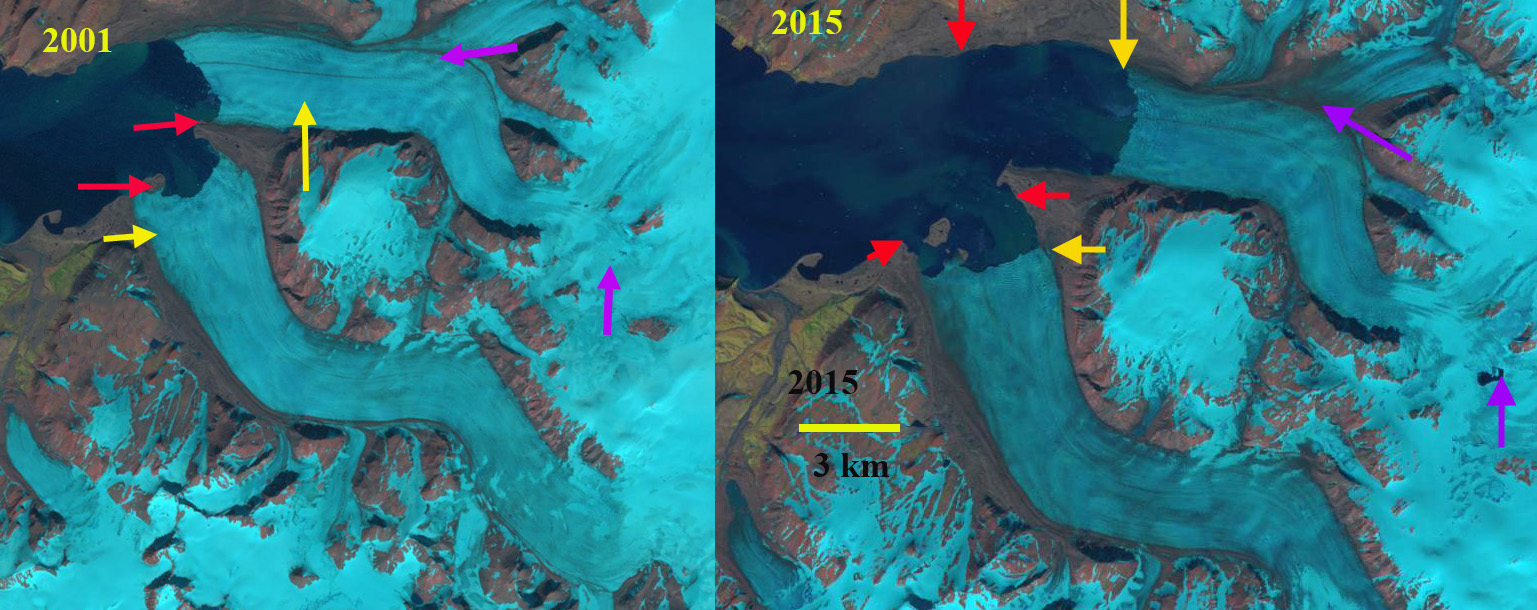
In 2000 the glacier has a well established glacier runoff stream at yellow arrow. Point 1 is a nunatak amidst a peripheral segment of the ice cap. Point 2 is an area of bedrock separated by a narrow section of ice cap from adjacent bedrock. Point 3 and 4 are locations where the ice cap is thick enough to spillover in to an adjacent basin. There is little visible snowpack on the ice cap, but a significant area of azure blue indicates snow/firnpack (R) that is saturated with meltwater, some of which will refreeze. There are zones of superimposed ice development(S) where meltwater is refreezing on top of the cold surface ice. In 2018 there an area of unsaturated snowpack, white area, and saturated snow/firnpack (R) azure blue and areas of superimposed ice development (S).
On August 3, 2020 the ice cap has lost its snowcover with limited areas of firn, limiting the ability of meltwater to refreeze except on the surface as superimposed ice (S). The lack of snow/firnpack at the surface will lead to a more negative balance as meltwater is not retained. At Point 1 this peripheral glacier area has been cutoff from the main ice cap as thinning has exposed more of the encircling ridge. At Point 2 bedrock areas have expanded and merged together. At Point 3 there is some spillover still but thinning has led to a reduction and consequent retreat and thinning of this terminus. At Point 4 the ice cap no longer spillovers into the adjacent basin due to thinning. Each location indicates significant thinning that is hard to recover given the slow flow and limited accumulation on these glaciers. On Aug. 22 2020 the surface of the ice cap is frozen, leading to a whiter surface.
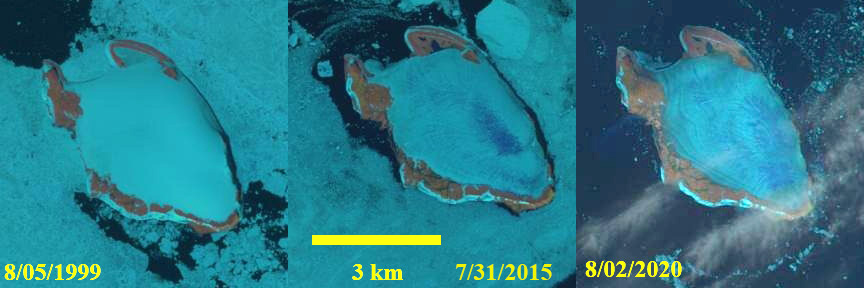
The lack of retained snowcover in 2020 was also seen at Hochstetter Ice Cap in Franz Josef Land. In both cases the high summer temperatures led to more meltwater, and the lack of snowpack to retain leads to more escaping the system. Bassford et al (2006) describe this process “Intense surface melting in the accumulation zone during warm summers prevents the buildup of a thick firn layer by rapid transformation of firn to ice through refreezing and by removing
mass through runoff.”

Leningradskiy Ice Cap north to south strip in 2018 and 2020 Landsat images illustrating changing distribution of melting (R) and superimposed ice development (S)