
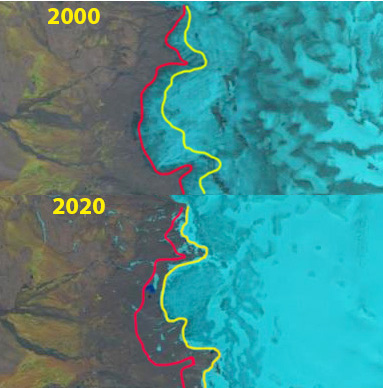
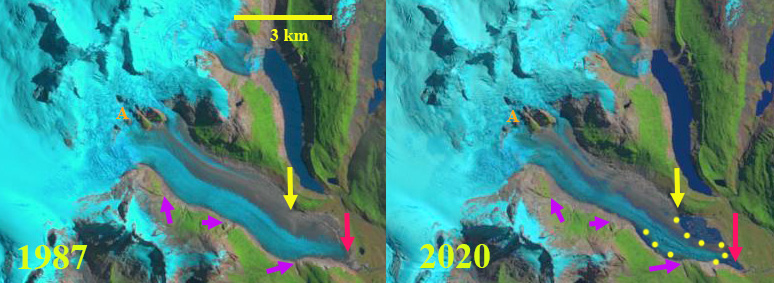
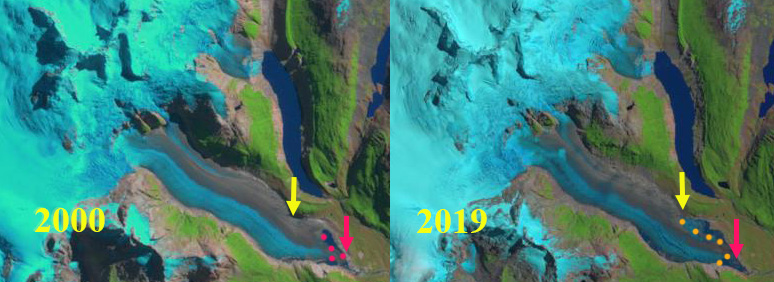
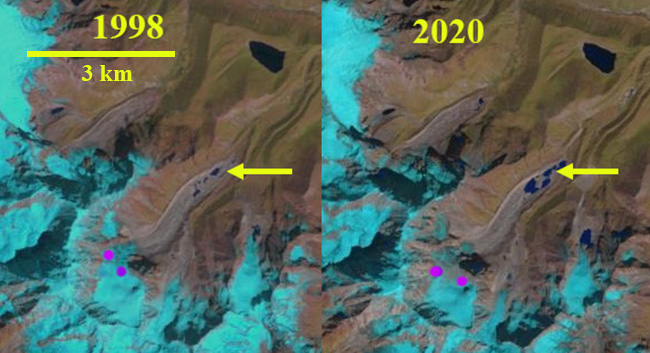
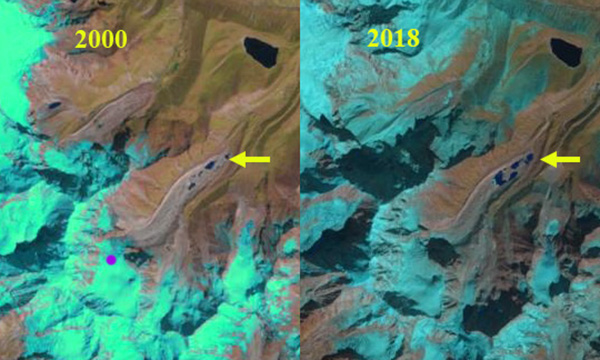
Blöndujökull in Landsat images from 2000 and 2020 illustrating terminus position, yellow line is 2020 and red line is 2000.
Blöndujökull is an outlet glacier on the west side of Hofsjökull, Iceland. The National Land Survey of Iceland has developed a DEM application that provides a detailed view of the islands glaciers and their immediate landscape. Johannesson (1997) reported the response time for Blöndujökull to a climate change as ~90-100 years, with significant warming beginning in 1985. Since 1995 Hofsjökull has had only two years with a positive mass balance (Aðalgeirsdóttir et al 2020). They further report the ice cap has lost 56 m w.e. from 1890-2019 with ~50% of that loss since 1995. Belart et al (2019) reported near equilibrium conditions for 14 Icelandic glaciers from 1960-1994 and mass losses of ~-1.2 m w.e. per year from 1994-2010.The ice cap geometry leads to the maximum area being in the terminus zone. The result is instead of a larger retreat distance of a narrow outlet terminus with a limited area loss, there is a smaller retreat distance with a large area loss (see below). This leads to divergent flow at the terminus, which also enable better formation and preservation of glacial deposits as there is limited glacial runoff reworking. Here we examine the response of this outlet glacier using Landsat imagery from 2000-2020.
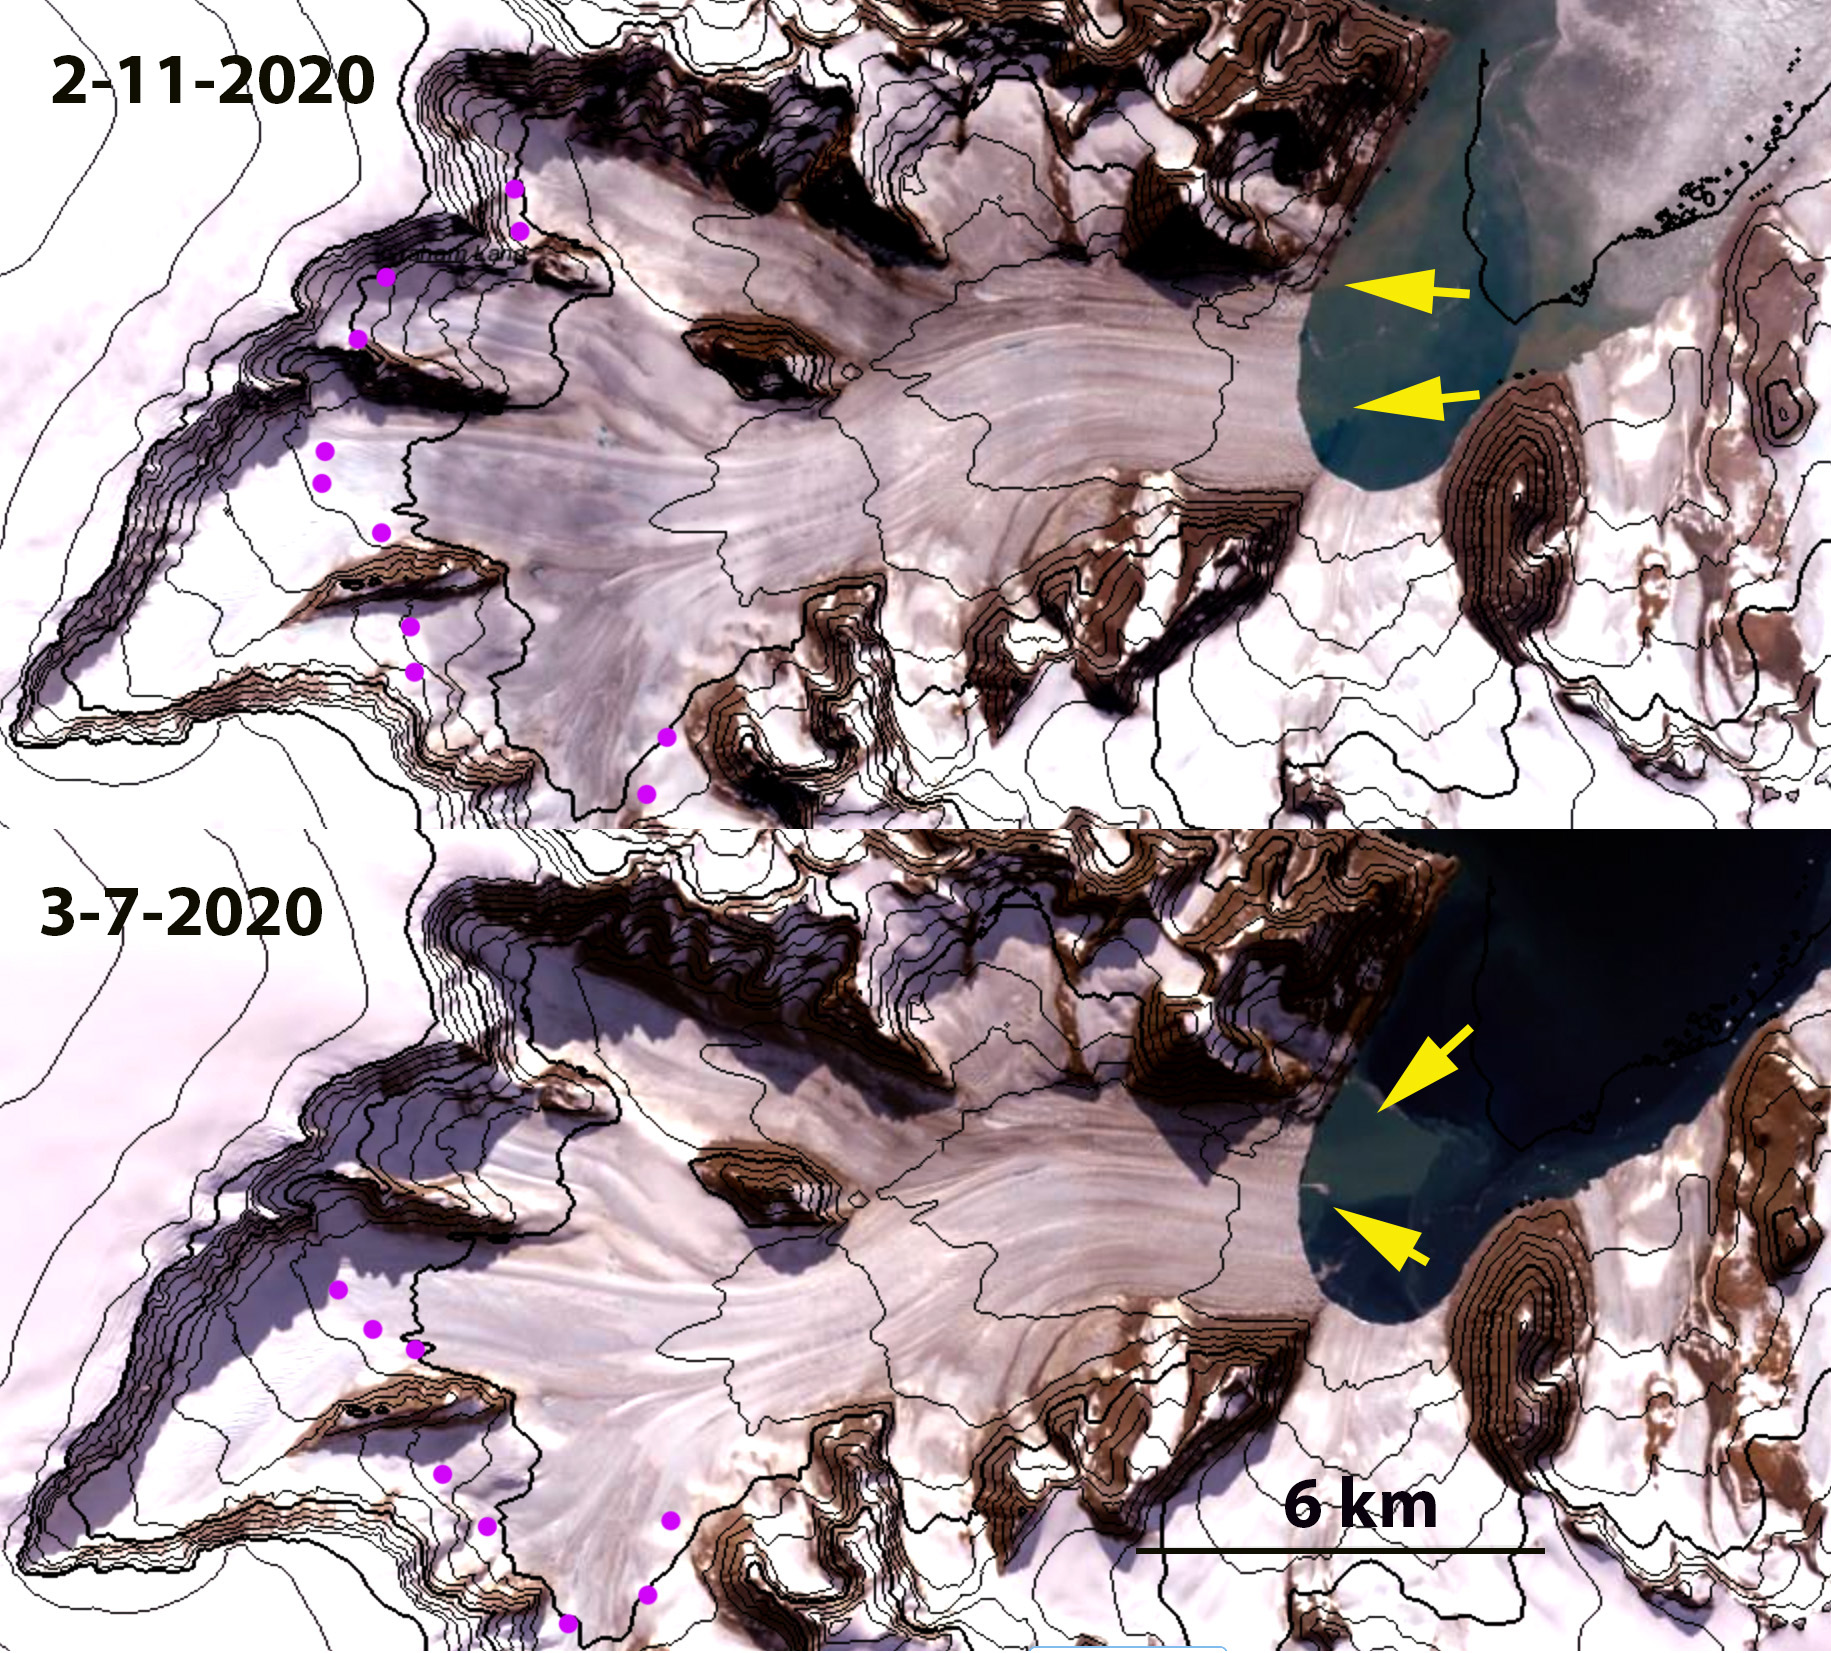
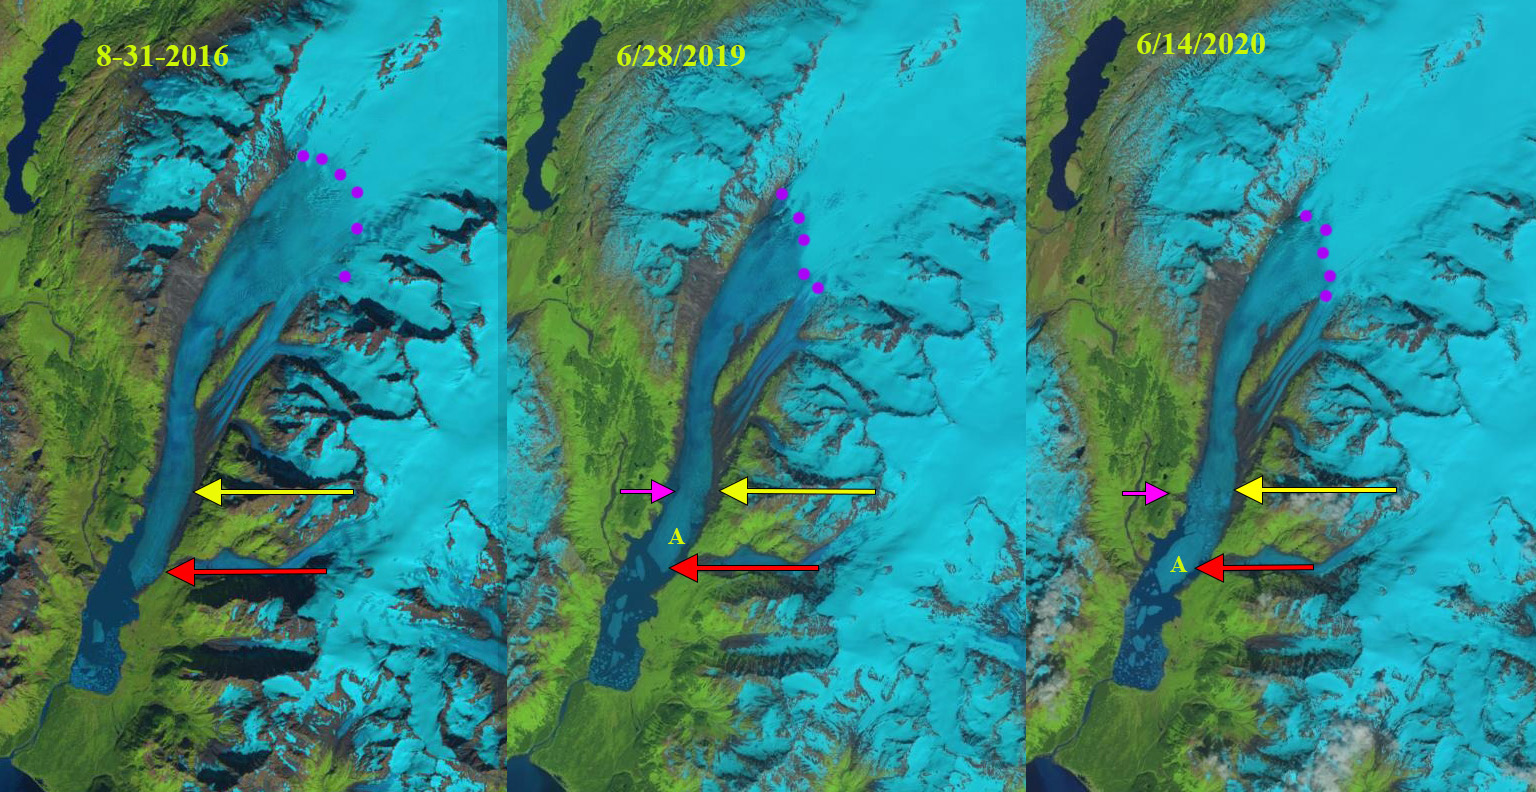
Blöndujökull in 2000 ends on a gently sloping at ~750 m and has no proglacial lake near the terminus. The snowline is a patchwork at ~1550 m this leads to an accumulation area ratio of ~25%. In 2019 the glacier has retreated exposing a proglacial lakes. The snowline in 2019 is at 1200 m at the start of August. A close up view of the proglacial lake using the National Land Survey of Iceland, also indicates the flow directions parallel the supraglacial streams. The image also reveals the fluted moraine on the newly deglaciated terrain. By 2020 the terminus has retreated on average ~550 m. This has exposed an area of nearly 4 km2 of deglaciated terrain.
Retreat has been the consistent response of more than 90% of Iceland glaciers since 2000 (Iceland Glaciological Society), including the outlets of Hofsjökull, Tungnafellsjökull and Norðurjökull. Aðalgeirsdóttir et al (2020) note that mass losses of the largest Iceland Ice Caps has tripled from the 1900-1990 period to the 1995-2019 period, which give the response time noted earlier illustrates the glaciers are still far from having adjusted to the climate of the 1990-2020 period.
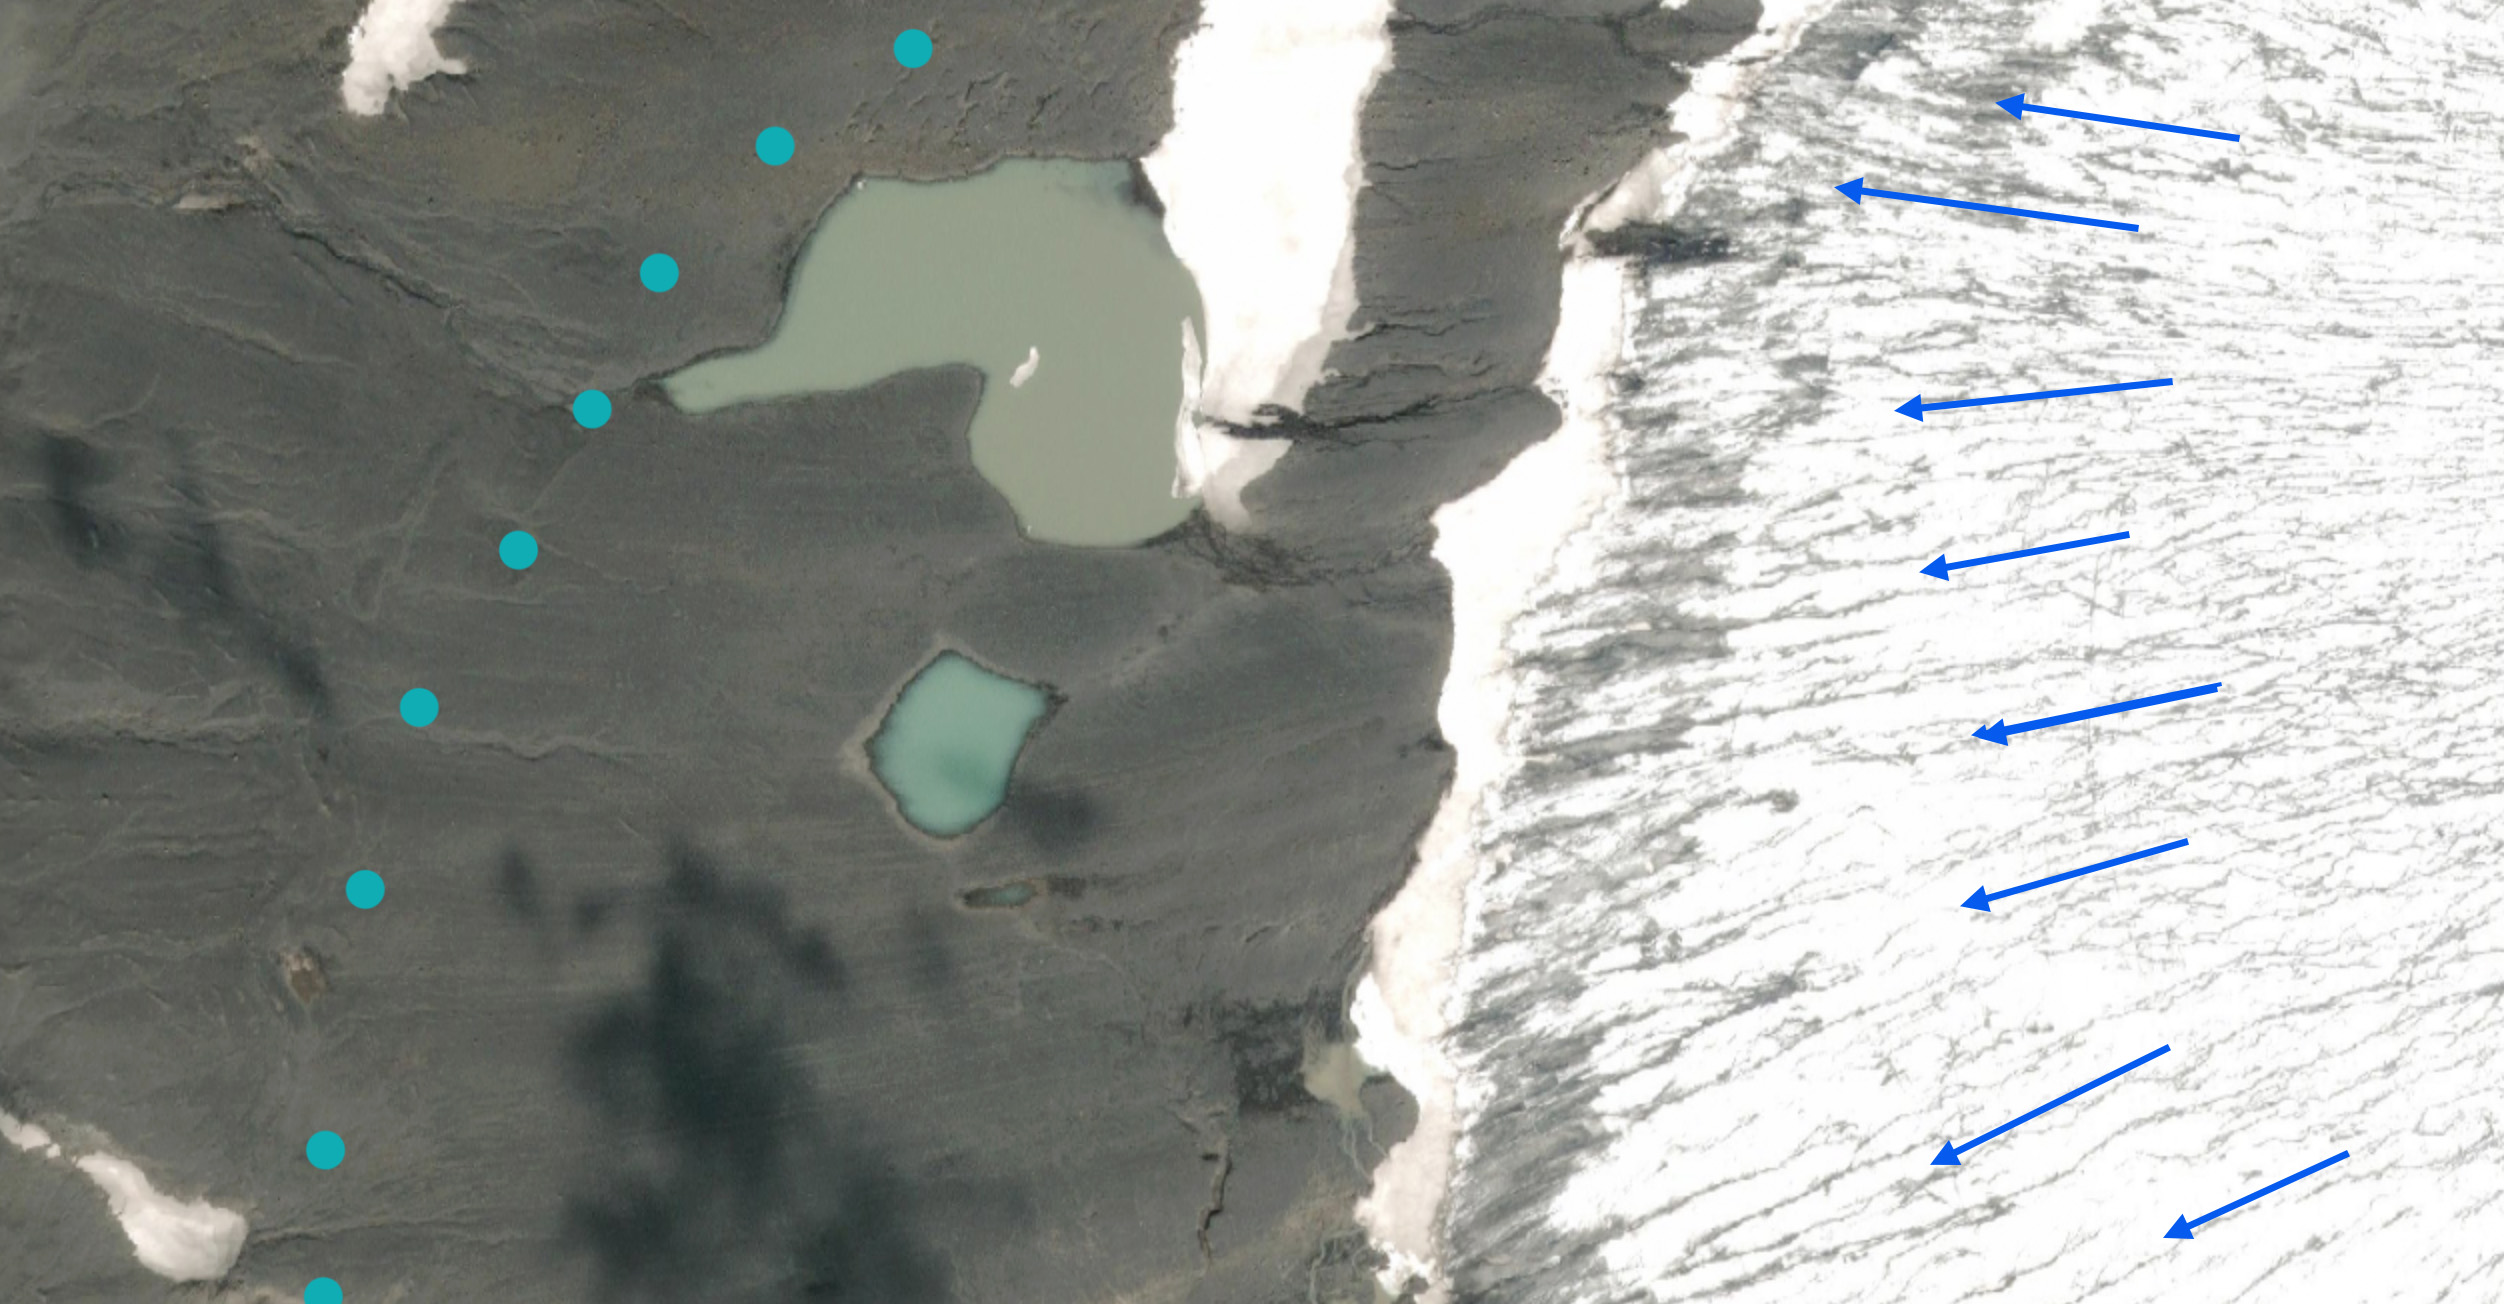
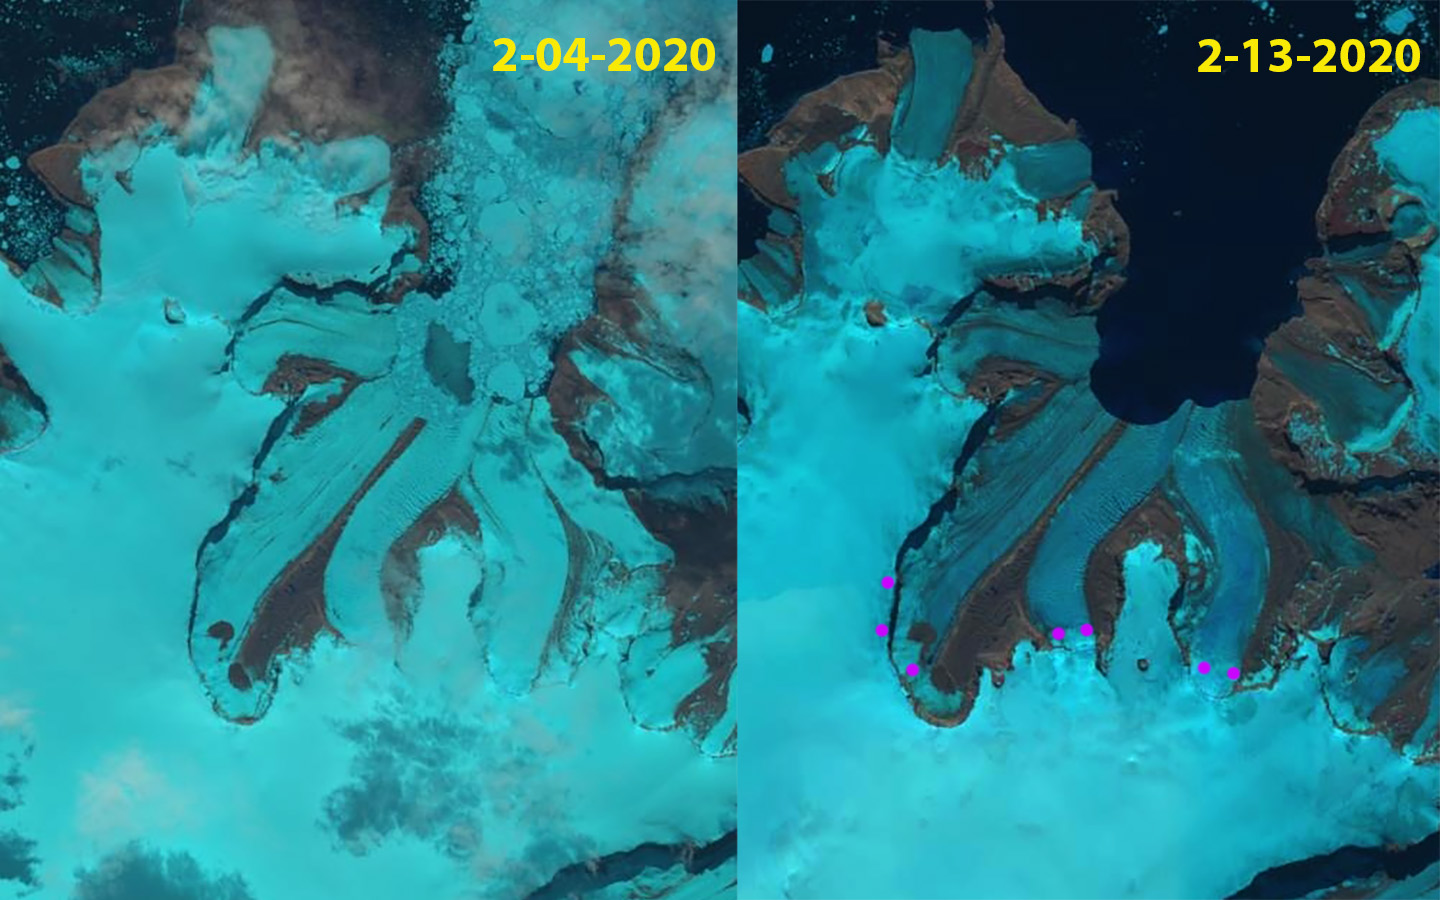
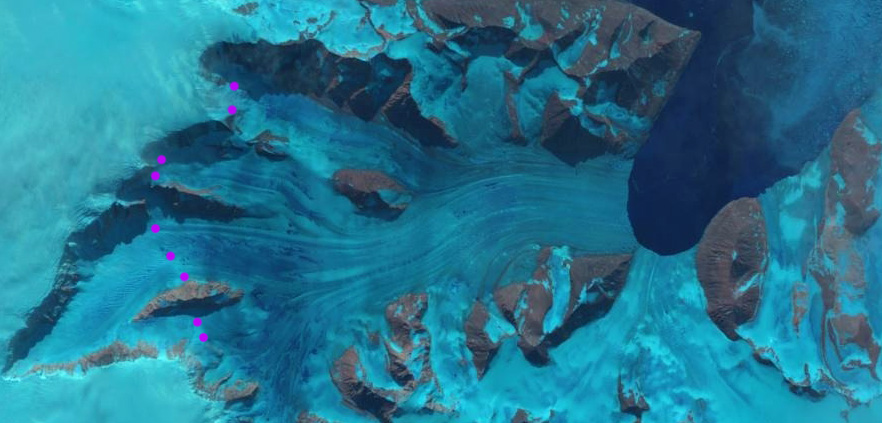
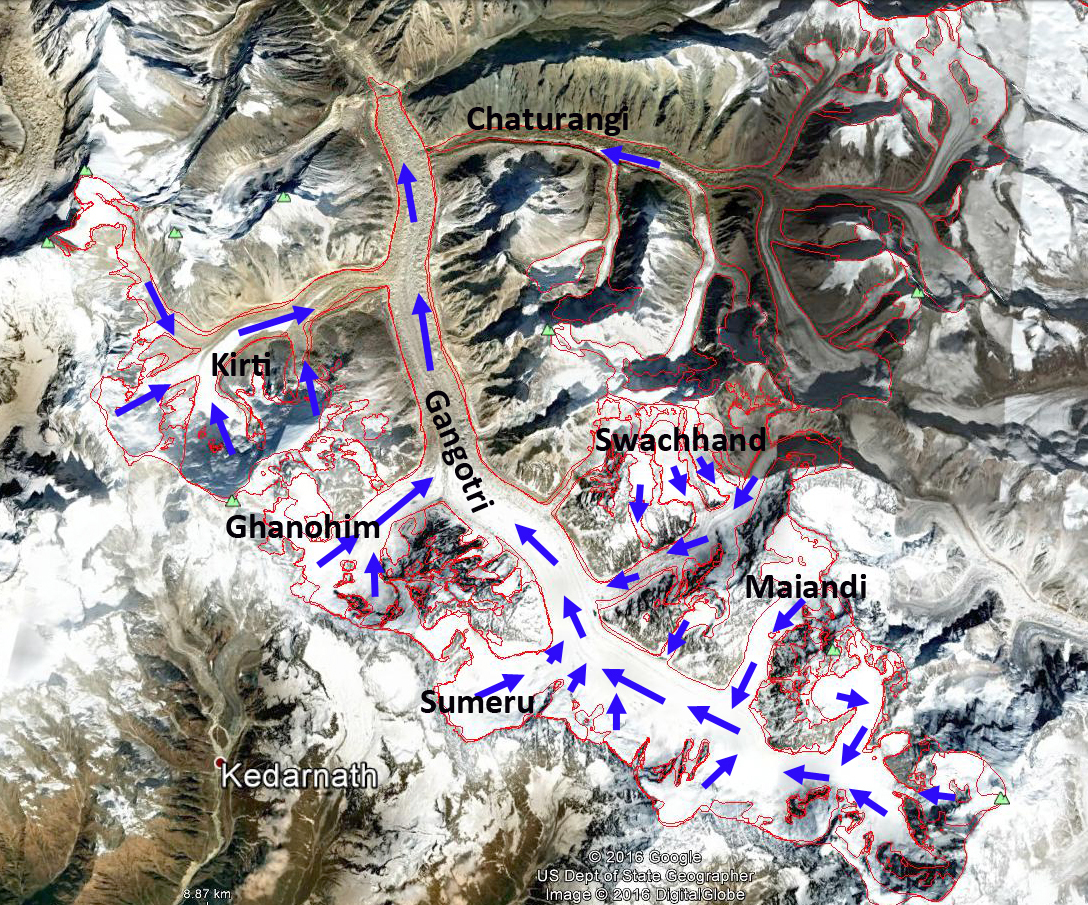
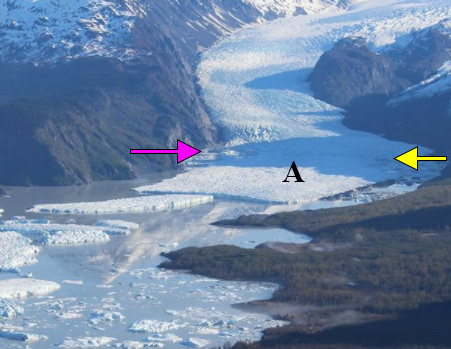
Terminus of Blöndujökull in National Land Survey of Iceland orthophoto. Flow direction indicated by blue arrow, which parallel supraglacial streams and which are also diverging. Blue dots indicate the 2000 terminus position with the new proglacial lakes evident.
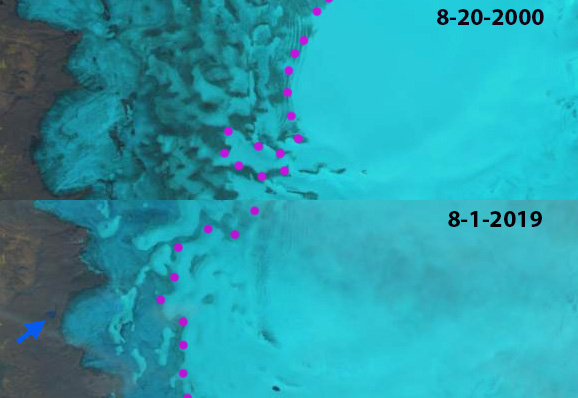
Blöndujökull in Landsat image from 2000 and 2019 illustrating snowline-purple dots.
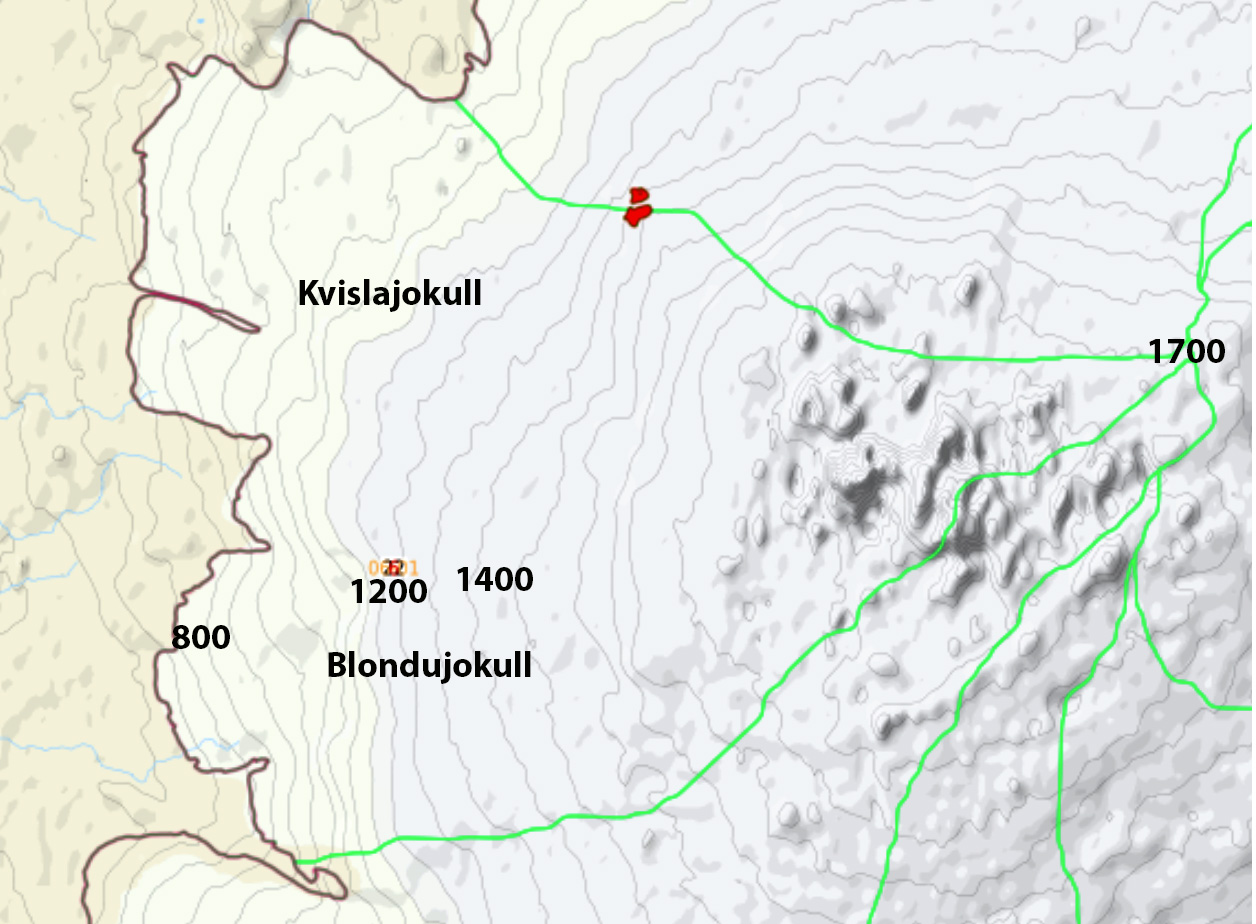
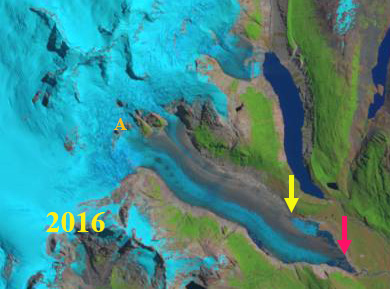
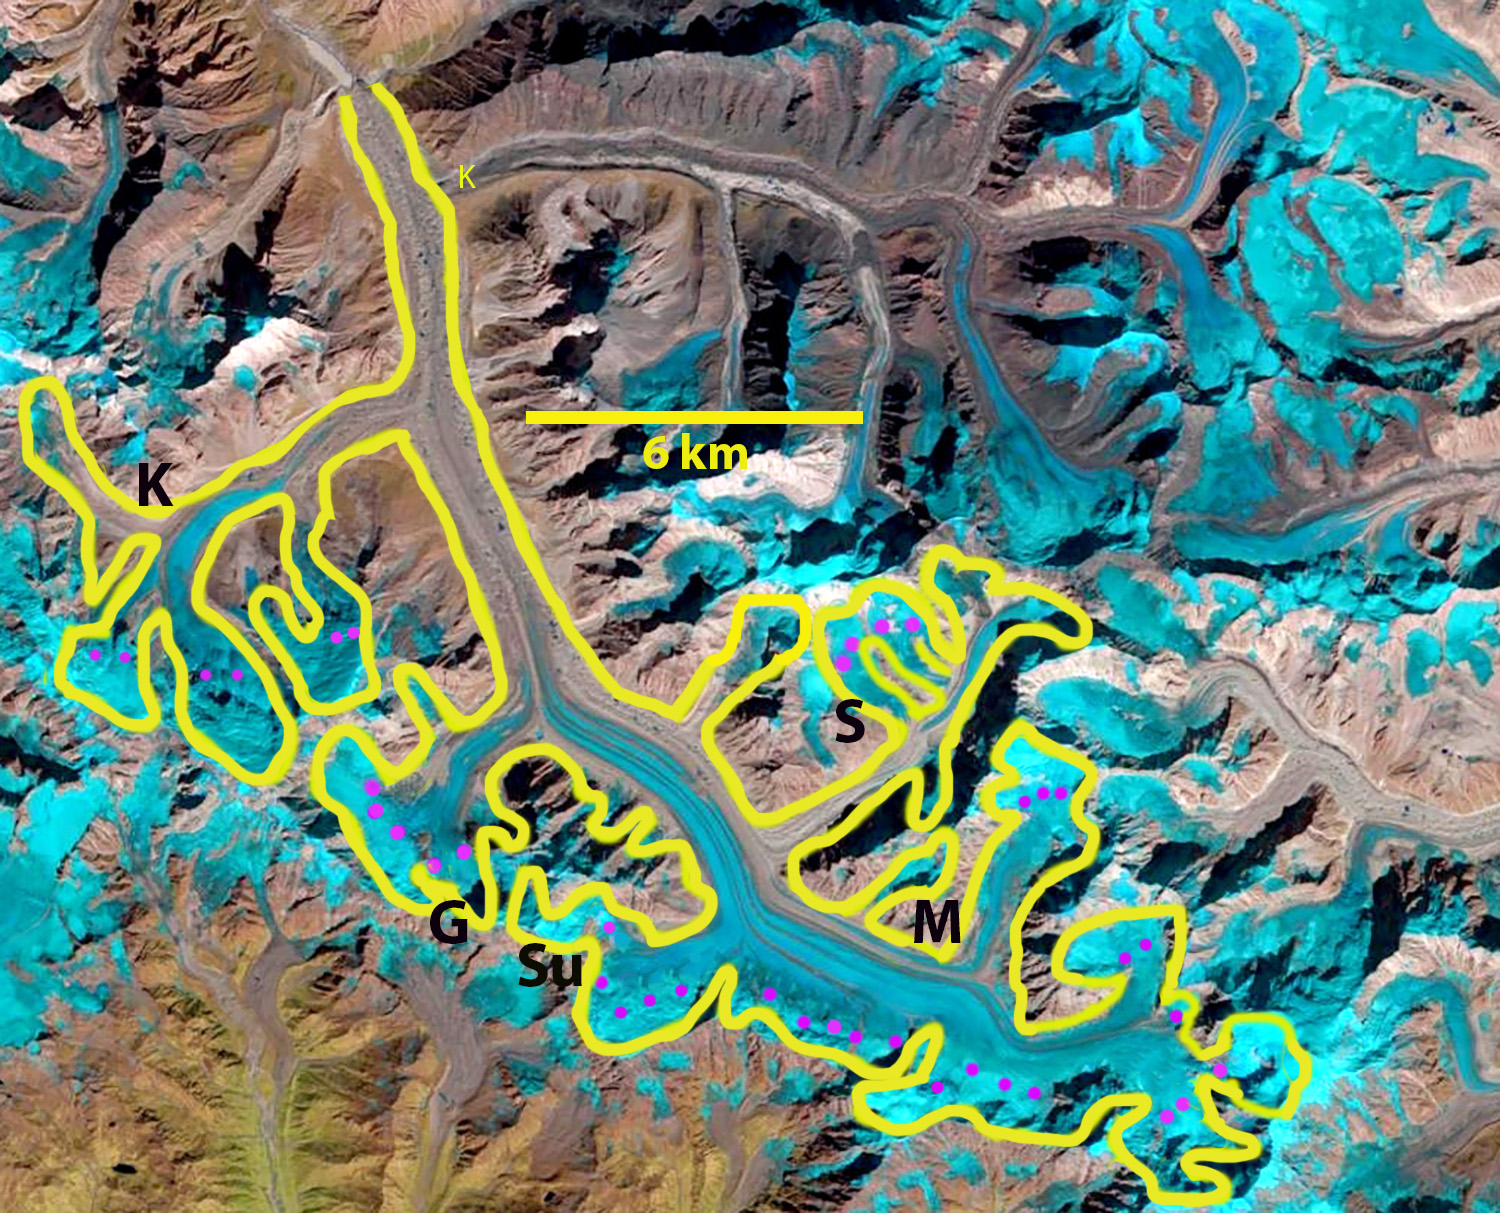
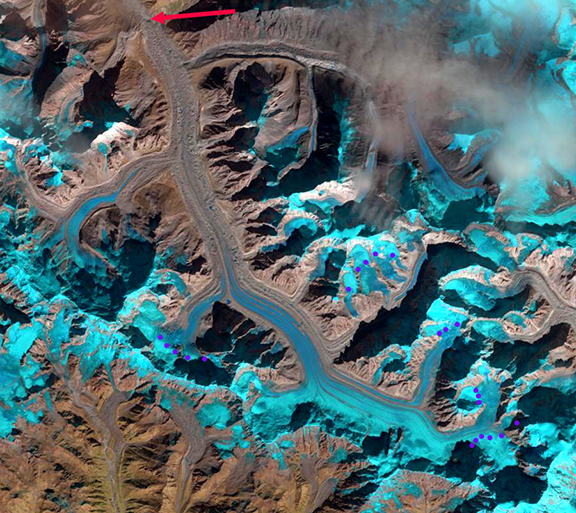
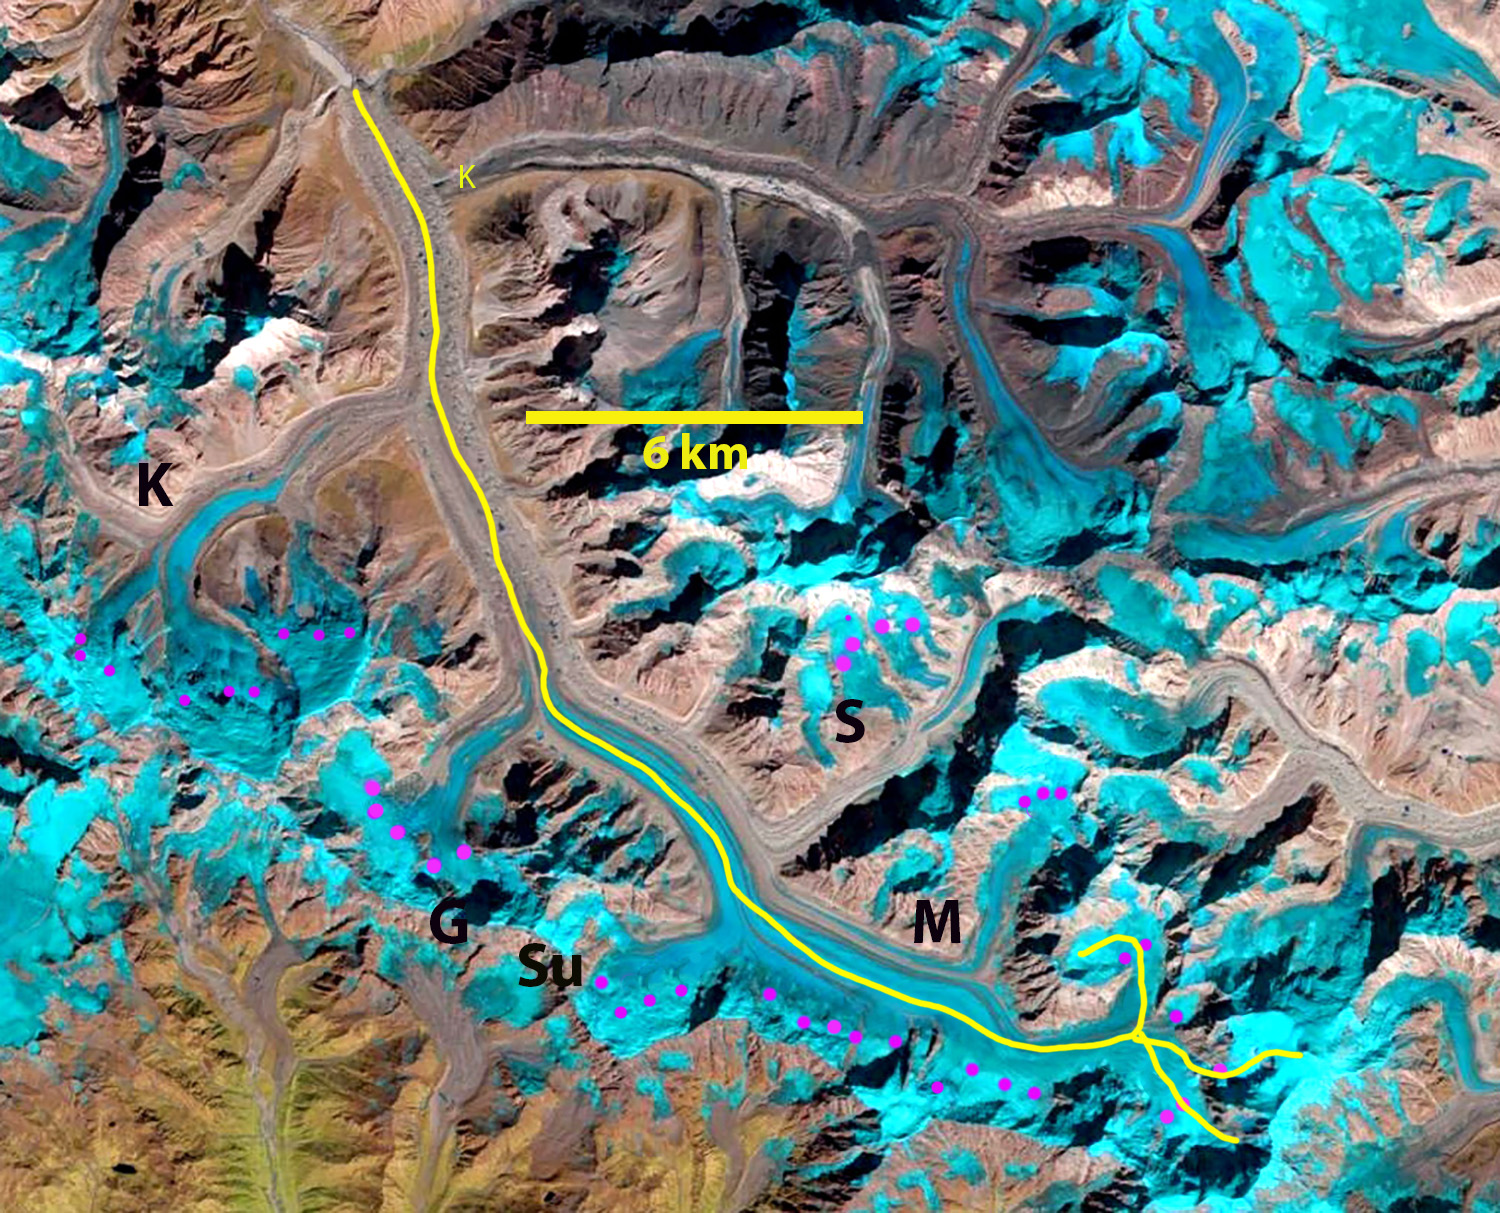
Kvislajökull and Blöndujökull drainage basin on Hofsjökull in GLIMS. Note the expanding width of the basin from the summit to terminus.


 Ya
Ya


