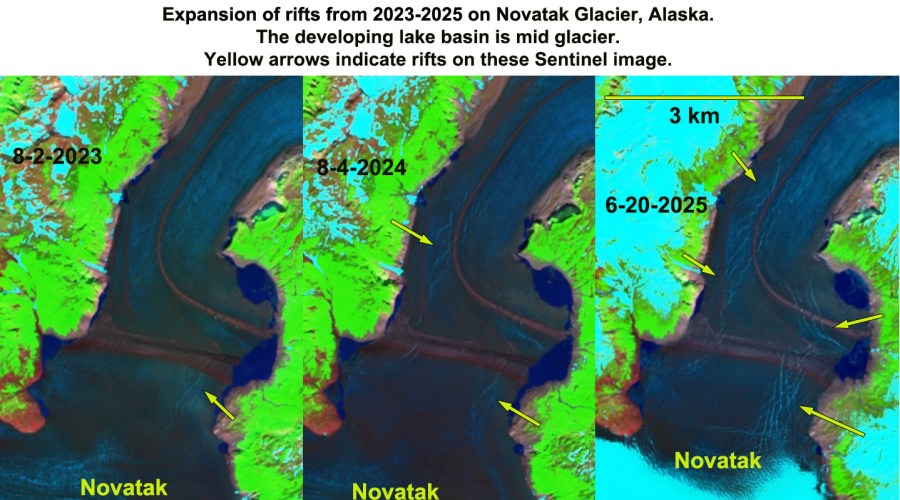
A network of extensive rifts have developed since 2023, yellow arrows. The fringing proglacial lake has not expanded. Rifting indicates uplift from partially floating glacier area.
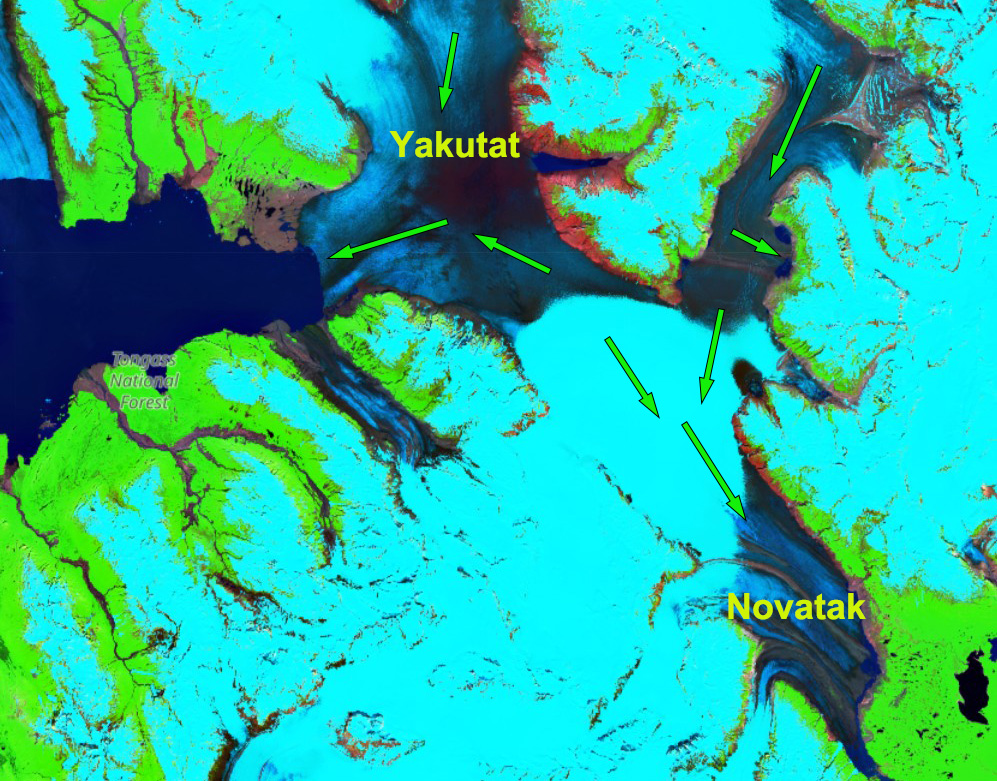
Ice flow in the region around the developing lake, which is near the boundary with Yakutat Glacier in Sentinel Image from June 20, 2025
Novatak Glacier is between the Yakutat and East Novatak Glacier in southeast Alaska. The glacier retreated 1 km from 1987-2023 (NASA EO, 2015). The majority of the accumulation zone of these three glaciers is below 1000 m, which has made them particularly vulnerable to the warming climate. The result has been expansion of the proglacial lake, Harlequin Lake, at Yakutat Glacier from 1984 to 2024 from 50 km2 to 108 km2 (Pelto & NASA EO, 2024). There was no lake in 1908.
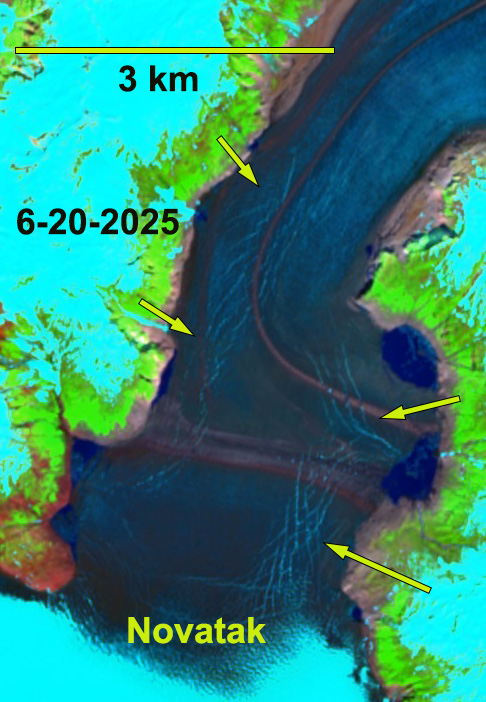
Novatak Glacier has been slow to form a substantial terminus lake unlike its neighbors, possibly because it lacks a sufficient basin. This has limited the retreat of this glacier as it thins. The developing rifts does show a large lake will form, with an area of 10-12 km2 . This will isolate the terminus from the main inflow to Novatak’s terminus, which will hasten a rapid meltdown. The rifts represent places where water level change causes flexure of the glacier, leading to their formation and expansion. They are not related to flow, but to uplift and down fall of ice where it is somewhat afloat. Rapid meltwater inflow to this basin will raise water level further stressing this region this summer. The degree of rifting indicates the ice is thin, but none are open enough to see water. This suggests breakup will not happen this summer. This type of rifting in 2010 and 2015 led to further breakups at Yakutat Glacier.
June 20, 2025 rifting of Novatak Glacier.The rifts represent places where water level change causes flexure of the glacier, leading to their formation and expansion. They are not related to flow, but to uplift and down fall.
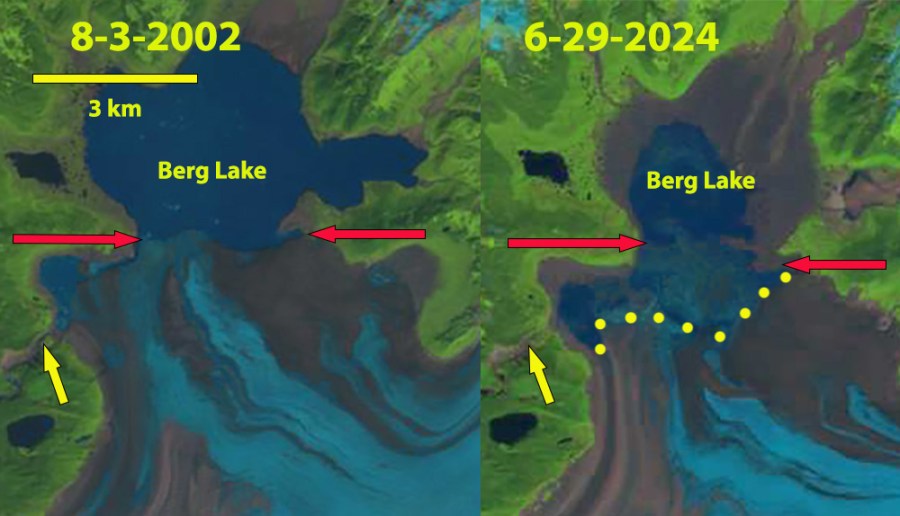
Berg Lake in 2002 and 2024 Lands at images. Red arrows illustrate 2002 margin, and yellow dots the 2024 margin after a retreat. Yellow arrows indicate the gorge that drained the lake periodically from the 1980s through 2013. Now it drains south sub-glacially into Pacman Lake and then into Bering Lake
Berg Lake is impounded by the Steller Glacier terminus. During the latter half of the 20th century and early 21st century this lake periodically drained west through a gorge to the Bering River. With retreat and thinning this outlet has been abandoned. Vegetation has regrown in portions of this channel area by 2024 illustrating this.
Berg lake and Steller Glacier terminus retreat from 2016 to 2018 in Landsat images exposing the former gorge exit, red arrow.
During the 1986-2022 period the full lake level declined, but the filled area of the lake remained close to 25 km2. The lake level decline led to abandonment of the gorge outlet and drainage south into Lake Ivanov (NWS, 2024). In 2019 this channel was also abandoned, and now the drainage goes directly from Pacman Lake into the Gandil River and then into the Bering River watershed (NWS, 2024). The rapid retreat of Steller Glacier terminus particularly on the western half of more than a kilometer from 2016 to 2018 has driven the continuation of outlet location shift. The speed of drainage from 2018-2021 caused significant flooding in the floodplain of the Bering and Gandil River, that has not been observed in 2022-2024.
Map of Berg Lake drainage path in 2024-yellow dots, false color Sentinel image.
The lake continues to fill each summer and drain in late summer, with drainage being in August of 2021 and 2022, and late July of 2023 and 2024 (NWS, 2024). It is evident that since the 2022 fill of 25 km2, that in 2023 and 2024 the lake did not completely fill before drainage, reducing flood hazards. The minimum lake size has declined as the water level has been reduced to 4 km2 by fall in 2022, 2023 and 2024. The lake depth is greatest in the glacier center, which drives greater calving and retreat. On May 19, 2025 filling is underway and the lake has an area of 6 km2.
Berg Lake in 2022 full in June and drained in October, false color Sentinel images.Berg Lake drained in September 2023, and filling in June 2024, false color Sentinel images.Berg Lake in fall 2024 drained and filling in May 2025, false color Sentinel images.
As April ends there is a sharp snowline ranging from 1200 m at Mount Baker to 1400 m at Cascade Pass. Above 1500 m the melt season is just getting started.
As the accumulation season comes to an end for North Cascade glaciers it is worth reviewing this winter and looking ahead with a forecast for glacier mass balance by the end of summer 2025. The winter of 2025 at NOAA’s Washington Cascade Mountain West Division 5 records indicate that this winter was below the declining trendline of total precipitation with a mean of 54.8 inches, down slightly from last year. Winter temperatures were again warm at 33.2o F but close to the expected rising trend line average.
The 1946 to 2025 winter (November-March) mean temperature and total precipitation for the Western Cascade Mountains-Division 5 weather stations.
The mean April 1 snow water equivalent (swe) at the six North Cascade Snotel sites with a consistent long term record was 0.72 m. This is below the declining trend line and 31% below the long term average for the 1946-2025 period. This is above the 2024 value, but in the lowest quintile. Mount Baker ski area has reported 585 inches of snowfall through April 21, which is ~30% percentile. April 1 swe is the key date for asssessment for winter snowpack water resources. For glaciers the accumulation season typically continues until the end or April or early May. This year snowpack depth at Mount Baker Ski Area (1280 m) increased from 148 inches on April 1 to 164 inches on April 9 and then declining to 119 inches by May 1 (80% of normal). A similar pattern was seen at Stevens Pass-Grace Lake station (1460 m) with snowpack depth on April 1 of 107 inches, increasing to 114 inches by April 9 and decreasing to 82 inches by May 1. These stations are several hundred meters below glacier elevations. At Lyman Lake Snotel (1800 m) snowpack SWE which most closely matches the glacier elevations was 40.1 inches rising to 42.5 inches by April 11 and declining to 35.9 inches by May 1, ~60% of normal. At the Middle Fork Nooksack site (1520 m) snowpack was 44.8 inches SWE on April 1, rising to 49 inches by April 11 and declining to 46 inches on May 1, 67% of normal . This illustrates that at glacier elevations snowpack would have also increased in mid-April, before a slow decline in the latter part of the month. There were a number of atmospheric rivers that drove a higher snowline than usual as May starts, but also led to a rapid increase in snowpack above the snowline.
The mean April 1 SWE from 1946-2025 at six long term SNOTEL stations: Stampede Pass, Fish Lake, Stevens Pass, Lyman Lake, Park Creek and Rainy Pass.
As the melt season begins, based on the above the winter snowpack on glaciers on May 1 are 70-80% of normal. Eric Gilbertson measured snowpack on the summit Colfax Peak at 17.3 ft (5.27 m) on April 18, 2025. This is a location that is to some extent wind scoured and would be less than the depth on the adjacent glacier, a normal year there is 8-9 m of snowpack at 2300-2800 m. On Eldorado Peak they found 25.3 feet on April 27, 2025. This is the depth expected for this location in a year with 75-80% of normal snowpack. It is a location that appears to balance enhanced deposition and scour. Weather conditions in the Pacific Northwest are forecast to have above average temperatures for the upcoming 90 day period. This combined with the below average snowpack on glaciers on May 1, will yield another year where ice thickness loss exceeds 1 m across the glaciers, as each of the last four years have. The average from 2014-2024 has been -1.41 m, which is a 1.5 thick slice of the glacier lost each year. The range expected this year is -1.2 m to -2.4 m. How much will depend on the specific weather and the frequency and intensity of heat waves.
Mean mass balance observed in the field annually by the North Cascade Glacier Climate Project.
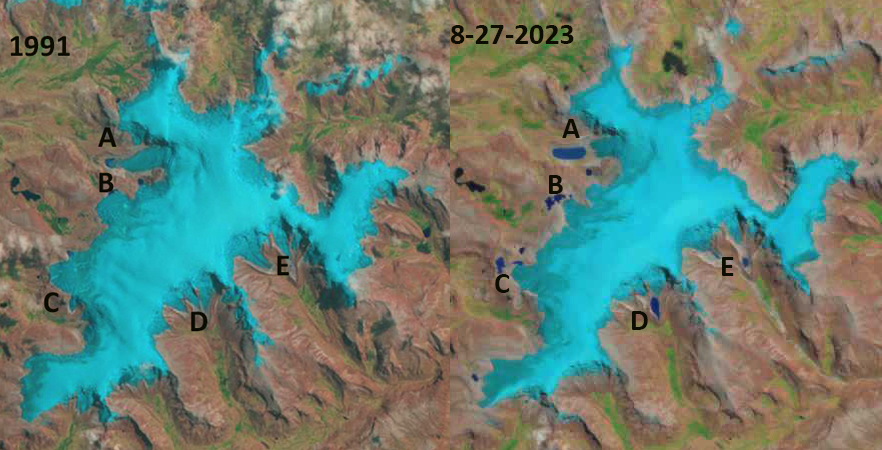
Quelccaya Ice Cap in 2013 and 2024 Landsat images illustrating snow line at 5600 m in 2024 and retreat leading to lake expansion at Point A-E from 2013 to 2024.
Quelccaya Ice Cap (QIC) is located in the tropical Andes of southeast Peru. Along with Coropuna Ice Cap it is one of two large ice caps in the area. Lamantia et al (2024) observed a 37% decline overall QIC area from 1985-2022, and a 57% decline in snow covered area. They observe snow cover is particularly limited during El Nino events. Here we examine the particularly high snowline and resulting minimum snow cover on QIC in 2024.
Quelccaya Ice Cap in 2024 August false colar and October natural color Sentinel 2 images. Snow line is at 5600 m in October with 25% snowcover.
The 2023-24 winter season featured El Nino conditions. During spring 2024 El Nino ended and neutral conditions persisted through summer. By late August 2024 the snowline on QIC averaged 5500 m (false color Sentinel Image). By late September 2024 the snowline had risen to ~5600 m, leaving the southern 1/3 and eastern arm of QIC with no snow cover, Landsat image. Overall snowcovered area dropped to ~25%, much below the 75% needed to maintain the ice cap (Lamantia et al. 2024). Despite a few minor snow events that briefly covered the ice cap, in late October the snowline had returned to 5600 m with ~25% snow cover. This is the least extensive snow cover since satellite images allow for mapping in 1984, falling below 10km2 . This is lower than the mininmum of ~15 km2 observed in 2023, which along with 1986 and 2016 had featured the lowest snow covered area on QIC (Lamantia et al. 2024). During this late summer period much of ablation is from sublimation (Fyffe et al 2021).
The high snow line elevation of 2024 exposing the majority of the ice caps glacier ice surface, which melts more rapidly than snow cover, leads to rapid thinning and volume loss.
The series of lakes that began to develop after 1991 at the margin of the QIC have expanded, and now are separating from the retreating ice margin.
Quelccaya Ice Cap in 1991 and 2023 Landsat images illustrating snow line at 5500 m in 2023 and retreat leading to lake development at Point A-E from 1991 to 2024.
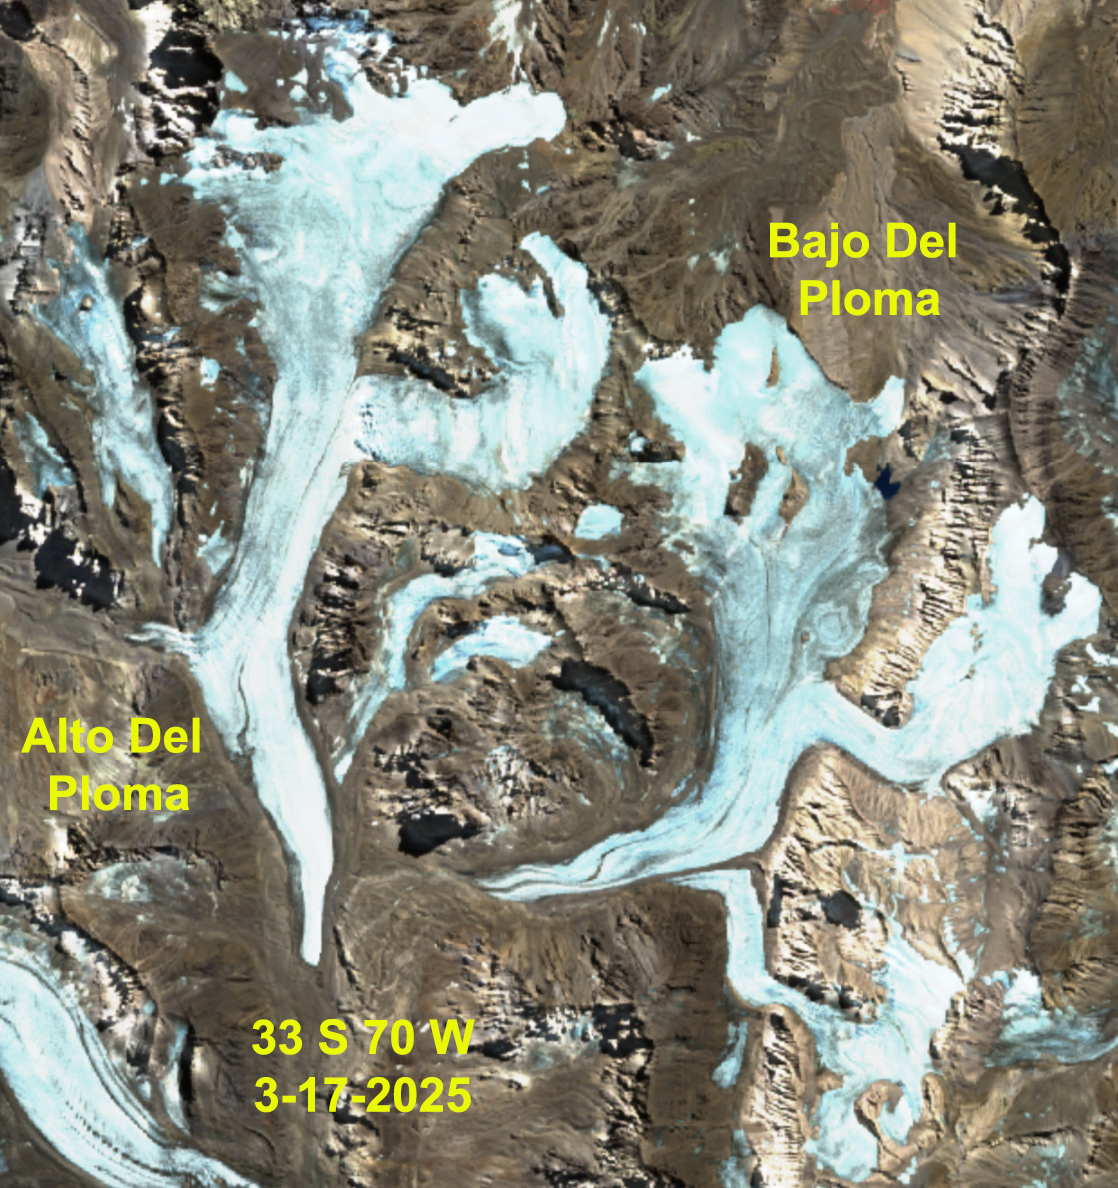
Alto and Baja del Plomo Glacier in false color Sentinel image from 3-17-2025, expanding bedrock areas amidst upper Baja del Plomo Glacier.
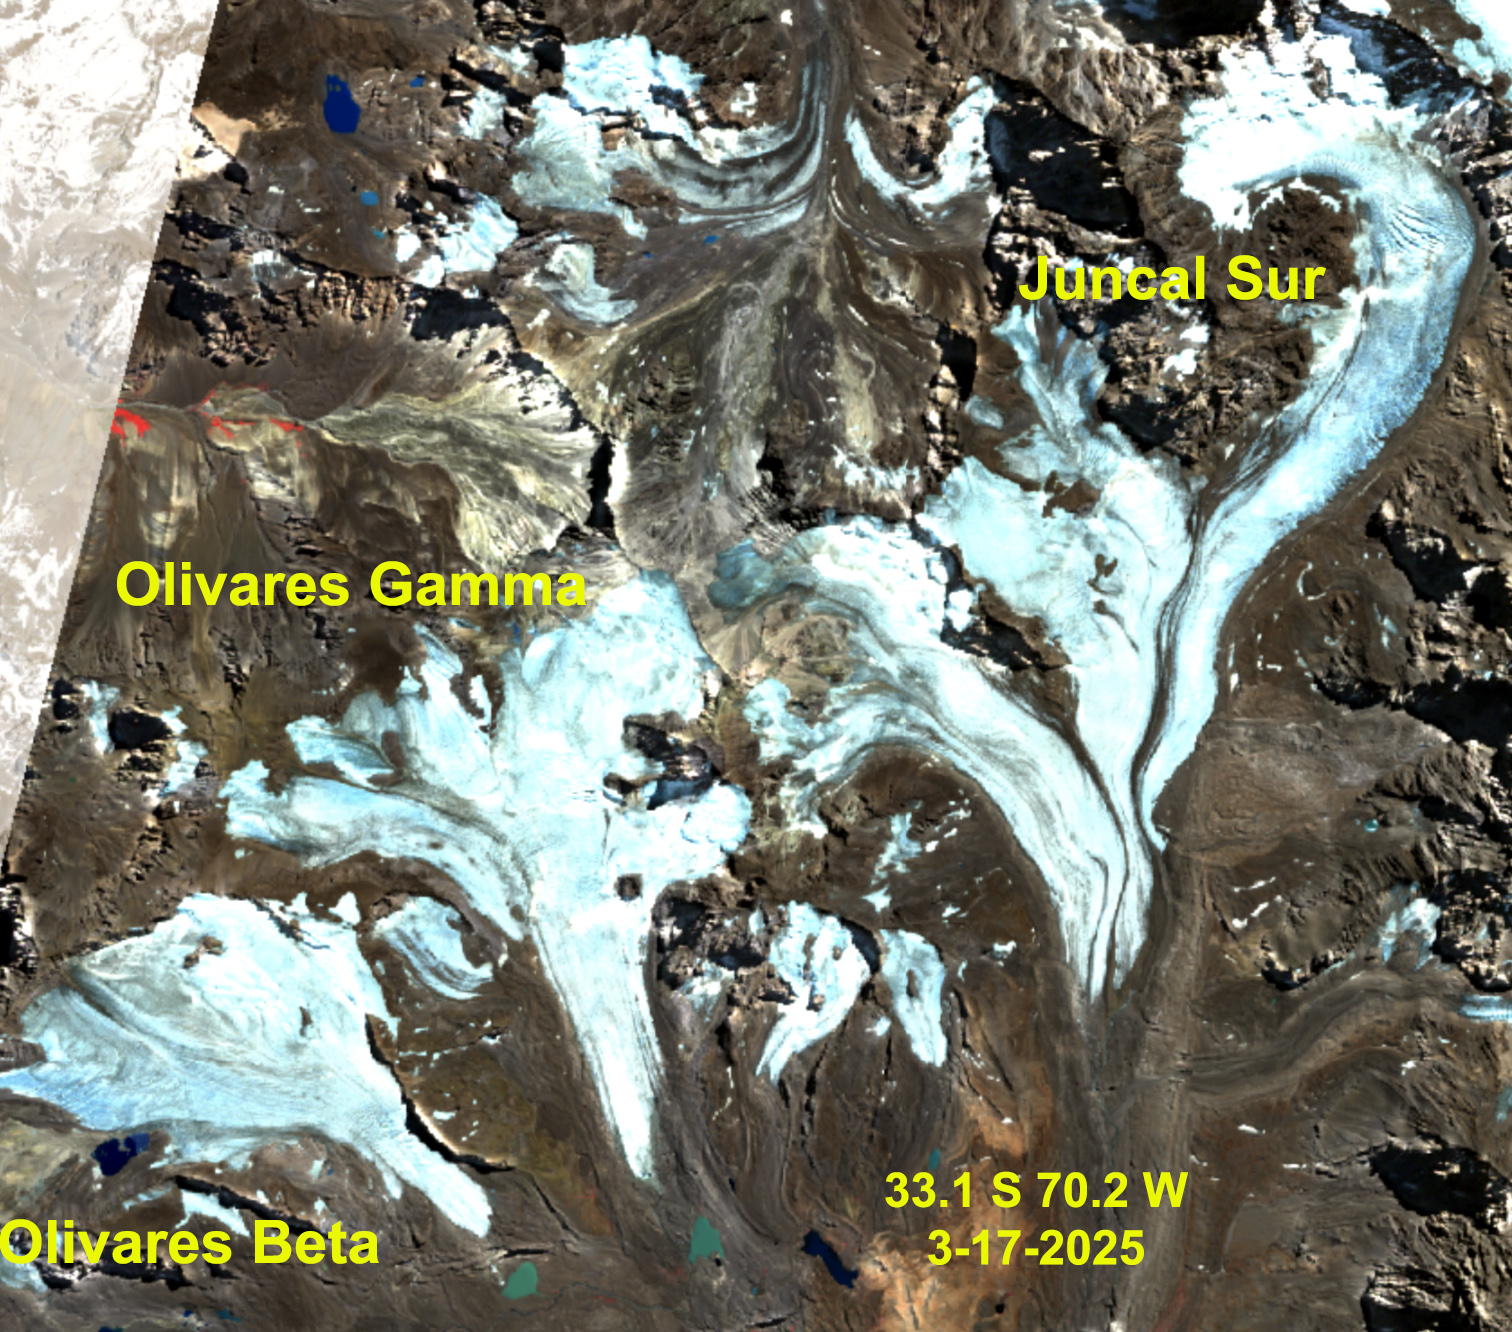
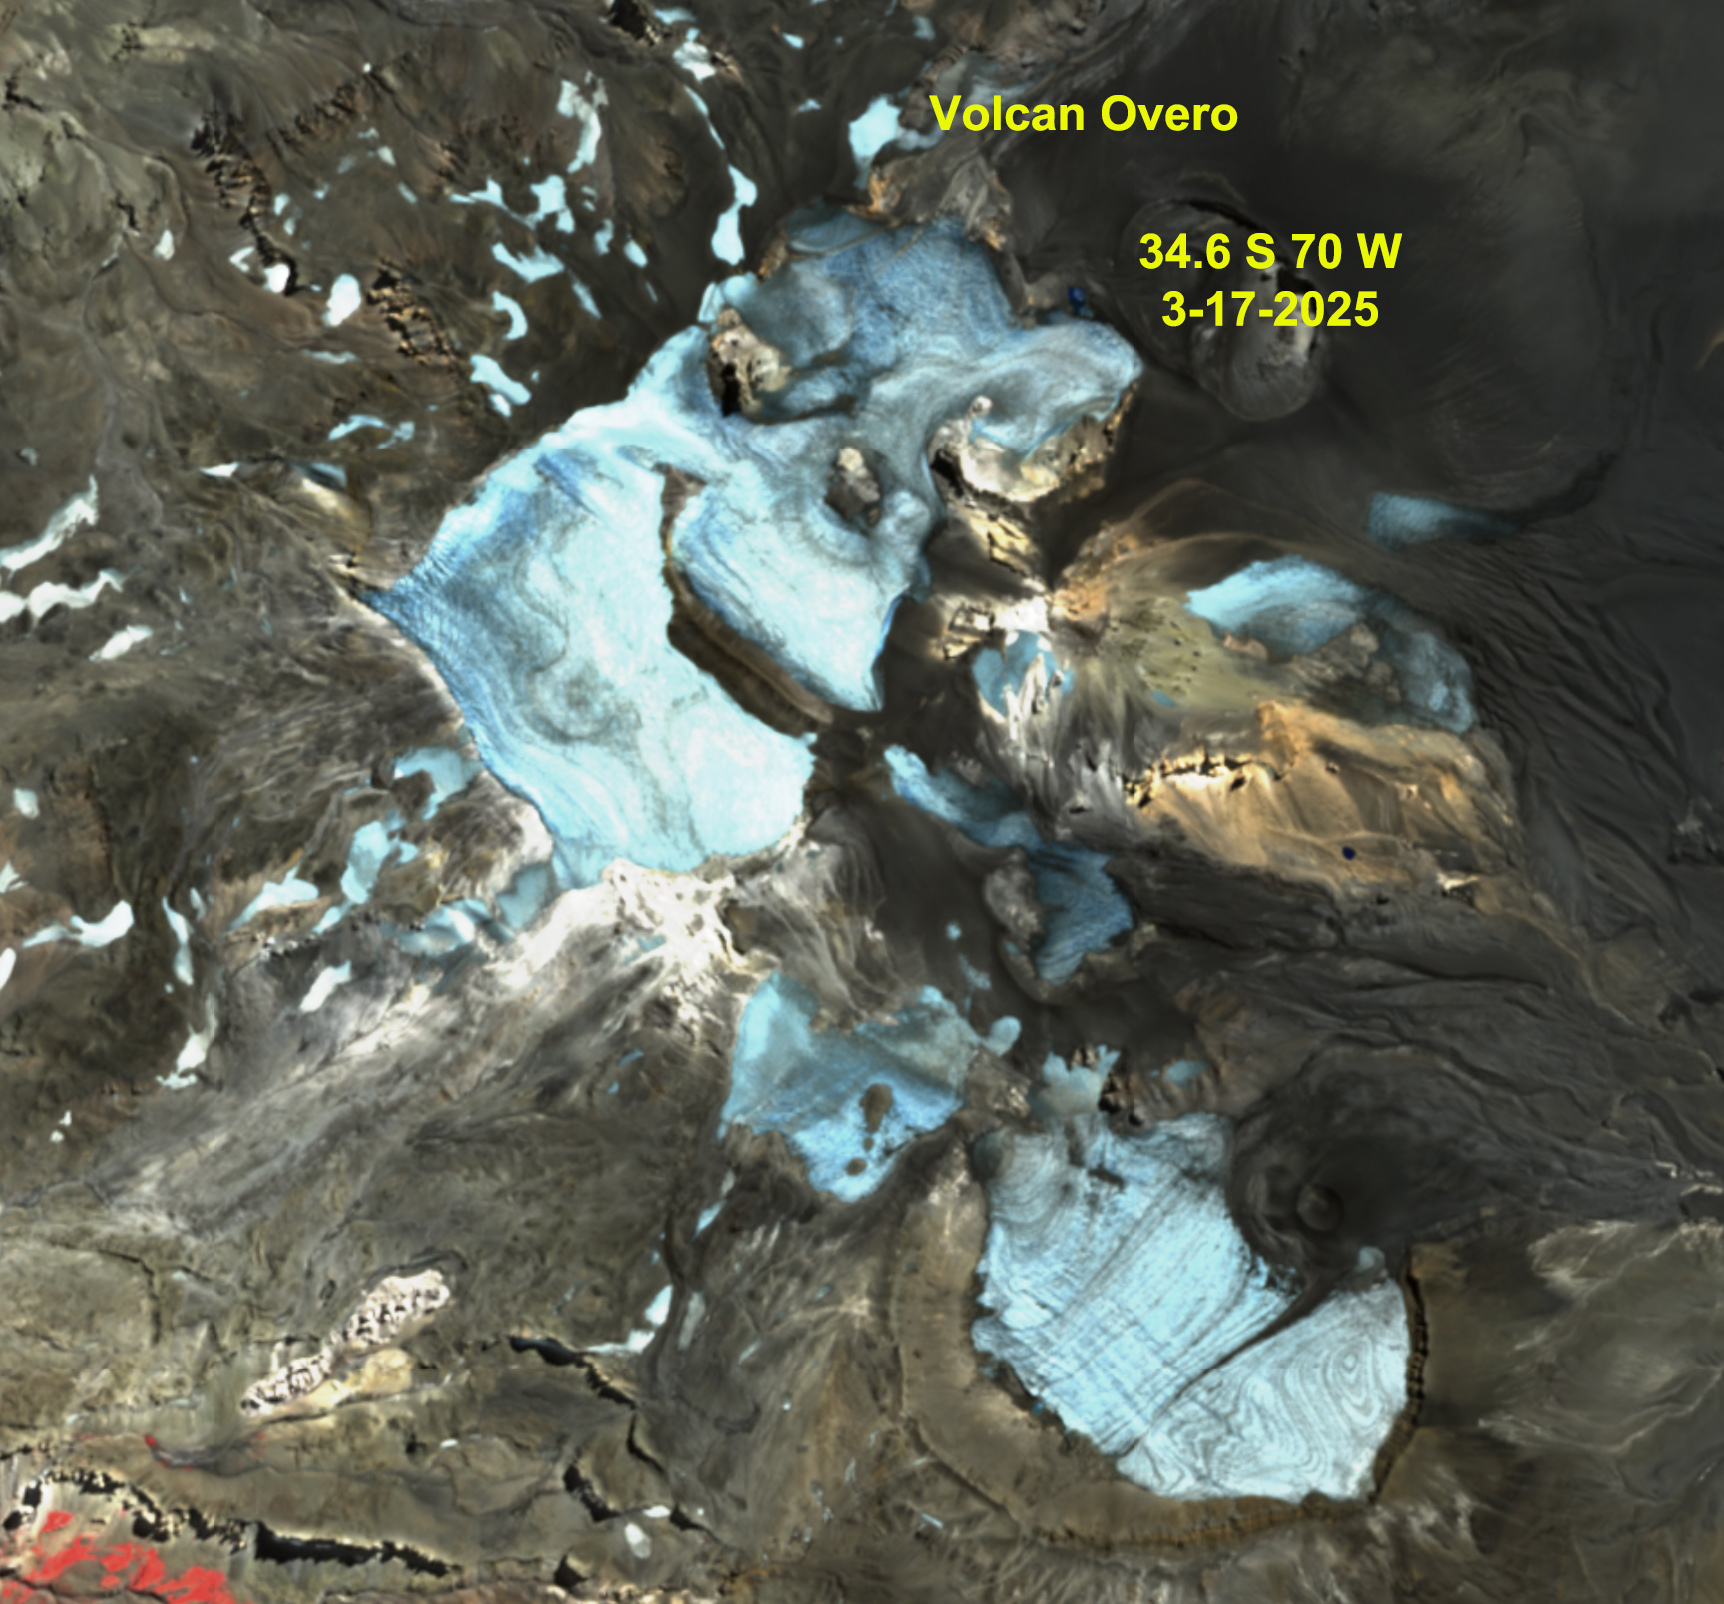
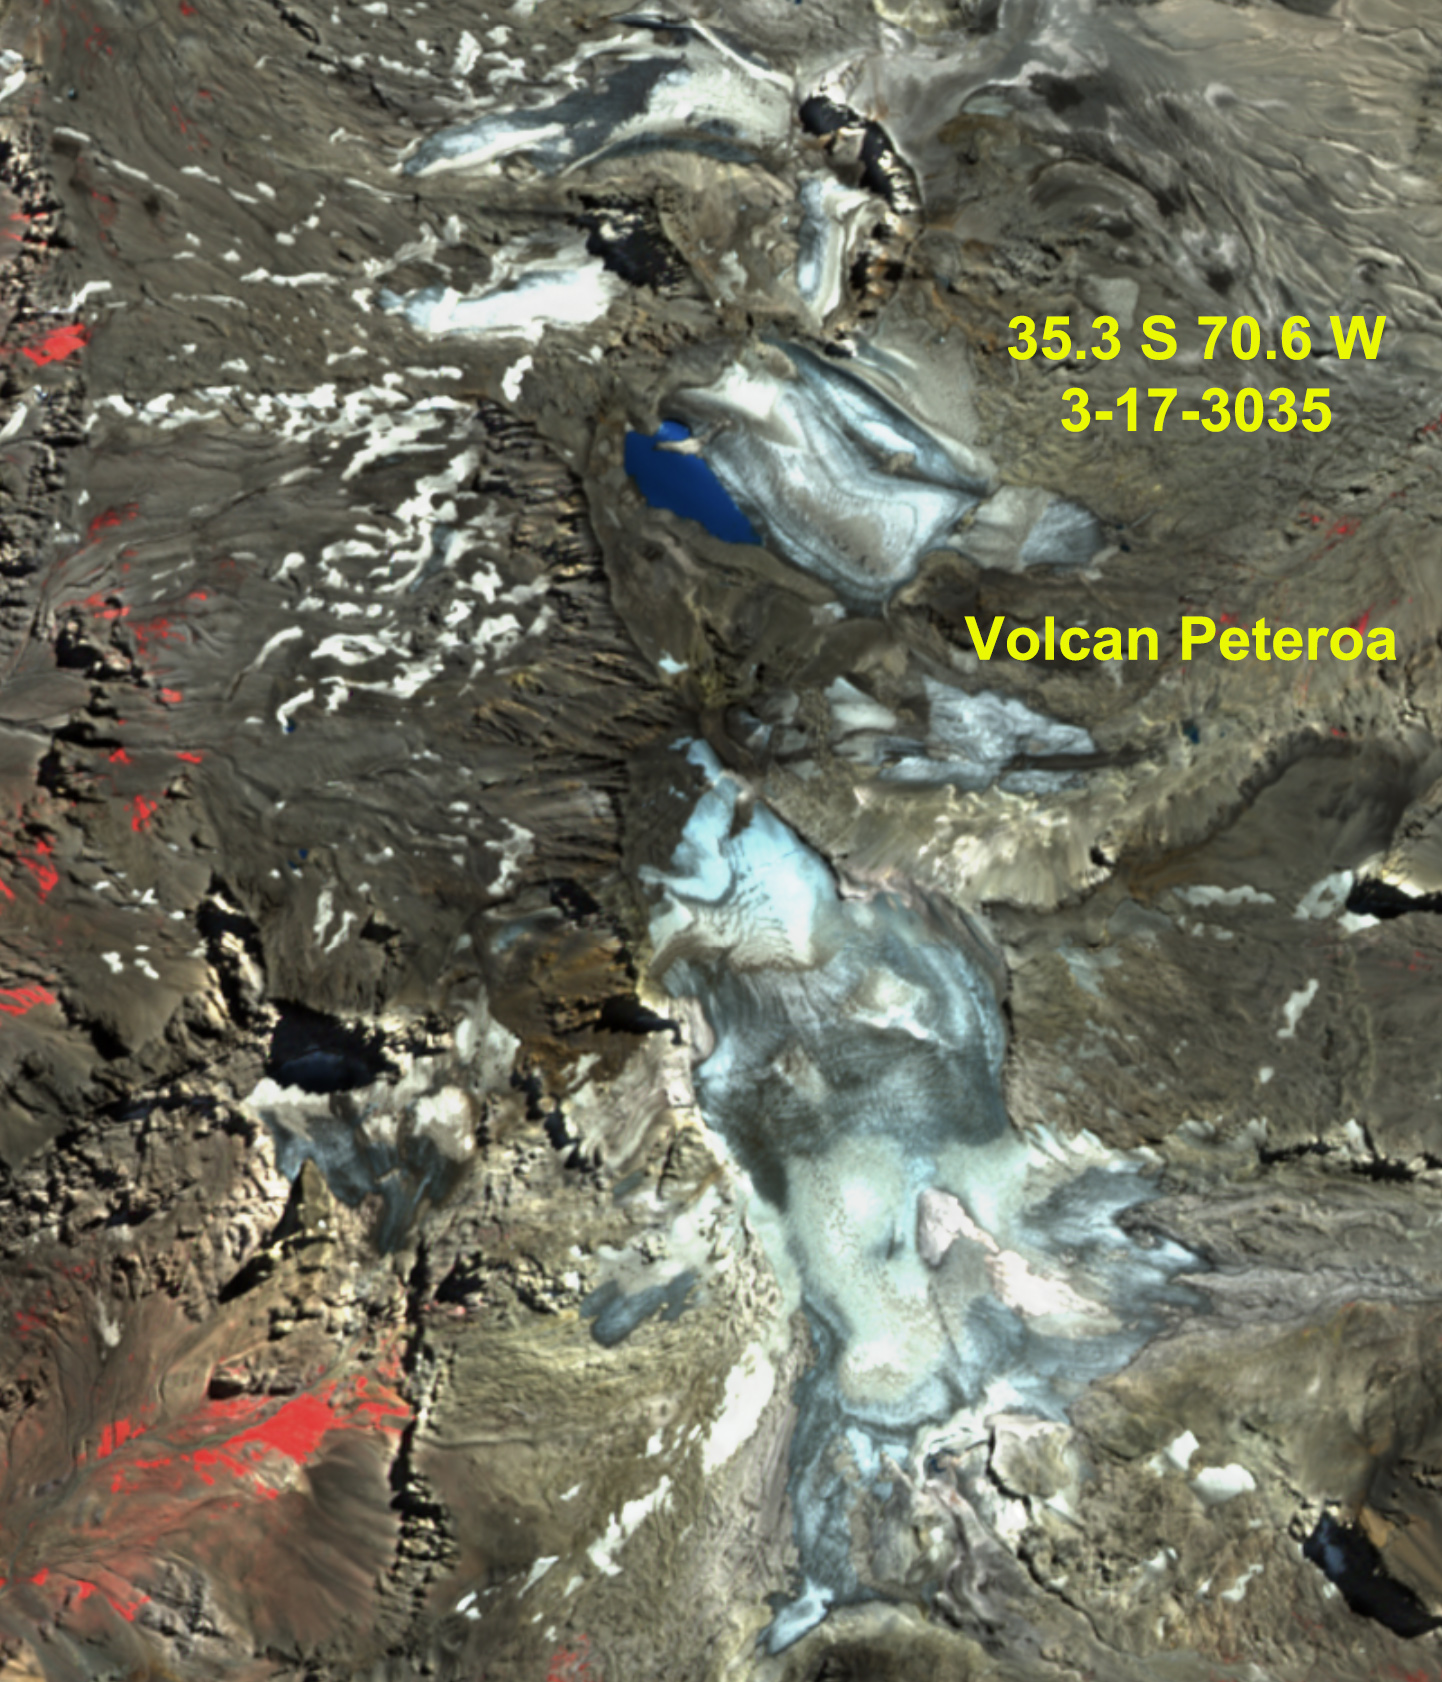
For an alpine glacier to thrive it must remain 50-60% snowcovered throughout the year, even at the end of the summer. To survive it must have consistent significant snowcover at the end of summer, indicative of a persistent accumulation zone (Pelto, 2010). In the Central Andes of Argentina and Chile I have chronicled the near total loss of snowpack, leading to dirty/dark snowcover free glaciers. in 2022 and 2023 (Pelto, 2023). In 2025 this pattern is again apparent. From north of Santiago at Olivares Glaciers and Alta/Baja de Plomo Glacier to east of Santiago at Volcan Overo adn Fiero Glacier to south of the Santiago region at Cobre Glacier and Volcan Peteroa we see glaciers in mid-March with less than 10% snowcover remaining. This is indicative that the 2024/25 mass balance period for the Central Andes will be one of significant loss.
Olivares Glaciers and Juncal Sur in in false color Sentinel image from 3-17-2025,Volcan Overo Glaciers in false color Sentinel image from 3-17-2025, continued fragmentation and expanded bedrock area amidst glaciers evident.Del Humo and Fiero Glacier in false color Sentinel image from 3-17-2025.CobreaGlacier in false color Sentinel image from 3-17-2025, is retreating both at the top (northwest) and terminus (southeast) of the glacier.Volcan Peteroa Glaciers in false color Sentinel image from 3-17-2025.
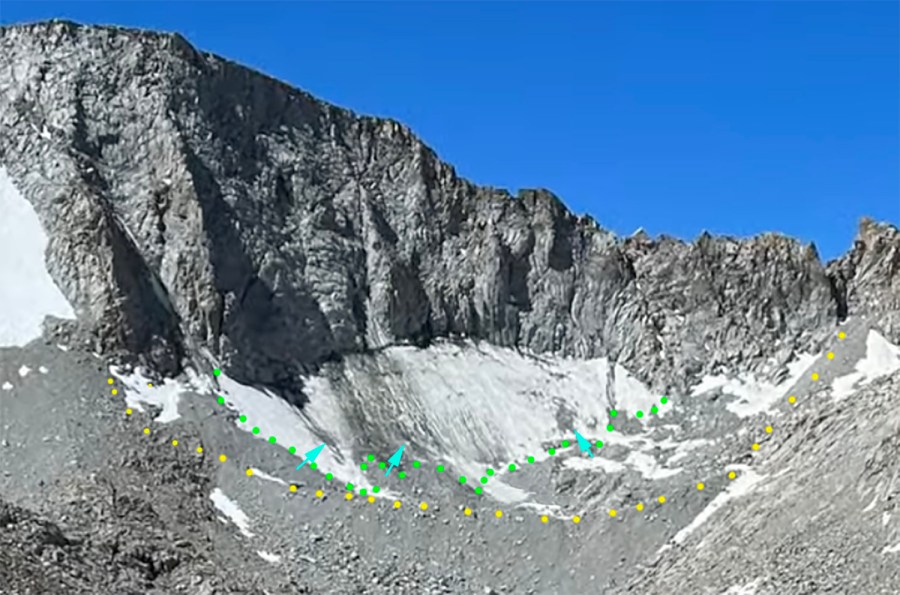
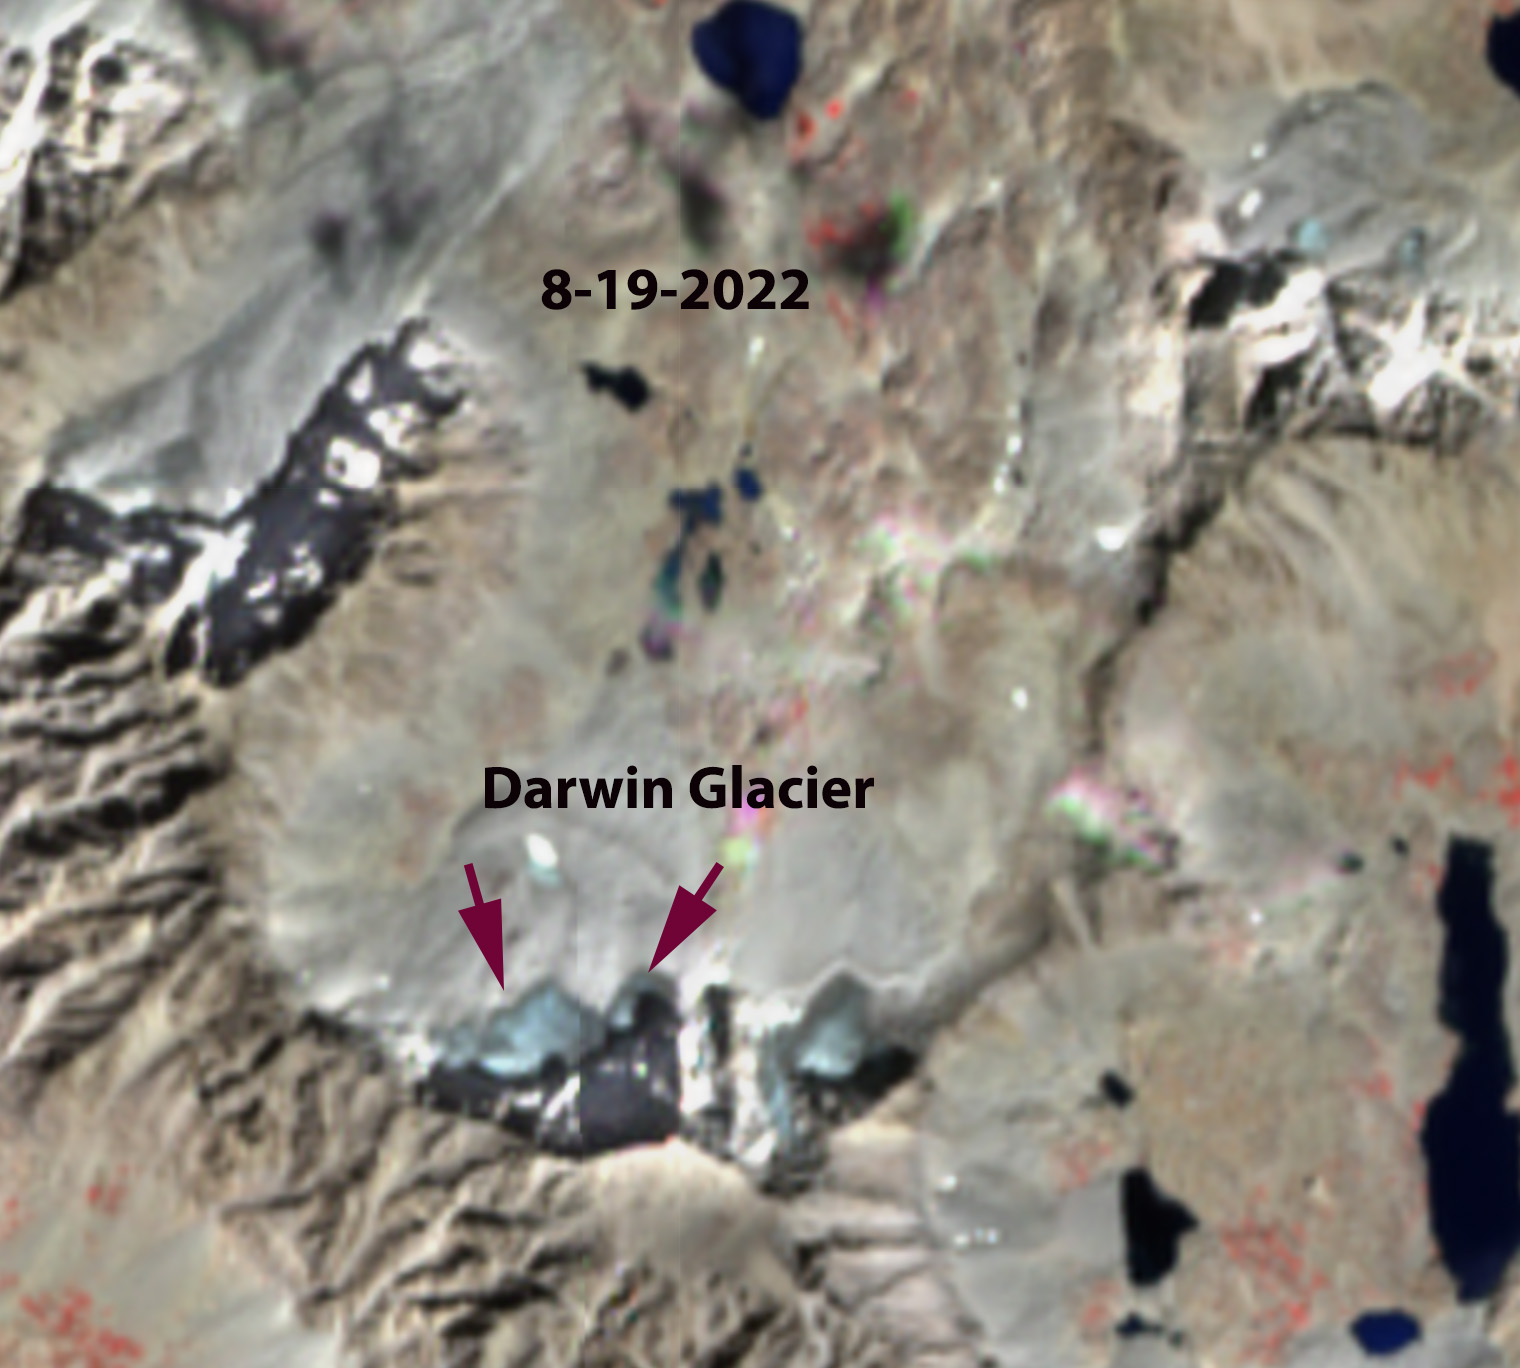
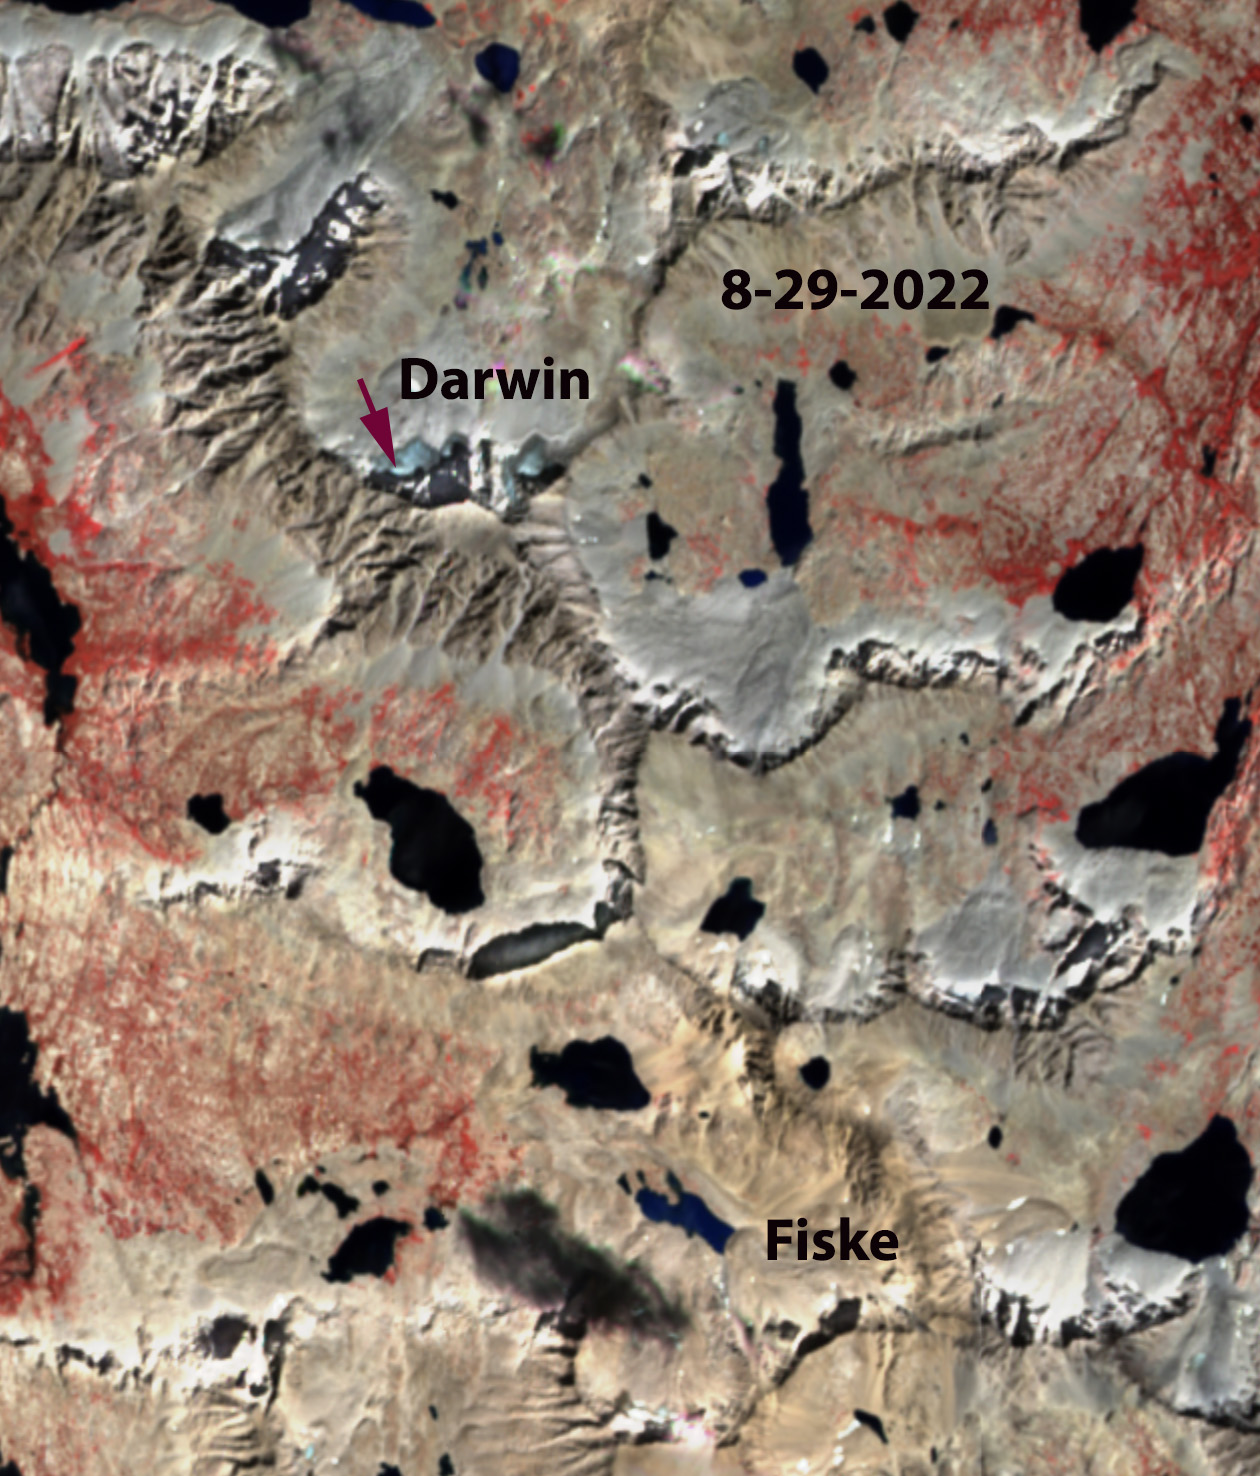
Darwin Glacier on 8-29-2022 in Sentinel False Color image with area reduced to 0.026 km2. No longer a glacier there is still relict ice clinging to the slope, in the next six weeks further melt reduced volume significantly.Darwin Glacier on July 19, 2022 with the moraine that the glacier was in contact with in the 1990s-yellow dots, and curent margin green dots. The blue arrows indicate rock area emerging as glacier thins. Slope has steepened and bergshrund is melting out (sierralara.com, image)
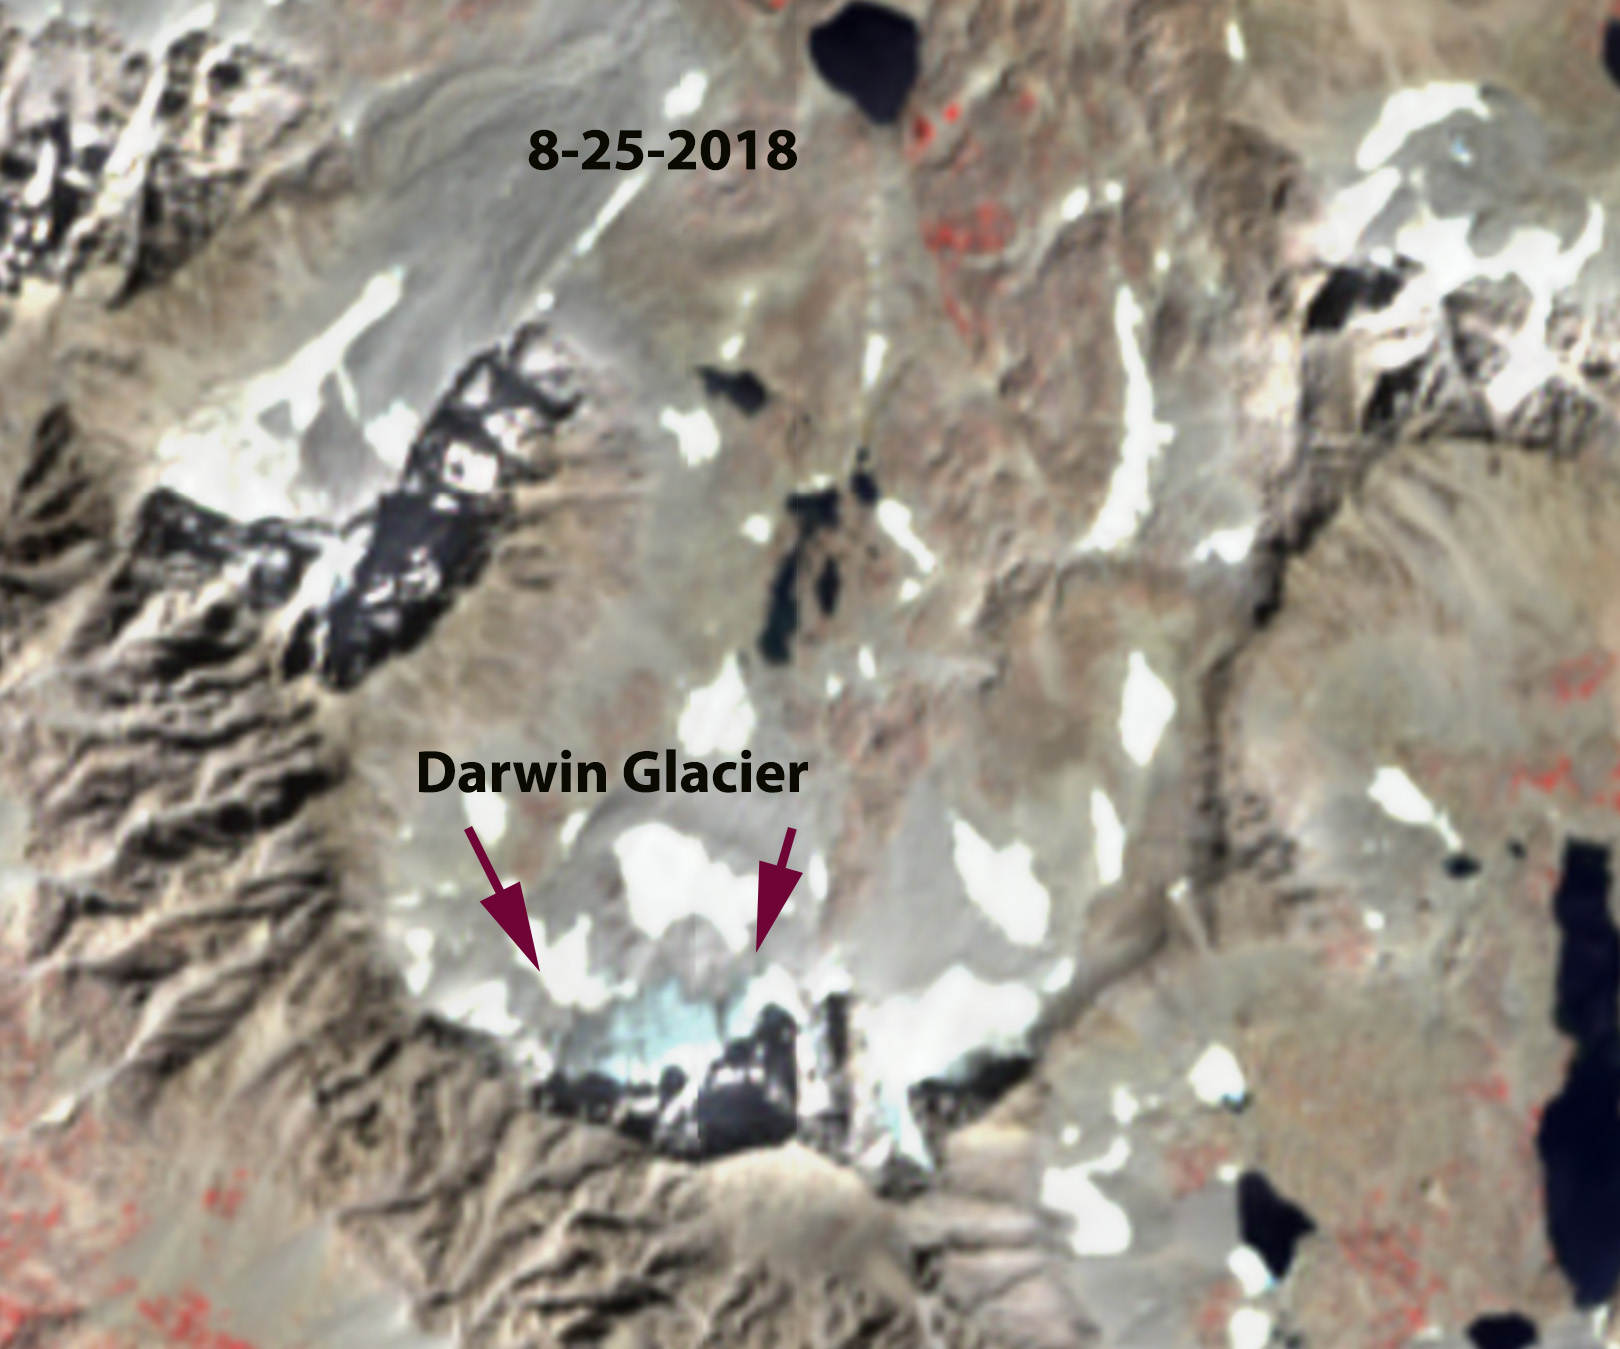
The Sierra Nevada, California has a number of small glaciers that have clung to the north facing slopes of the High Sierra. Darwin Glacier is one of those glaciers on the north side of Mount Darwin. named for Charles Darwin. The glacier is in Kings Canyon National Park and drains into the San Joaquin River.
In 1903 the glacier had an area of 0.25 km², declining 40% by 1948, 0.14 km2Basagic and Fountain (2011). The glacier expanded beginning in the 1970s and ending in the 1990s, with an area of 0.157 km² in 1976 (GLIMS), and then had declined slightly in 2001 had an area of 0.135 km², 5-10% greater than in 1948. In 2004 area loss was increasing with the area measured in the field by Basagic and Fountain (2011), at 0.114 km2 .
With a steep slope of ~30 degrees, the glacier depends on snow sloughing/avalanching off the north face of Mount Darwin and piling up against a moraine. Retreat from this moraine after 2004 has led to steepening of the glacier with less snowcover retained on its surface. From 2004 to 2022 the glacier rapidly lost volume and area. In 2014 the glacier area had declined 50% to 0.057 km² (GLIMS), in 2018 the glacier area was 0.048 km². The particularly warm summers of 2021 and 2022 led to further rapid decline to 0.038 km² in 2021 and 0.026 km² in 2022. At this time Darwin Glacier and was no longer a glacier with less than 20% of relict ice left from 2004, and with movement having ceased. The glacier bergshrund is also melting out. Bare rock was was also being exposed at several areas amidst the glacier area in 2022.
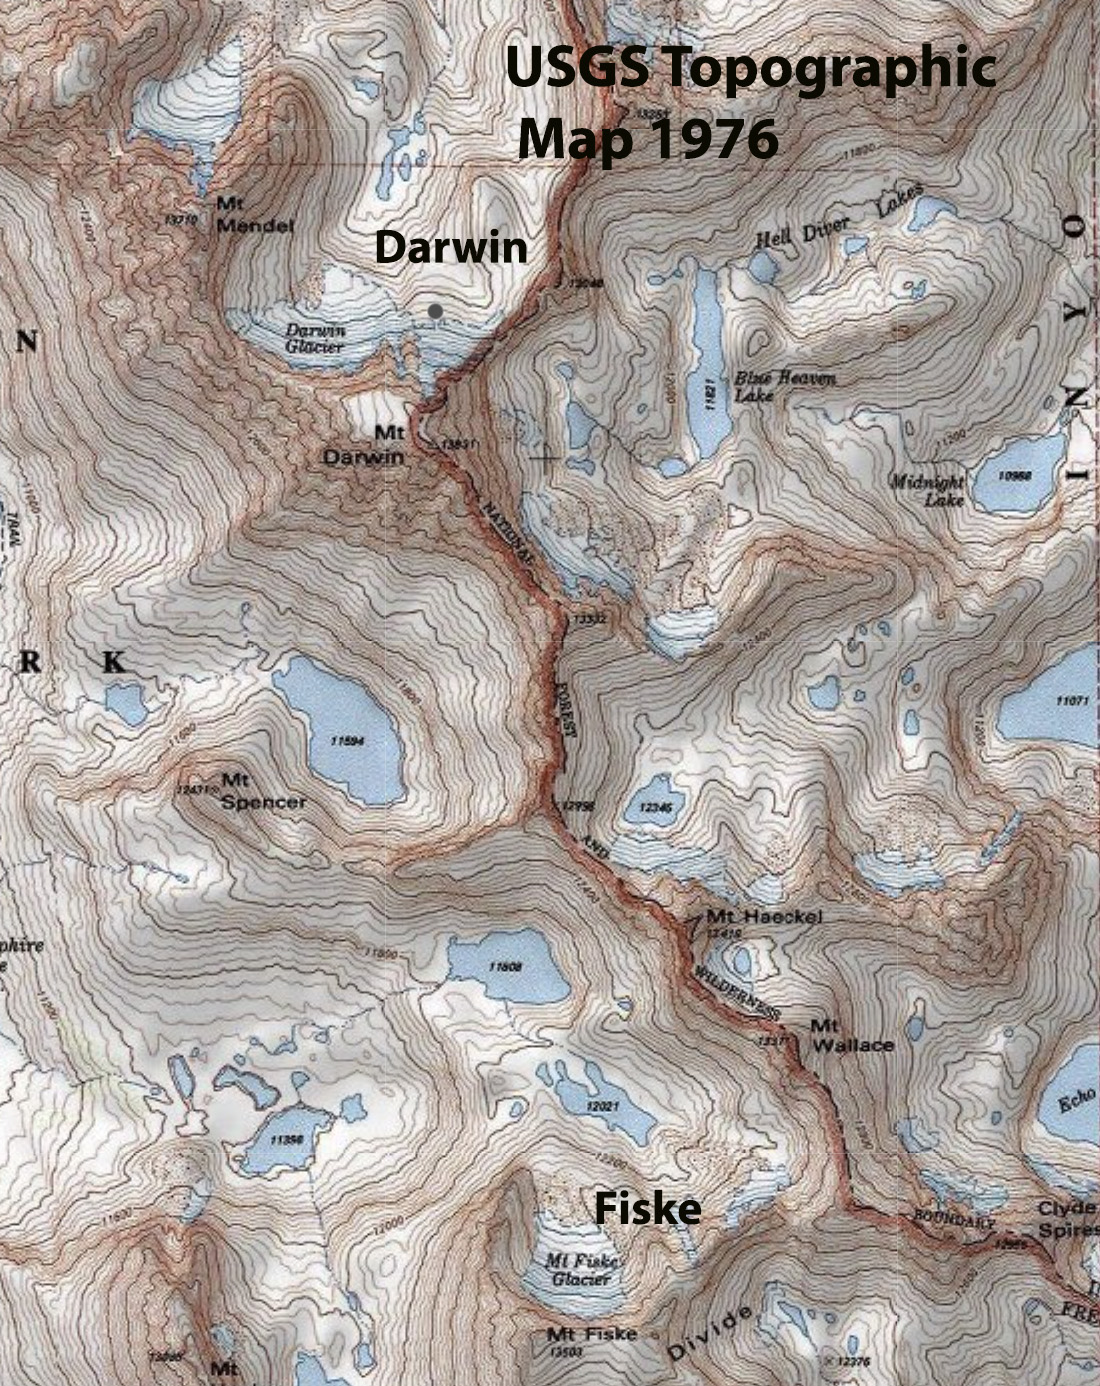
Just to the south Mount Fiske Glacier has disappeared as well, along with the glacier that was in the cirque on the north side of Mt. Mendel. The high snowfall winters of 2023 and 2024 have been offset by continued warm summers, preventing any significant volume increase.
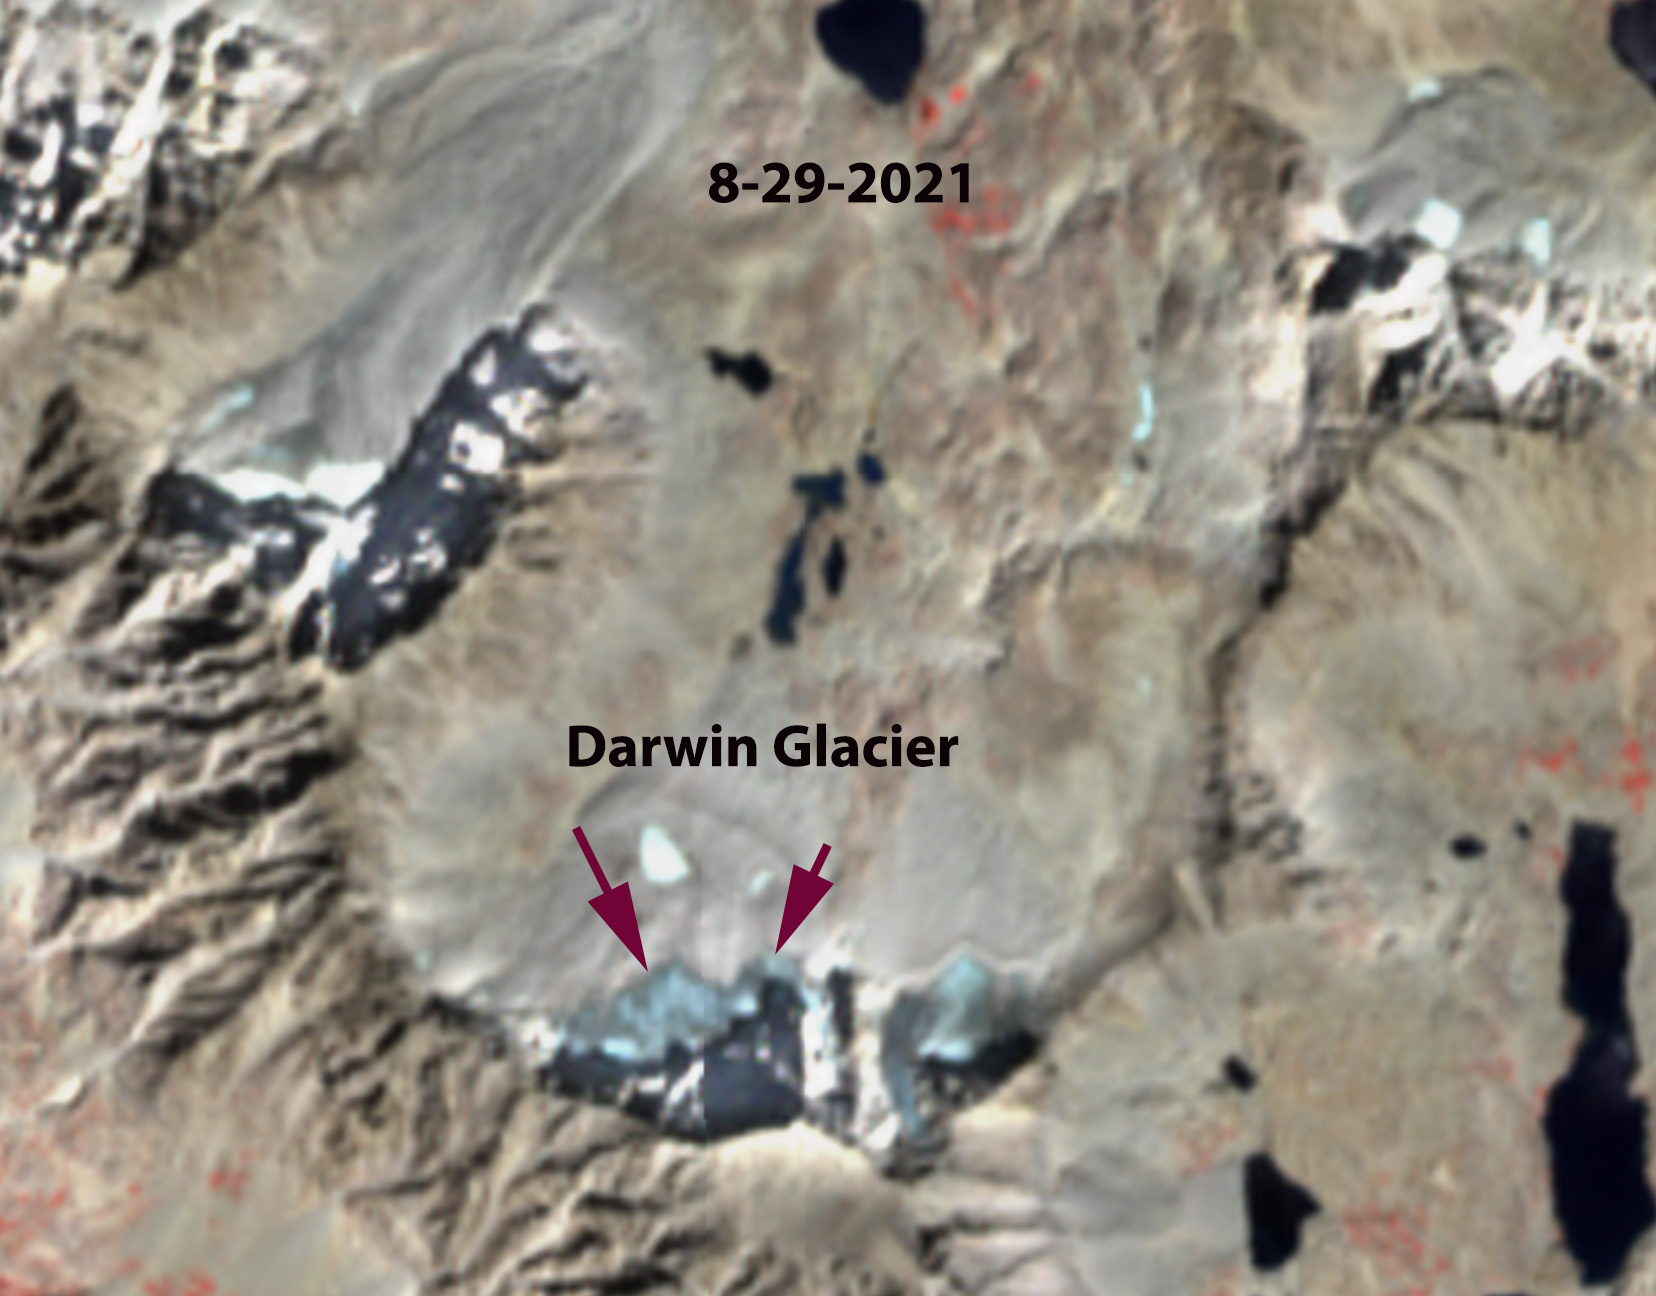
Darwin and Mt. Fiske Glacier on 1976 USGS Topographic map with areas of 0.16 km2 and 0.08 km2 respectively.Darwin Glacier in 2018 Sentinel false color image with an area of 0.048 km2.Darwin Glacier and Fiske Glacier no longer have sufficient area to qualify as glaciers at 0.026 km² for Darwin Glacier and 0.008 km² for Fiske Glacier. No retained snowcover in 2021 or 2022. Darwin Glacier on August 29, 2021 in Sentinel false color image. There is no retained snowcover and area has declined to 0.036 km2.Darwin Glacier on August 28, 2024 in Sentinel false color image. There are two areas where area loss from 2022 is evident, despite 60% of the glacier still having snow cover.
These losses are similar to those observed on Whitney Glacier, Mount Shasta. The NCEI NOAA Division 5 climate data for this area indicates that meltseason temperatures have been the primary cause of the recent decline, though declining accumulation season precipitation has been as well, see bottom.
California Division 5 Average Temperature May-September 1950-2022.
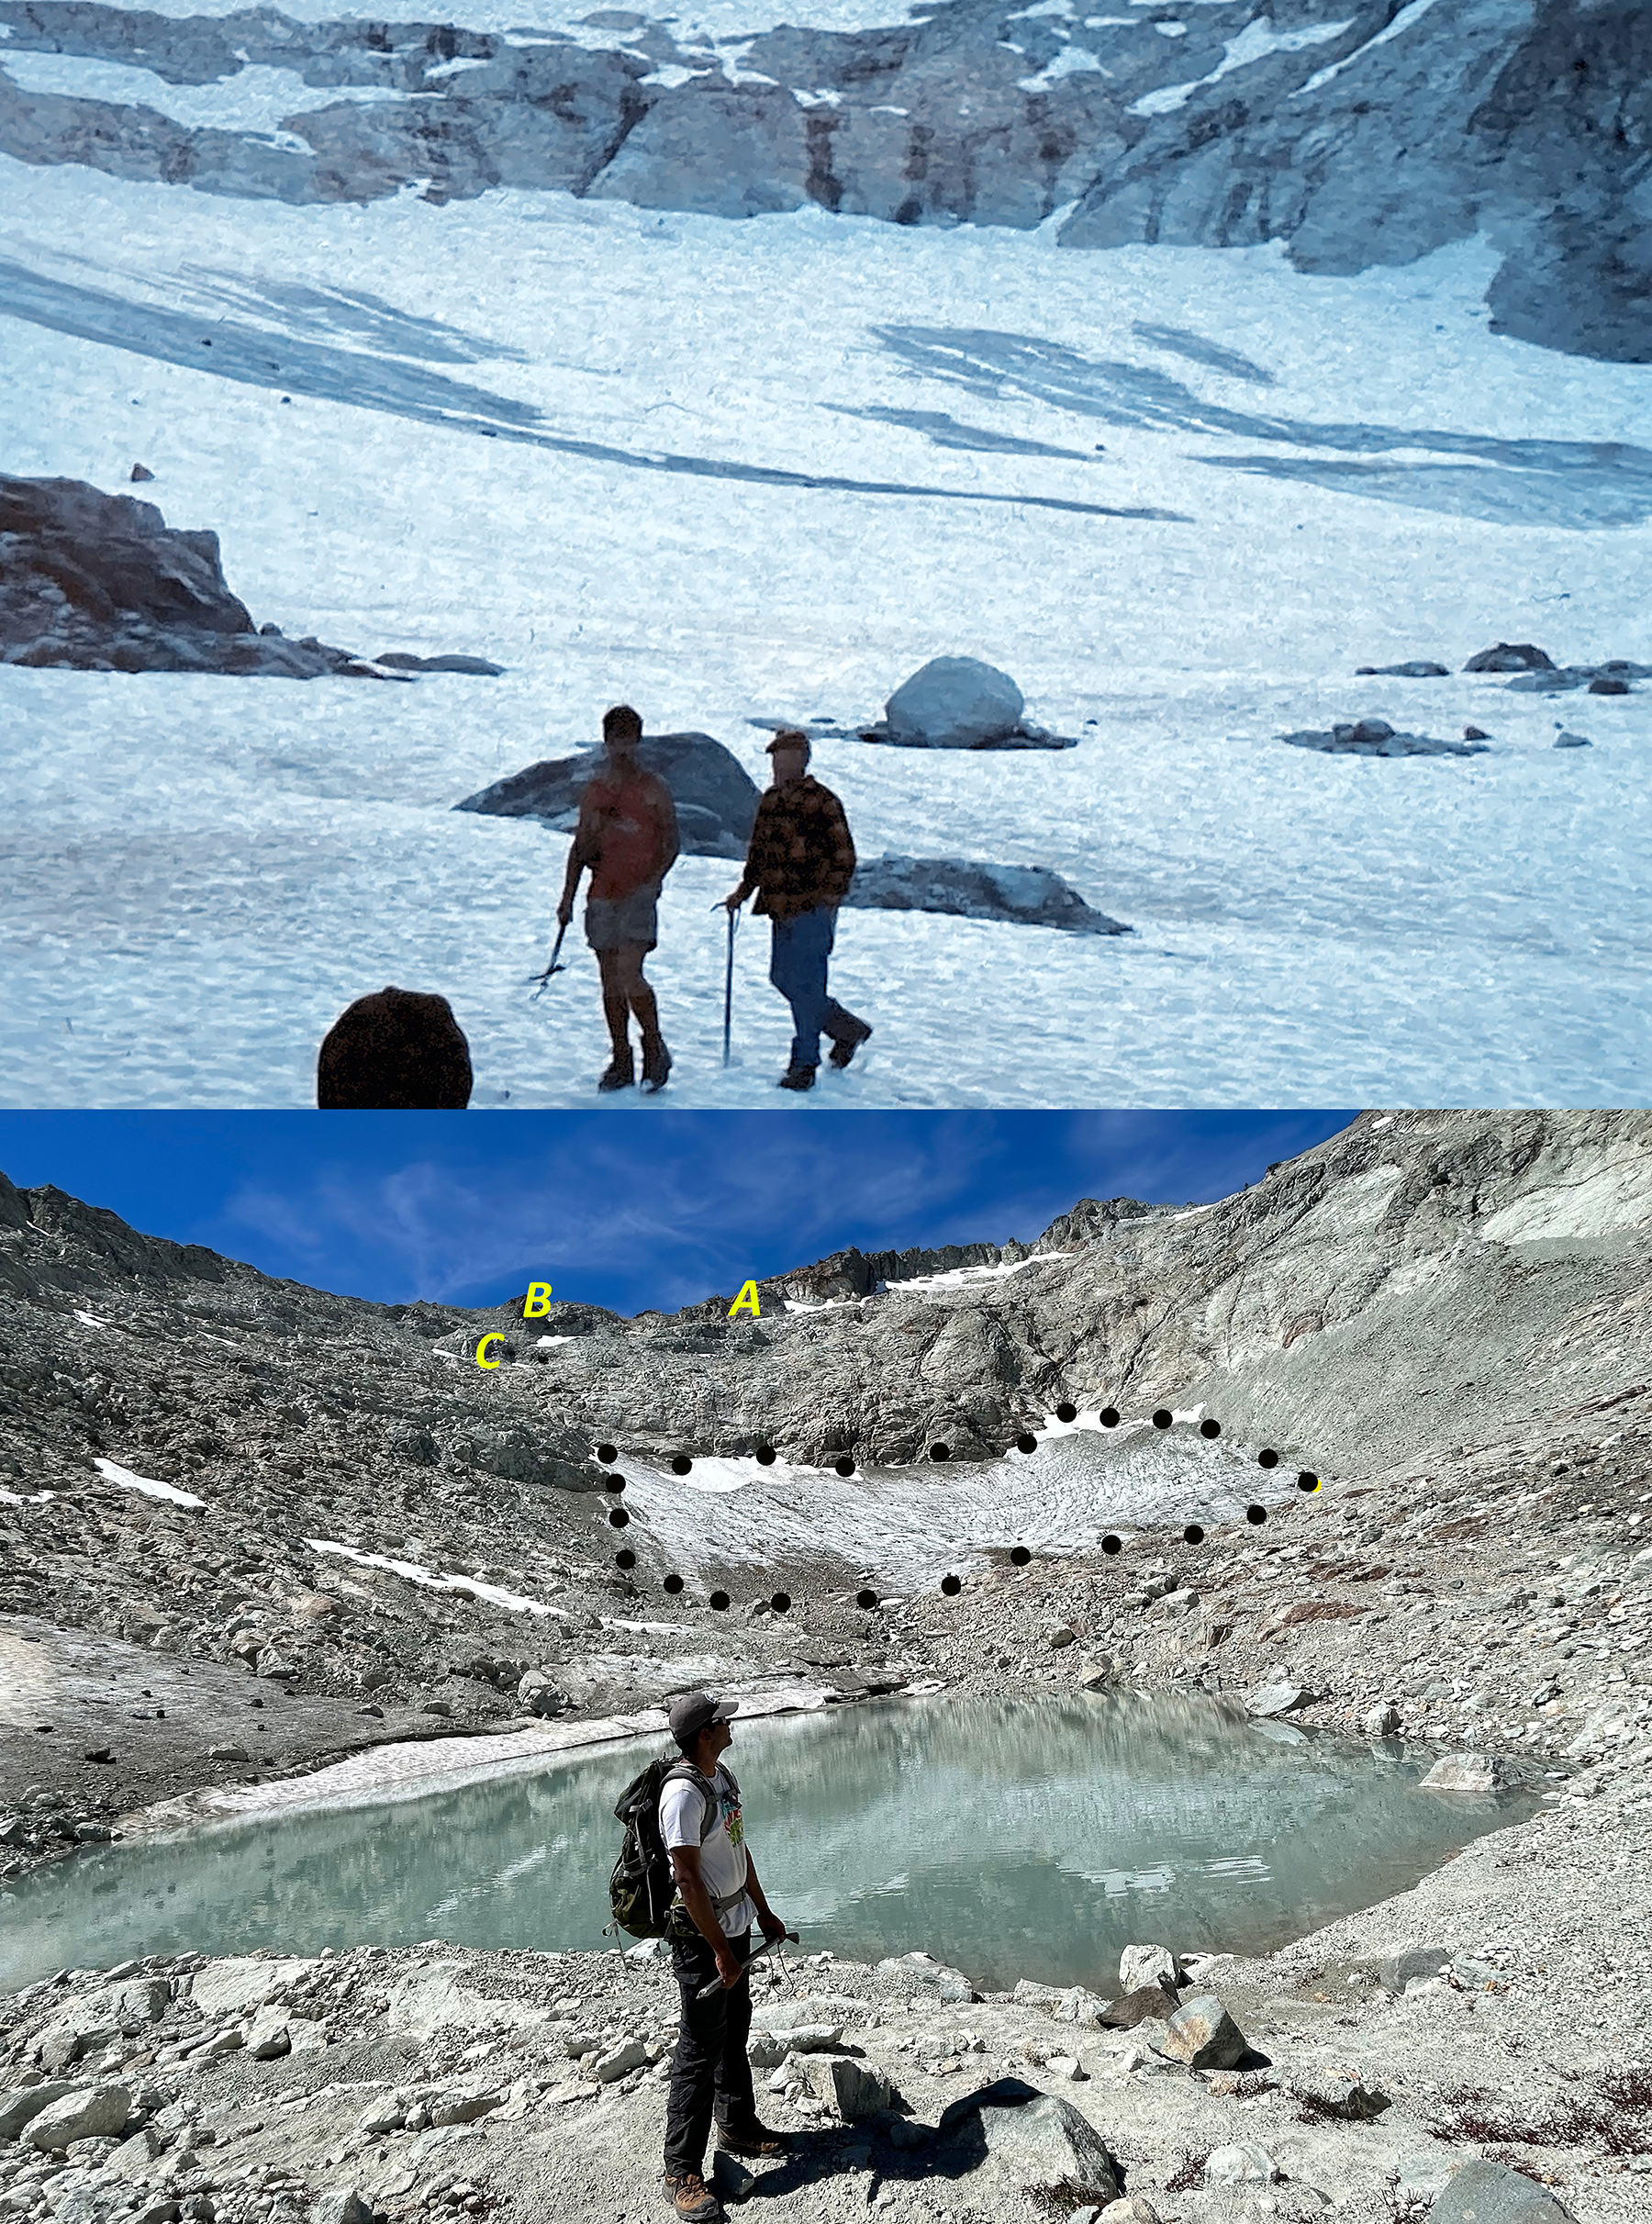
Ice Worm Glacier from the same location in 1986 and 2023, Bill Prater in 1986 image.
Ice Worm Glacier is an east-facing cirque glacier on the east flank of Mount Daniel, WA. Mount Daniel is on the crest of the North Cascade Range of Washington, the crest separates the dry east side that drains to the Columbia River and the wet west side that drains to Puget Sound. The glacier is at the headwaters of Hyas Creek, which drains into the Cle Elum River and the Cle Elum Reservoir. The Cle Elum Reservoir has a storage volume of 538,900,000 m3 and is primarily used for flood control in spring, and agricultural irrigation in summer. This reservoir is the largest in the Yakima River Basin and provides irrigation to 180,000 hectares of agricultural land. The glacier is located in the Alpine Lakes Wilderness area which prohibits the use of mechanized equipment. The Ice Worm Glacier cirque floor is at 1940 m and the headwall at 2050 m. There is a bench at 2150–2300 m that held a glacier/perennial icefield prior to 2015. The glacier is accessed by backpacking 8 km from the Cathedral Rock trailhead with the same base camp used each year at 1700 m on the bank of Hyas Creek. Detailed publication by Mauri and Jill Pelto at: Loss of Ice Worm Glacier, North Cascade Range, WA USA, 2025.
The glacier is fed by wind drift accumulation along the ridge that was just above the top of the glacier during the 1944-2000 period. Avalanching from the slopes below the East Peak of Mount Daniel and from the ridges extending along the north and south flank of the glacier have also been significant. The glacier is part of the Mount Daniel-Mount Hinman Glacier Complex just south of Highway 2 and sits astride the Cascade Divide. This complexcomprised of 9 glaciers covering 3.8 km2 in 1984. This was the biggest cocentration of glaciers between Mount Rainer and Glacier Peak. At the end of the summer 2023 melt season only three of these remain as glaciers, Daniels, Foss and Lynch Glacier. We began monitoring these glaciers along with Ice Worm Glacier in 1984.
Ice Worm Glacier Evolution
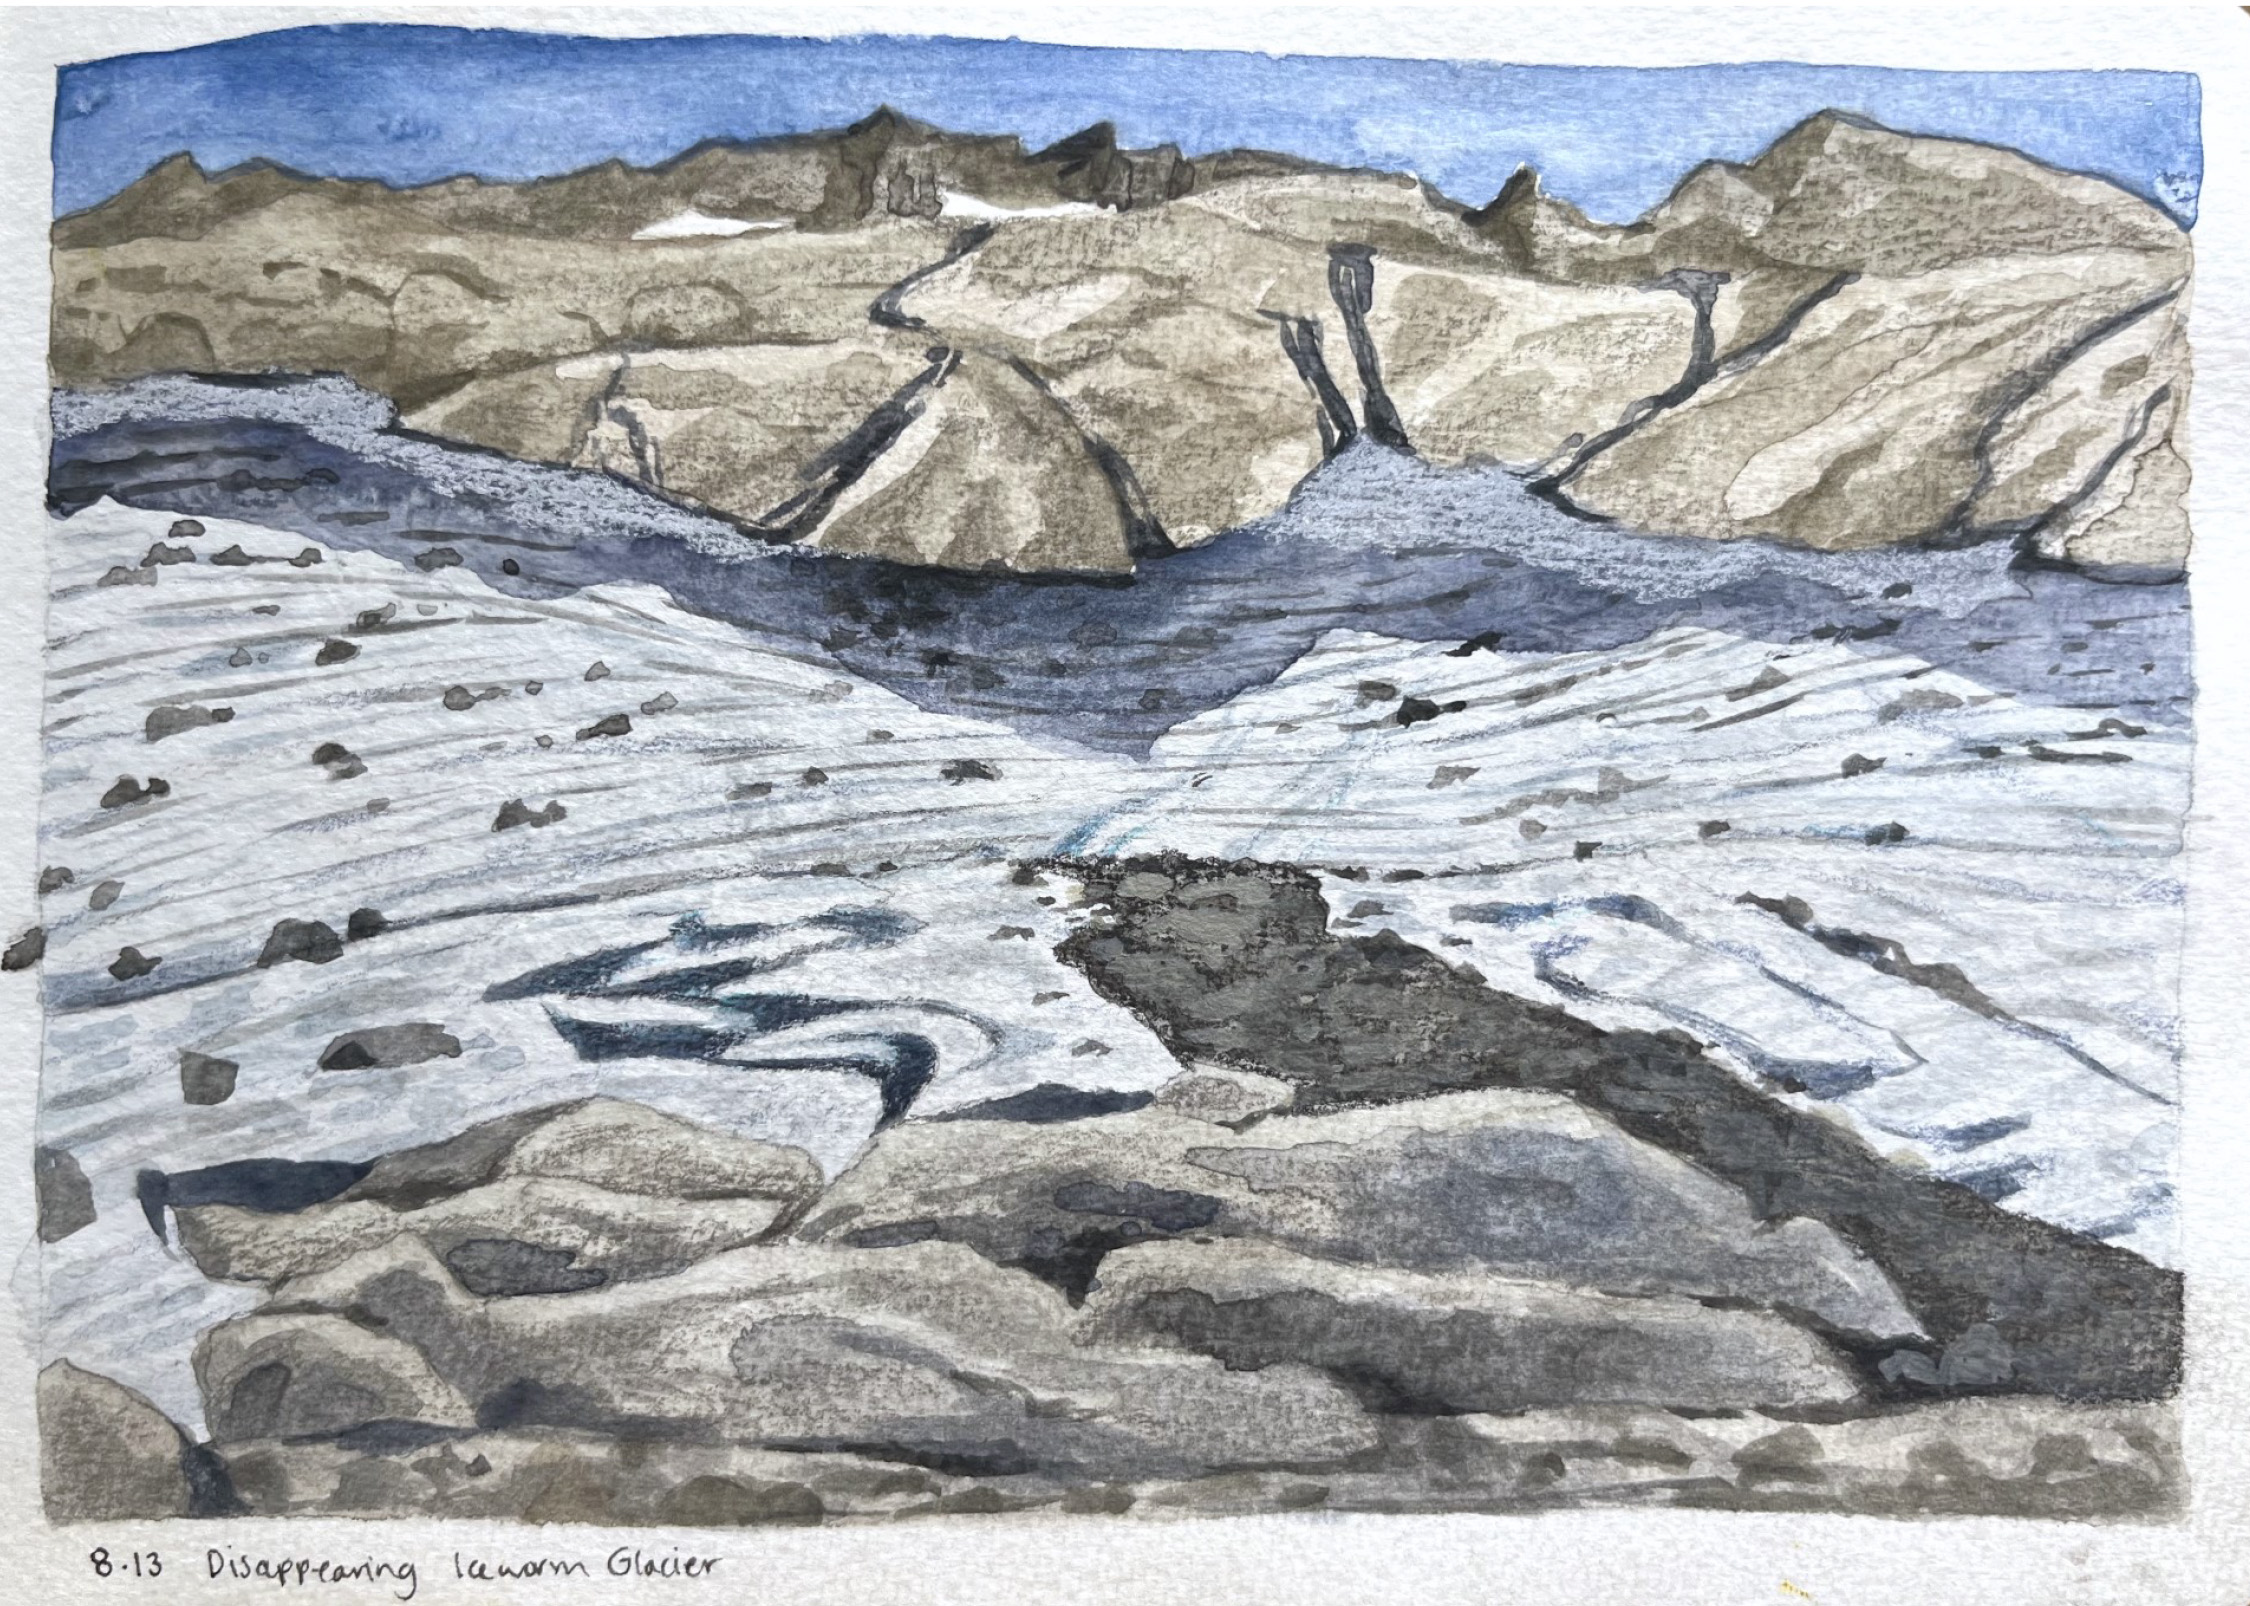
Ice Worm Glacier field sketch by Jill Pelto in 2023.
In 1986 William (Bill) Prater, who had made many first ascents in the area between 1944 and 1960, joined us in the field. Bill also had invented and patented (1973) the first snowshoe with a claw attached to its binding, the Sherpa Snowshoe. Comparing images from these early visits with the current margin of Ice Worm Glacier indicated that there had little change in this glacier from 1944-1986. The mapped area in 1958 was 0.19 km2 (GLIMS, 2023), in 1986 we mapped the area at 0.18 km2.
Each summer during the third week in August we measure the mass balance of this glacier. Because the glacier lacks crevasses we simply grid the glaciers with measurements made 50 m apart along transects running up the glacier and across the glacier along the margins. We also completed a longitudinal profile running up the glacier from a fixed location on the bedrock at the below and at the top of the glacier. The surface elevation was determined at the specific 50 m points to identify thinning of the glacier. During the first decade the glacier extended to within 10 m of the ridge on the south side of the glacier, allowing us to ski off of the ridge, see 1990 image below.
Glacier Area Change
View of the south ridge across Ice Worm Glacier in 1990 above and 2006 below, note recession of the top of the glacier from this ridge.
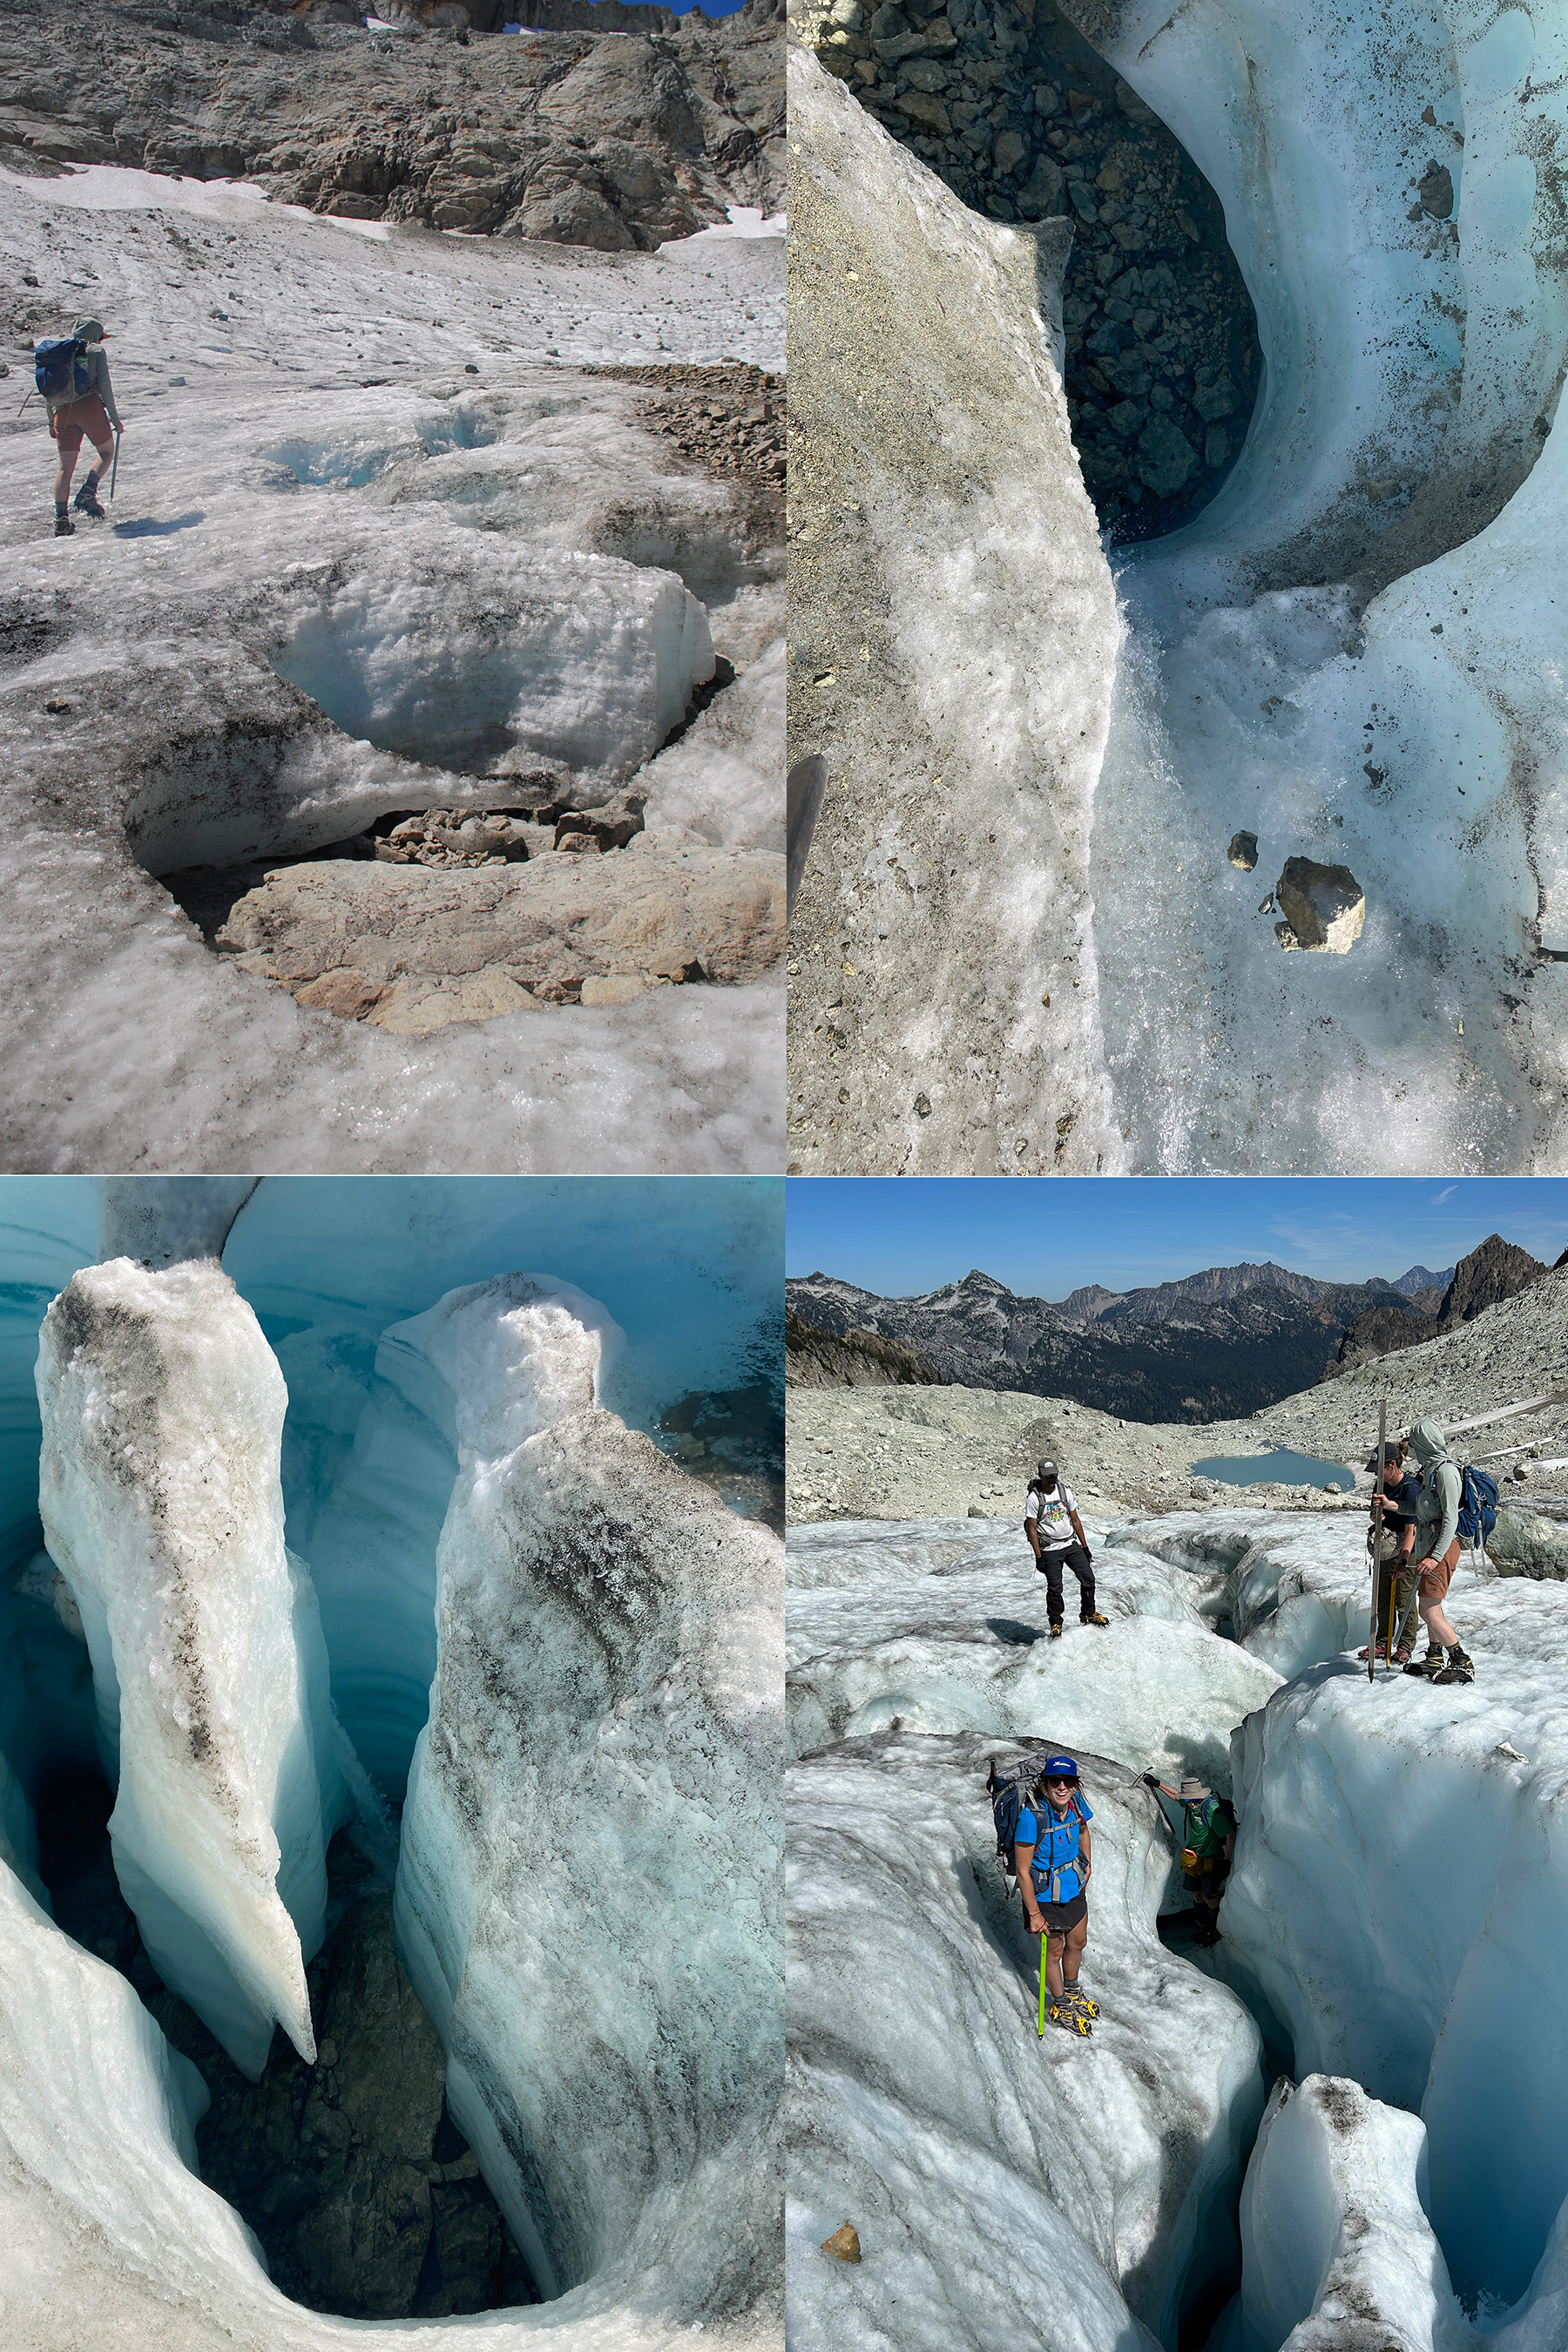
From 1984 to 1992, the glacier extended to within 15 m of the ridge on the south side of the basin. By 1995 this was no longer possible as the top of the glacier was retreating as fast as the bottom of the glacier. In 2006, the recession from this ridge was greater than the recession at the terminus. The glacier perimeter was surveyed in the low snow years of 2005 and 2015, identifying the glacier area to be 0.15 km2 and 0.110 km2, respectively. In 2015, the inventory for RGI noted an area of 0.106 km2. Annually, from 2021 to 2024, low snow cover allowed for mapping of the glacier perimeter during a rapid decline from 0.09 km2 to 0.03 km2. The area loss from 1986 to 2015 was 0.07 km2, which is less than the area loss from 2015 to 2023 of 0.08 km2. provides a photo comparison of the change from 1986 to 2023, with the people standing in the same location in each case. The observed area determined in the field from the GPS position locations closely matches the RGI inventory area in 2015 and the area derived from overlaying the points on Sentinel 2 imagery from August 2021 to 2024, which have a 10–30 m resolutionThis summer we observed a dozen holes that reached the bottom of the glacier 4-6 m below, indicating how thin the ice is. There is no movement, the size and thickness are too low to generate future movement, hence this is no longer a glacier. A glacier is a body of snow and ice that is moving, this requires a persistent thickness of 20-30 m, which is typically associated with snow/ice areas of ~50,000 m² or larger. As a glacier becomes thinner or smaller than this movement will not be sustained.
Table 1. The observed area of Ice Worm Glacier from field measurements. The area of Ice Worm Glacier from previous inventories and Sentinel 2 imagery.
Year
Field Mapped Area (m2)
Validating Aerial/Satellite Image Area (m2)
1958
190,000 (GLIMS)
1986
180,000 (±10,000)
Field Observation only
1992
170,000 (±10,000)
Field Observation only
2005
150,000 (±5000)
Field Observation only
2015
110,000 (±5000)
106,000 (RGI)
2021
88,000 (±2000)
90,000 (Sentinel)
2022
68,000 (±2000)
Field Observation only
2023
41,000 (±2000)
40,000 (Sentinel)
2024
32,000 (±2000)
30,000 (Sentinel)
We have measured discharge at a natrual weir below Ice Worm Glacier since 1986. Average August daily runoff has declined 60% by 2022.
Glacier Base Observations
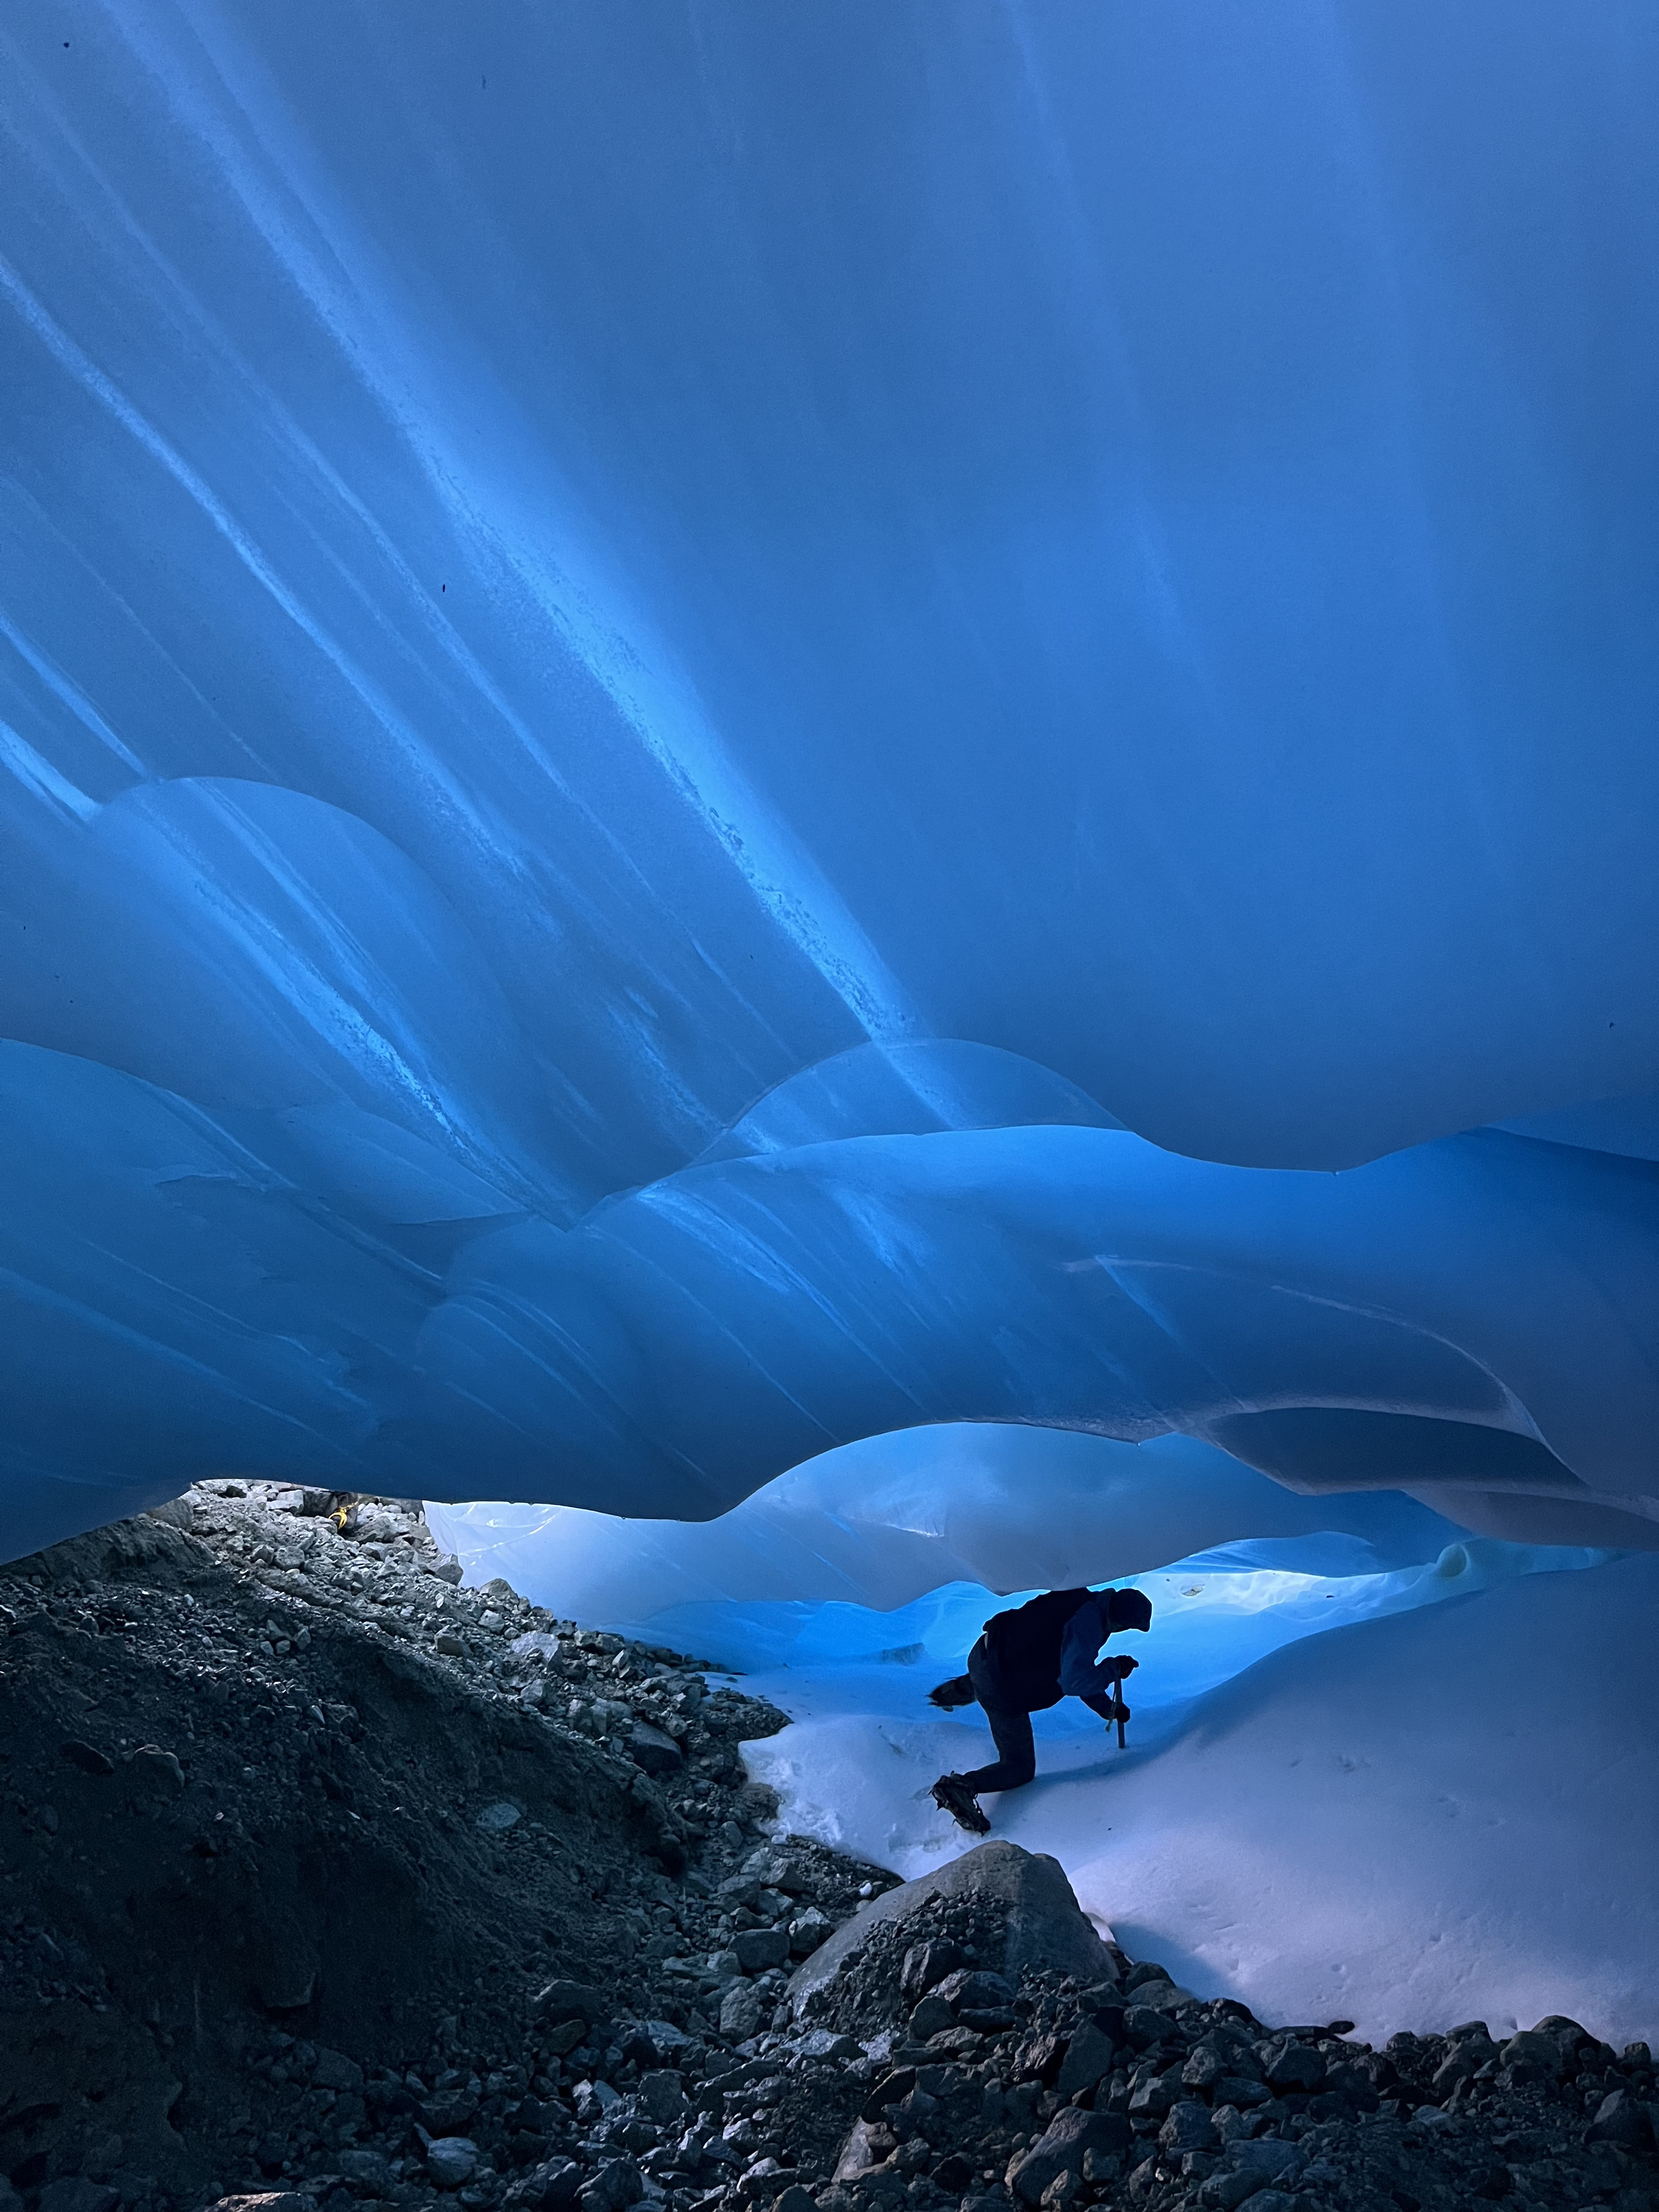
Ice Cave in 2024 that extended from top to the end of the glacier.
Beginning in 2015, we routinely assessed how deep each moulin, crevasse or supraglacial stream channel was on the glacier. One measure of a glacier no longer being a glacier is when crevasse features and stream channels consistently reach the bedrock below the glacier. In 2023, we examined 24 of these features and each reached bedrock at depths of 2–10 m. These features were distributed widely across the glacier. There are undoubtedly limited areas of thicker ice. In 2024, we explored an ice cave that extended 250 m from the top of the glacier to the end of the glacier. The cave roof was 1–4 m above bedrock, and the roof was consistently less than 2 m thick allowing light to penetrate from the glacier surface into the cave. An extensive ice cave transecting the entire glacier such as this cannot exist in a current glacier because ice movement would lead to ice cave closure.
Streams channel reaching bedrock at base of Ice Worm Glacier.
Each year in mid-August, stream discharge has been observed immediately below the 1986 terminus position of Ice Worm Glacier at 11 a.m., 2 p.m. and 5 p.m. during the field visit. This stream is also fed by perennial snowfields and, before 2015, a small glacier. These observations are insufficient to quantify daily runoff, but because of the consistent timing and methods, do allow for comparison. The glacier is located on the dry side of the range and has not experienced rainfall during any of our field observation periods, which would contribute to stream discharge. From 1985 to 2002, streamflow was observed on 36 days, with the average discharge being 0.12 m3 s−1. From 2021 to 2024, discharge was observed on 6 days with the average discharge being 0.03 m3 s−1. This roughly 75% decline in August runoff is similar to the 60% loss in runoff modeled for the loss of small glaciers in basins in the Alps and observed when the Lewis Glacier, North Cascade Range was lost. The change in summer streamflow in Hyas Creek near our base camp is apparent, as it had been a challenging stream crossing to keep your feet dry until 2013, and now is a simple step across. There has also been a marked increase in algae coating the substrate of the stream with the lower flow, clearer and warmer water, which is expected.
Climate Drivers
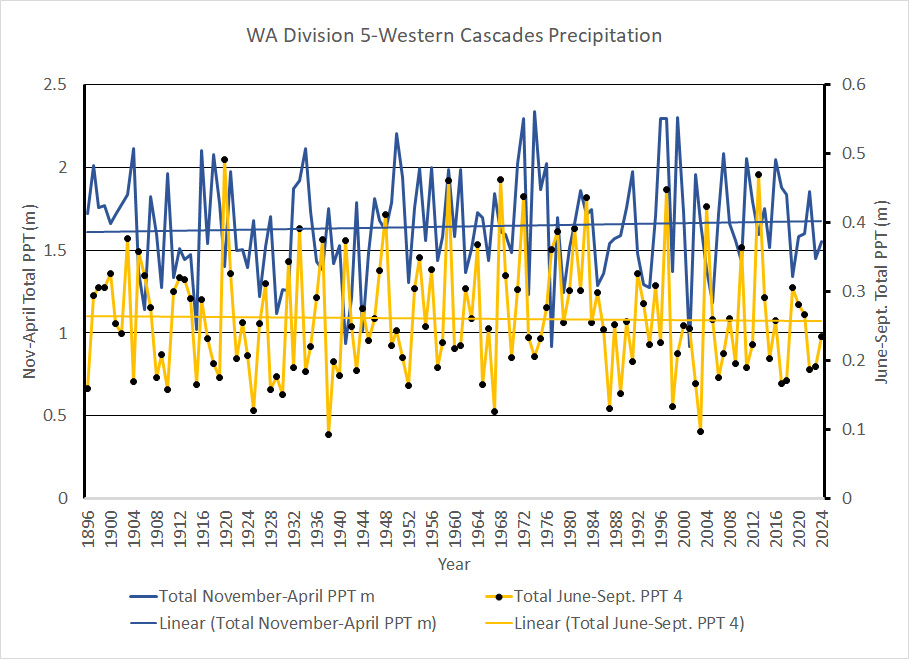
Trends in summer temperature at Western Cascade weather stations for the 1896 to 2024 period indicate that seven of the ten warmest melt seasons (June–September) have occurred since 2013. Melt season temperatures from 2014 to 2024 were 1.3 °C above the 1896 to 2022 mean. The long-term winter temperature trend from 1896 to 2024 has been 1.2 °C. From 2014 to 2024 winter temperatures were 0.9 °C above the long-term average, the warmest decadal period of the record.
During the 1896 to 2024 period from June to September, precipitation exhibited no significant trend. For the November–April (winter season) there was a 3% increase in precipitation from 1896 to 2024. From 2014 to 2024 winter precipitation averaged 1.68 m vs. the long-term average of 1.65 m. April 1 SWE from six long-term SNOTEL stations where April 1 SWE has a declining trend of 30% from 1946 to 2023, with a 10% decline since 1984. The April 1 SWE loss reflects increased melting of the snowpack or rain events during the winter season.This indicates that it is temperature rise that is driving the glacier mass balance loss, retreat and eventual disappearance of Ice Worm Glacier.
Washington State Division 5 -Cascade West-Temperature trends.Washington State Division 5 -Cascade West-Precipitation trends.
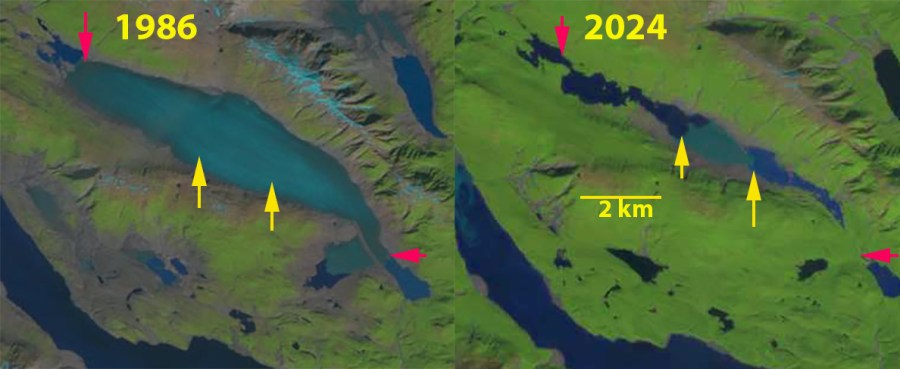
Burroughs Glacier in 1986 and 2024 Landsat images. The red arrow marks terminus in 1986 and yellow arrows the 2024 terminus. Yellow dots mark the outline of the glacier in 2022. Glacier area declined from 12.5 km² to 1.2 km² during this 38 year period.
Burroughs Glacier in Glacier Bay National Park, Alaska has been retreating since 1892 when it was part of the Muir Glacier complex. The glacier is named for naturalist John Burroughs, who accompanied John Muir to the areain 1899 on the Harriman Expedition. The glacier is unusual in that it has not had an accumulation zone this century, where snow persists through the year. Without an accumulation zone a glacier cannot survive (Pelto, 2010). Mickelson (1971) summarized the retreat of the glacier from 1892-1960. In 1892 the Burroughs ice plateau was assessed as a 10 km by 25 km ice cap. By 1960 it had thinned by as much as 750 m and its calving margin had retreated 27 km. In the 1960s crevasse extension were still active (Taylor, 1963). By the end of the 1970’s the glacier was essentially stagnant (Molnia, 2008). In 1982 I briefly visited the western terminus, which provided a still imposing slope, made more so by the rain and clouds lowering onto its surface, active crevasses were still evident indicating some movement. John Burroughs in writing the narrative of the Harriman Expedition noted about vanishing glaciers “It is dead or motionless, and is therefore free from crevasses. Its rim comes down to the gravel like a huge turtle shell and we stepped up on it without difficulty. (page 45)”.
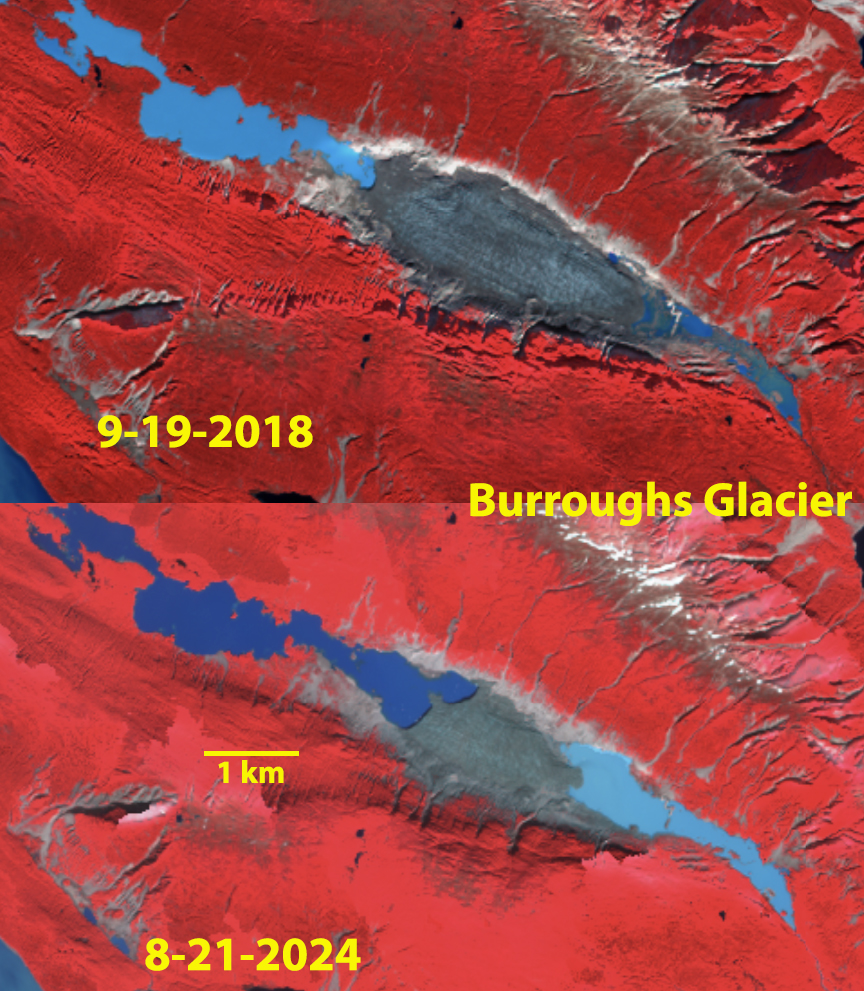
Here we examine the glacier in Landsat imagery from 1986 to 2024to illustrate the retreat, the lack of snowcover and the thinning. In the 1948 map of Burroughs Glacier, the glacier is 12.1 km long, and much of the glacier is already stagnant, the glacier has both a north and south terminus, purple arrows.
Burroughs Glacier in 1948 USGS map. Purple arrow indicate terminus locations. Former Plateau Glacier (P).
In 1948 Burroughs Glacier has an area of 22 km² and is 12.5 km long, with the crest of the glacier at 425 m. In 1986 Burroughs Glacier has an area of 12.5 km² and has no snowcover by mid-summer. The glacier terminates in proglacial lakes at both the north and south terminus and is 9 km long, purple arrows indicate 1948 terminus. In 2004 Burroughs Glacier again lacks any snowcover. The southern terminus has retreated 2.2 km from the lake, and the northern terminus has retreated into a second lake basin. The glacier is 6.3 km long, half of its length in 1948. In 2010 snowcover is lacking and retreat has continued shrinking the glacier to 5.4 km in length. The glacier was assessed with an area of 2.9 km² and a median elevation of 313 m (1025 feet) by GLIMS, in 2010. In 2013 the glacier lacks snowcover in this September Landsat image even though snow has returned to the surrounding mountains. This indicates how far below the snowline the glacier lies. Portions of a glacier are supposed to be the first locations that receive snowcover. The terminus has continued to retreat and the glacier was 4.6 km long in 2013. The northern terminus was retreating into a third basin of the proglacial lake. By 2018 the glacier area has been reduced to 2.7 km², then 1.5 km² in 2022 and 1.2 km² in 2024., 5.5% of its area remaining from 1948, 10% of its area from 1986 and 1% of the 1892 area. The length of the glacier in 2024 is 2.3 km, only 50% of the length just a decade ago, and ~20% of the 1948 length.
Thinning of this glacier from 1948-2016 is evident from a comparison of topographic maps. Thinning in remaining glacier are averages 225 m during this period, that is a rate of ~3.3 m/year. Larsen et al (2007) had found a thinning rate of ~3 m/year for the 1948-2000 period. Satellite imagery allows identification of glacier area, which declined at a linear rate from 2004-2024, correlation coefficient of 0.98. This his linear rate indicates the glacier will disappear in 2029 or 2030.
Burroughs Glacier has not been in equilibrium with climate the past century. Its retreat has been hastened by the rising snowline of the last decade note by Pelto et al (2013) on Brady Glacier. This glacier area has declined by 90% since 1986, with volume loss being even larger. Retreat usually increases as elevation declines and as the size of the remnant ice declines. There is no debris cover or persistent snowcover to slow the loss.
Overlay of 1948 (blue labeled contours) and 2014 elevation map (brown labeled contours) for Burroughs Glacier.
Burroughs Glacier area from Landsat and Sentinel images from 2004 to 2024. This is a strongly linear decrease, that projected beyond 2024 hits bottom in 2029 or 2030.
2004 Landsat image of Burroughs Glacier. The red arrow marks the west margin in 1986 and the yellow arrow the east margin.
2010 Landsat image of Burroughs Glacier. The red arrow marks the west margin in 1986 and the yellow arrow the east margin.
2013 Landsat image of Burroughs Glacier. The purple arrows mark the 1948 margin, red arrow the west margin in 1986 and the yellow arrow the east margin in 1986, pink arrows the 2013 margin.
2022 false color Sentinel image of Burroughs Glacier. The ice is dirty but not debris covered at this point, glacier area 1.5 km2.
2018 and 2024 false color Sentinel image of Burroughs Glacier. The ice is dirty but not debris covered. Area declined from 2.7 km2 to 1.2 km2
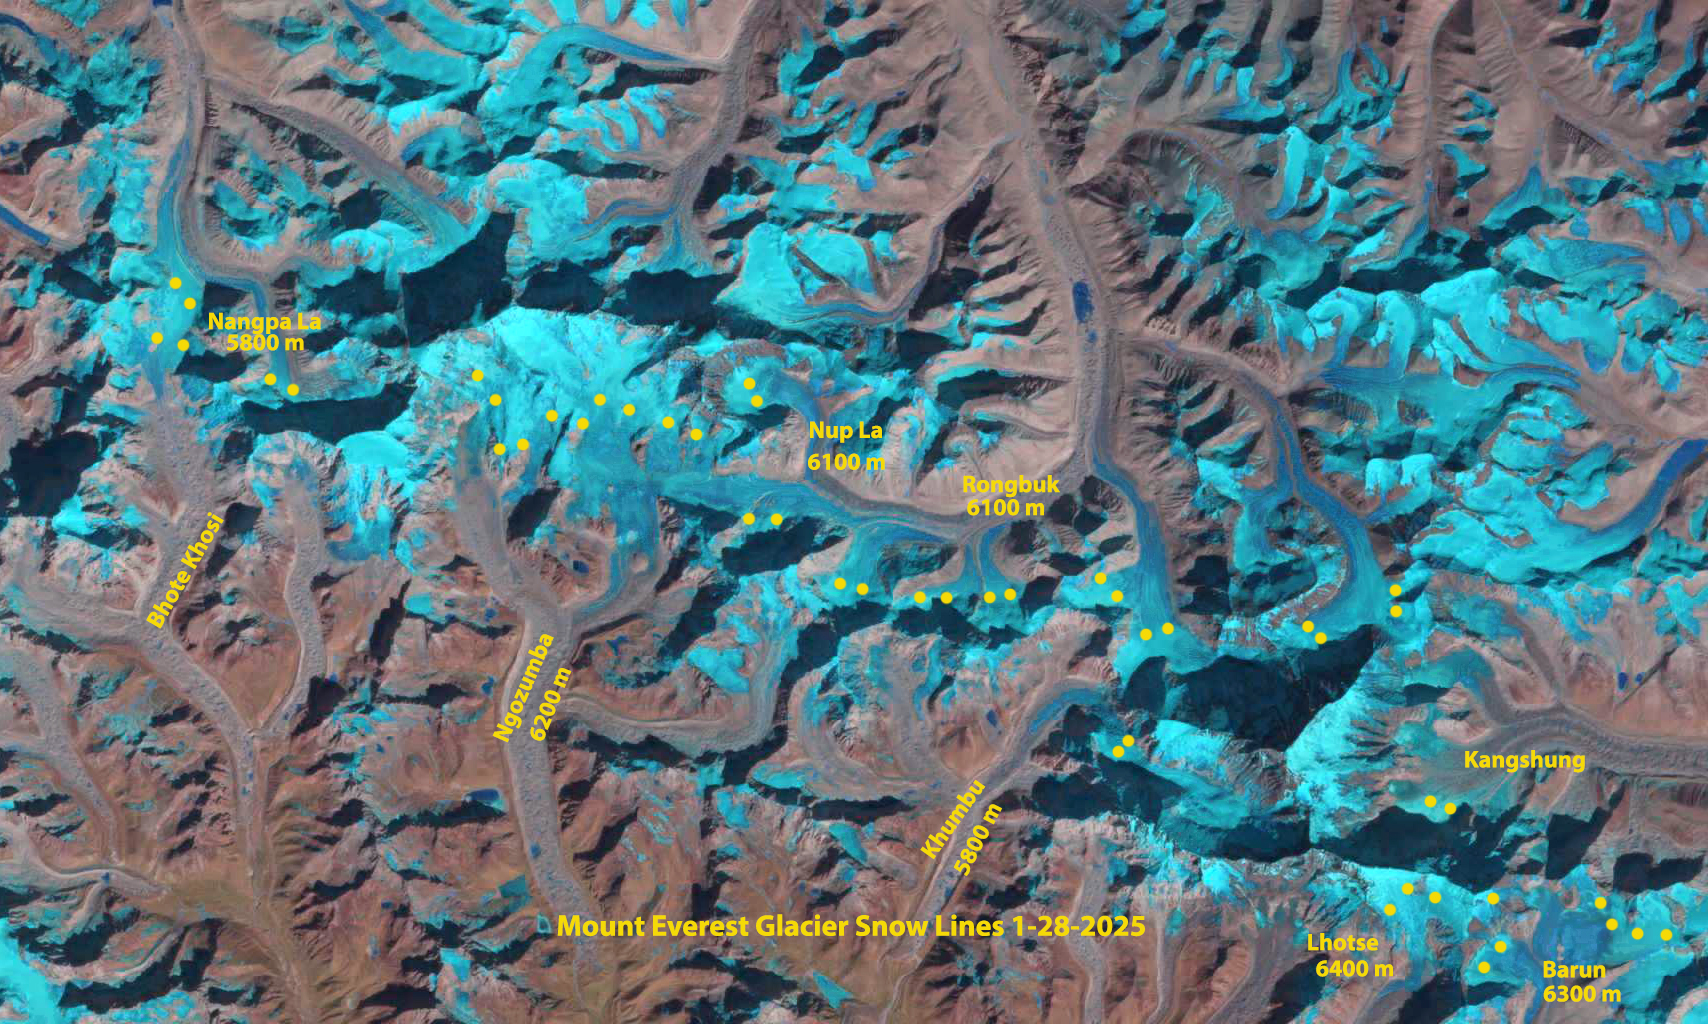
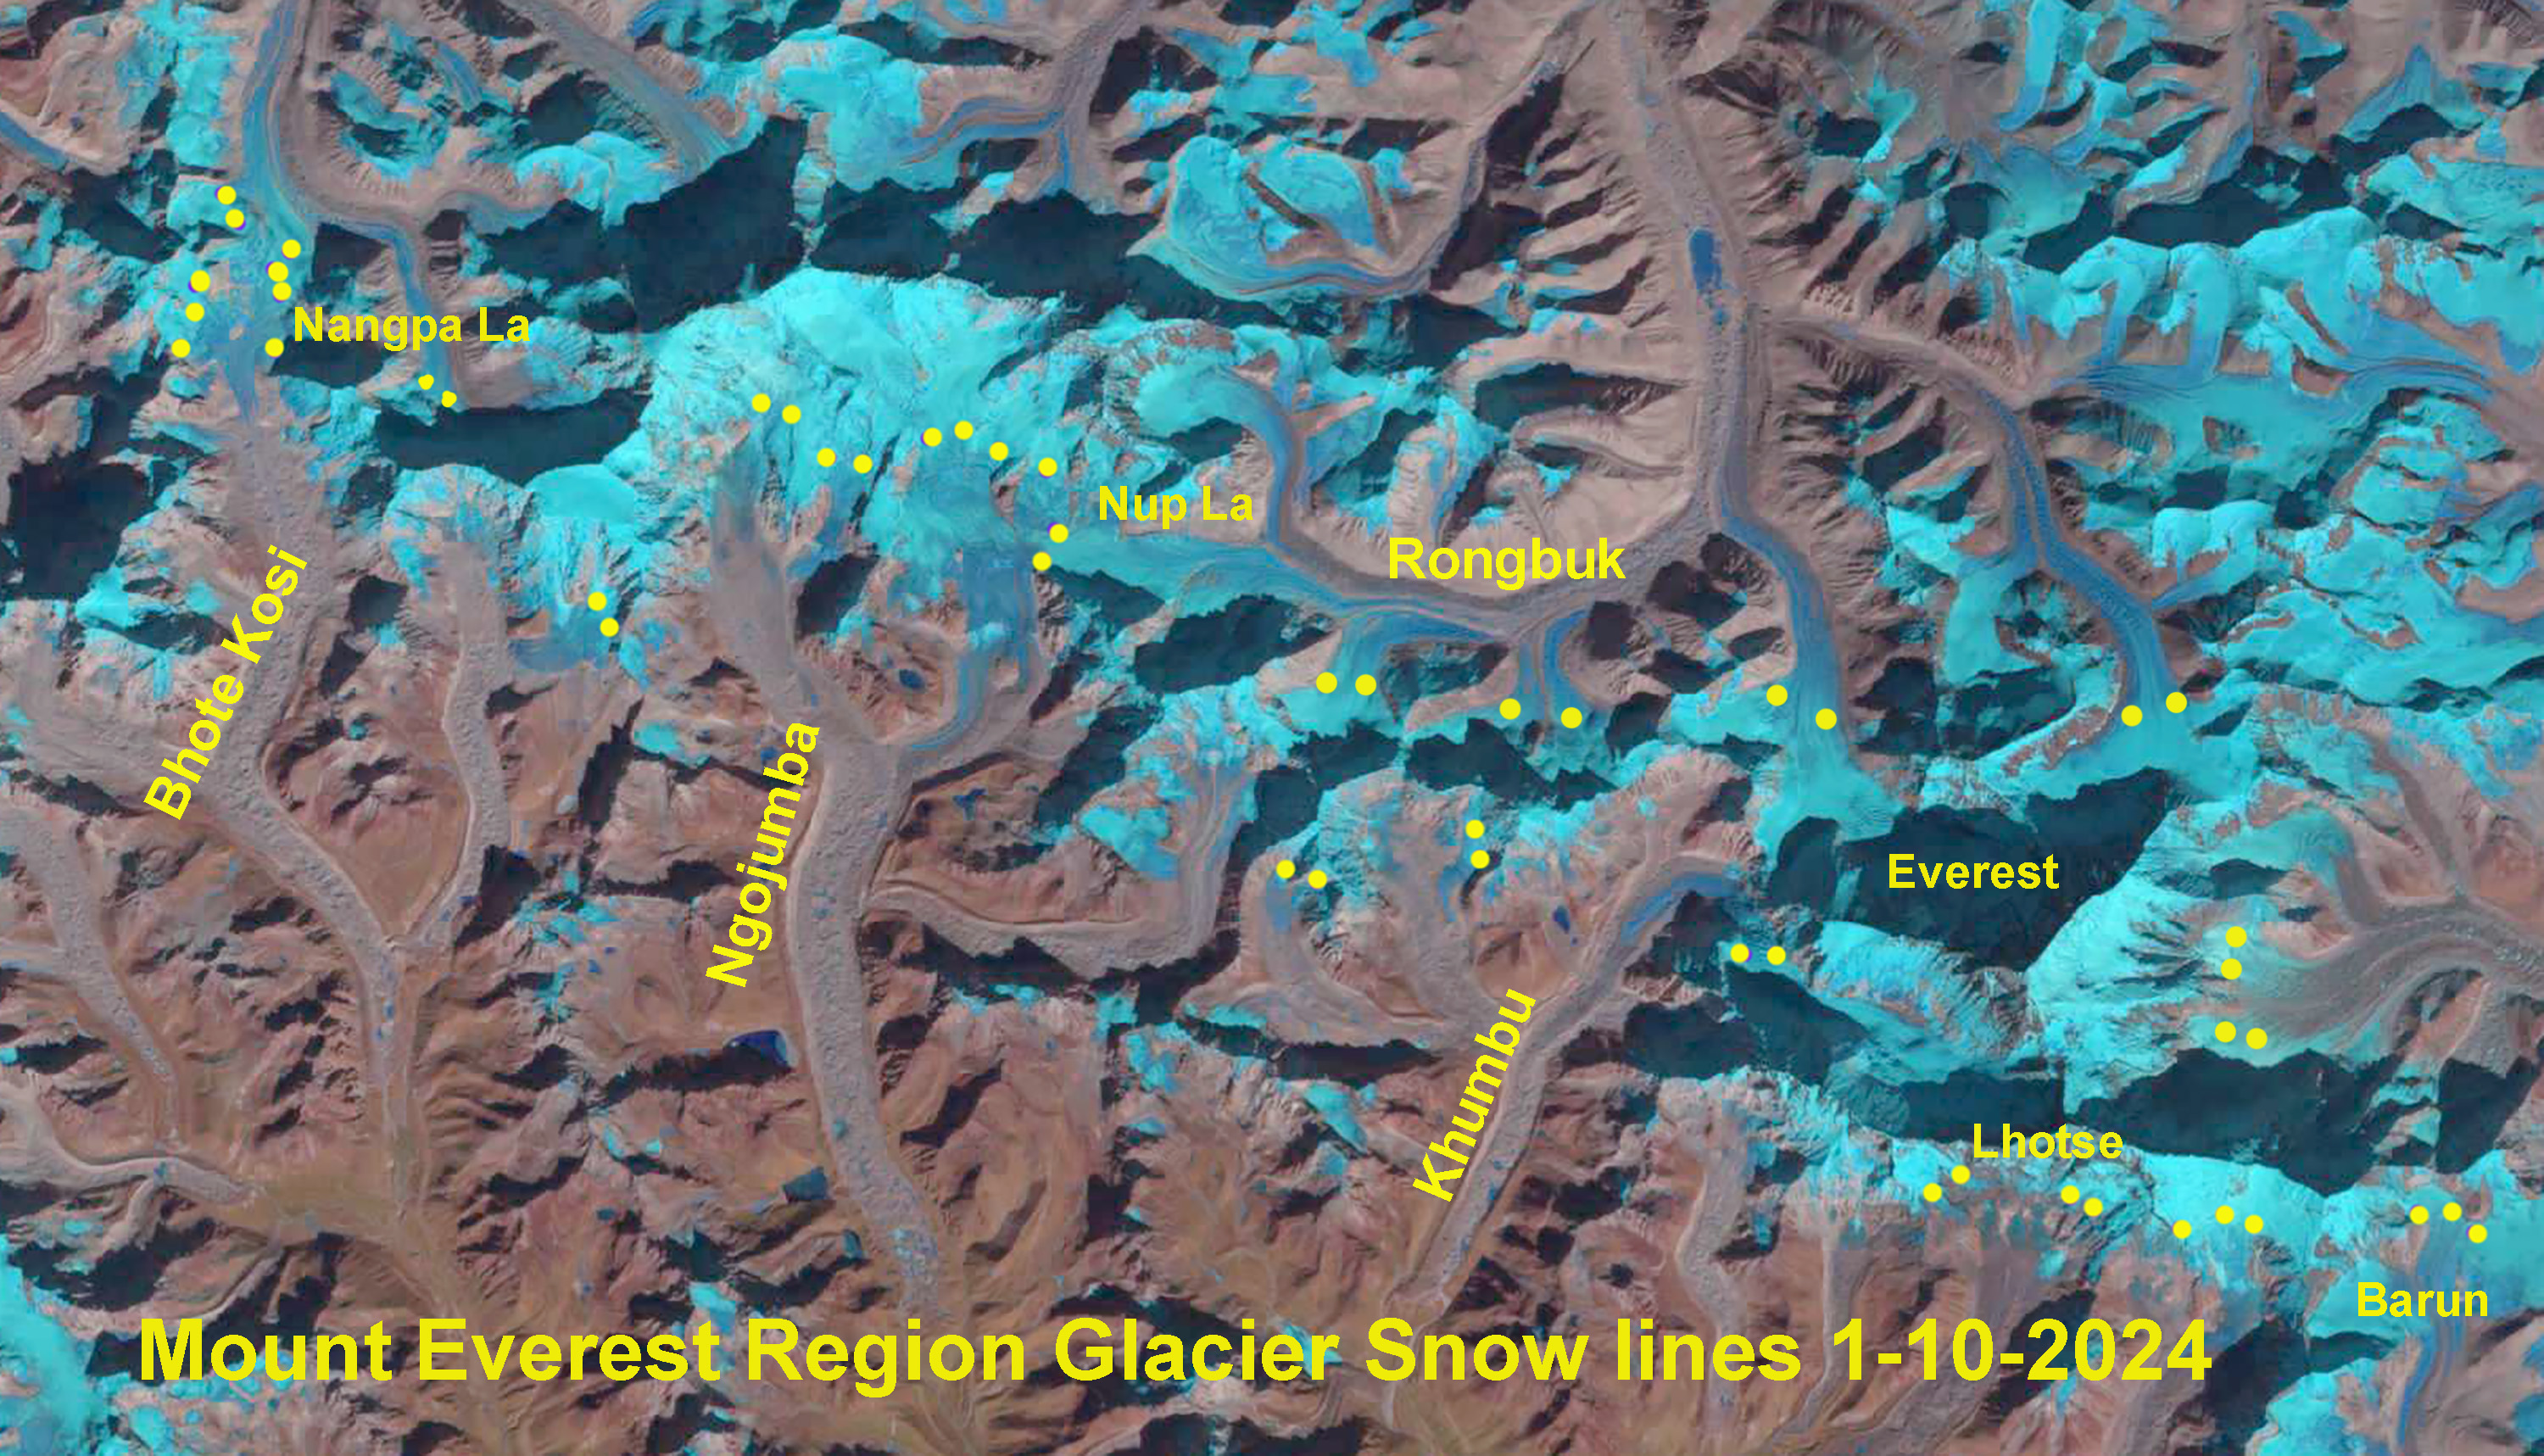
The snow line on Mount Everest Region glaciers on Jan. 28, 2025 indicated by yellow dots on the Landsat image. Note t Nup La-5900 m is snow free. The average snow line is 6100 m, 150 m higher than on Dec. 11, 2024.
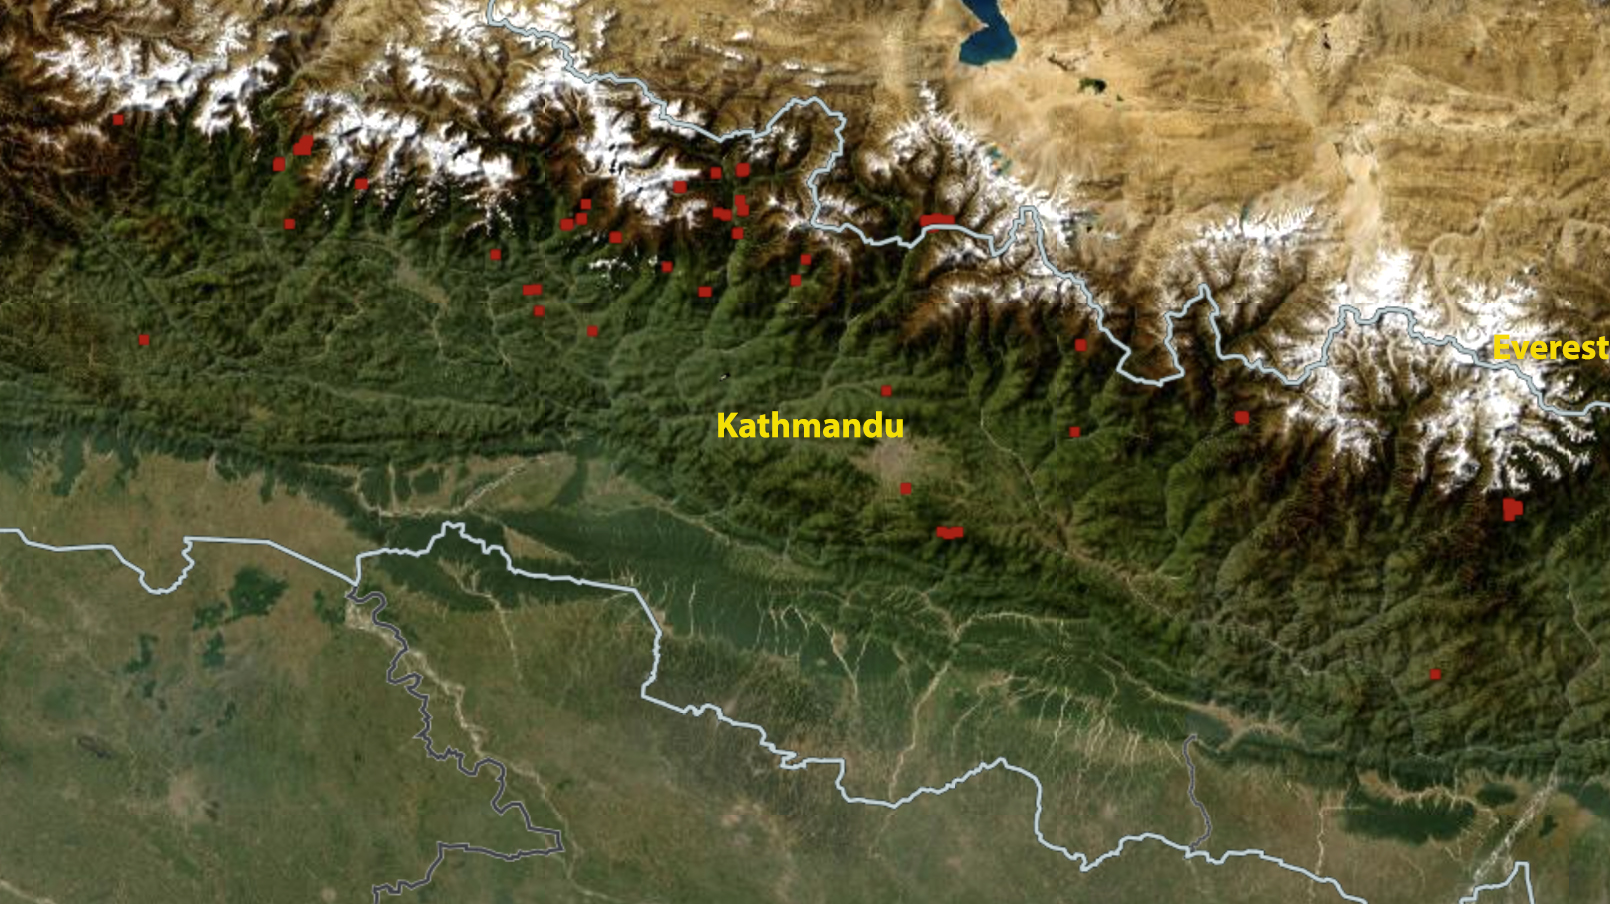
This is a update to a previous post examining persistent high snow lines through the winter on Mount Everest Region glaciers. Here we examine imagery from October 2023 through early January 2025 illustrating the rise in snow line through January in both 2024 and 2025. The persistent high snow line during winter indicate a lack of snow accumulation during the winter season. This is a dry season in the Himalayan region, yet typically an extensive snow cover develops, though not particularly deep. A combination of warmer and drier conditions have been more prevalent in recent winters including 2021, 2023, 2024 and 2025 (Kathmandu Post, 2025). These conditions are driving both reduced snow cover, higher elevation snow lines and increased forest fires (Nepali Times, 2025).
NASA FIRMS view of fire locations in Nepal on Jan. 23, 2025, each red dot is a fire, note most are at higher elevations including several near the Everest region.
There have been a few small snow events early in each winter, but the snow cover does not persist indicating that ablation has continued even above 6000 m on Mount Everest. Snow cover loss during winter at these altitudes is primarily the result of sublimation , with losses observed up to 2.5 mm per day (Tenzing et al 2023).
The 2024 winter season was different than the high snow lines in 2020/21 that resulted from extraordinary January heat wave, as there was not a noteworthy heat wave (Pelto et al 2021). Instead a lack of any significant precpipitation was critical with less than 25 mm of precipitation at Everest Base Camp from Jan.1-March 31, 2024 and above normal temperatures for significant periods. The high glacier snow lines persisted into the monsoon season of 2024. The post-monsoon season in 2024 was warm and wet, leading to above average snow line elevations in November 2024.
In December 2024, Nepal was 20-25% of normal with drier conditions in the east. This accompanied above average temperatures, though not as high as in December 2023, leading to extreme drought in several provinces including Koshi Province (Nepal DHM). January, 2025 has continued to be dry, with consistently warm conditions. This has enabled high glacier snow lines to persist and rise from early December into early February, 2025.
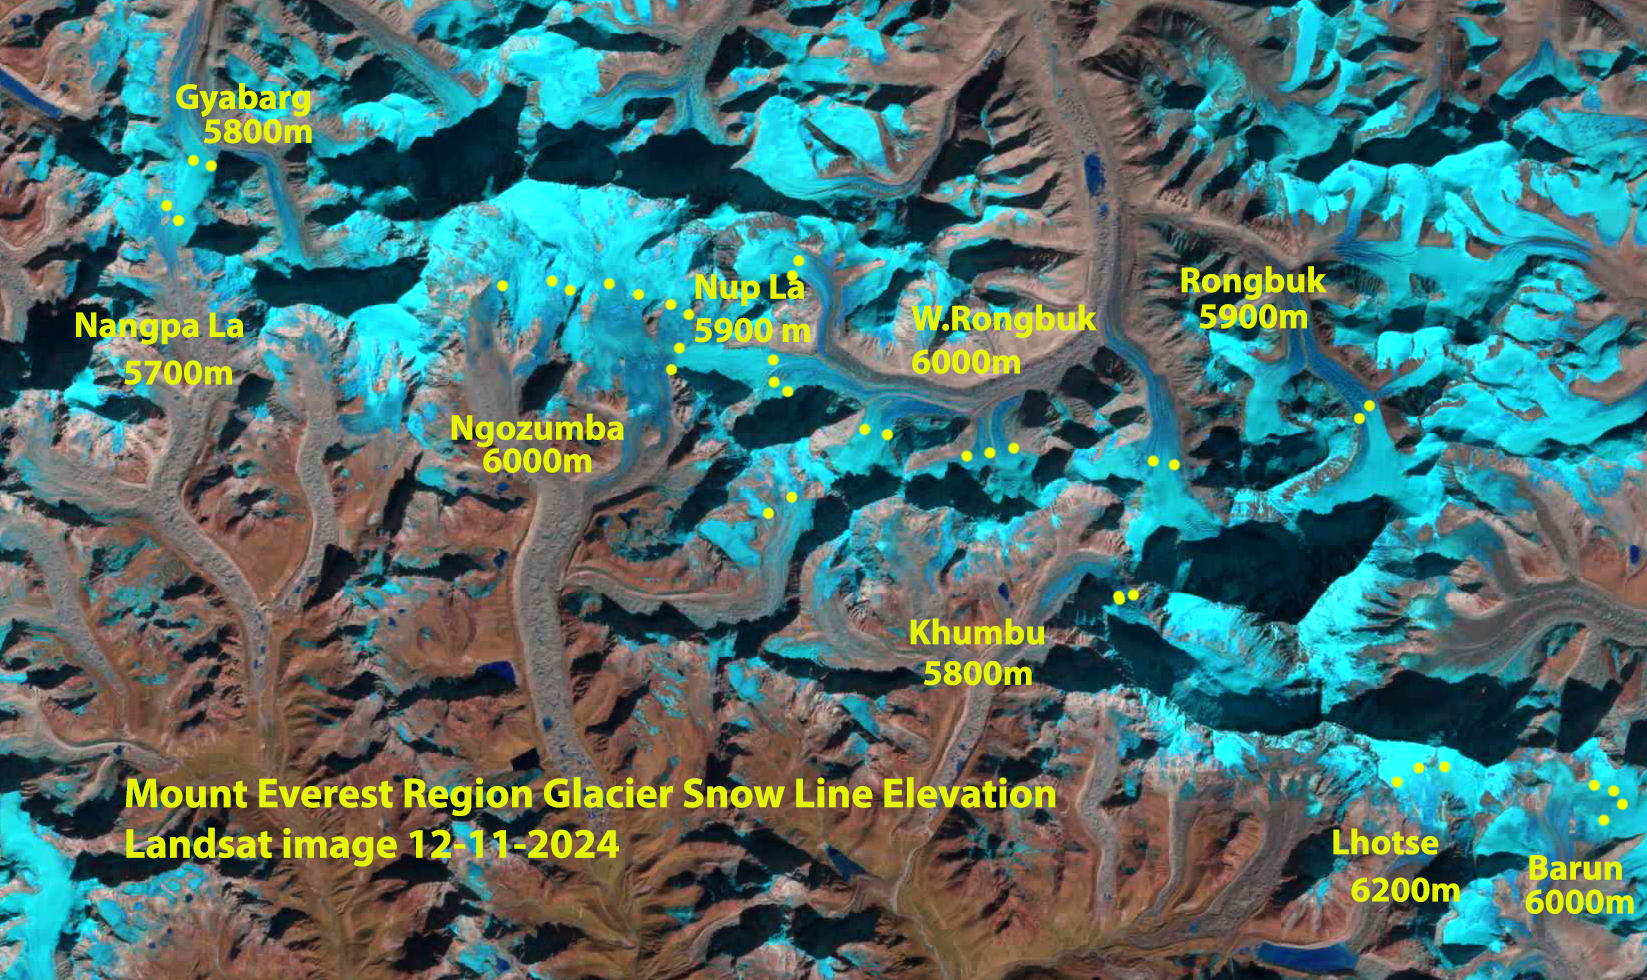
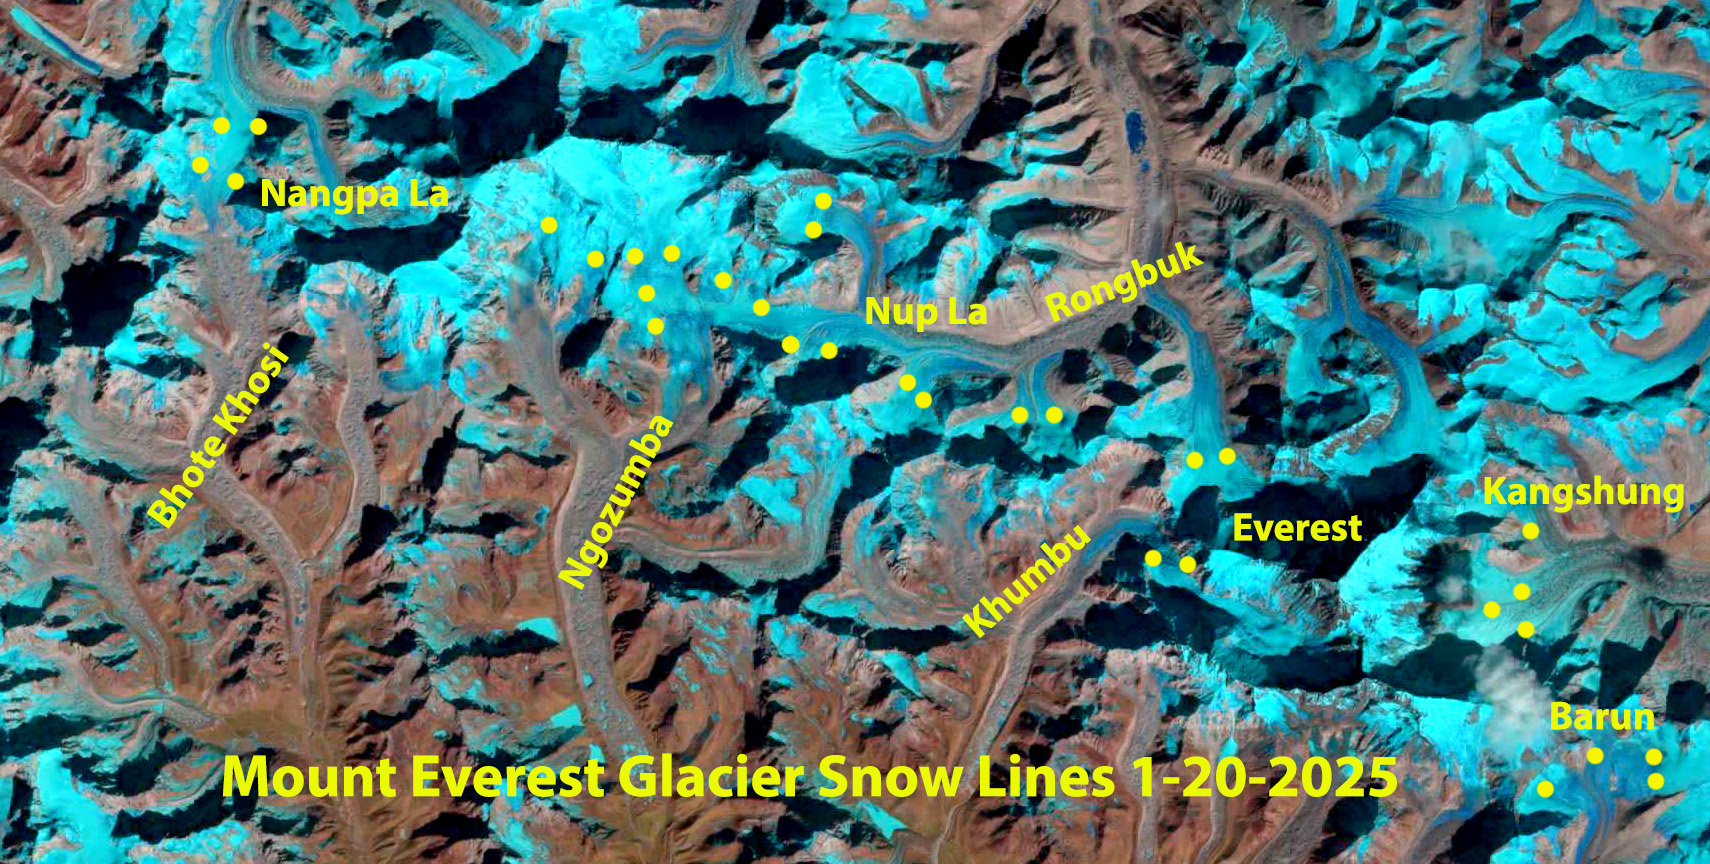
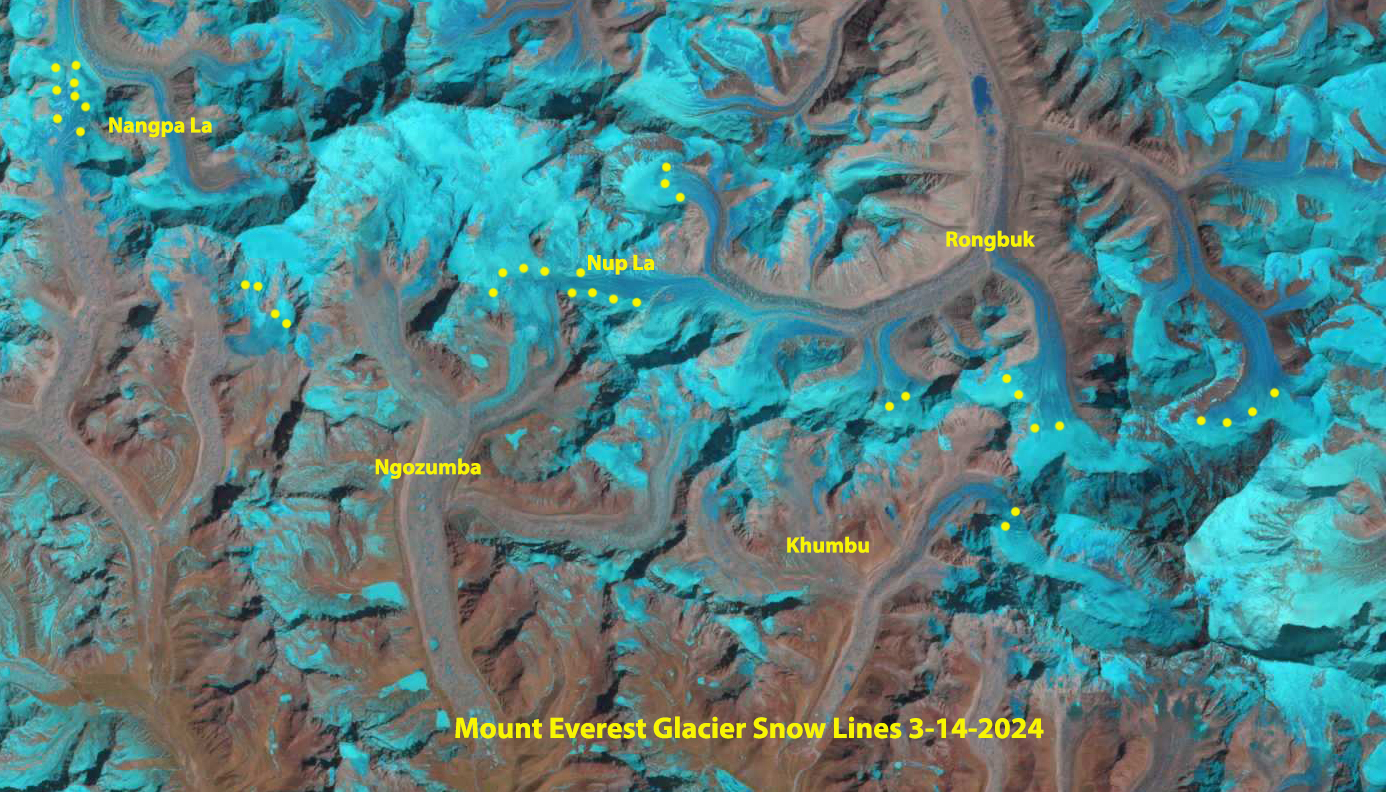
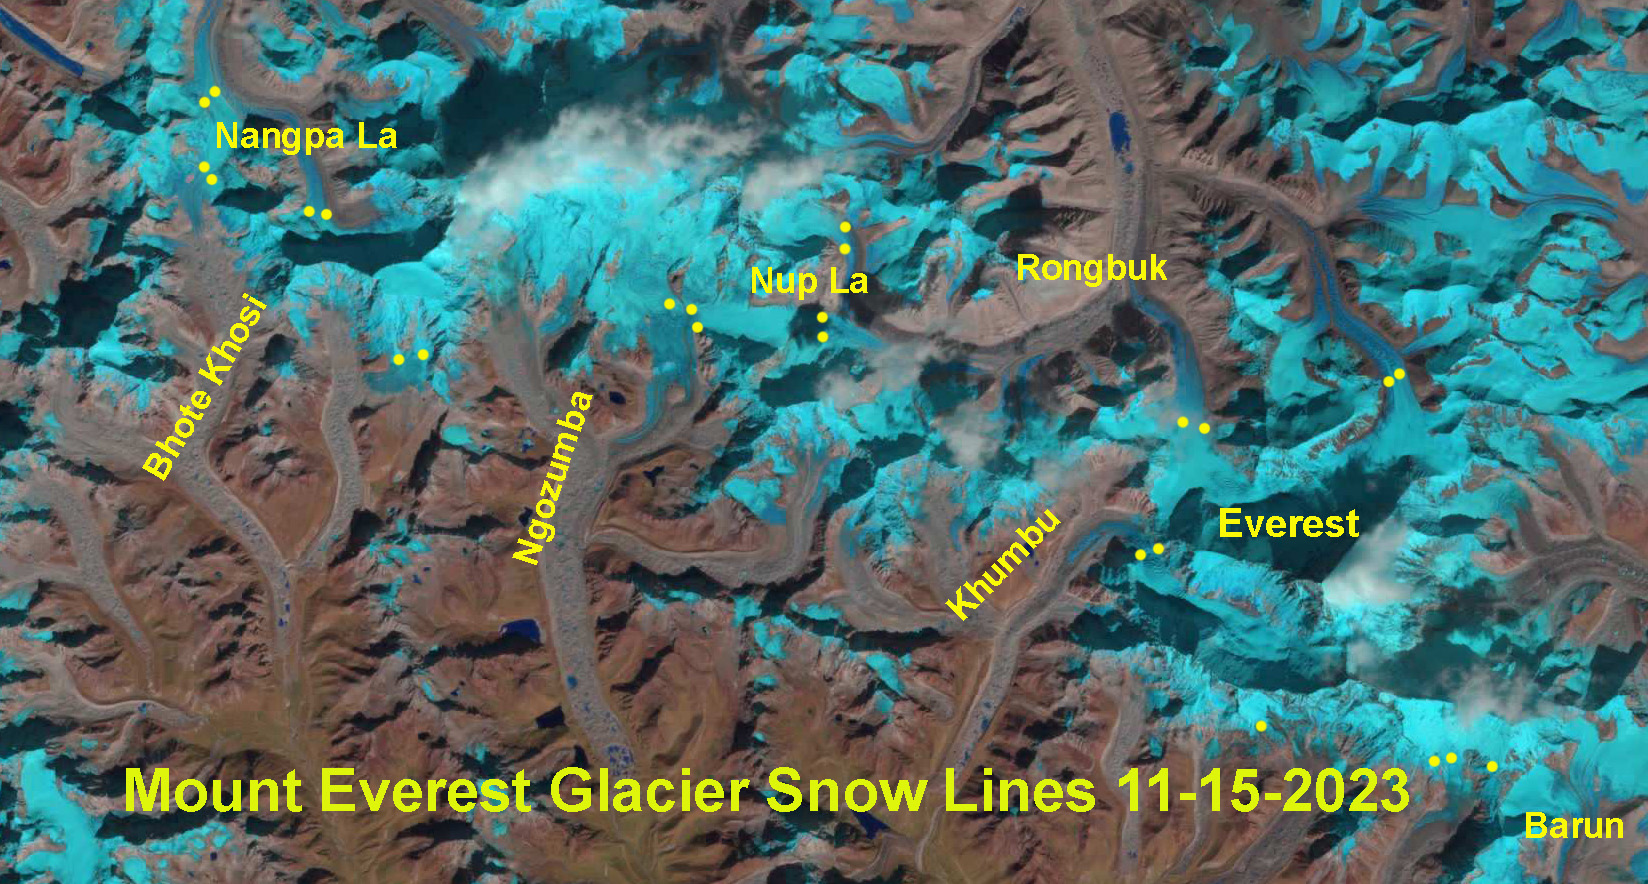
The snow line on Mount Everest Region glaciers on Dec. 11, 2024 indicated by yellow dots on the Landsat image. Note that Nangpa La and Nup La-two high passes (5800-5900 m) are snow covered. The average snow line is 5950 m.The snow line on Mount Everest Region glaciers on Jan. 20, 2025 indicated by yellow dots on the Landsat image. Note that Nangpa La and Nup La-two high passes (5800-5900 m) both have a narrow band of snow cover. The average snow line is 6050 m.The snow line on Mount Everest Region glaciers on May 1, 2024 indicated by yellow dots on the Landsat image. Note that Nangpa La and Nup La-two high passes (5800-5900 m) are both snow free. The average snow line is 6050 m.The snow line on Mount Everest Region glaciers on March 14, 2024 indicated by yellow dots on the Landsat image. Note that Nangpa La and Nup La-two high passes (5800-5900 m) are both snow free. The average snow line is 5950 m.
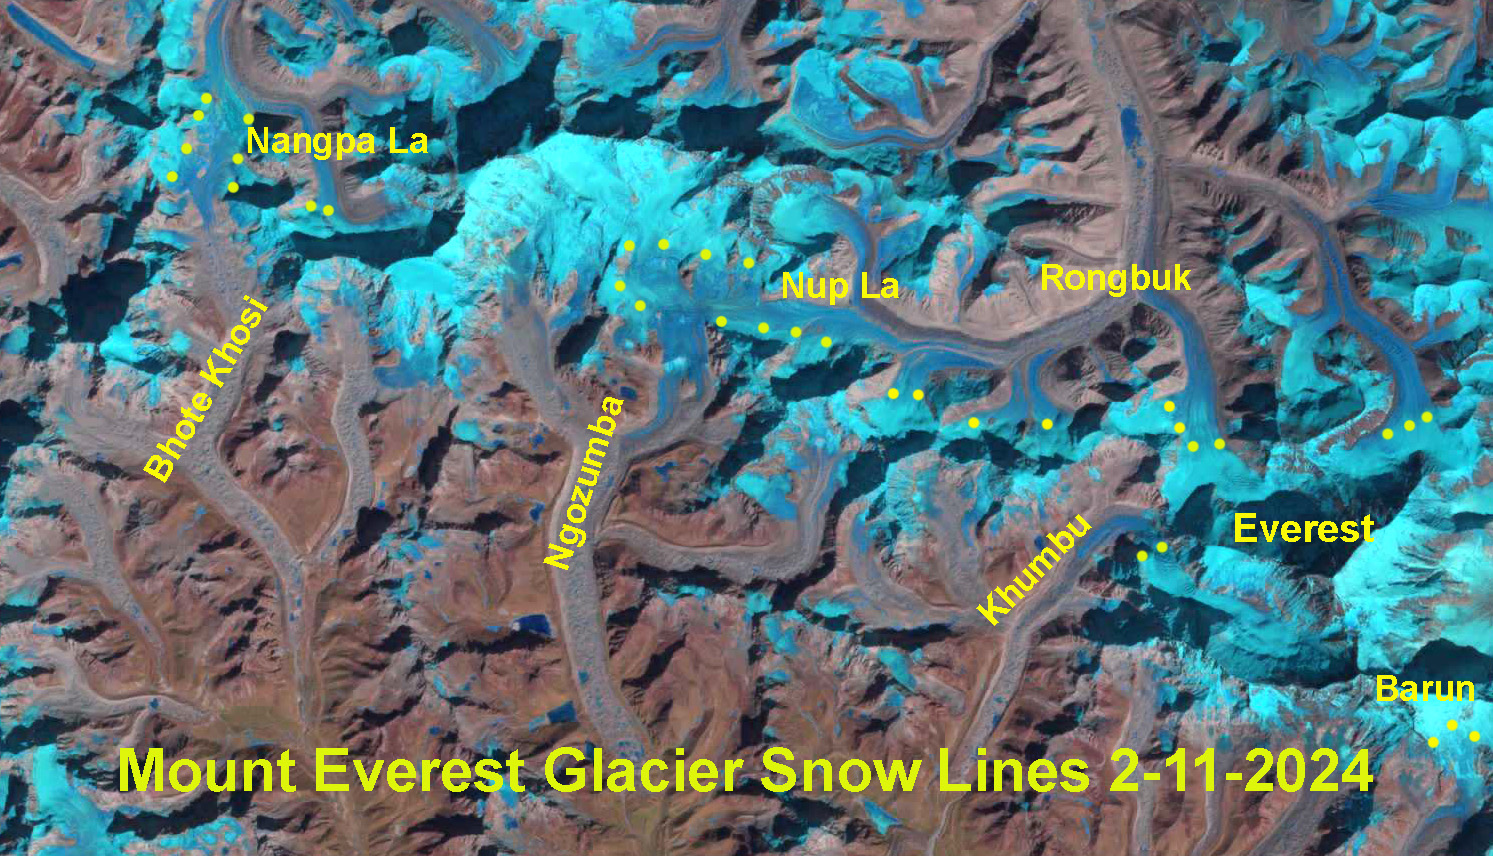
The snow line on Mount Everest Region glaciers on Feb. 11, 2024 indicated by yellow dots on the Landsat image. Note that Nangpa La and Nup La-two high passes (5800-5900 m) are both snow free. The average snow line is 6000 m.
The snow line on Mount Everest Region glaciers on Jan. 10, 2024 indicated by yellow dots on the Landsat image. Note that Nangpa La and Nup La-two high passes are both snow free. The average snow line is 6000 mThe snow line on Mount Everest Region glaciers on Nov. 15, 2023 indicated by yellow dots on the Landsat image. Note that Nangpa La and Nup La-two high passes are both snow covered. The average snow line is 5800 m.The snow line on Mount Everest Region glaciers on Oct. 30, 2023 indicated by yellow dots on the Landsat image. Note that Nangpa La and Nup La-two high passes are both snow covered. The average snow line is 5700 m.
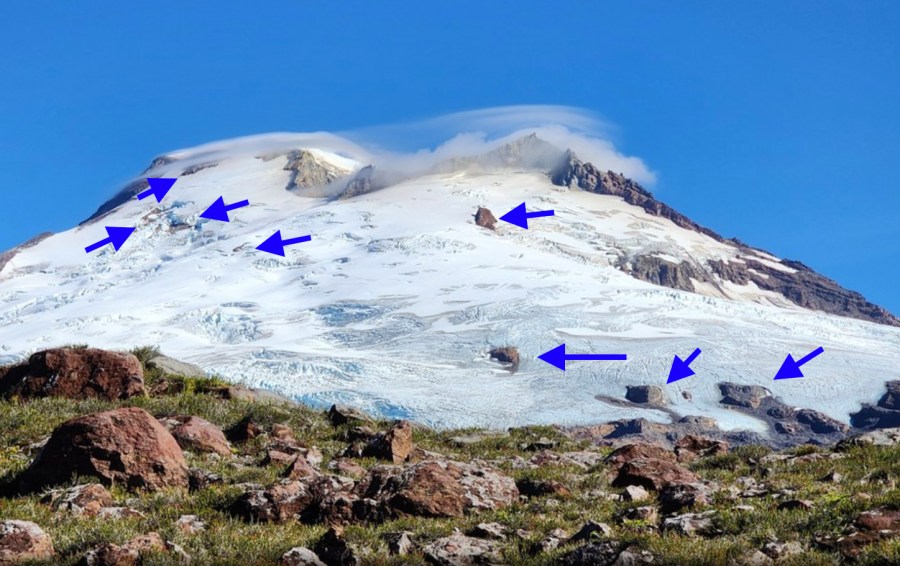
Recent glacier thinning due primarily to warm summers has exposed new bedrock knobs on upper portions of Deming, Easton and Squak Glacier on Mounty Baker, Washington
Find a location where temperatures are cold for at least 7 months of the year. This location also needs to have substantial snowfall and ideally where addtiional snow is added via avalanches or wind depostion. With these ingredients on hand, let stand for a few decades, while the snow accumulates to a thickness of at least 20 m. A key step in the recipe is the transformation of snow to ice under its own weight and with some meltwater percoloation and refreezing. Unlike bread dough you do not need stir or kneed during this period. Once there is a volume . For the glacier to persist the glacier must retain accumulation across a significant portion of its surface by the end of summer. To maintain its size we have observed this percentage to vary from 50-70% on North Cascade glaciers. The lack of a persistent accumulation zone will lead to loss of that glacier. of 500,000 m3 you are either a glacier or at the threshold of being a glacier depending on how steep the underlying slope is. Unlike rolling out a pie crust, this does not need to be an even thickness, or made on a flat surface. As the glacier matures it will develop crevasses indicating movement, which is an essential characteristic of a glacier. It is not a passive feature, its movement allows it to begin to sculpt its landscape.
Current Glacier Loss in North Cascade Range, Washington
Many centuries or millenia later, the glacier has become a critical part of the landscape. Yet, changing climate is leading to the loss of many. In the North Cascades glaciers have been losing close to 1% of their volume annually over the last 40 years, with the rate rising to over 2% in the last decade. The glaciers cover 200 km2 almost all of which are in steep high elevation Wilderness areas not proximate to roads. In 2010 we noted that 2/3 of North Cascade glaciers could not survive current climate. Today this percentage has increased to more than 90%. There are 31 glaciers in the range that I completed observations on in the 1980s that are now gone. Our annual field expedition has noted the glaciers losing ~1.5 m of thickness annually in the last decade.
Deglaciated area below Easton Glacier, Mount Baker, WA in 2023.
Are there any Preservatives we can add to the Recipe?
What would it take to preserve the Easton Glacier in the North Cascades?
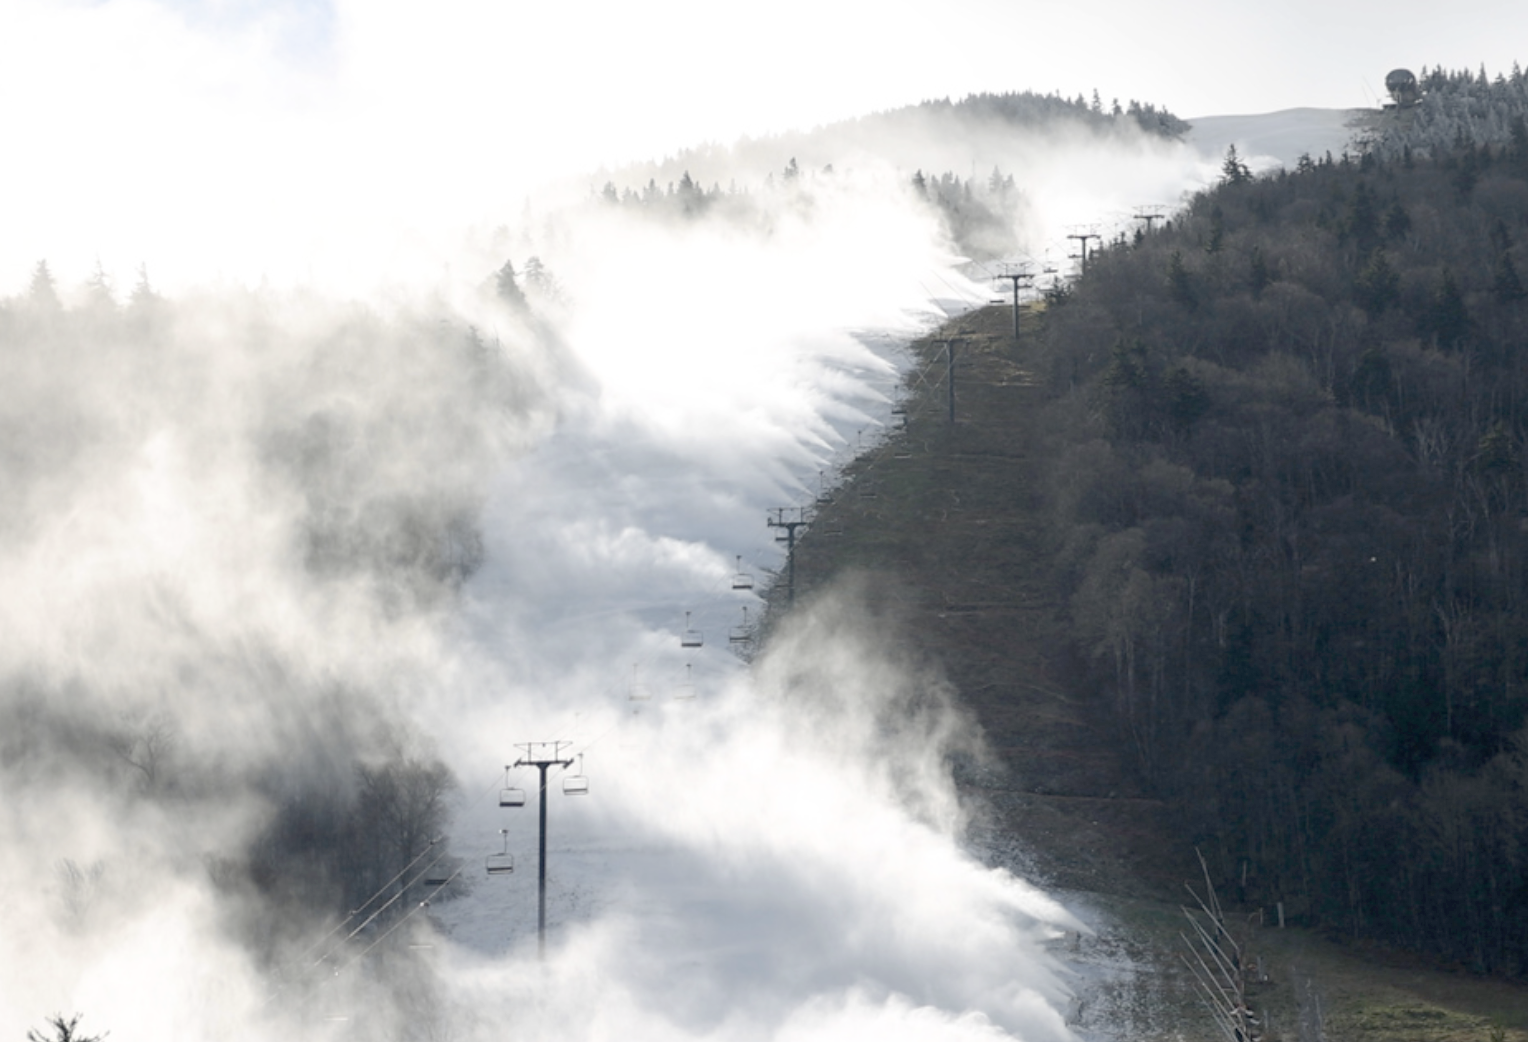
The largest snowmaking operation in North America is at Killington Ski Area, VT. At maximum capacity they can convert 35,000 m3 of water into snow per day. Given that Easton Glacier has an area of 2.5 km2 and has been losing 1.5 m water equivalent thickness per year, 3.75 million m3 of water equivalent snow has to be produced.This would take 108 days at maximum capacity of the more than 2000 snow guns. This ignores enviornmental laws and the logistics of water supply, piping, snow gun placement and electricity. This all in an environment of harsh weather with avalanches and crevasses.
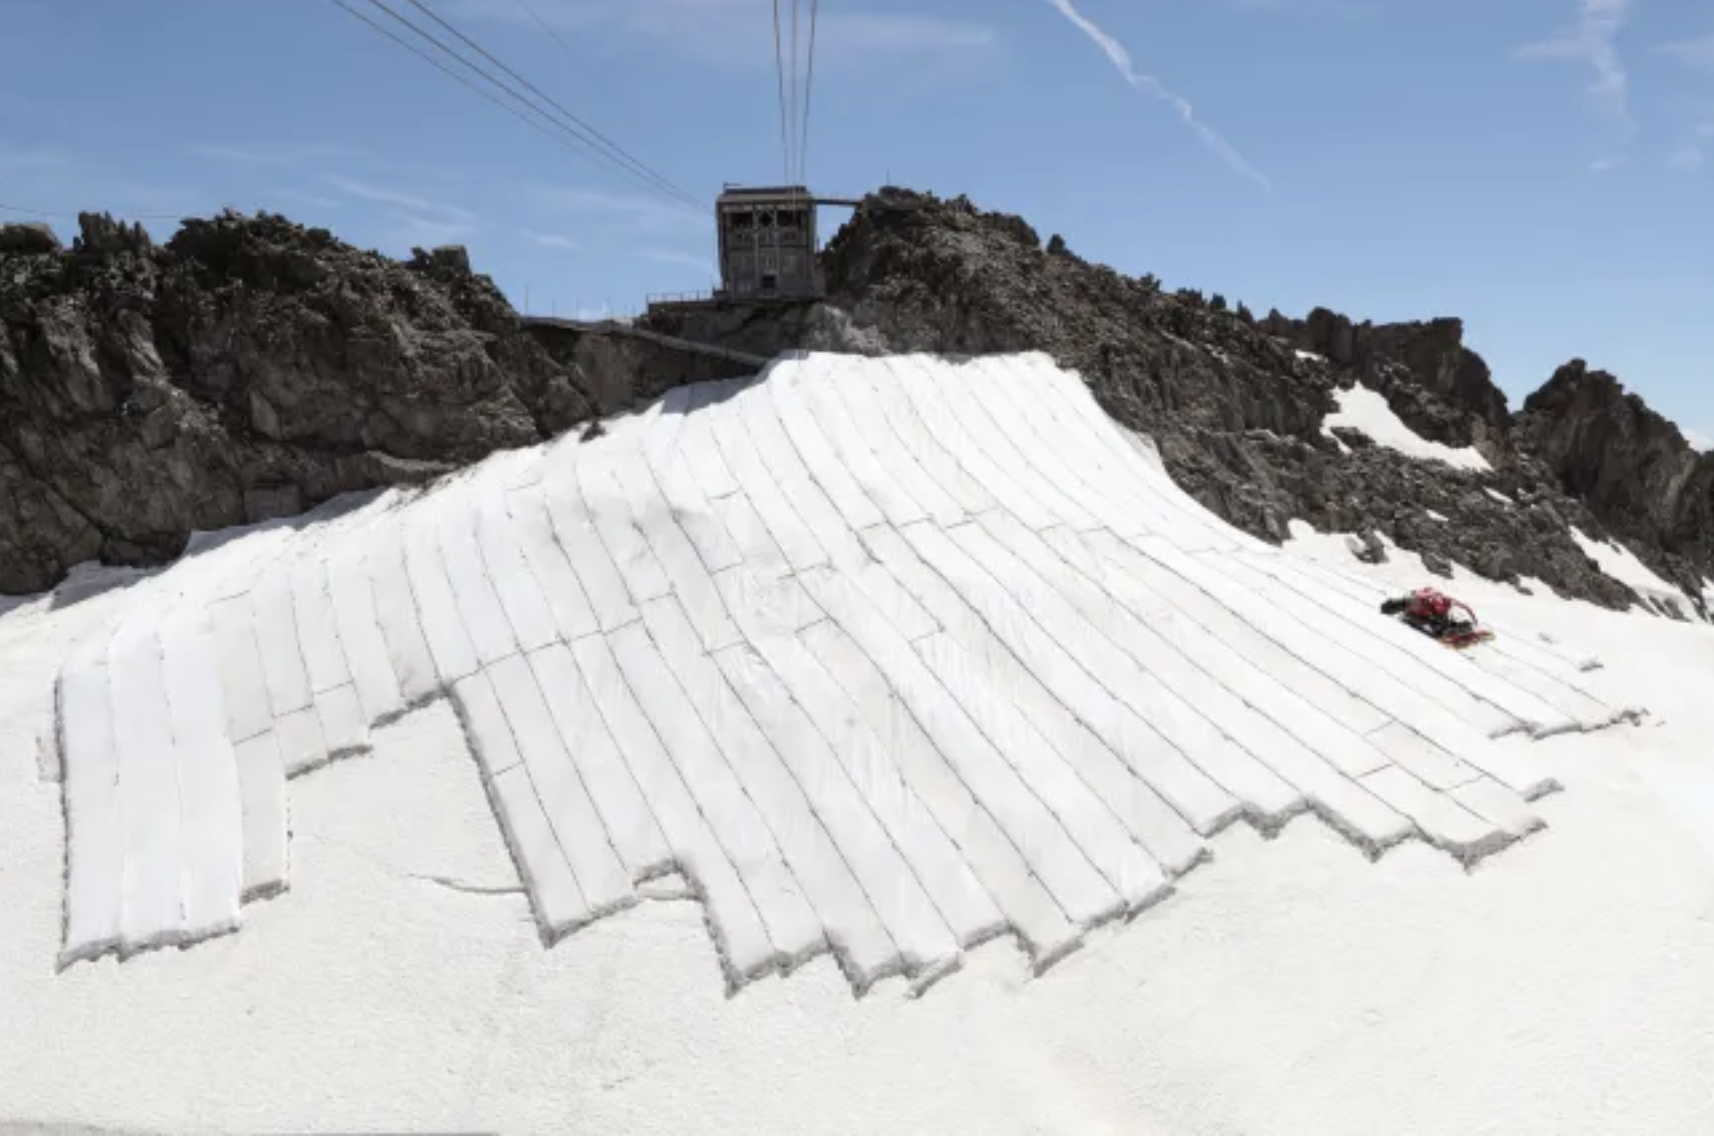
To cover the glacier with geotextiles during the summer, requires 2.5 million square meter of material that would be to installed each summer and removed each winter to allow accumulation, of course summer recreation would not be practical on the glacier. The geotextiles do not last long in these conditions and cost ~$2 per square meter. How to anchor these in place and connect on a crevasse glacier would be very difficult, which is why usually only a portion of the glacier near the terminus is covered, which does not help the overall situation of glacier loss.
There are many more glaciers in this range and around the world where this same confounding logistical challenges make any artificial attempts at preservation ridiculous beyond a few isolated glaciers that are already close to existing infrastructure.
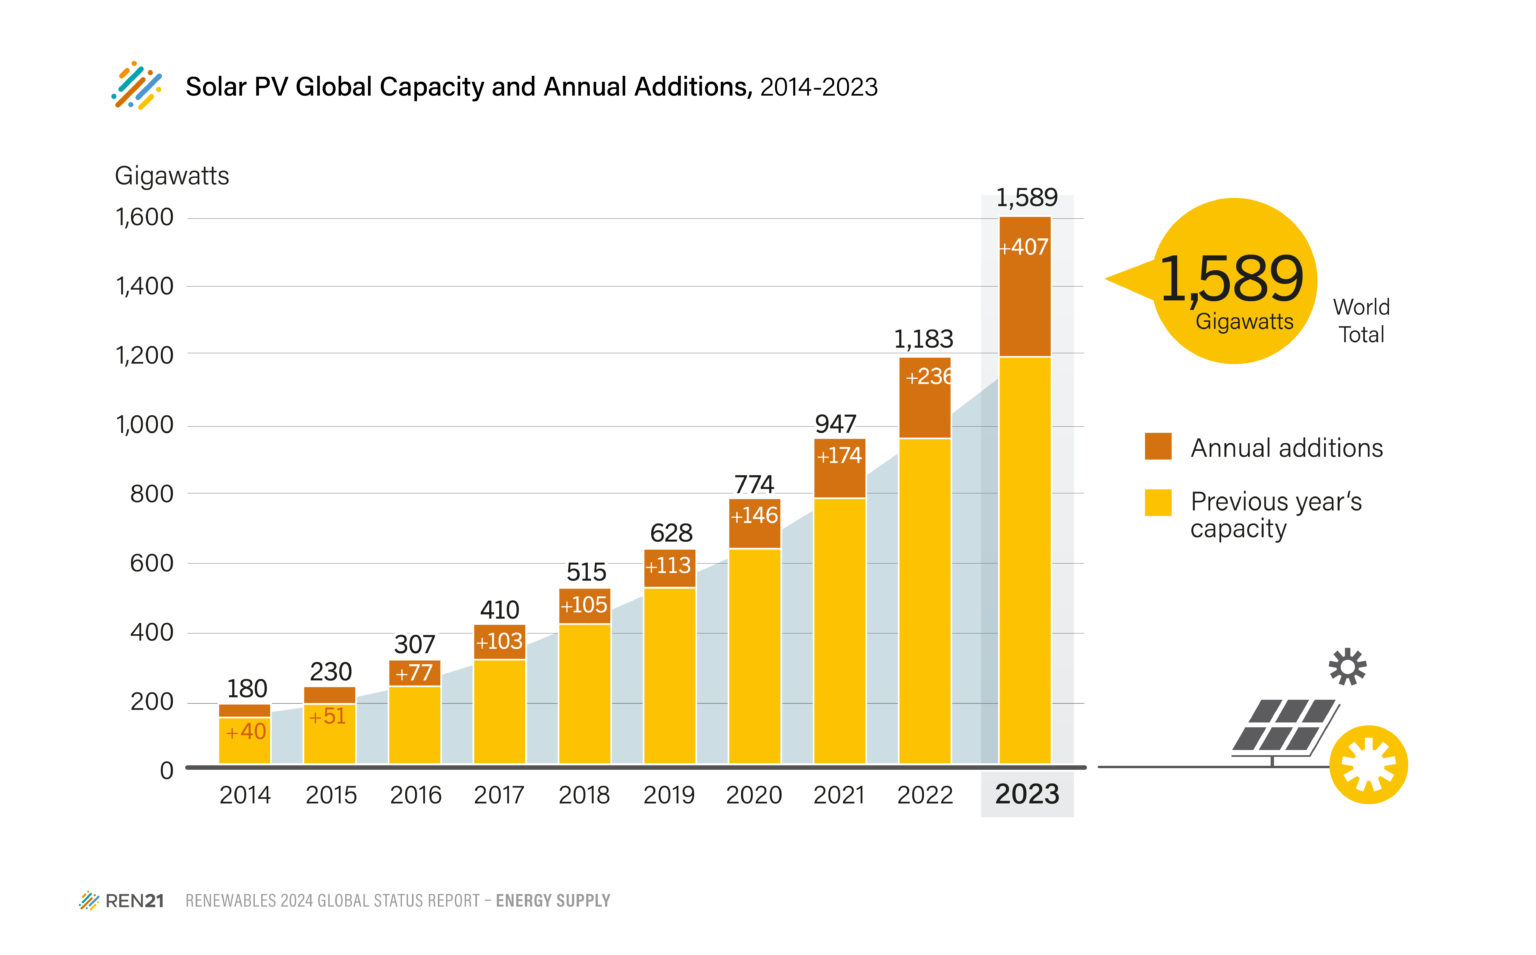
When I began this work in 1984 solar power and wind power did not exist, these are not the only renewable sources of power, and just one of many approaches to reducing CO2 emissions, but they are illustrative of rapid growth from insignificance. The Renewalbes 2014 Global Status Report and the Renewables 2024 Global Status Reports provides measures of renewaable energy production over the last decade. Global capacity for Solar Photovoltaic energy production has risen from 4 GW in 2004 to 190 GW in 2014 and then to 1600 GW in 2023. Global Capacity for Windpower has risen from 48 GW in 2004 to 370 GW in 2014 and in 2023 was 1020 GW. In 2023 alone over 500 GW was added to these two sources combined. See below for charts from this report on increased capacity. This is a preservative under development that can work with continued emphasis and in concert with other items such power grid infrastructure improvement and electric/hybrid automobile manufacturing expansion.
Steffen Glacier calved off the Z group of icebergs at start of December following on a March prodution of X and Y bergs and a December-February 2023/24 breakoff of A,B,C. The Z icebergs have an area of 3 km2, false color Sentinel image.
Steffen Glacier is the largest south flowing outlet of the 4000 km2 Northern Patagonia Icefield (NPI). On December Dec. 6, 2023 the terminus tongue has a narrow unsupported section that appears poised to calve (C). By Dec. 26, 2023 the glacier has calved berg C (0.4km2 ), joining other large bergs remaining from previous years D, E and F. Two more pieces A and B appear poised to calve. By Feb. 9 2024 berg B had calved, and by Feb. 24 berg A had calved, together they are 0.3 km2. On April 14 two more large bergs X and Y have calved from the terminus. Berg X is the largest of the year at 0.6 km2, berg Y is 0.2 km2 . Terminus retreat from Dec. 2023-April 2024 is 1.5 km. In noted in April that the terminus tongue was narrow and unsupported (Pelto, 2024) , indicating that more large icebergs should be expected in the 2025 summer season, and in December this happened releasing several icebergs Z1, Z2 and Z3 with a combined area of 3 km2 The glacier retreated 2.6 km as a result of this calving event.
Steffen Glacier in 2024 False Color Sentinel images illustrating calving events yielding bergs A,B,X and Y that have a combined area of 1.5 km2.Green arrow is Dec. 2023 terminus and yellow arrow April 2024 terminus. Exploradores terminus area on east side collapsing in 2023 and 2024, yellow dots indicate glacier edge, with a melange of bergs beyondin this false color Sentinel image.
Exploradores Glacier is an northern outlet glacier of the Northern Patagonia Icefield. In 2016 Exploradores Glacier had a 12 km2 terminus lobe with a couple of small proglacial lakes with a total area of ~1 km2. The terminus lobe of the Exploradores Glacier is now collapsing, this is a process that has already occurred at Steffen Glacier, San Quintin Glacier and Colonia Glacier. The terminus lobe is relatively stagnant as indicated by the minimal surface slope. The result will be a new substantial proglacial lake. In 2023 and 2024 an active zone of calving has developed on the east side of the terminus, yellow dots, with an area of 2.1 km2. This appears ready to continue expanding west across the glacier tongue expanding this embayment.
Reichert Glacier in false color Sentinel images illustrationg retreat in 2024 to yellow arrows from pink arrows due to calving that also generated many small icebergs.
Reichert Glacier is an outlet glacier of the Northern Patagonia Icefied that retreated 6.7 km from 1987-2015. Then was nearly stationary to 2023, with a 750 m retreat from 2022 to 2024 and an active calving period spring 2024 note new icebergs in the lake. The terminus is retreating into a narrower fjord reach,, with a pinch point 1.5 km behind the terminus, that should provide short term stability.
Mount Everest Region, Nepal glacier snow lines on Sentinel image from 11-12-2024. Mean elevation of snow lines is 5800 m.
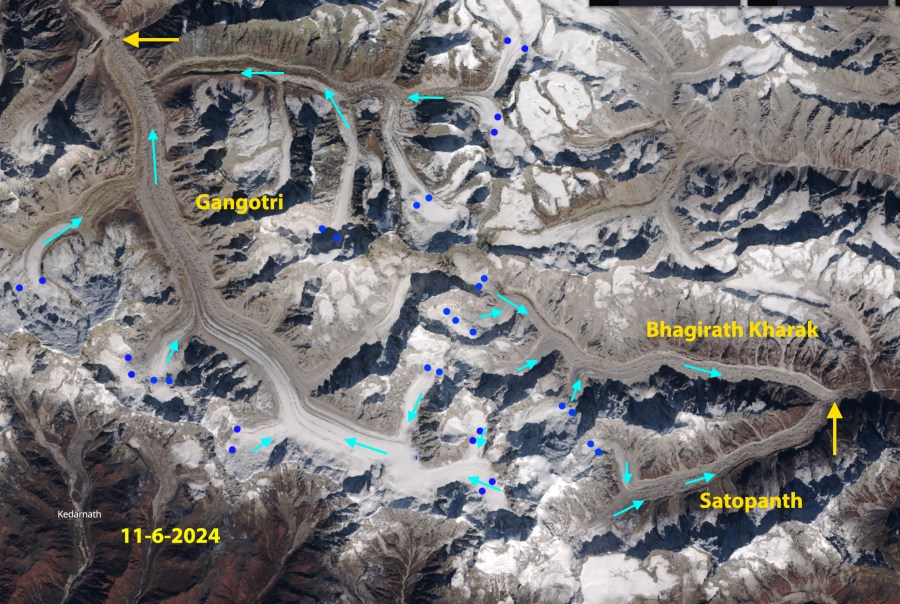
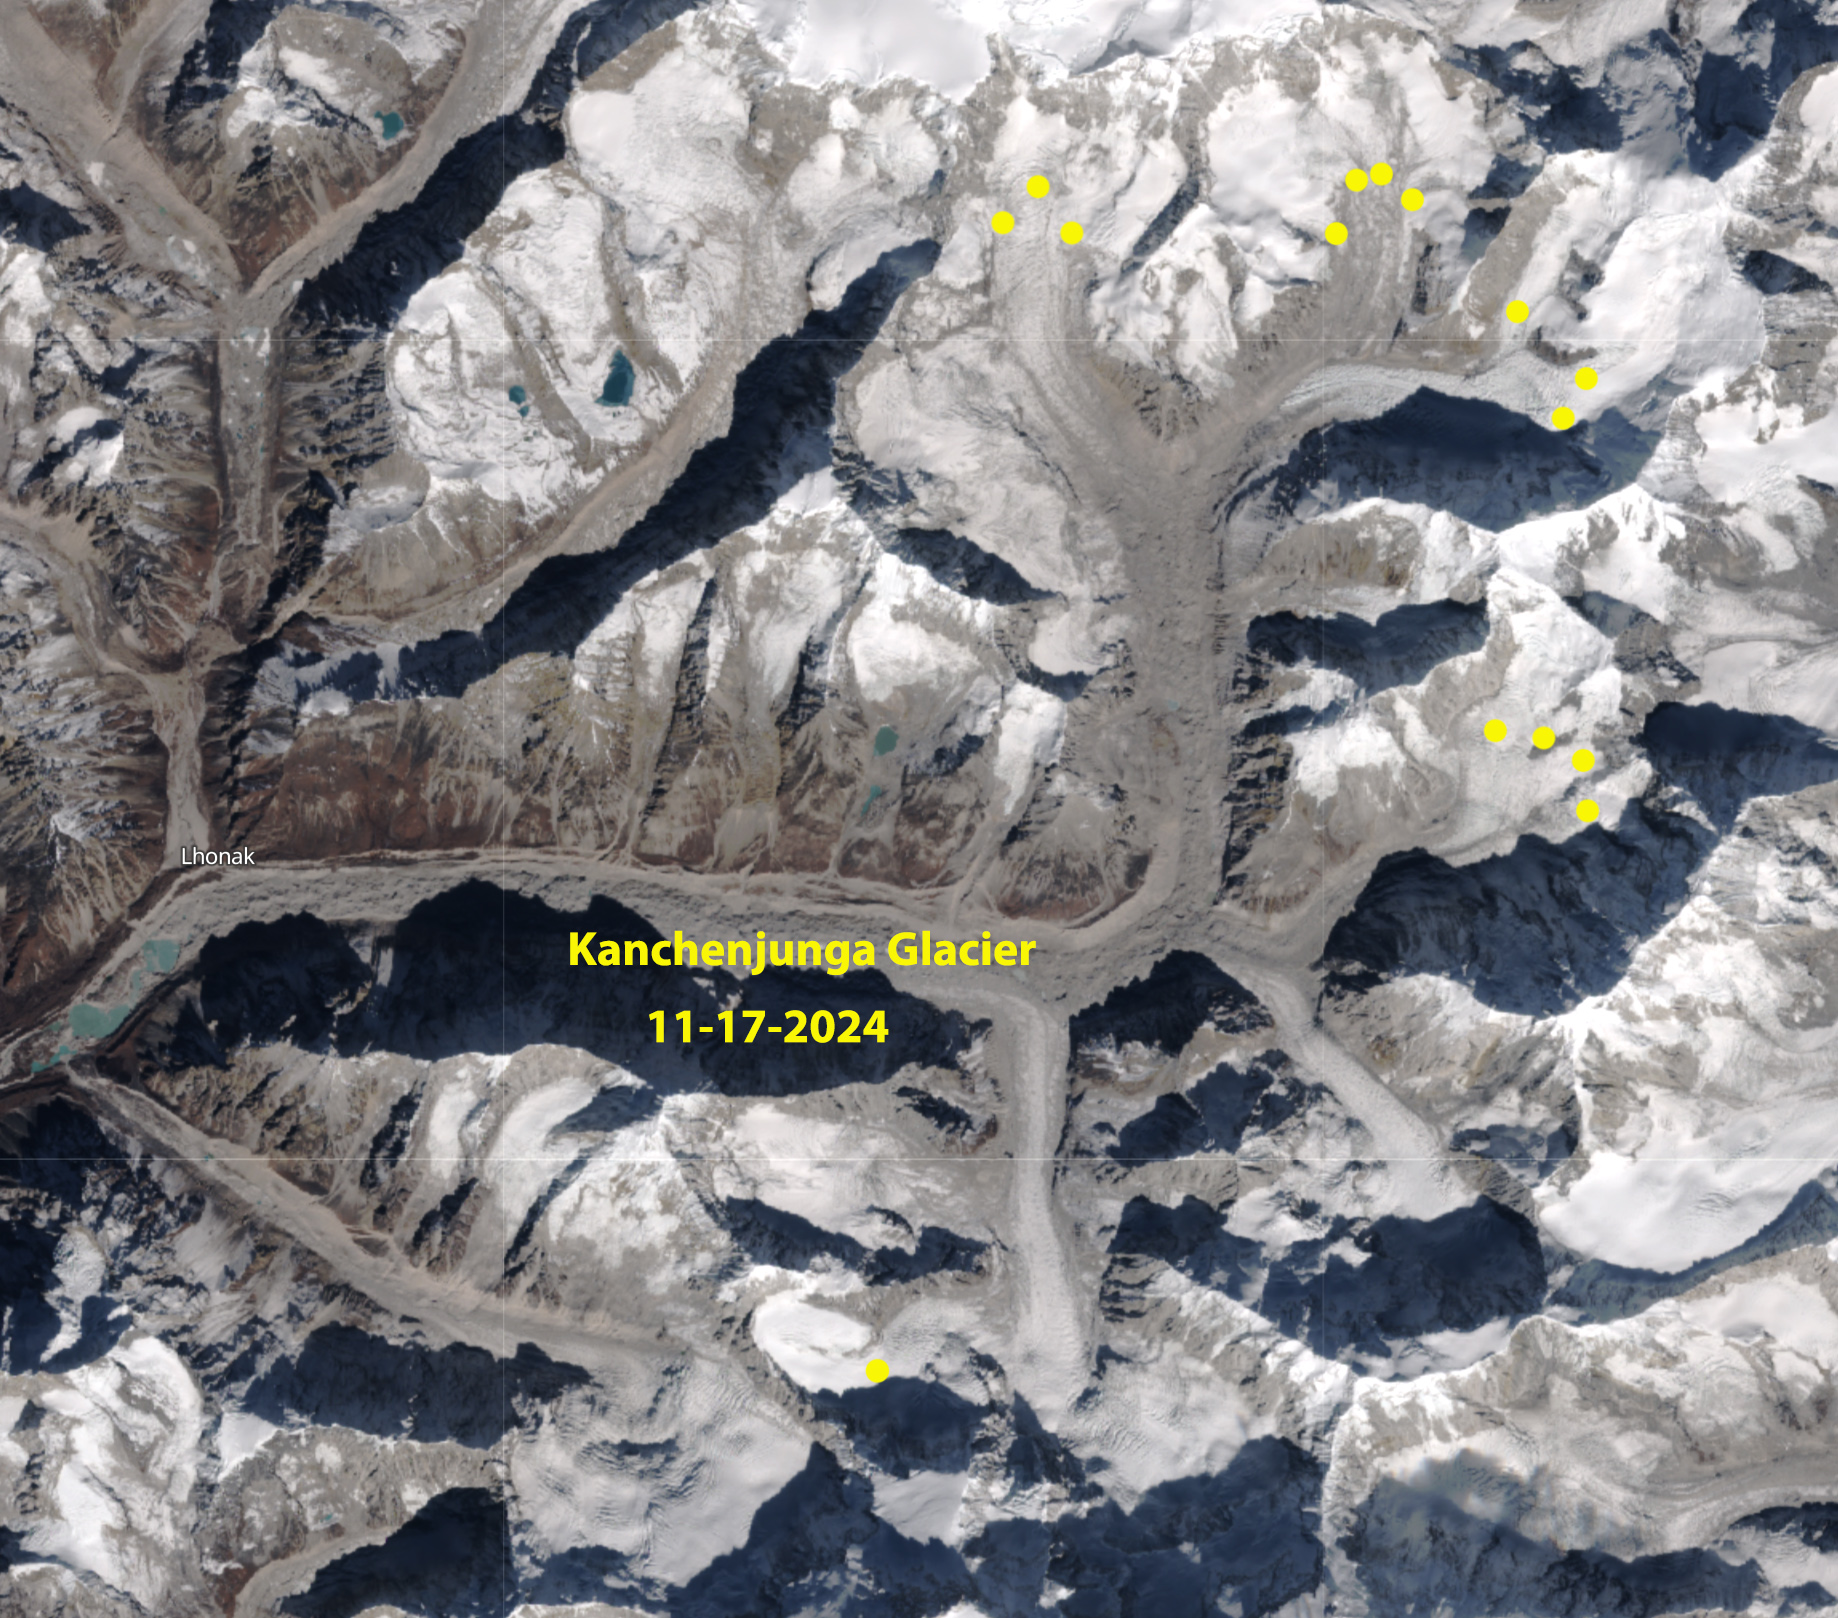
As the post-monsoon period progresses, glacier snow lines have been rising in the Himalaya. Will this be similar to last year and in 2020/21 when the snow line on many glaciers remained high right through much of the winter? Here we examine Sentinel 2 imagery from Kanchenjunga Glacier on the eastern border of Nepal to the Gangotri Glacier in Uttarakhand, India. In November snow lines are averaging from 5500 m to 6000 m (yellow dots are snowline). In each location there is clear upward shift of the snow line since the beginning of October, 2024.
The rising snow lines indicate significant ablation is occurring at least up to that point. There has been a trend in the last decade where ablation conditions are extending into the winter season most years (Pelto et al 2022). Will the winter 2024/25 follow this trend?.
Kanchenjunga Glacier with the November 17, 2024 snow line averaging 6000 m.Langtang Glacier, Nepal with the snow line on November, 17 2024 averaging 5500 m.Gangotri, Satopanth and Bhagirath Kharak Glacier snow line on Sentinel 2 image from 11-06-2024. Mean elevation is 5500 m.