Twitcher Glacier, South Georgia, 40% of Length Lost 1989-2019

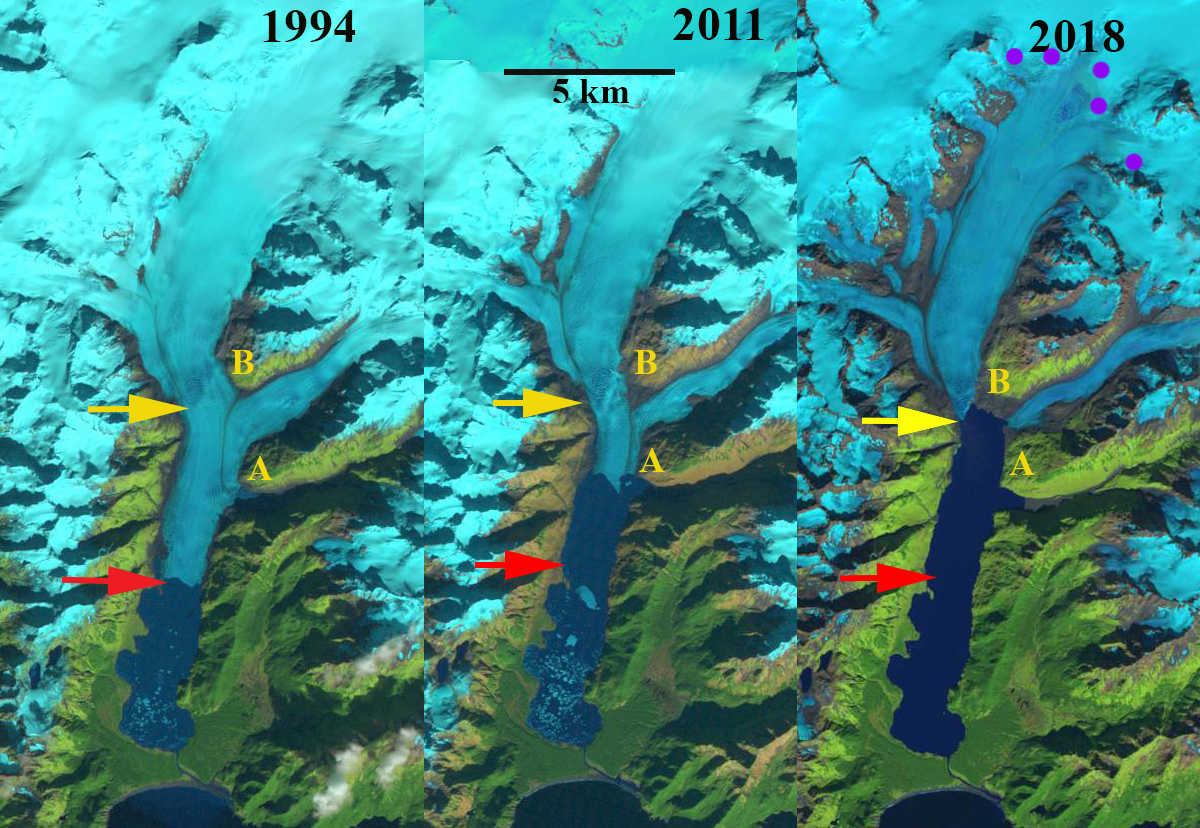
Twitcher Glacier in Landsat images from 1989 and 2019.  The red arrow is the 1989 terminus and yellow arrow is the 2019 terminus.  1, 2 and 3 are tributaries.

Twitcher Glacier is the next glacier south of Herz Glacier on the east coast of South Georgia. Until 1989 the glacier ended at the tip of a peninsula, the ensuing retreat has led to the opening of a new fjord.  Twitcher Glacier was 12 km long and had a 2.3 km wide calving front in 1989. The terminus change of this tidewater glacier was completed by the British Antarctic Survey for the 1960-2007 period. The glacier retreated 1.5 km between 1960 and 2007, with half of the retreat occurring after 1992 (Gordon et al, 2008). The map below indicates the slow retreat from 1960-1988 and a more rapid retreat since.

In 1989 this glacier terminated approximately at the end of a peninsula separating the two glaciers. Here we examine Landsat imagery from 1989, 2002, 2015 and 2019 to identify the rate retreat. The 1989 terminus position is indicated with the down pointing red arrow and the 2019 terminus position with a yellow arrow. The retreat is less than 0.5 km  from 1989-2002. Three tributaries from the south side are feeding the main glacier in 1989 and in 2002.  By  2015 the glacier has retreated  a further 1.7 km retreat and tributary #1 now flows directly into the expanding Twitcher Bay. By 2019 tributary #2 has detached from the glacier as well.  The glacier retreat from 1989-2019 has been 5.2 km, which is 40% of its 12 km length in 1989.  last image is a closeup in Google Earth from 2010 note the significant crevassing which is indicative of rapid flow. The terminus is currently quickly retreating to the next peninsula where the terminus will separate into two parts.  The retreat of this glacier rivals that of both Neumayer Glacier and Hindle Glacier that have also separated and opened up large new fjord reaches NASA Earth focused on this assessment. Hindle and Twitcher have both had the fastest retreat since 2015. The glacier currently has a 1 km wide calving front, but this should widen some as tributary #3 is reached.  This will lead to greater retreat in terms of area if not length.

Twitcher Glacier in Landsat images from 2002 and 2015.  The red arrow is the 1989 terminus and yellow arrow is the 2019 terminus.  1, 2 and 3 are tributaries.

Retreat of Twitcher Glacier in the BAS map from 1988-orange lines to 2017 green line at glacier front.

North Cascade 2019 Winter Accumulation Assessment

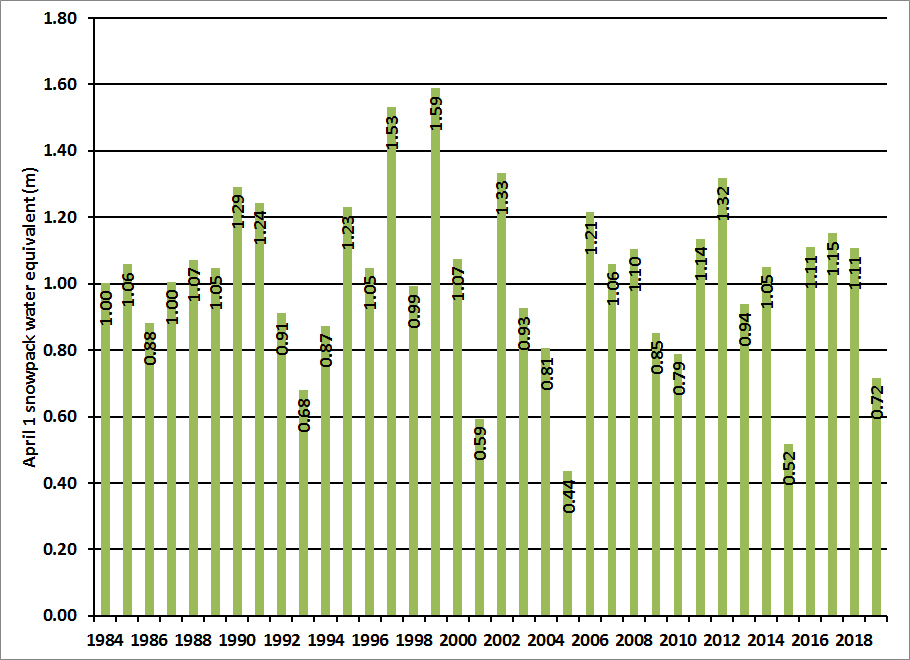
April 1 winter accumulation at the longer term North Cascade SNOTEL stations (Fish Lake, Lyman Lake, Park Creek, Rainy Pass, Stampede Pass and Stevens Pass).

For North Cascade glaciers the accumulation season provides that layer of snow, that must then last through the melt season.  A thin layer sets the glaciers up for a mass balance loss, much like a bear with a limited fat layer would lose more mass than ideal during hibernation. The 2019 winter season in the North Cascade Range, Washington has been unusual.  On April 1 the retained snow water equivalent in snowpack across the range at the six long SNOTEL sites is 0.72 m, which is ~70% of average.  This is the fifth lowest since 1984.  The unusual part is that freezing levels were well above normal in January, in the 95% percentile at 1532 m, then were the lowest level, 372 m of any February since the freezing level record began in 1948.  March returned to above normal freezing levels.  As is typical periods of cold weather in the regios are associated with reduced snowfall in the mountains and more snowfall at low elevations.  In the Seattle metropolitan area February was the snowiest month in 50 years, 0.51 m of snow fell, but in the North Cascades snowfall in the month was well below average. From Feb. 1 to April 1, snowpack SWE at Lyman Lake, the SNOTEL site closest to a North Cascade glacier, usually increases from 0.99 m to 1.47 m, this year SWE increased from 0.83 m to 1.01 m during this period.

The Mount Baker ski area snow measurement site has the world record for most snowfall in a season 1140 inches (28.96 m) during the 1998/99 snow season.  The average snowfall is 633 inches (16.07 m) with snowfall this year as of April 15th at 533 inches (13.53 m).  Below is a Landsat image from April 15, 2019 indicating the snowline at ~1000 m in the Nooksack River Valley and 900-1000 m in the Baker Lake valley.

This year for the 36th consecutive year the North Cascade Glacier Climate Project will be in the field measuring North Cascade glaciers, the early signs point towards a seventh consecutive negative balance year.

Freezing levels at Mount Baker, WA from the North American Freezing Level Tracker. February lowest mean freezing level since 1948.


Mount Baker Cloaked in winter snow in 4/15/2019 Landsat image MB=Mount Baker, MS=Mount Shuksan, NR=Nooksack River

Northern Patagonia Icefield High Equilibrium Line Altitude in 2019

Northern Patagonia Icefield Landsat view on 4/6/2019. Transient snowline indicated on individual glaciers with purple dots. Clockwise, L=Leones, So=Soler, N=Nef, Ca=Cachet, Co=Colonia,  PN=Pared Nord, PS=Pared Sur, H4=HPN4, St=Steffen, A=Acodado, B=Benito, H1=HPN1, Sq=San Quintin.

The Northern Patagonia Icefield from 1987-2015 decreased in area, while debris cover area expanded and the size of proglacial lakes expanded (Glasser et al 2016).  The icefield area declined from 4113 to 3887 km2, debris cover increased from 168 to 307  km2 and lake area expanded from 112 to 198 km2 In this paper we also examined the recent rise in the transient snow line (TSL). The TSL is the location of the transition from snow cover to bare glacier ice at a particular time during the ablation season, while the Equilibrium Line Altitude (ELA) is the altitude of the snow line at the end of the ablation season. The TSL at the end of the melt season is the ELA.  In recent years the ELA has been rising, and the highest annually observed TSL in the period 2013-2016 averaged 1215 m (Glasser et al 2016). This is an ELA rise of  at least 103 m compared with the  observed  1979-2003 ELA.  Landsat 8 imagery from April 6, 2019 reveals the TSL for most NPI glaciers, this is typically beyond the end of the melt season, but not in 2019, hence the TSL from this date will be the approximate annual ELA.  How does it compare and what does that mean for icefield mass balance in 2019?

On April 6, 2019 the TSL was highest on glaciers on the east side of the icefield decreasing for the western outlet glaciers. Clockwise from Leones Glacier in the Northeast to San Quintin Glacier on the west side the TSL observed ranged from 1525 m on Leones Glacier and Soler Glacier to a low of 1075 m on San Quintin Glacier.  The mean TSL is 1260 m for the glaciers reported by Glasser et al (2016) and 1300 m for all glaciers.  TSL on April 6, 2019 on glaciers on the east side of the icefield averaged 1425 m, while on the east side of the icefield the average was 1200 m.

Willis et al (2012) noted the ELA of NPI glaciers for the 2001-2011 period, a glacier by glacier comparison to 2019  indicates the ELA is  ~150 m higher in 2019.  This is the highest mean TSL observed for the NPI and suggests a strong negative surface mass balance year for the icefield in 2019.  This does not include the calving losses such as observed at San Quintin Glacier.  Dussaillant et al (2018) reported negative mass balances of NPI glaciers of ~-1 m using two different methods for the 2000-2012 period. TSL observations since indicate the ELA has been higher in recent years driving even more negative balances.  As Pelto (2017) noted 19 of the 24 main outlet glaciers of the Northern Patagonia Icefield ended in a lake in 2015, all the lake termini retreated significantly in part because of calving losses. Surface mass balance losses in 2019 will lead to continued retreat such as observed at San Quintin Glacier, Nef Glacier, and Acodado Glacier. This will also increase the debris covered area, which increases albedo and ablation further.

Northern Patagonia Icefield ELA reported by Willis et al (2012), Glasser et al (2016) and for 2019. 

Gualas Glacier (G) and Reichert Glacier (R) TSL on 4/6/2019 in Landsat image.


Glaciers Retreat from Evighedsfjord, Greenland

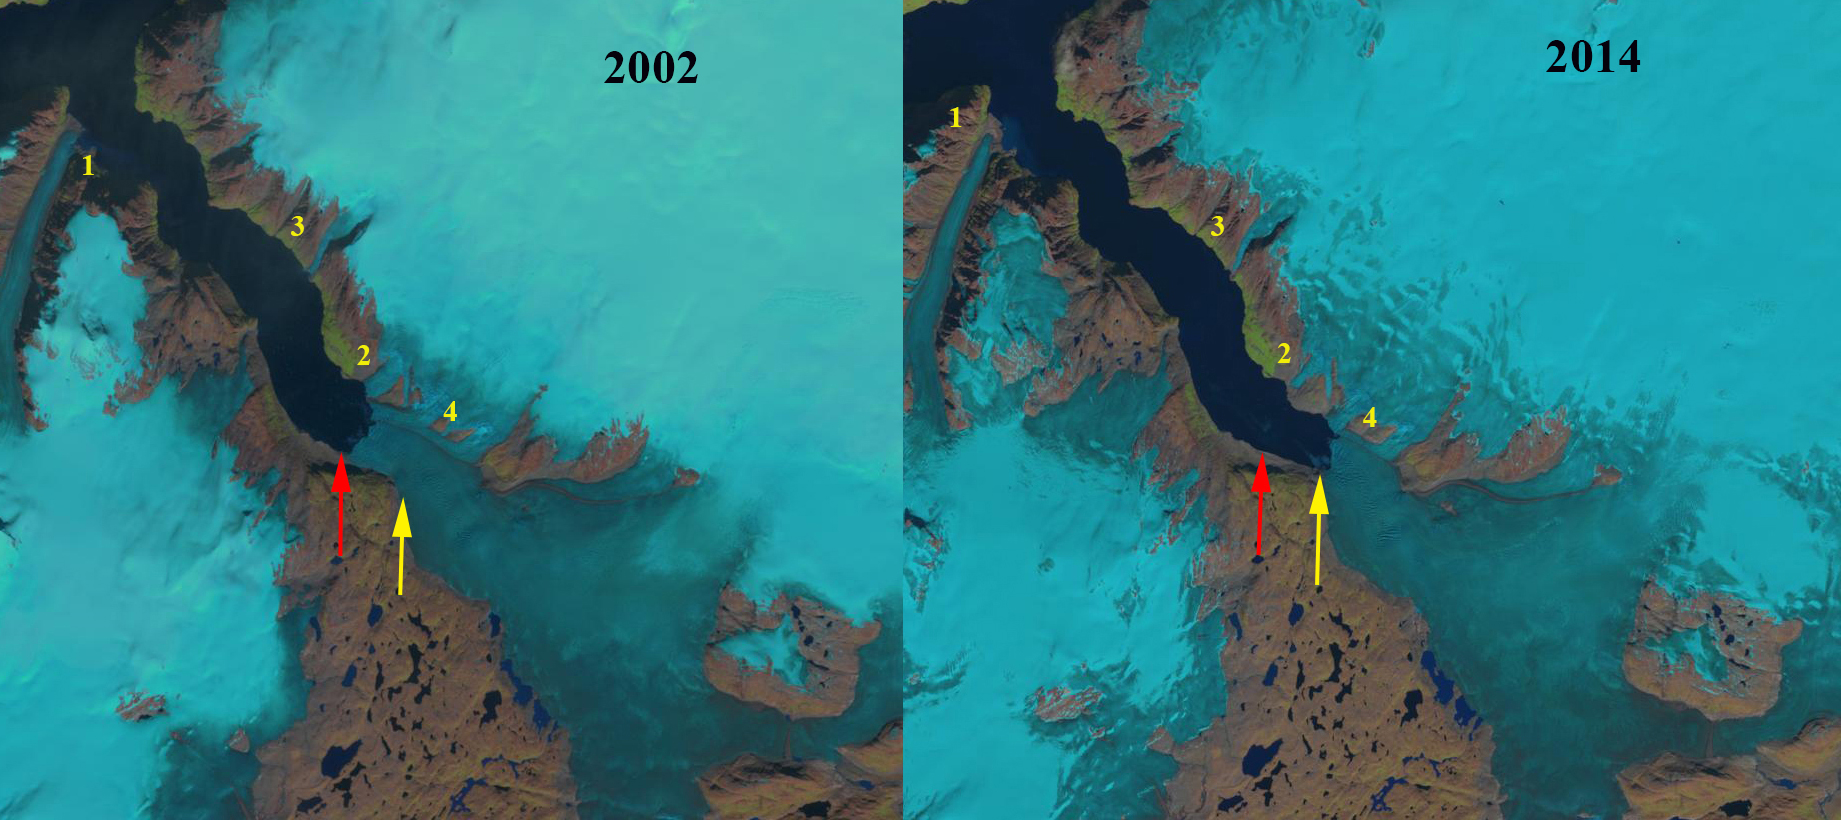
Evighedsfjord (E) with glaciers terminating in the fjord in 2000 and 2018 Landsat images. Q=Qingua Kujatdleq is at the head of Evighedsfjord (Q), Tapa Glacier (1), Unnamed glaciers (2 and 3), and developing nunatak area (4) .  The red arrow is the 2000 terminus and the yellow arrow is the 2018 terminus. 

Evighedsfjord (Kangerlussuatsiaq Fjord) in southwest Greenland has numerous glaciers that reach or did reach this 75 km long fjord. Here we examine the termination of the fjord at Qingua Kujatdleq. Here we examine Landsat imagery from 2000, 2002, 2014 and 2018 to identify changes in four glaciers that in 2000 terminated in the fjord. Leclercq et al (2012) note that the glacier retreated 1.5 km from 1850-2009.

In 2000 Tapa Glacier (1) terminated in the fjord. Glacier #2 and #3 also terminated in the fjord in 2000. Quingua Kujatdleq Glaicer terminated at the red arrow, and #4 represents small nunataks within the ice. The snowline is at ~1000 m.  In 2002 all four glaciers reach Evighedsfjord still and the snowline is at ~1000 m.  There are no evident sediment plumes where the glaciers reach the fjord.  By 2014 only Qingua Kujatdleq still reaches the fjord, the snowline is at ~1100 m.  There is a sediment plume emanating from Tapa Glacier. In 2018 Qingua Kujatdleq has retreated 2200 m since 2000. This is a greater retreat than Leclercq et al (2012) show for the entire 1850-2009 period.  Tapa Glacier has retreated ~500 m and no longer reaches the ocean and has a persistent summer sediment plume. Glacier #2 no longer reaches the ocean having retreated 500 m.  Glacier #3 no longer reaches the ocean having retreated 300 m.  The two small bedrock outcrops at #4 in 2000 have merged into one large nunatak by 2018.   The loss of glacier ice reaching fjords has also been documented at Alangordlia Fjord and Tasermiut Fjord.

Evighedsfjord (E) with glaciers terminating in the fjord in 2002 and 2014 Landsat images. Q=Qingua Kujatdleq is at the head of Evighedsfjord (Q), Tapa Glacier (1), Unnamed glaciers (2 and 3), and developing nunatak area (4) . The red arrow is the 2000 terminus and the yellow arrow is the 2018 terminus.

Greenland topographic map of the region right and 2018 Landsat image of with Qingua Kujatdleq (Q), Tapa Glacier (Point 1). Unnamed glaciers #2 and #3 also noted. 

Norðurjökull Retreats from Hvítárvatn, Langjökull, Iceland

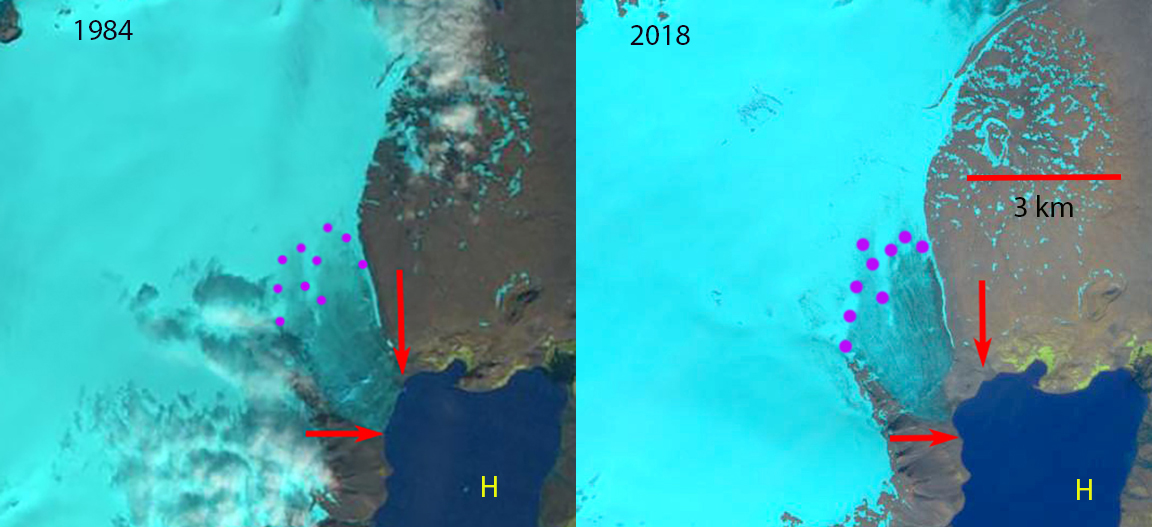
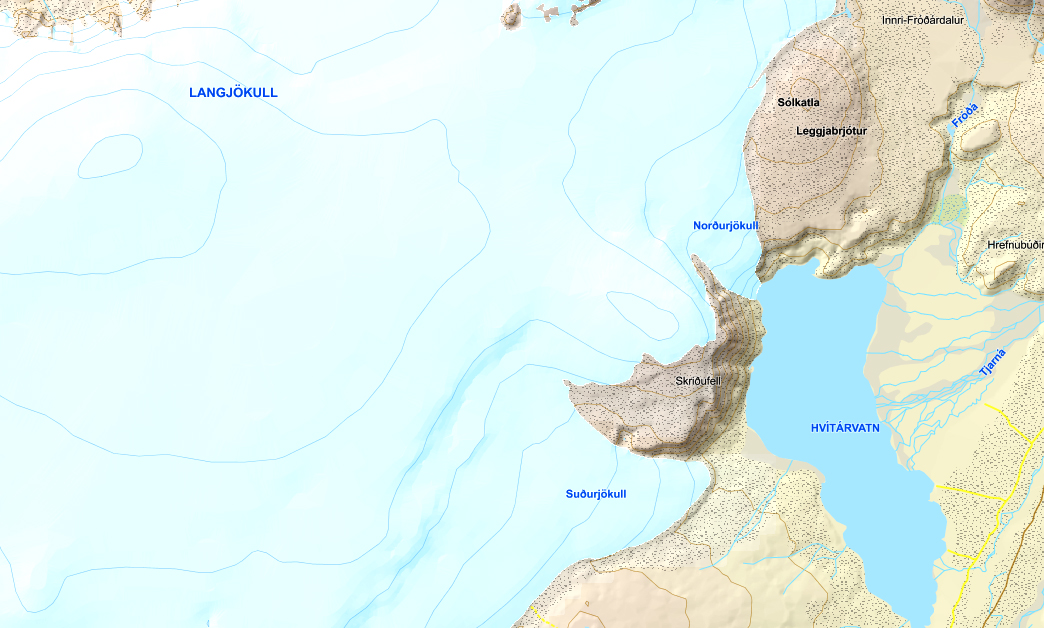
Norðurjökull in 1984 Landsat image and 2018 Sentinel image.  Red arrows indicate the margins of the glacier in 1984.  Purple dots indicate the snowline.

Langjökull is the second largest icecap in Iceland with an area of 920 square kilometers (Jóhannesson (2009). One of the main outlet glaciers of Langjökull is the Norðurjökull which has terminated in Hvítárvatn. Hvítárvatn is a large lake that recieves 70% of its inflow from Langjökull (Flowers et al, 2007). The lake has a maximum depth of 84 m and a surface area of 30 square kilometers.

The mass balance of Langjökull has been reported to the since 1997.  The mass balance has been negative in 20 of the 21 years of reported data, with a loss of 18 m of water equivalent since 1997 (VAT). This is 8-10% of the volume of the ice cap (Guðmundsson et al, 2008).  Pope et al (2010) observed that Langjökull has lost an area of 3.42.5 square kilometers/year over the decade.

Here we examine the changes in Norðurjökull from remote sensing imagery from 1984, 1994, 2006, 2014 and 2018.  In 1984 the glacier terminated in Hvítárvatn along a width of 1100 m and the snowline is at 800 m.  In 1994 the width of the terminus front in the lake has increased by 100 m indicating a small advance. By 2006 the width of the glacier front in Hvítárvatn has been reduced to 600 m and the snowline is at 1000 m.  By 2014 this connection with the lake is just 300 m.  In the two Sentinel images from 2018 the terminus no longer reaches the shore of Hvítárvatn. Iceberg calving will no longer be a consideration at this outlet glacier.  The snowline on 8/11/2018 is at 800 m rising to ~950 m by 8/25/2018. The retreat of this glacier is like that of other Langjökull outlets Hagafellsjokull and nearby Porisjokull. The retreat has been less significant than the thinning, Pope et al (2016) illustrated this for the 1994-2007 period.


Norðurjökull in 1994 Landsat image and 2018 Sentinel image.  Red arrows indicate the margins of the glacier in 1984.  Purple dots indicate the snowline.

Langjökull map showing terminus.

Aug. 1, 2019 Landsat image indicating the snowline reached the crest of the icecap at Norðurjökull in 2019.

Norðurjökull in 2006 Landsat image and 2014 Digital Globe image. Glacier still in contact with the lake.

Nakonake Glaciers, BC Retreat Two are Disappearing

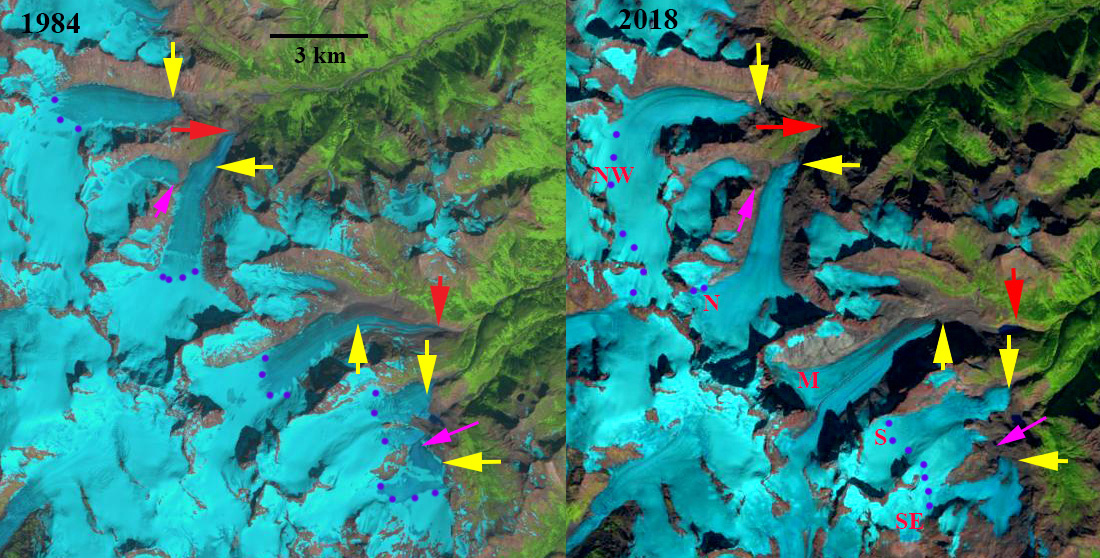
Nakonake Glaciers in 1984 and 2018 Landsat images. Nakonake Glaciers are NW=Northwest, N=North, M=Middle, S=South, SE=Southeast.  Red arrows indicate the 1984 terminus position of the North and Middle Nakonake Glaciers.  Yellow arrows indicate the 2018 terminus location of each. Purple dots indicate the snowline and the pink arrow indicates locations of glacier separation.

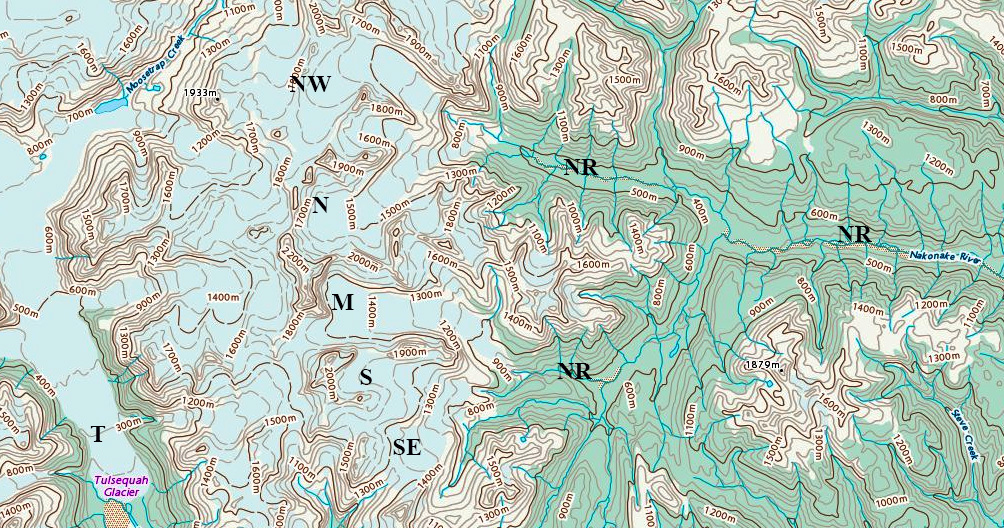
The Nakonake Glaciers are a group of unnamed glaciers at the headwaters of the Nakonake River in NW Britishc Columbia.  The range is just east of the Tulsequah Glacier-Juneau Icefield.  The Nakonake River flows into the Sloko River which joins the Taku River.  There are sockeye, coho and chinook salmon in the Sloko River.  The Sloko River below the junction with Nakonake River is known as a fun stretch of river to run. My only experience with this glacier group was watching a grizzly bear ascend from the lower Tulsequah Glacier into the Nakonake area. Menounos et al (2018) indicate this region of British Columbia had the largest mean annual mass balance losses from 2000-2018.

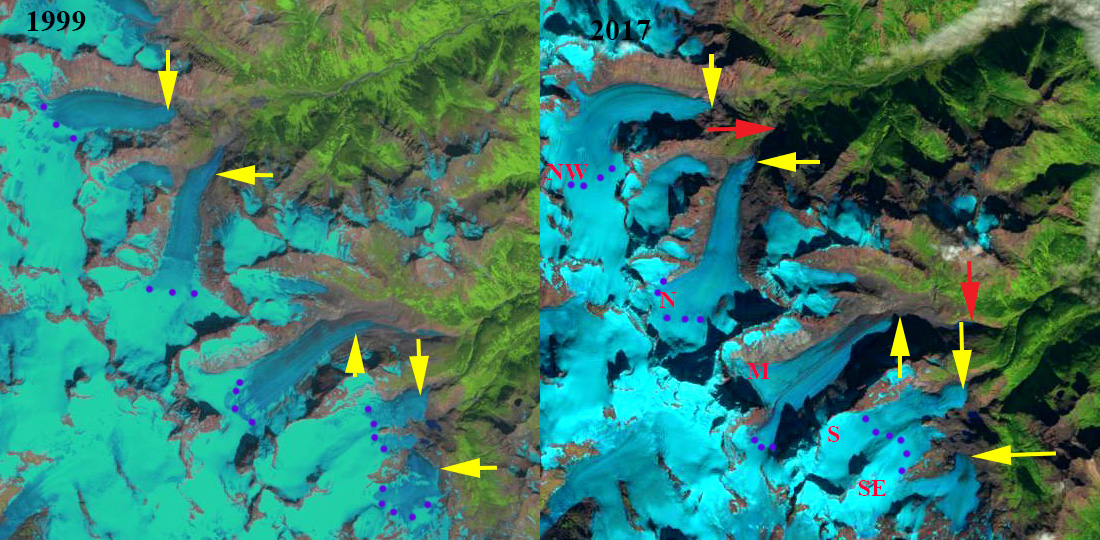
In 1984 the Norhtwest (NW) Nakonake terminated at the top of a steep slope at 1100 m.  North (N) Nakonake Glacier terminated at 800 m with a longer valley tongue than the NW glacier.  The Middle (M) Nakonake Glacier terminated at 900 m and had a substantial low slope terminus tongue. The South (S) Nakonak Glacier merged with the Southeast (SE) Nakonake Glacier at this time.  The snowline varied from 1500 m on NW to 1400 m on N and M and 1300 m on S and SE.  By 1999 the SE Nakonake Glacier had separated from the S Nakonake Glacier though it still had two terminus lobes that were connected. The snowline ranged from 1600 m on the NW Nakonake to 1400 m on the S and SE Nakonake. In 2017 the snowline was quite high ranging from 1700+ m on NW Nakonake to 1500+ m on South Nakonake Glacier.  In 2018 the Juneau Icefield regions saw the highest snowlines of the last 70 years (Pelto, 2018). The snowline was above the top of the M Nakonake and SE Nakonake Glacier. The snowline was above 1800 m on NW Nakonake and 1700 m on the S Nakonake Glacier. Retreat of the NW Nakonake from 1984-2018 was limited at 200 m, though recent high snowlines should accelerate this retreat.  The N Nakonake Glacier that had a low elevation terminus tongue still in 1984 and retreated 1400 m from 1984-2018.  The M Nakonake also had a low elevation tongue that melted away leading to  a retreat of 2200 m from 1984-2018. The retreat is 30+% of the glacier length lost.  This glacier lacks a significant accumulation and will not survive. The S Nakonake retreat like the NW was minor at ~200m.  The SE Nakonake Glacier was 700 m, which given a glacier length of just over 3 km is a substantial loss. This glacier lacks a significant accumulation zone and will not survive. This glacier has separated into two parts.

Tulsequah Glacier has experienced a more rapid retreat enhanced by proglacial lake development (Pelto, 2017).

Nakonake Glaciers in 1999 and 2017 Landsat images. Nakonake Glaciers are NW=Northwest, N=North, M=Middle, S=South, SE=Southeast.  Red arrows indicate the 1984 terminus position of the North and Middle Nakonake Glaciers.  Yellow arrows indicate the 2018 terminus location of each. Purple dots indicate the snowline.

Map of the Nakonake Glaciers and headwaters of the Nakonake River (NR). Tulsequah Glacier (T) to the west is also noted.

Nevado Ausangate Glaciers, Peru Retreat and Lake Formation

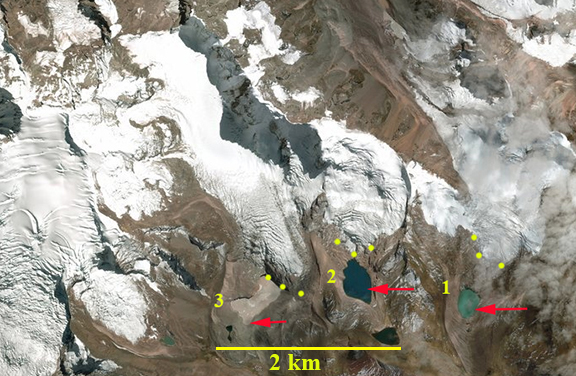
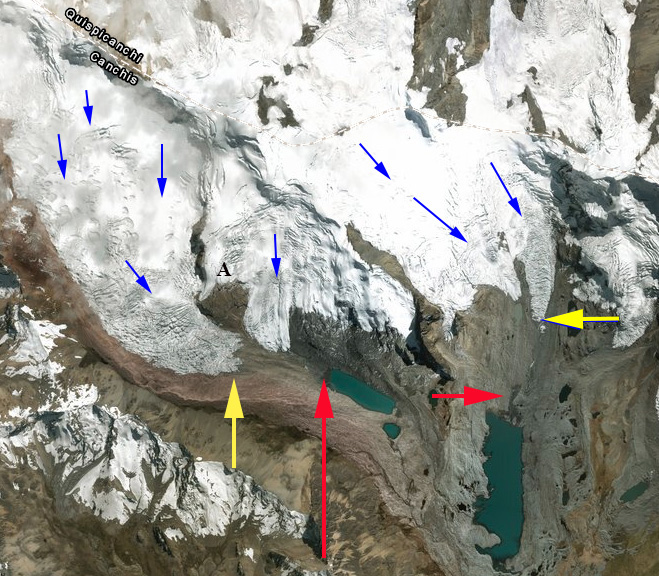
Digital Globe image of Ausangate Glaciers. Red arrows indicate 1995 terminus location and yellow dots the 2018 terminus location.

Here we examine three Ausangate Glaciers, Peru descending south from the Nevado Ausangate group of peaks in the Cordillera Vilcanota.  A circumnavigation trek around Nevado Ausangate is a favorite for visitors to the Machu Picchu area. The glaciers are just west of Laguna Sibinacocha, and drain into the Rio Vilcanota.  Retreat of glaciers in the Cordillera Vilcanota has been rapid since 1975, Veettil et al (2017) noted that ~80% of glaciated area below 5000 m was lost from 1975-2015 and glacier area overall area had declined 48%.  Henshaw and Bookhagen (2014) observed that from 1988-2010 glacial areas in the Cordillera Vilcanota declined annually by ~ 1% per year.

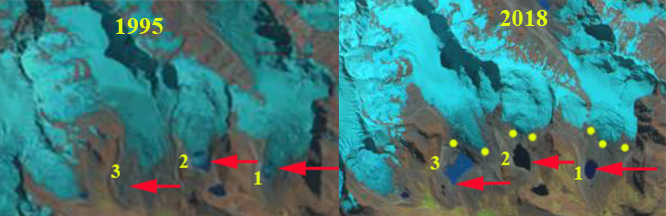
Ausangate Glaciers in 1995 Landsat and 2018 Sentinel image. Red arrows indicate 1995 terminus location and yellow arrows the 2018 terminus location. The development of three proglacial lakes at the terminus of each glacier is evident.

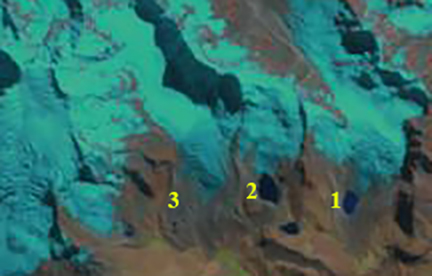
In 1995 the three glaciers all terminate in incipient proglacial lakes.  The terminus of #3 is debris covered. By 2000 each of the glaciers is still terminating in an expanding proglacial lake.  Glacier #1 and #2 have developed to a size of ~0.1 square kilometers.  Glacier 3# still shows limited lake development.  By 2018 Glacier #1 has retreated 450 m and is now separated  from the lake.  Glacier #2 has retreated 400 m and no longer reaches the lake.  Glacier #3 is still in contact with the lake which still has debris covered stagnant ice covering a portion of the basin.  This lake has an area of 0.13 square kilometers, and could reach an area of ~0.2 sq. kilometers depending on debris cover thickness.  The terminus of each glacier has retreated above 5000 m since 1995. The glaciers each has extensive crevassing and maintains a snow covered accumulation zone, indicating they can survive current climate. Veettil et al (2017) noted that glacier area above 5300 m was relative stable, for Ausangate Glaciers the area above 5200 m is in the accumulation zone and has been relatively stable.

The formation of new lakes and the retreat from proglacial lakes has been a common occurrence in recent decades for Andean glaciers in Peru such as Manon Glacier  and Soranano Glacier. The key role of glaciers to runoff is illustrated by the fact that 77% of lakes connected to a glacier watershed have maintained the same area or expanded, while 42% of lakes not connected to a glacier watershed have declined in area Henshaw and Bookhagen (2014). The Ausangate Glaciers supply runoff to the Machupicchu Hydroelectric Power Plant managed by EGEMSA, which has an operating capacity of 90 MW.  The Vilcanota River becomes the Urubamba River further downstream.

Ausangate Glaciers in 2000 Landsat  The development of two of the three proglacial lakes at the terminus of each glacier is evident.

Soranano Glacier, Peru Separation and Retreat 1995-2018

Western Soranano (WS) and Eastern Soranano Glacier (ES) in 1995 and 2000 Landsat images and 2018 Sentinel image, with red arrows indicating the terminus in 1995, and yellow arrows the 2018 terminus. 

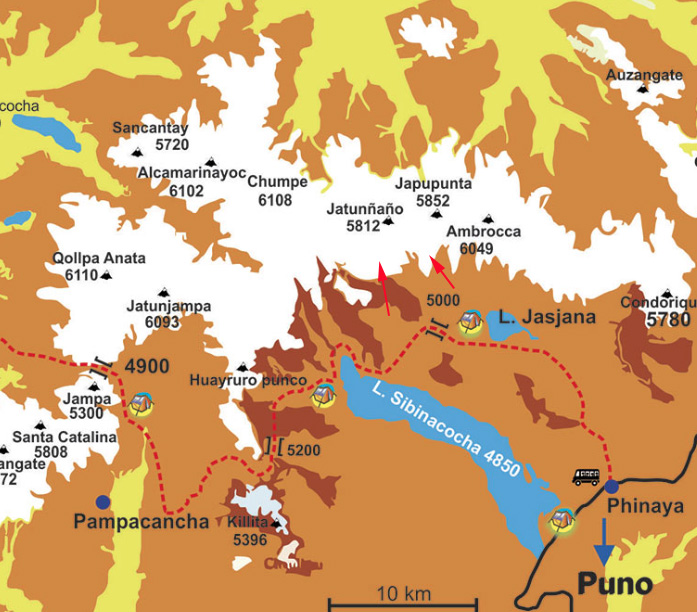
Here we examine the west and east Soranano Glacier glacier descending south from the 5800 m summit of Jatunnano (Hatun Nana Punta). The glaciers are just east of Laguna Sibinacocha, which drains into the Rio Vilcanota.  Retreat of glaciers in the Cordillera Vilcanota, Peru has been rapid since 1975, Veettil et al (2017) noted that ~80% of glaciated area below 5000 m was lost from 1975-2015 and glacier area overall declined 48%.  Henshaw and Bookhagen (2014) observed that from 1988-2010 glacial areas in the Cordillera Vilcanota had been declining annually by ~4 km2, which is just over 1% per year for this region that had a glacial area of 361 km2 in 1988.

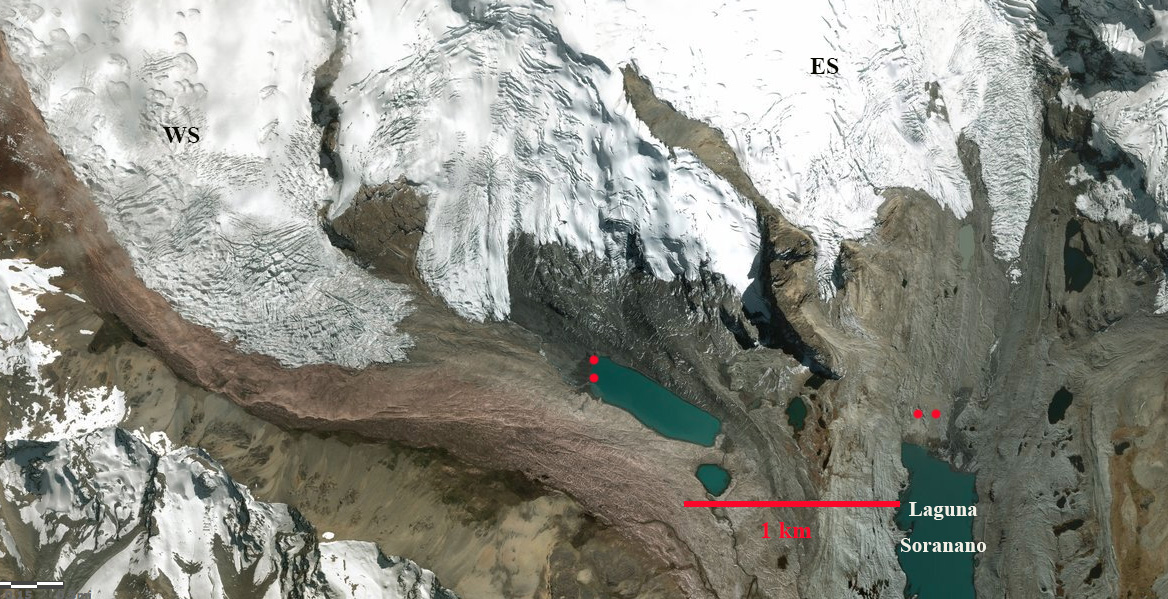
In 1995 the western Soranano Glacier terminates in a proglacial lake at 5000 m the eastern glacier terminates just north of Laguna Soranano also at ~5000 m.  Point A is encircled by the two lobes of the western Soranano Glacier. By 2000 there is minor retreat of both glaciers. By 2018 the western Soranano Glacier has separated into two lobes, with the former rock knob at Point A now the separating rib. The glacier has retreated 800 m since 1995, which is 20% of its 4 km length in 1995. The eastern Soranano Glacier has retreated 700 m and has also separated into two lobes. A new small lake has formed in front of the western lobe.

The formation of new lakes and the retreat from proglacial lakes has been a common occurrence in recent decades for Andean glaciers in Peru such as Manon Glacier , Safuna and Arhuey Glacier. The key role of glaciers to runoff is illustrated by the fact that 77% of lakes connected to a glacier watershed have maintained the same area or expanded, while 42% of lakes not connected to a glacier watershed have declined in area Henshaw and Bookhagen (2014).  Laguna Sibinacocha water level is raised by the Sibinacocha Dam, to maintain the flow of the Vilcanota River in dry season and support the normal operation  of the Machupicchu Hydroelectric Power Plant managed by EGEMSA, which has an operating capacity of 90 MW.  The Vilcanota River becomes the Urubamba River further downstream.

Western Soranano (WS) and Eastern Soranano Glacier (ES), with red dots indicating the terminus in 1995, this is a 2018 Digital Globe image.

Western Soranano and Eastern Soranano Glacier, with red arrows indicating the terminus in 1995, and yellow arrows the 2018 terminus in this 2018 Digital Globe image.

Trekking map of the region, red arrows indicate the Soranano Glaciers

Läntagletscher, Switzerland Separates From Rapidly Melting Terminus Lobe

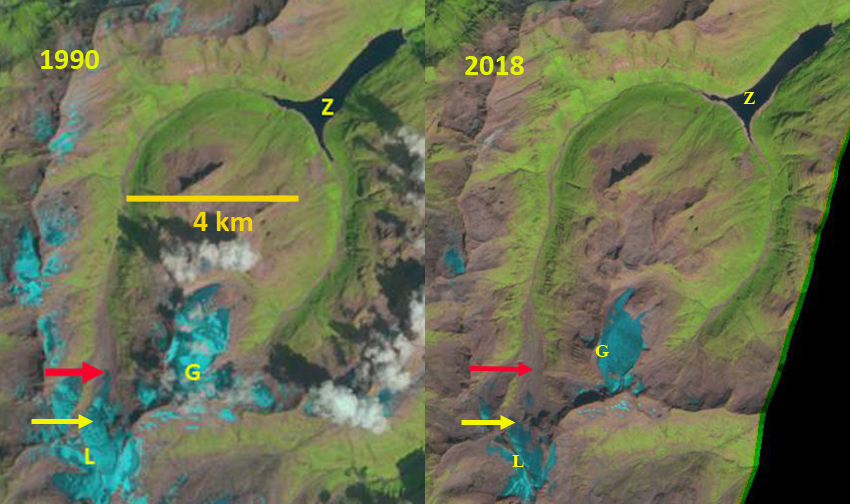
Läntagletscher (L)  in 1990 Landsat image and 2018 Sentinel image.  Red arrow is the 1990 terminus location, yellow arrow 2018 terminus location, Zervreilasee (Z)  and Gufergletscher (G)

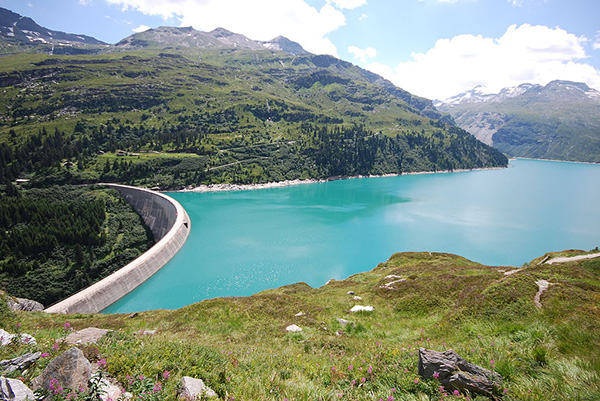
Läntagletscher is in the Alps draining into the Zervreilasee and then the Rhone River.  Zervreila is a 22 MW hydropower facility, with a 150 m high arch dam . From 1990-2014 the glacier retreated at a steady rate of ~24 m/year.  The upper portion of the glacier then separated from the lower terminus resulting in an 800 m retreat from 2014-2017 Swiss Glacier Monitoring  (GLAMOS).  GLAMOS has a new website design with good visualizations of glacier change in Switzerland. Here we examine the changes in this glacier from 1990-2018 with Landsat and Sentinel images.

In 1990 the glacier’s upper basin from 3300 m-2700 m feeds a narrow tongue that descends an icefall to the terminus section that extends from 2600 m to 2350 m, and was 1 km long. In 2006 the glacier has retreated ~400 m, but still remains connected to the upper glacier.  In 2013 Google Earth image below the terminus lobe is still connected to the upper glacier.  By 2016 the connection has been lost. The snowline in 2016 also illustrates limited retained snowcover. In 2018 there is limited snowcover remaining on Läntagletscher and Gufergletscher. Läntagletscher has retreated 1400 m since 1990 and is now confined to upper glacier region terminating at 2700 m. In the near future retreat will be slower. The loss of connection to a valley tongue has also been seen at Bas d”Arolla and Sulztalferner.

The continued loss of glacier area will reduce summer glacier runoff into the Zervreila Hydropower project as is the case across Switzerland (Schaefli et al, 2018).

Läntagletscher (L)  in 2006 Landsat image and 2016 Sentinel image.  Red arrow is the 1990 terminus location, yellow arrow 2018 terminus location,  pink arrow is a location where disconnection may occur on Gufergletscher (G).

Google Earth image of Läntagletscher, yellow arrow is the terminus lobe, green arrow the icefall connection and blue arrow the upper glacier.

Zervrielersee and dam, color due to glacially eroded sediments (glacial flour). Image from Micha L. Rieser in 2009.

Lemon Creek Glacier 2018 Ablation and Glacier Runoff

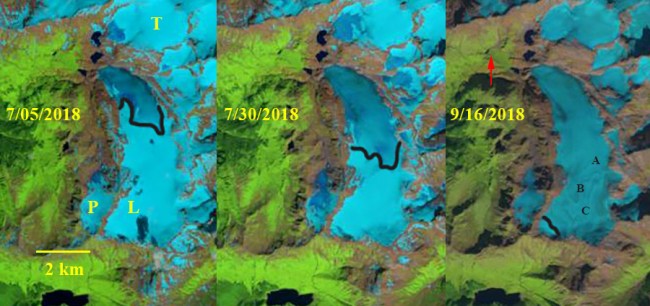
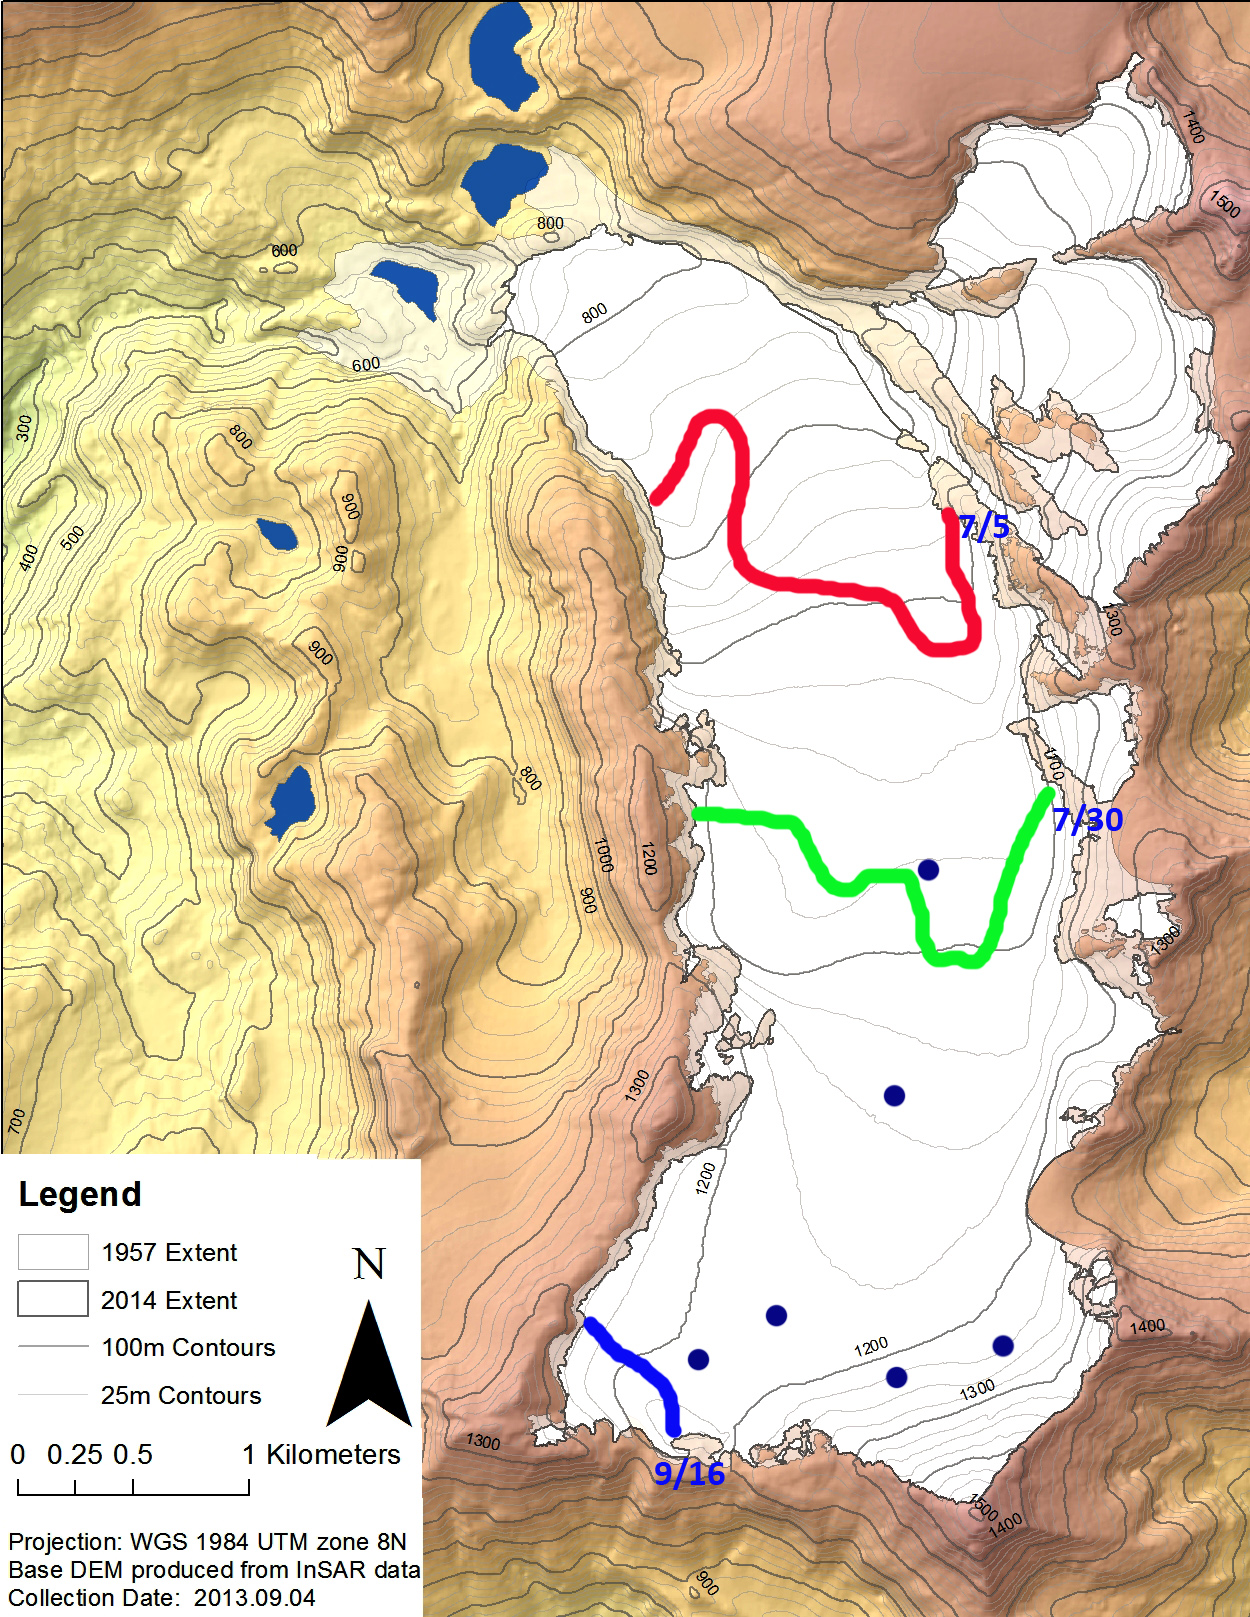
Lemon Creek Glacier (L) with the snowline (black line) indicated in Landsat images from July 5, July 30 and Sept. 16 2018. P=Ptarmigan Glacier, T=Thomas Glacier, red arrow is the 1948 terminus location. A,B and C mark firn horizons exposed by the loss of all snowpack in the accumulation zone.

The summer of 2018 was exceptional for warmth in Southeast Alaska.  July was the most unusual with Juneau recording daily highs above 70 F on 18 days, including 12 consecutive days at the end of the month.  The average temperature in July in Juneau was 2.4 C above average and the warmest average monthly temperature in history. Precipitation was recorded on just 6 days of precipitation at the Long Lake SNOTEL site in the mountains near Juneau. This resulted in the highest observed snowline of the 70 year record on Taku Glacier, a 25 km2 snow swamp developing in three days on Lowell Glacier and the loss of all snowpack on Lemon Creek Glacier.  For a glacier to be in equilibrium most glaciers need to be more than 50% snowcovered.  On Lemon Creek Glacier at the end of the summer the glacier must be covered 62% to be in equilibrium (Pelto et al 2013).  The Lemon Creek Glacier is a reference glacier of the World Glacier Monitoring Service, with mass balance measured since 1953 by the Juneau Icefield Research Program (JIRP).  The USGS began monitoring the glacier in 2016 and currently reports mass balance to WGMS, Chris McNeil (USGS) is leading a reanalysis of the mass balance record. The cumulative mass loss from 1953-2018 is ~37 m w.e, with 2018 having the most negative balance of -2.31 m w.e. The area of the glacier has declined from 12.8 square kilometers in 1948 to 9.7 square kilometers in 2018, a 24% decline.  For the glacier to provide an equivalent runoff ablation rates would have had to rise by 24%.

In 2018 on July 5 2018 the snowline on Lemon Creek Glacier was at 950 m.  From July 4-6 a series of snowpits were dug on the glacier by JIRP yielding a retained snowpack ranging from 0.9 m (water equivalent=w.e.) to 1.2 m (w.e.).  One of the snowpits with 0.9 m w.e. was at 1075 m.  On July 30 the snowline had reached 1100 m, indicating approximately 0.9 m of snow ablation in that 21 day interval. Because ice ablates faster than snow, 36% faster on Lemon Creek Glacier this would equate to  ~1.2 m of ice ablation. By September 2 the snowline had risen above the top of the glacier, with one small snowpatch in the northwest corner at 1200 m, firn horizon exposed by snowpack loss are evident .  This remains the case in the Sept. 16 image.  The small snowpatch also melted away by the end of September.  There was no accumulation zone for the third time in the last five years,indicating this glacier cannot survive current climate (Pelto, 2010).

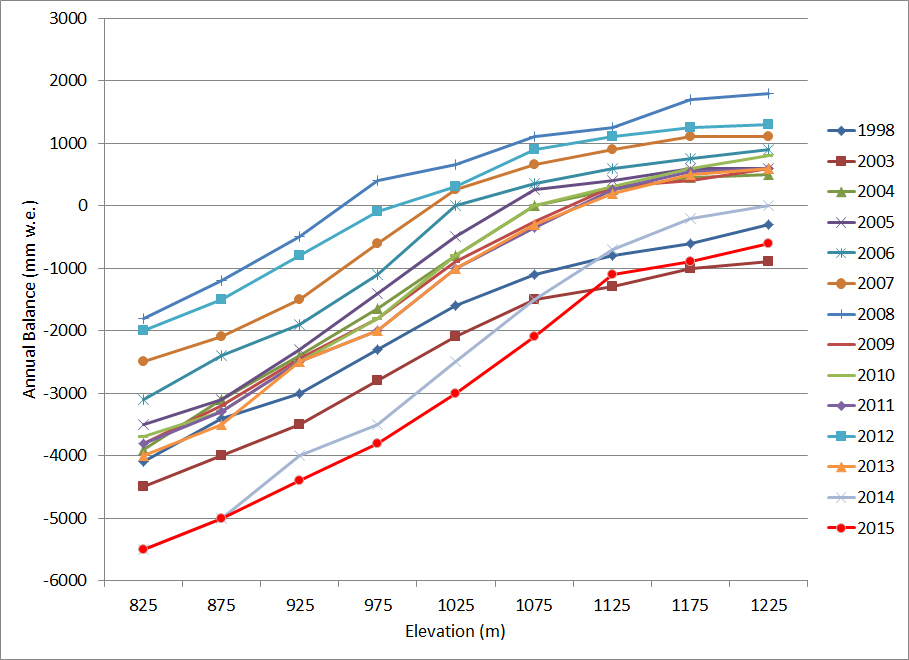
The consistency of the balance gradient, seen below from year to year allows for determination of melt rates and runoff based on the rise of the snowline.  The transient snow line migration rate times the balance gradient yields ablation rate at the snowline (Pelto, 2011). The impact of a greater area of surface ice exposed is increased ablation.  To illustrate this impact if we as an example take a day with a mean temperature of 10 C:

This would yield 350,000 m3 of melt on July 5, the glacier was 23% bare ice and 77% snow cover on this date.

This would yield 382,000 m3 of melt on July 30, the glacier was 41% bare ice and 59% snow cover on this date.

This would yield 480,000 m3 of melt on Sept. 16, the glacier was 97% bare ice/old firn and 3% snow cover on this date.

The actual July 5 temperature for Lemon Creek Glacier was 12 C. This yields 420,000 m3 of runoff.

The actual July 30 temperature for Lemon Creek Glacier was 11.5 C. This yields 440,000 m3 of runoff.

The actual Sept. 16 temperature for Lemon Creek Glacier was 1.5 C. This yields 72,000 m3 of runoff.
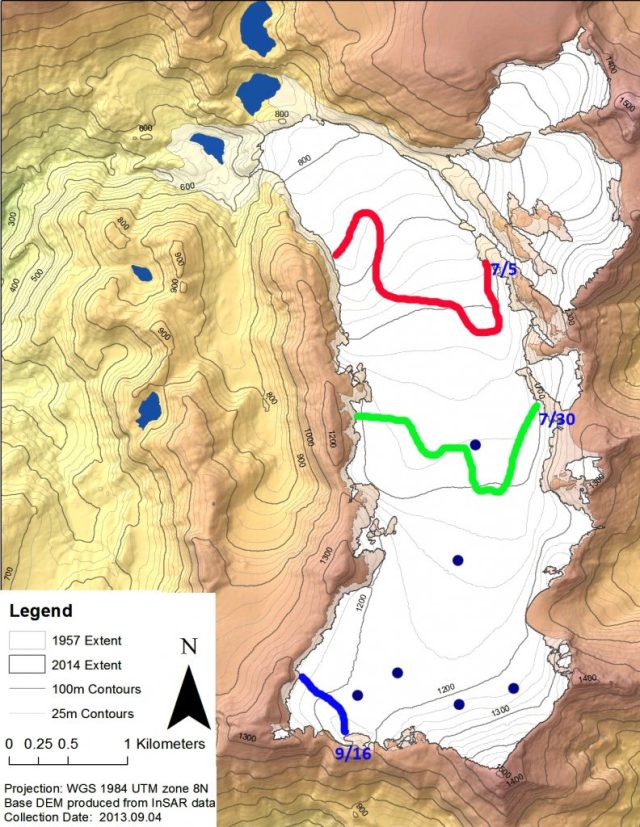
Base map of Lemon Creek Glacier from 2014 prepared by Chris McNeil (JIRP and USGS).  The blue dots are JIRP 2018 snowpit locations and the lines are the snowline on the respective dates. Camp 17 is the JIRP camp used for Lemon Creek Glacier research, including the upcoming 2019 field season.

USGS topographic map based on 1948 aerial photographs. On right is the hillshade image from 2011, margin is the black dots.

Image of the glacier on 9/2/2018 indicating firn horizons and the small remaining snowpack in the southwest corner.

Balance gradient of Lemon Creek Glacier, note the consistency.


Skilak Glacier, Alaska Retreat and Salmon Connection

Skilak Glacier in 1986 and Sept. 2018 Landsat images.  In 1986 icebergs and remnant glacier fill nearly the entire lake.  The snowline in 1986 is at 1200 m and is at 1300 m in 2018. Red arrow is the 1982 terminus location and yellow arrow is the 2018 terminus location. Point A and C are bedrock outcrops at around 1200 m that have expanded.
Skilak Glacier is an outlet glacier on the northwest side  of the Harding Icefield, Kenai Peninsula, Alaska. From 1952-1982 Skilak glacier terminated on a proglacial plain with a broad nearly flat terminal lobe, see map below. The glaciers that drain eastward are in the Kenai Fjords National Park, which has a monitoring program.  From 1950-2005 all 27 glaciers in the Kenai Icefield region examined  retreated (Giffen et al 2014).  Giffen et al (2014) observed that retreated 1,800 m from from 1986-2000, with no retreat from 2000-2005. Here we examine Landsat imagery from 1986-2018 to illustrate the retreat of this glacier, recent snowline elevation and other upglacier changes. The glacier supplies meltwater to Skilak Lake which is a critical salmon habitat for the Kenai.  Chinook Salmon spawn on a section of the Kenai River between Kenai Lake and Skilak Lake. With Skilak Lake being the resulting home for ninety percent of the salmon fry for the Kenai River, and with the most of any nursery in the Cook Inlet area.  Escapements of chinook in the Kenai River exceed 50,000 annually in two runs (Heard et al 2007). Sockeye salmon is the largest run in the river with over 1,000,000 annual in the Kenai River run (Schoen et al, 2017).

In the 1958 USGS map from there is no lake evident at the terminus of the glacier.  The lower 2 km of the glacier is nearly flat.  By 1986 the flat terminus was breaking up with icebergs filling the lake. By 2002 the glacier had retreated 4 km generating a lake with an area of 6.2 square kilometers. The snowline in 2002 was at 1200 m.  The glacier retreated 300 m from 2002 to 2018.  From July 2018 to Sept. 2018 the snowline rose from 1050 m to 1300 m.  Though retreat has been slow since 2002 upglacier thinning has been substantial At Point A and C from 1986 to 2018 and at Point A and B from 2002-2018. This will drive additional retreat.  The retreat rate should be more in line with that of the neighboring Harris Glacier. 

Skilak Glacier  1958 Map prior to lake formation.

Skilak Glacier in 2002 and July 2018 Landsat images.  In 2002 is at 1100 m and is at 1150 m in July 2018. Red arrow is the 1982 terminus location and yellow arrow is the 2018 terminus location. The orange arrow indicates indicated banded snow formation.  Point A and B are bedrock outcrops at around 1200 m that have expanded.


Hindle Glacier Retreat, South Georgia 2 km 2015-2019

Hindle Glacier comparison in 2017 and 2019 Landsat images.  Red arrow is 1989 terminus, pink arrow the 2015 terminus, yellow arrow the 2017 terminus location and green arrow the 2019 terminus location. 

South Georgia is south of the Polar Front preventing any truly warm season, with the cool maritime climate leading to numerous glaciers covering a majority of the island.  Hindle Glacier enters Royal Bay on the east coast of South Georgia Island.  The British Antarctic Survey (BAS) has been the principal research group examining glacier change on South Georgia Island.  Cook et al (2010) and Gordon et al (2008) noted a pattern island wide with many calving glaciers having the fastest retreat.  Gordon et al., (2008) observed that larger tidewater glaciers remained in relatively advanced positions from the 1950’s until the 1980’s, followed by significant recession.   Alison Cook at British Antarctic Survey identified that 212 of the Peninsula’s 244 marine glaciers have retreated over the past 50 years and rates of retreat are increasing.   In 2017 we examined Landsat imagery from 1989 to 2017 to identify the rapid retreat rate.  NASA Earth  piggy backed on this assessment, with excellent imagery, since the retreat rate has increased. Here we update the retreat with 2019 Landsat images.

For Ross-Hindle the retreat was minimal from 1960 to 1989 with the glaciers joined   In 1989 the glaciers joined 2.5  km from the terminus. The glacier spanned Royal Bay with a 3.2 km wide calving front.  By 2002 the glacier front had retreated 800 m, but they were still joined. By 2008 the glaciers had separated due to an additional retreat of  1.4 km. The front was now retreating south up a separate embayment from Ross Glacier.  The calving front in 2008 was 1.6 km wide.  By 2015 further retreat led to the separation of Hindle from an eastern tributary at the first prominent headland in the fjord, a 1.6 km retreat in seven years.  By 2017 an additional 600 m of retreat had occurred.  From 2017 to 2019 the terminus retreated another 1.5 km back to a prominent rock knob separating the two main tributaries of the glacier with total retreat of  6.1 km in 30 years. This is a rate of over 200 m/year, which is an exceptional rate.  Over the 2015-2019 period the glacier retreaeted over 2 km, more than 500 m/year. The western tributary appears to be at the head of the fjord, while the eastern tributary has another 1 km to an increase in slopes that likely is close to head of the fjord. The new fjord is 4.5 km long and averages 1.1 km in width.  This embayment will open up new areas for Gentoo Penguins and elephant seals to immigrate into.  Levy et al (2016) discuss the shift and dispersal of colonies in the region, that climate change is an important driver of.

Map of terminus retreat of Ross and Hindle Glacier from the BAS.  Green Pin Locations are Gentoo Penguin colonies. 

Hindle Glacier comparison in 1989 and 2015 Landsat images.  Red arrow is 1989 terminus, pink arrow the 2015 terminus, yellow arrow the 2017 terminus location and green arrow the 2019 terminus location.