Decrease in Glacier Mass Balance uses measurements from 1980-2014 of the average mass balance for a group of North Cascade, WA glaciers. Mass balance is the annual budget for the glaciers: total snow accumulation minus total snow ablation. Not only are mass balances consistently negative, they are also continually decreasing. Glaciers have been one of the key and most iconic examples of the impact of global warming.
BAMS State of Climate 2015 asked me about featuring some of the glacier images for the cover, and I countered with a suggestion to utilize one of a series of paintings by Jill Pelto that illustrate the impact of climate change magnifying the impact of the data. Below are sections of this years report that focus on glaciers.
Glaciers and ice caps (outside Greenland)
M. Sharp, G. Wolken, L.M Andreassen, A. Arendt, D. Burgess, J.G. Cogley, L. Copland, J. Kohler, S. O’Neel, M. Pelto, L.Thompson, and B. Wouters
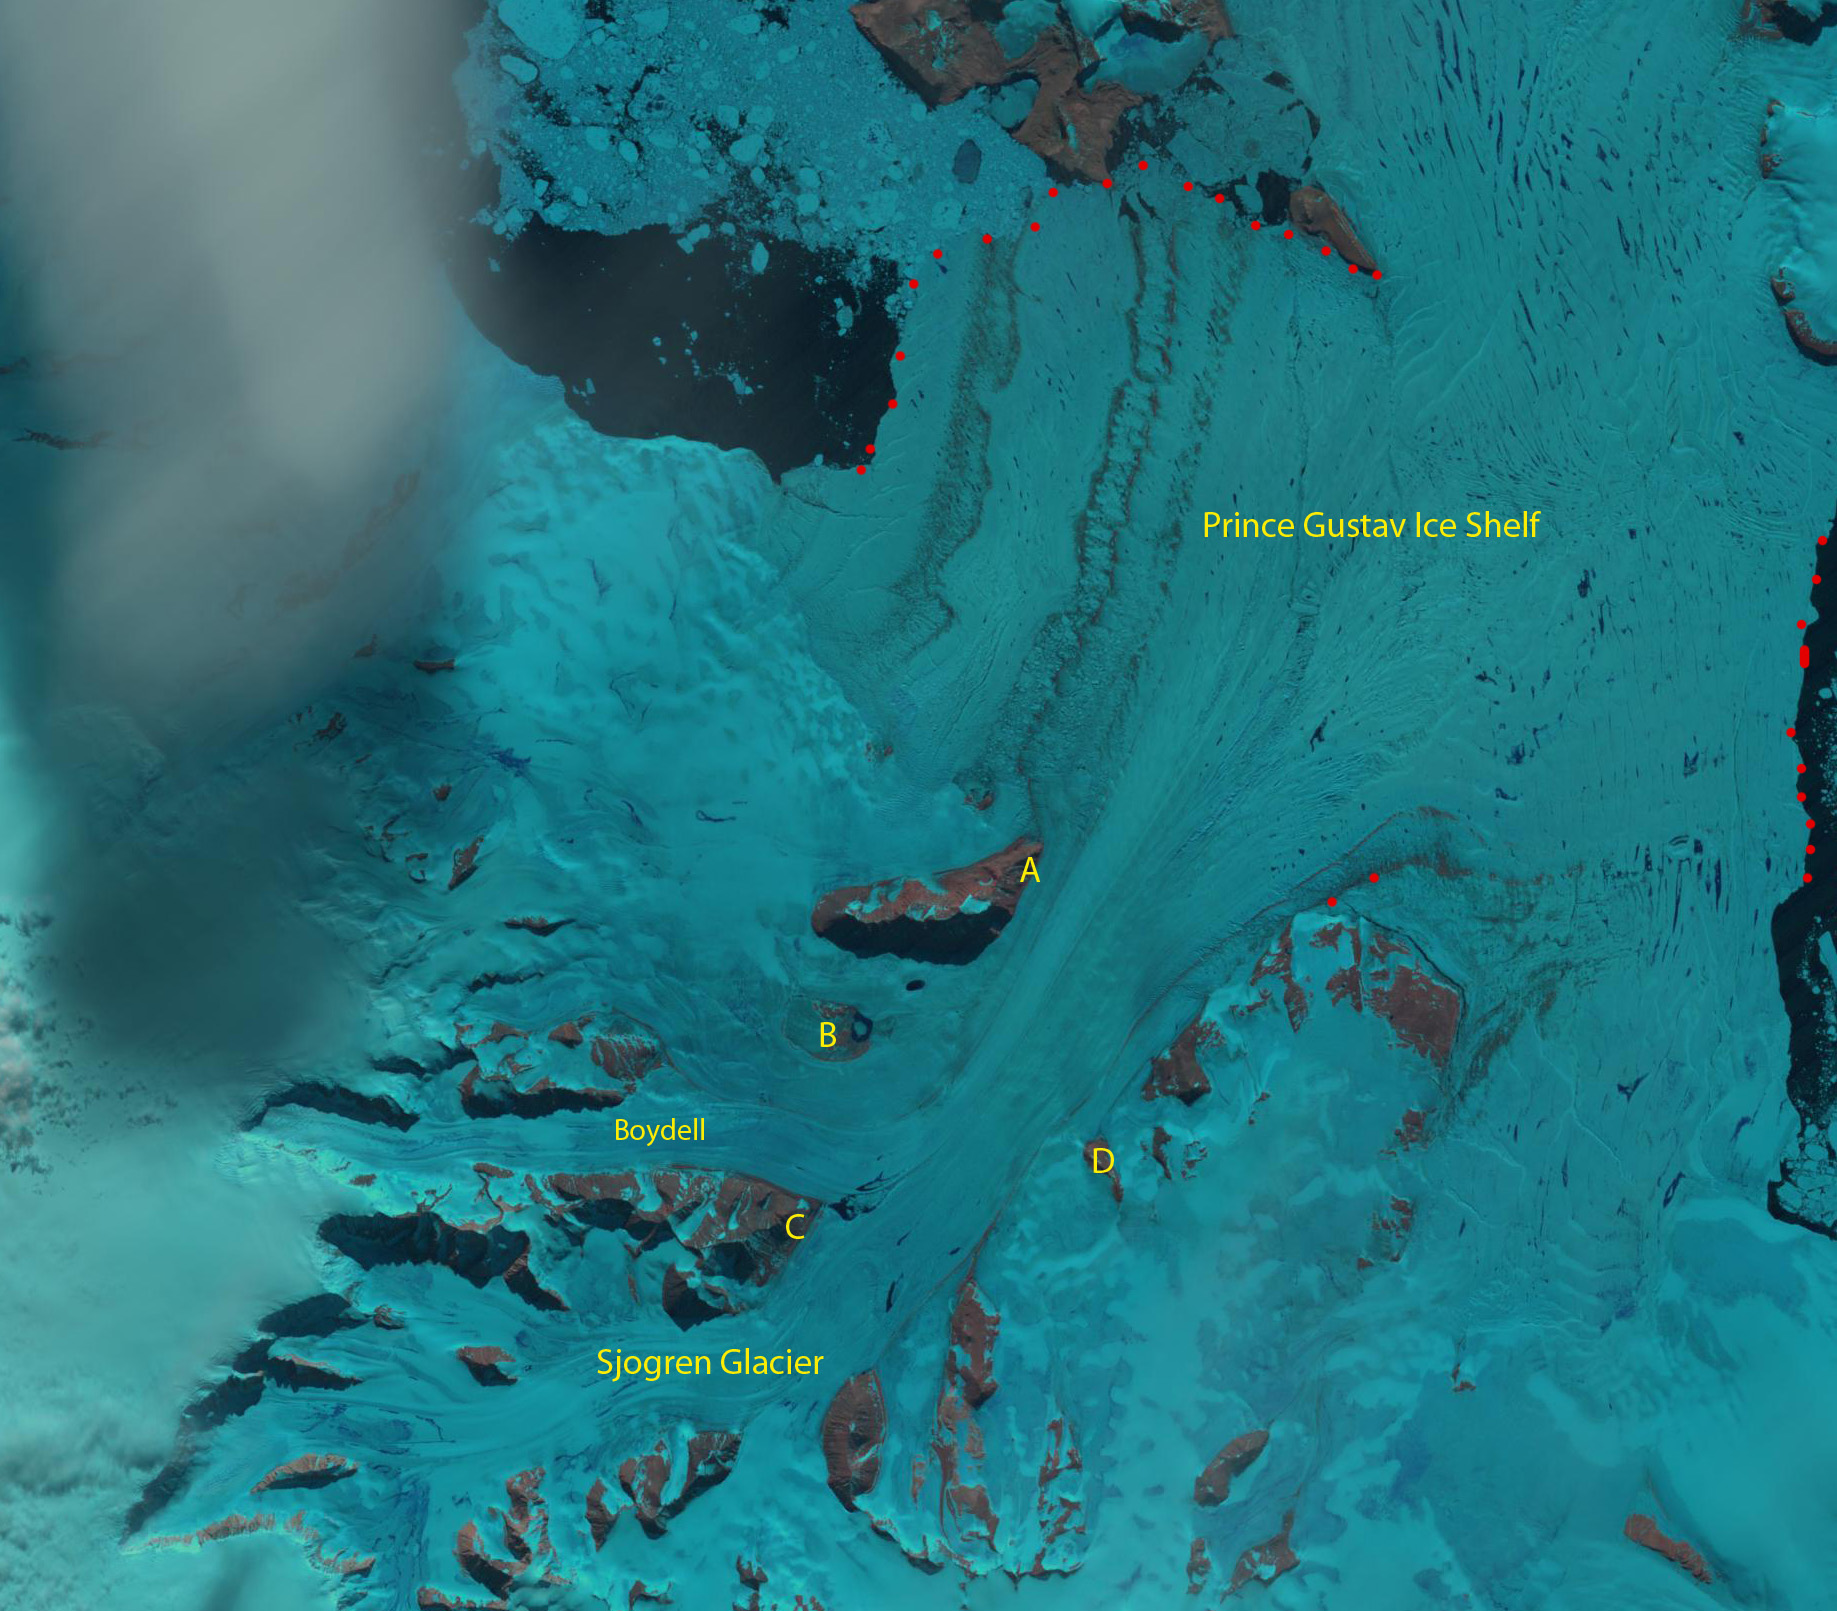
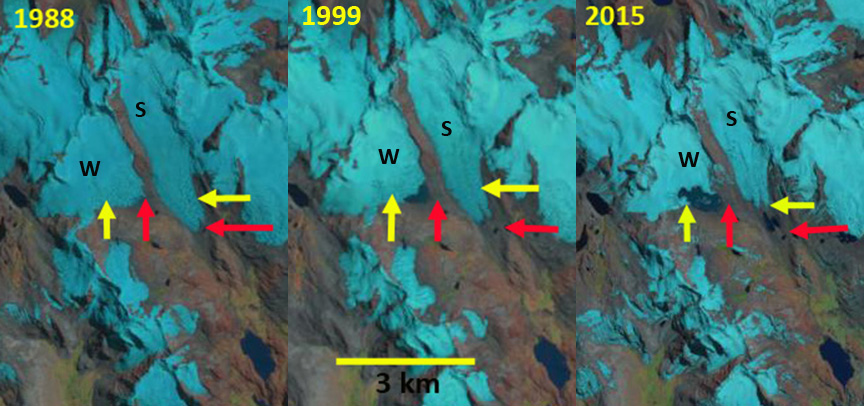
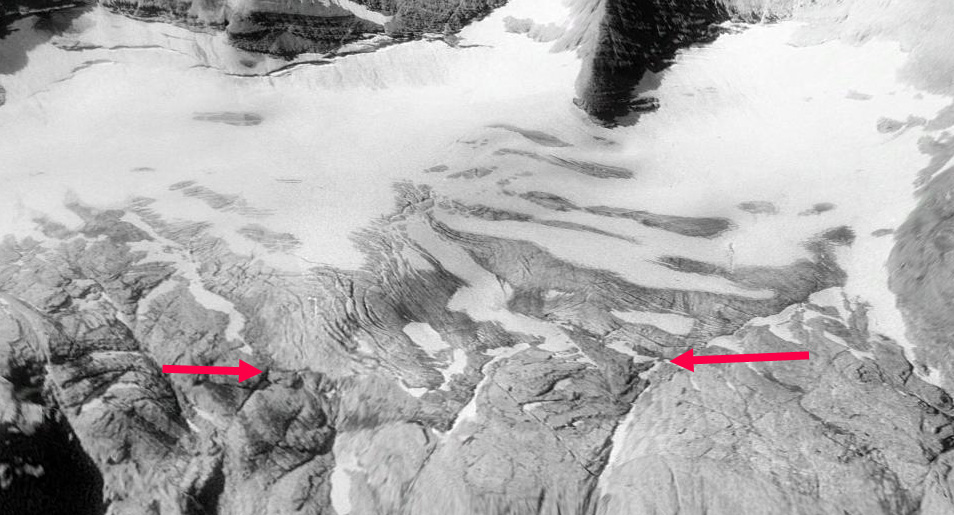
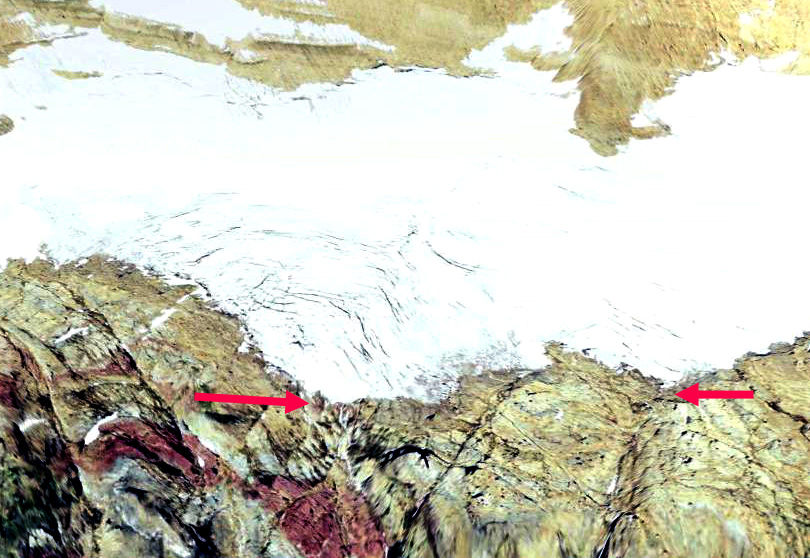
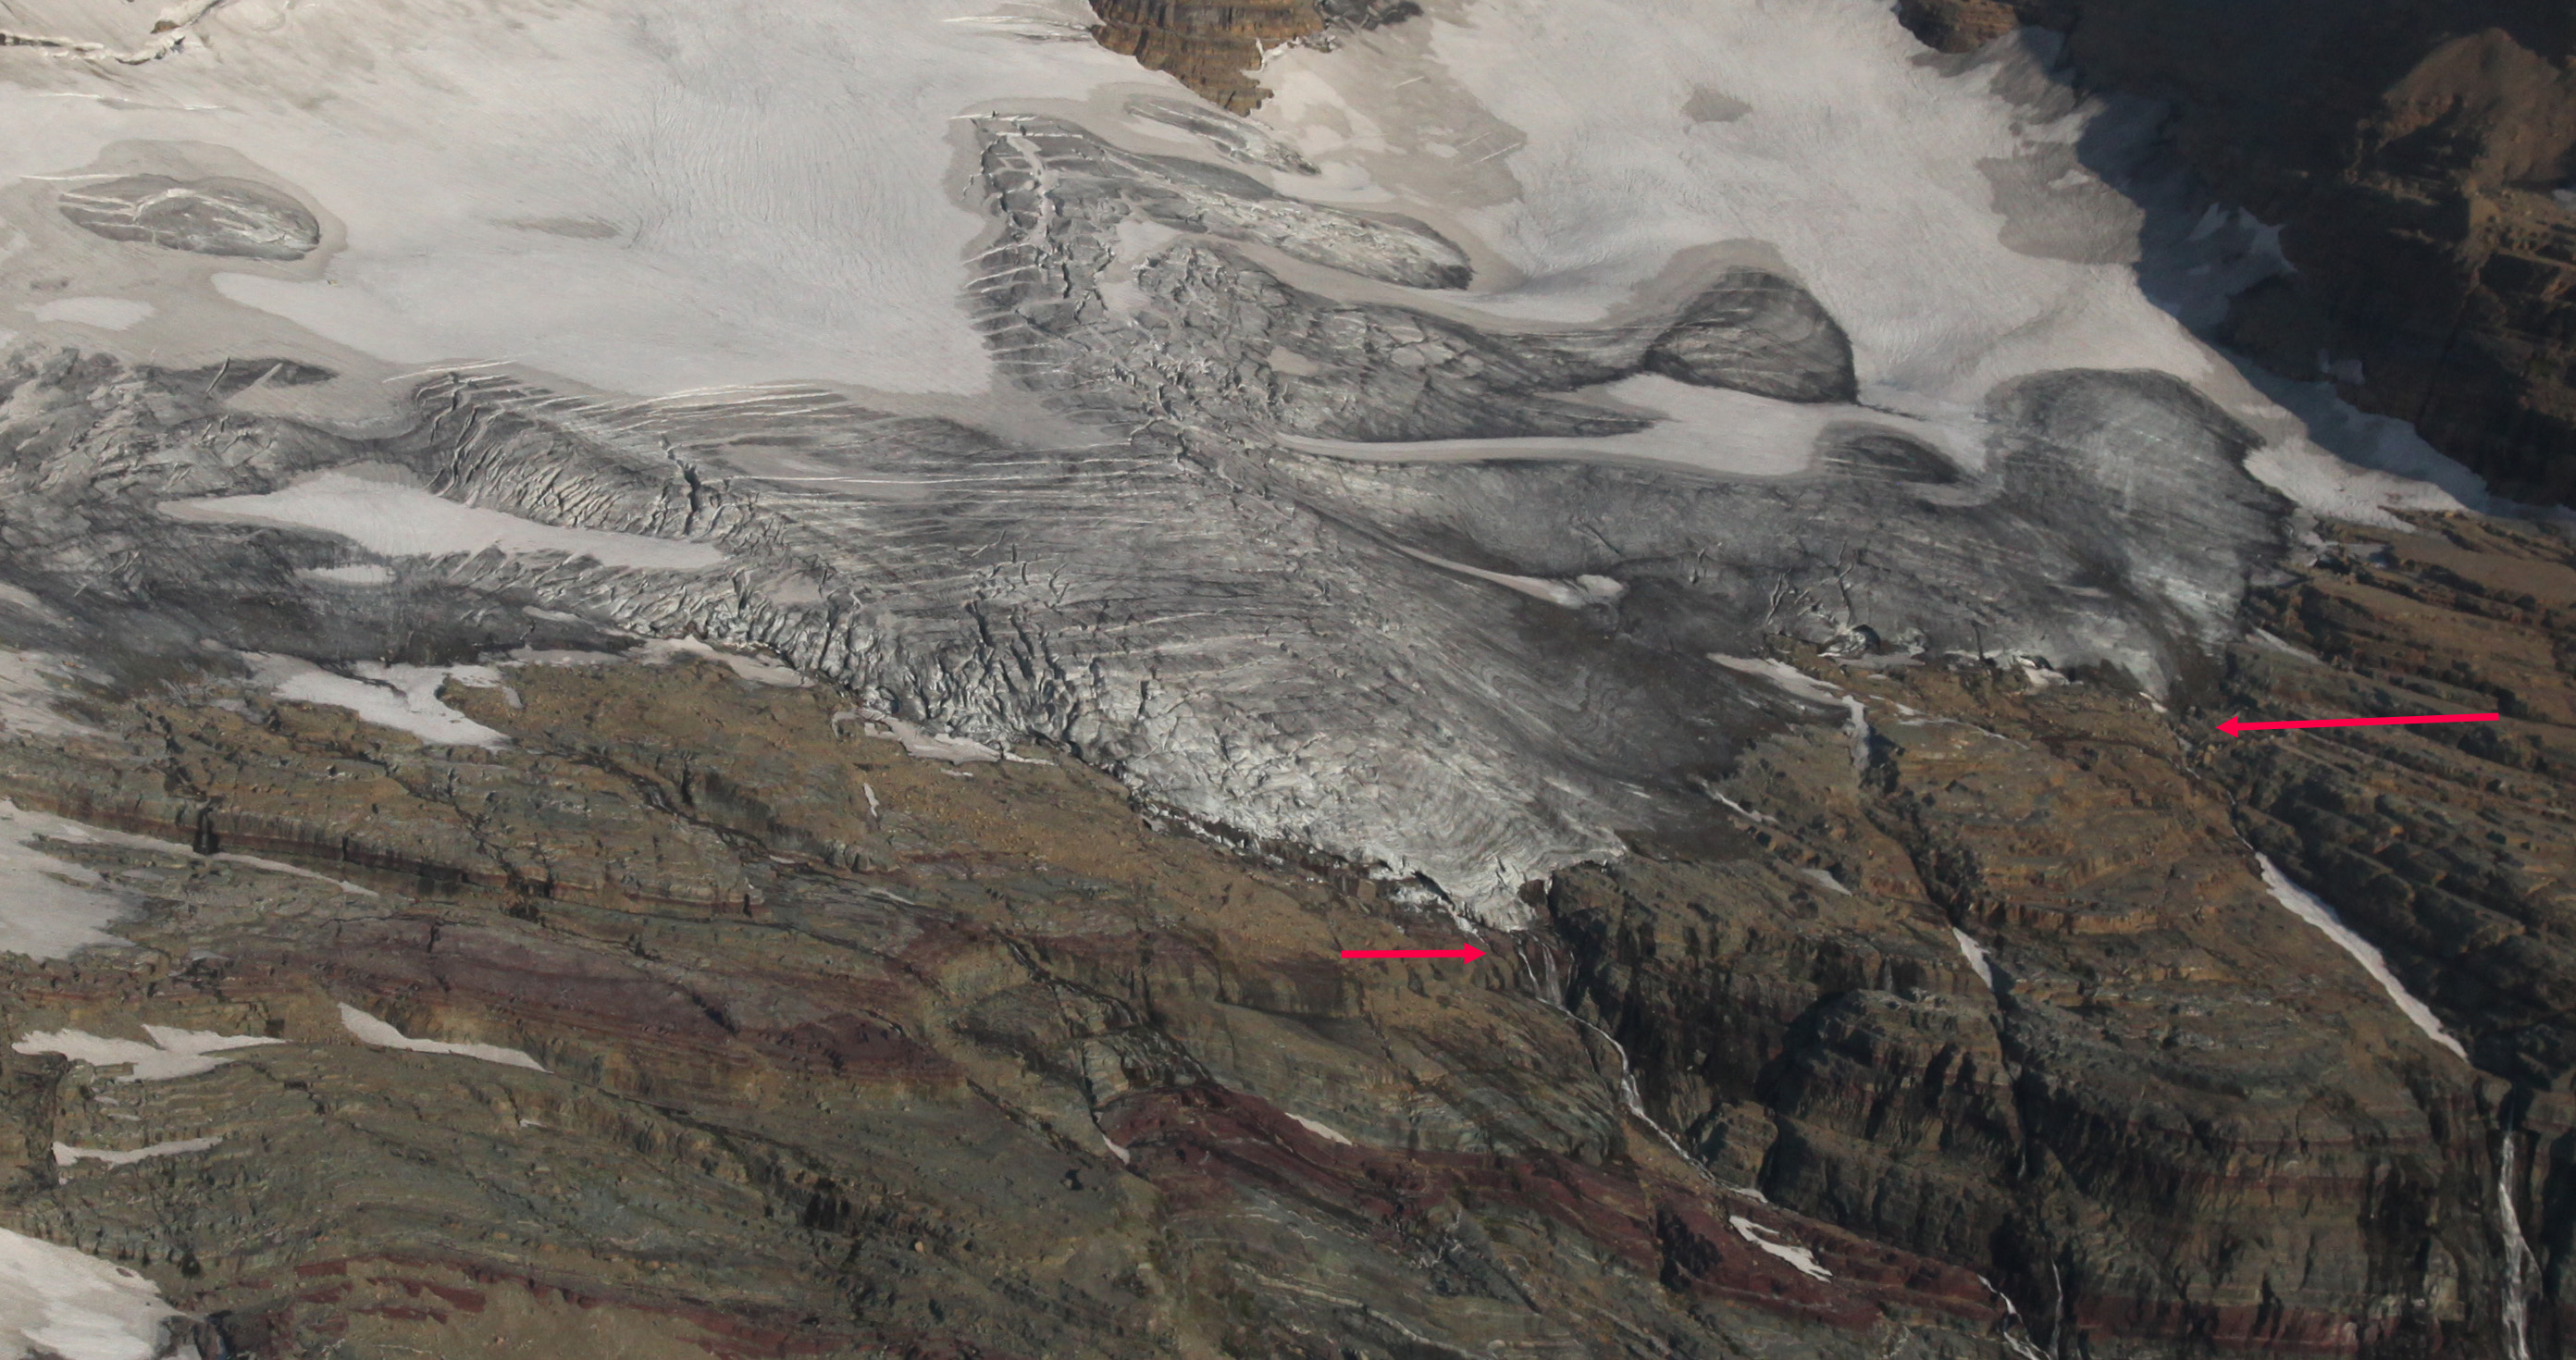
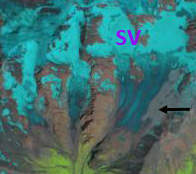
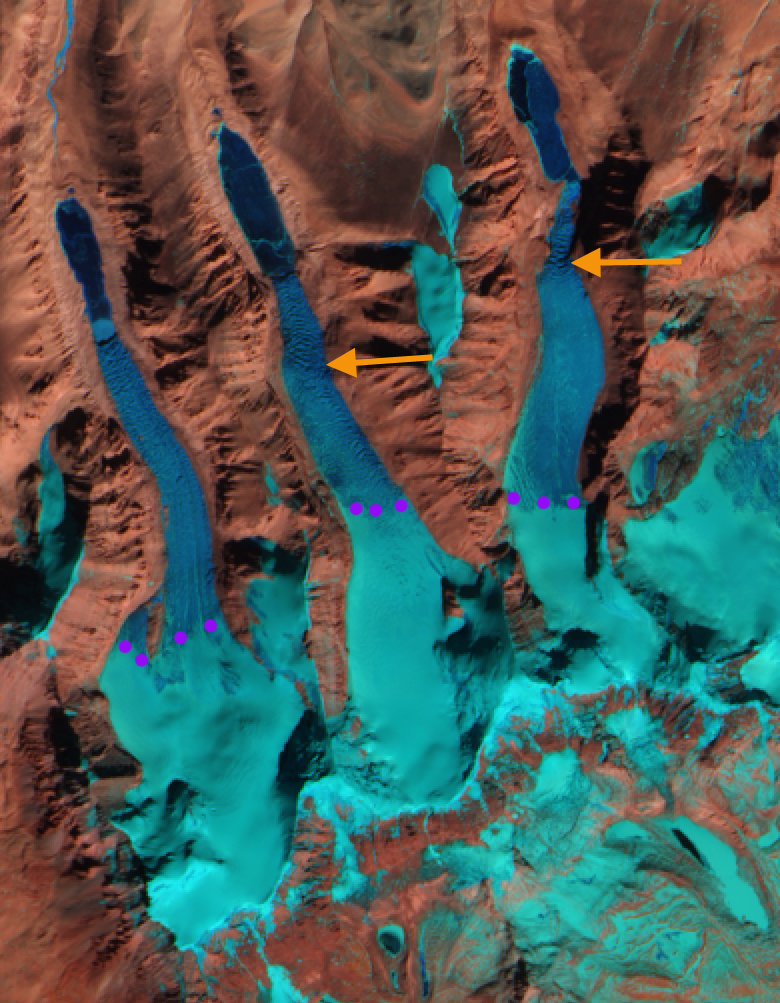
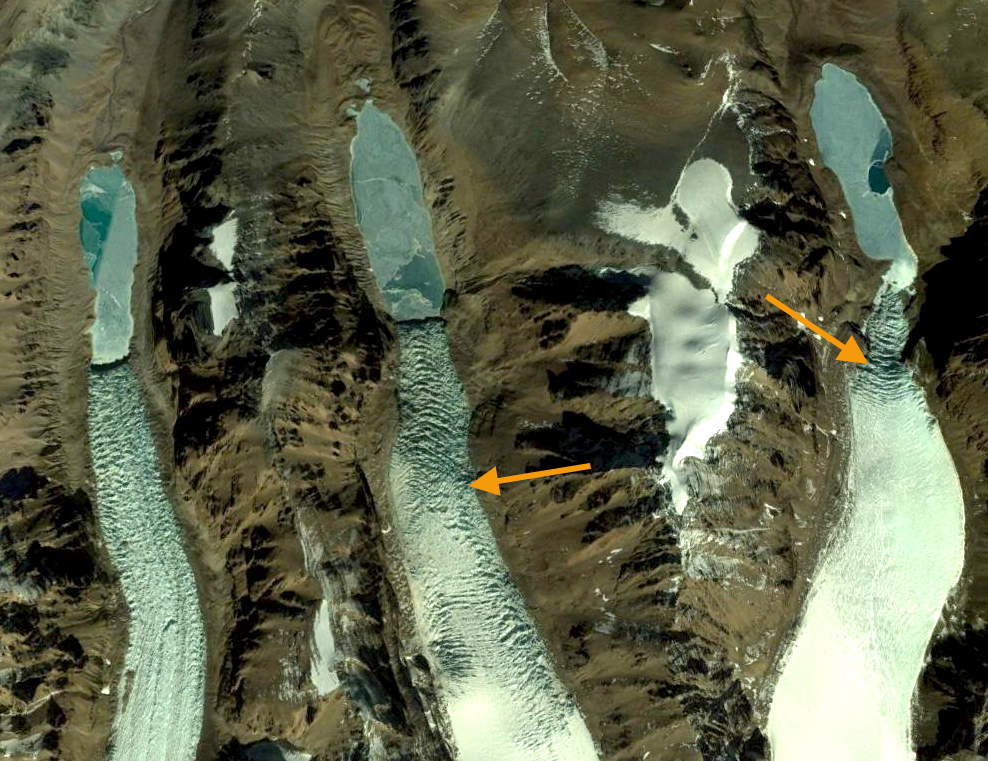
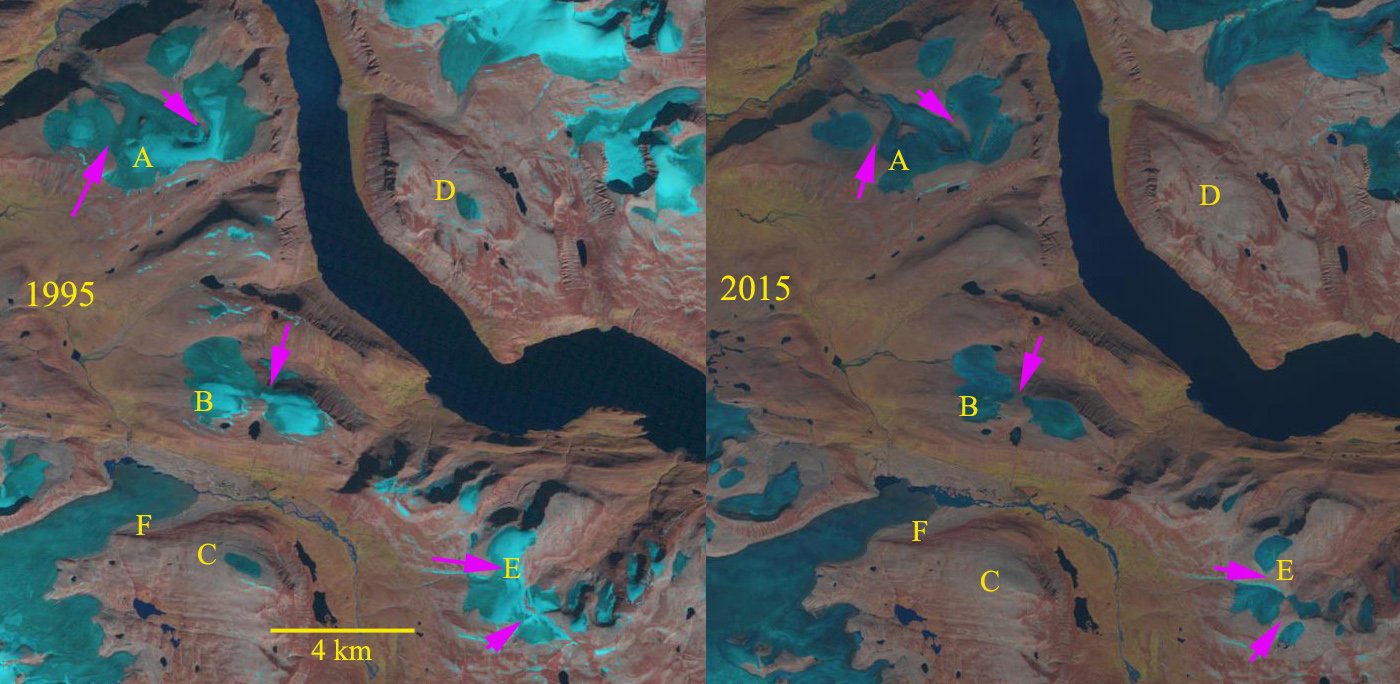
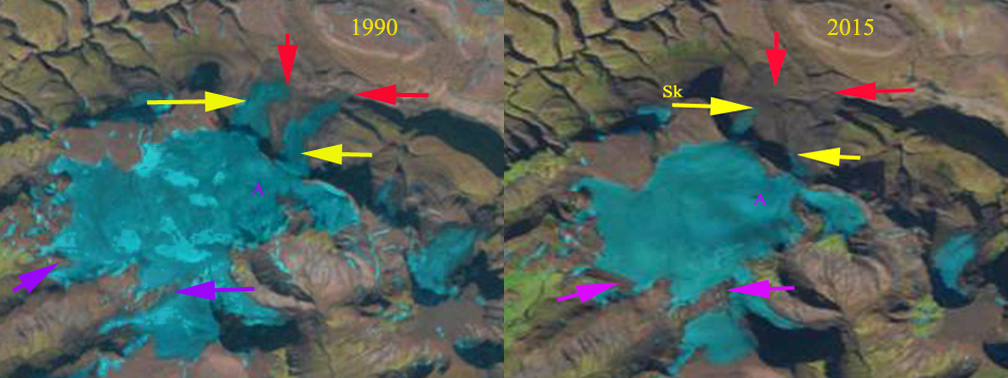
Among the seven glaciers for which 2014-2015 annual mass balance have been reported, the mass balances of glaciers in Alaska and Svalbard (three each) were negative, while the balance for Engabreen Glacier in Norway was positive. The pattern of negative balances in Alaska and Svalbard is also captured in time series of regional total stored water estimates, derived using GRACE satellite gravimetry, which are a proxy for regional total mass balance (ΔM) for the heavily glacierized regions of the Arctic (Figure 3). Measurements of ΔM in 2014-2015 for all the glaciers and ice caps in Arctic Canada and the Russian Arctic also show a negative mass balance year. The GRACE-derived time series clearly show a continuation of negative trends in ΔM for all measured regions in the Arctic. These measurements of mass balance and ΔM are consistent with anomalously warm (up to +1.5ºC) summer air temperatures over Alaska, Arctic Canada, the Russian Arctic, and Svalbard in 2015, and anomalously cool temperatures in northern Scandinavia, particularly in early summer (up to -2ºC). The warmer temperatures led to higher snowlines in the aforementioned regions as seen in images below.
Baffin Island Ice Cap near Clephane Bay indicate limited snowpack in 2015
Frostisen Ice Cap, Svalbard with limited 2015 snowpack.
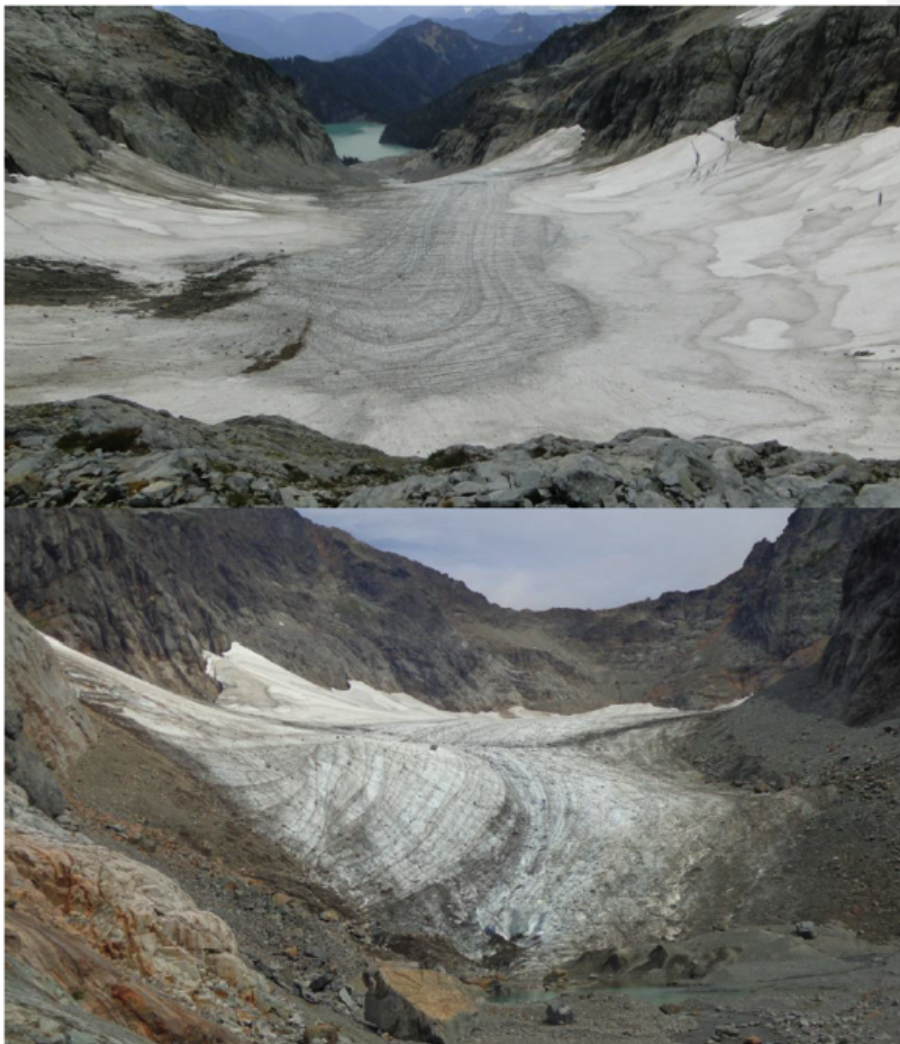
Alpine Glaciers
M.Pelto
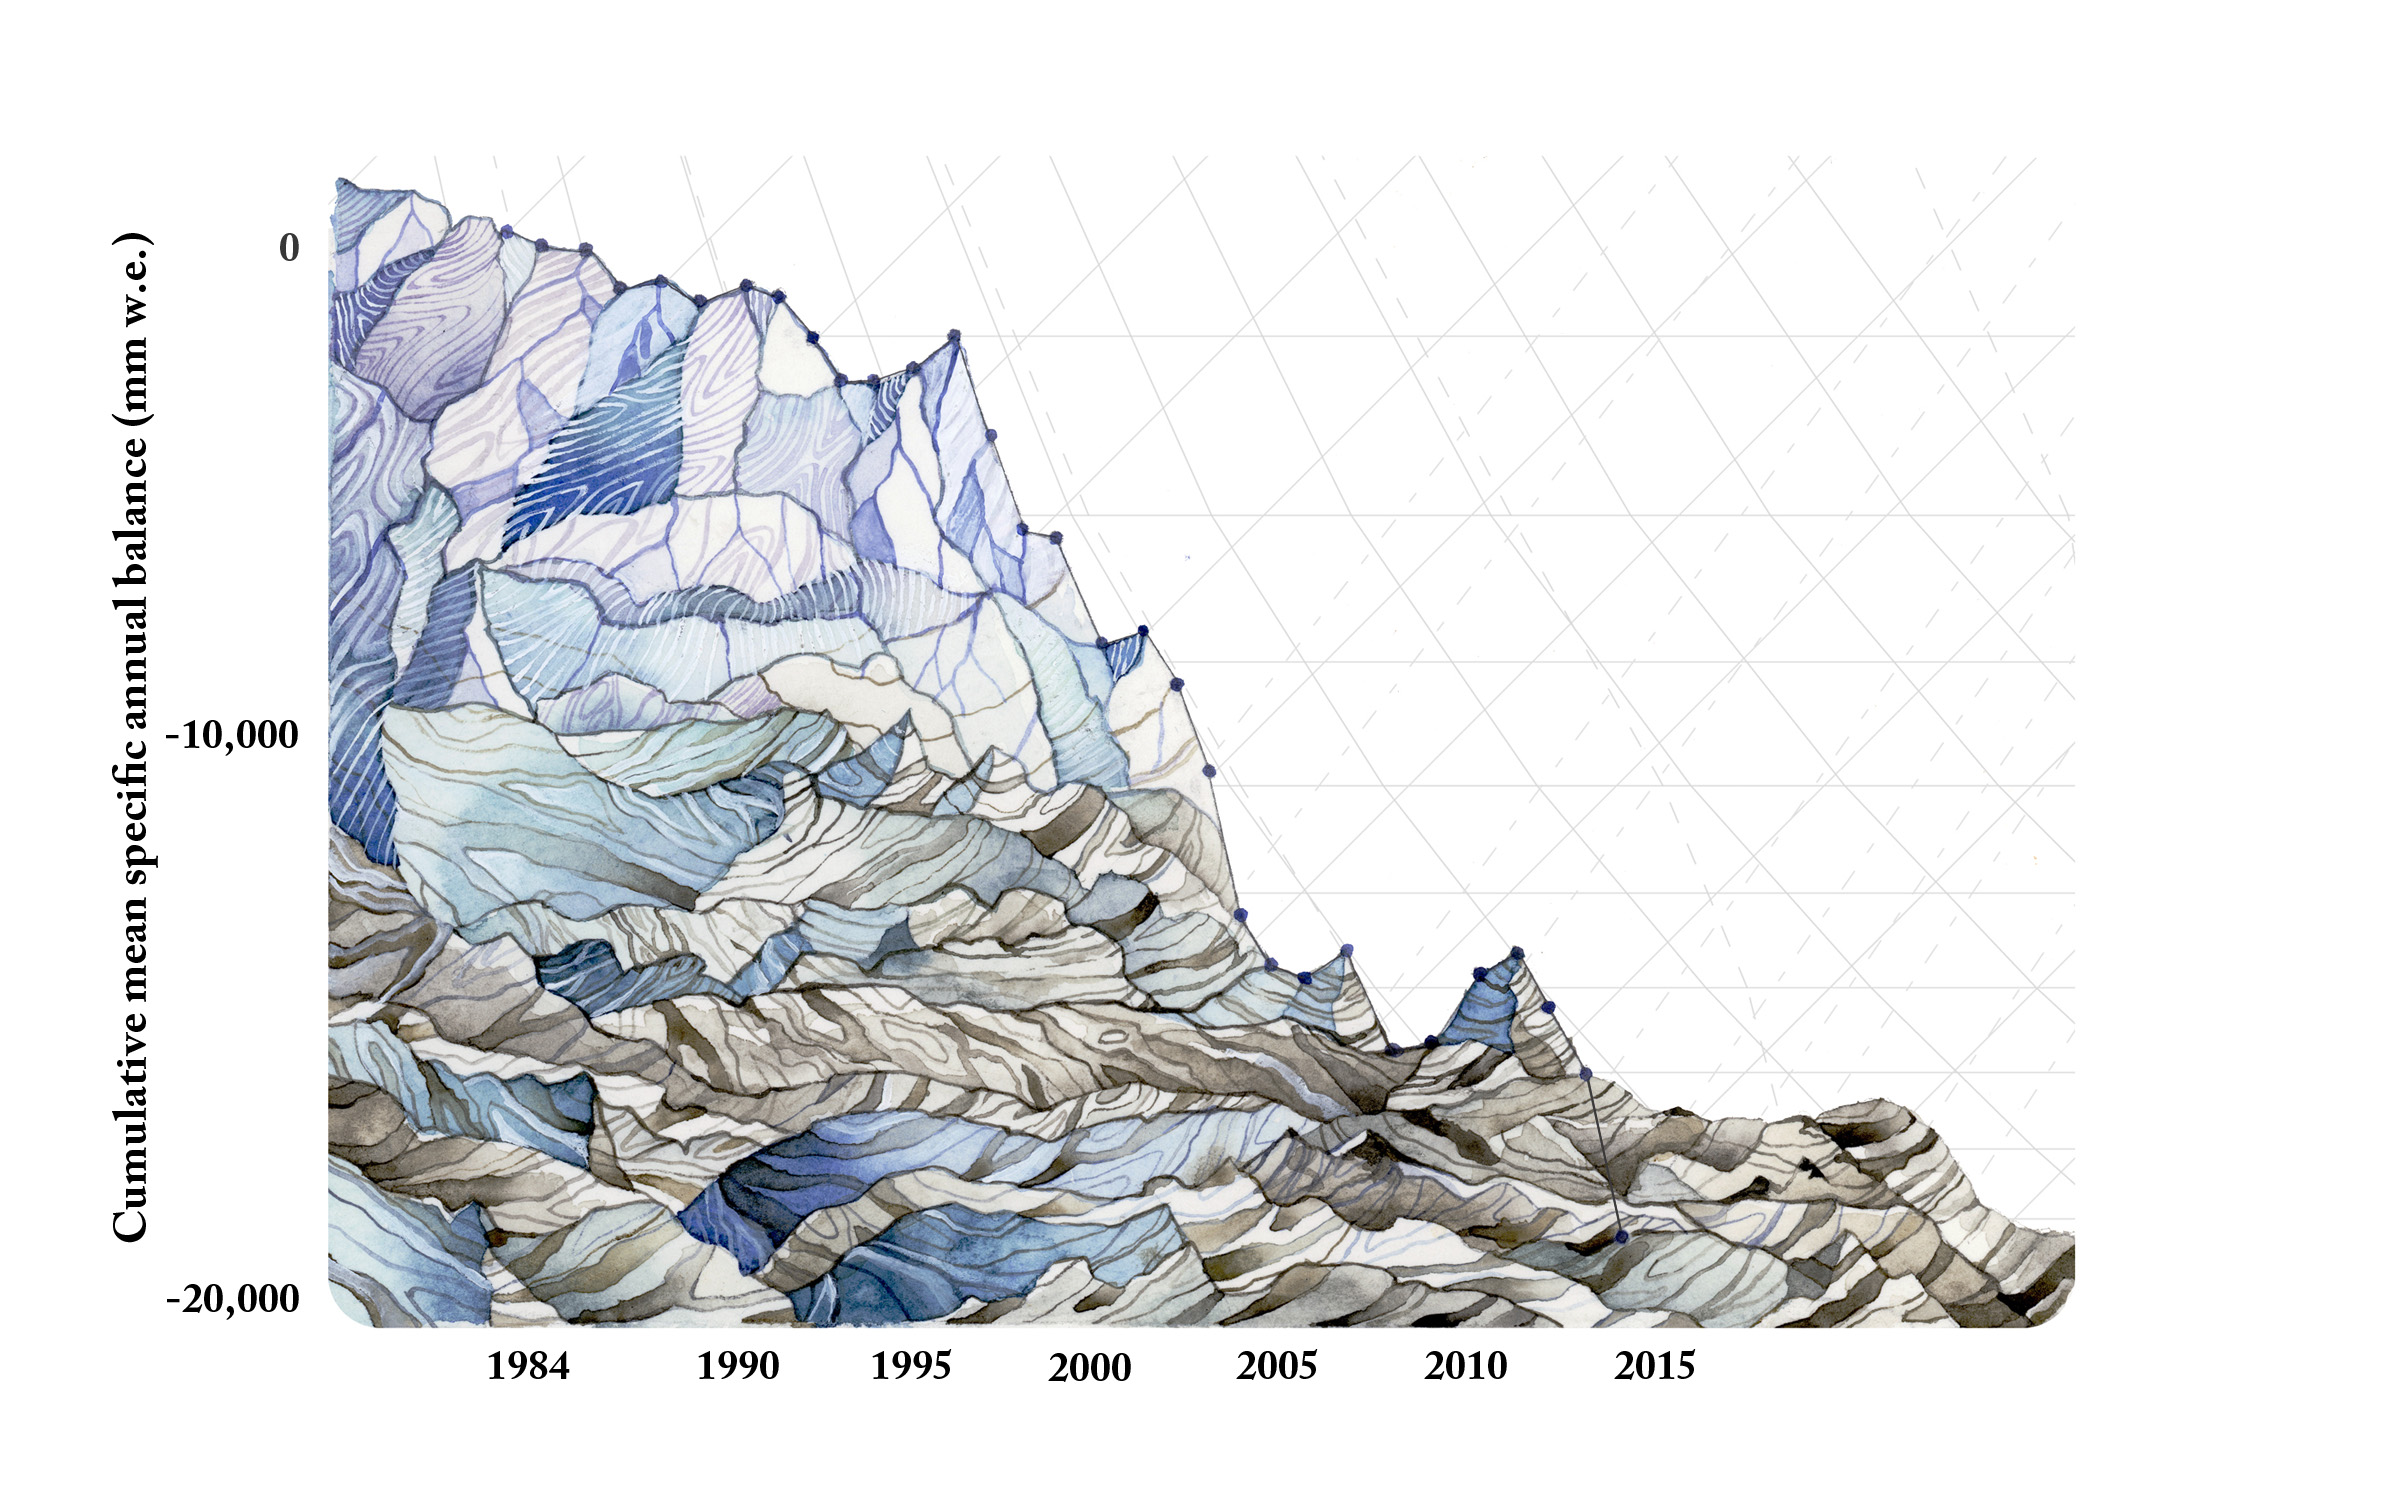
Preliminary data for 2015 from 16 nations with more than one reporting glacier from Argentina, Austria, Canada, Chile, Italy, Kyrgyzstan, Norway, Switzerland, and United States indicate that 2015 will be the 32nd consecutive year of negative annual balances with a mean loss of -1169 mm for 33 reporting reference glaciers and -1481 mm for all 59 reporting glaciers. The number of reporting reference glaciers is 90% of the total whereas only 50% of all glaciers that will report have submitted data thusfar. The 2015 mass balance will likely be comparable to 2003, the most negative year at -1268 mm for reference glaciers and -1198 mm for all glaciers.
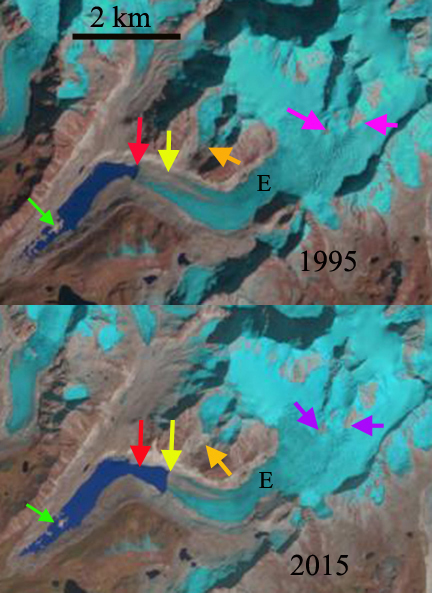
The cumulative mass balance loss from 1980-2015 is 18.8 m, the equivalent of cutting a 20.5 m thick slice off the top of the average glacier (Figure 1). The trend is remarkably consistent from region to region (WGMS, 2015). The decadal mean annual mass balance was -261 mm in the 1980’s, -386 mm in the 1990’s, –727 mm for 2000’s and -818 mm from 2010-2015. The declining mass balance trend during a period of retreat indicates alpine glaciers are not approaching equilibrium and retreat will continue to be the dominant terminus response (Zemp et al., 2015). The recent rapid retreat and prolonged negative balances has led to many glaciers disappearing and others fragmenting (Pelto, 2010; Carturan et al, 2015).
In South America seven glaciers in Columbia, Argentina and Chile reported mass balance. All seven glaciers had losses greater than 1200 mm, with a mean of -2200 mm. These Andes glaciers span 58 degrees of latitude.
In the European Alps, mass balance has been reported for 14 glaciers from Austria, France, Italy and Switzerland. All 14 had negative balances exceeding 1000 mm, with a mean of -1865 mm. This is an exceptionally negative mass balance rivaling 2003 when average losses exceeded -2000 mm.
In Norway mass balance was reported for six glaciers in 2015, all six were positive with a mean of 780 mm. This is the only region that had a positive balance for the year. In Svalbard six glaciers reported mass balances, with all six having a negative mass balance averaging -675 mm.
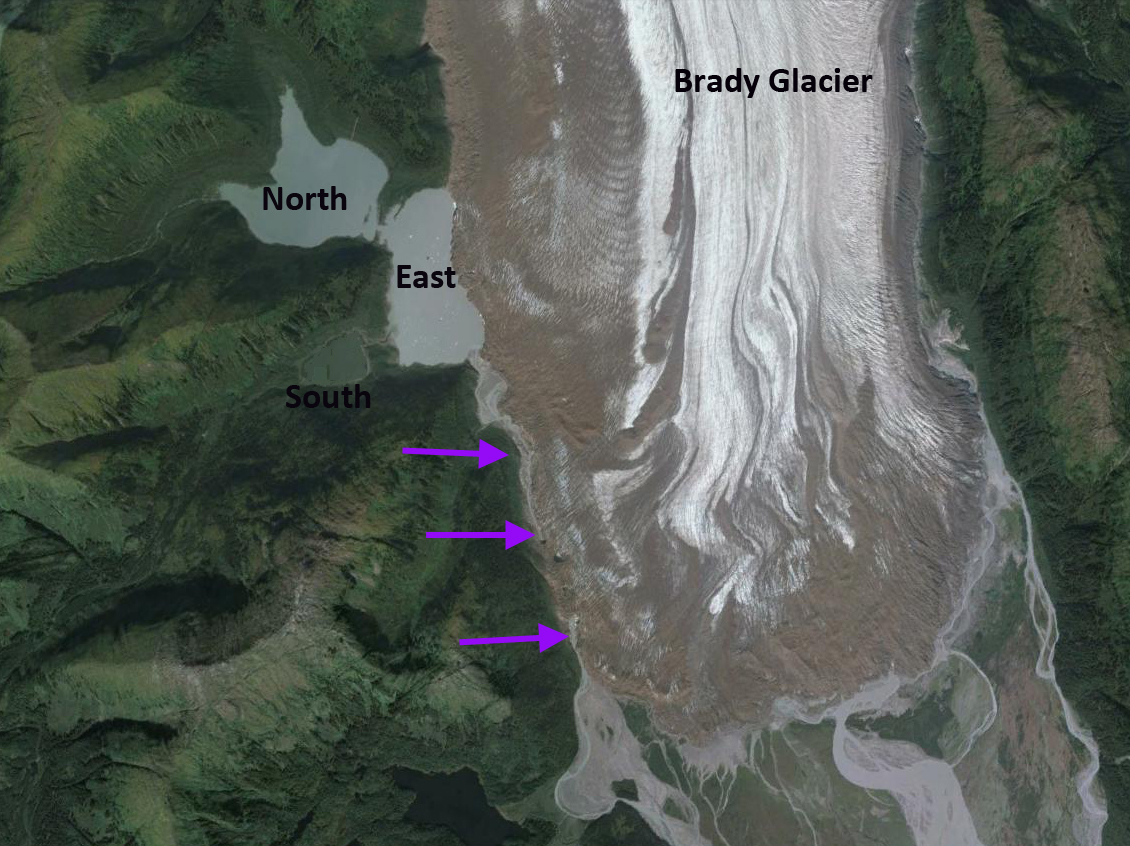
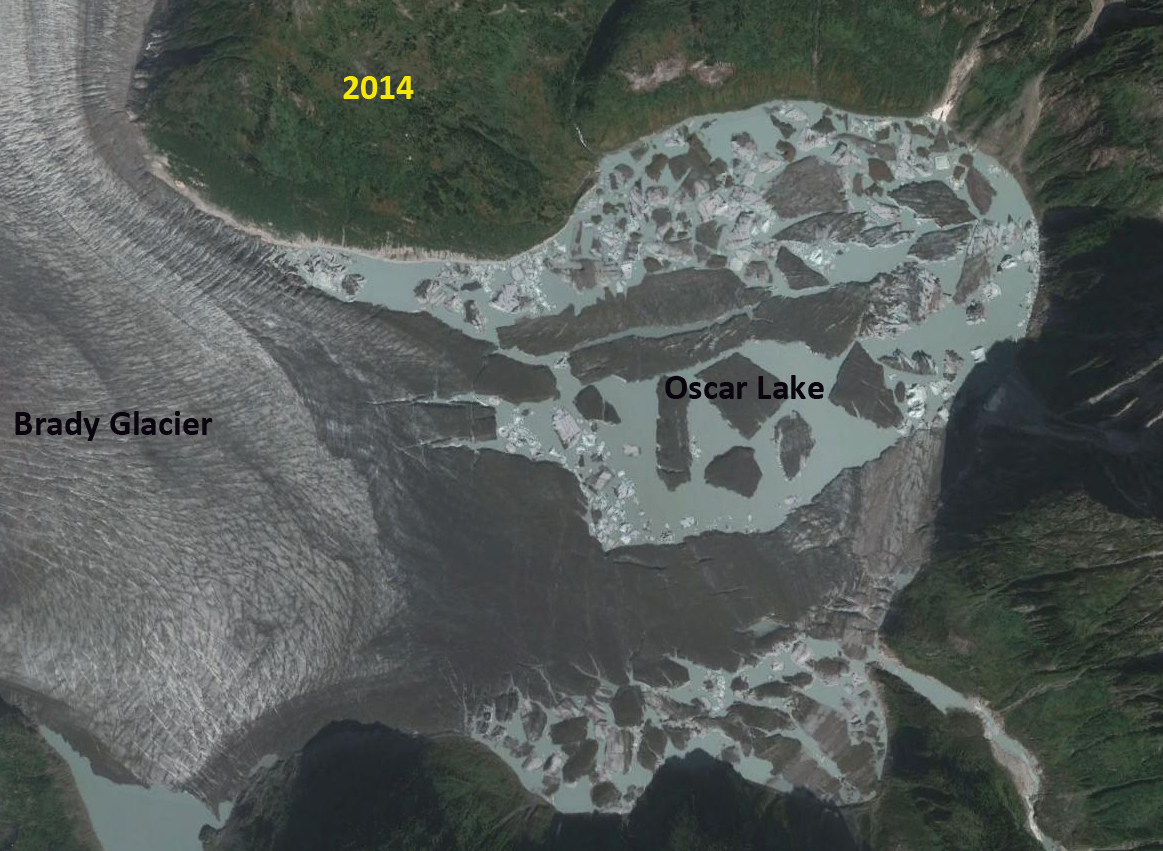
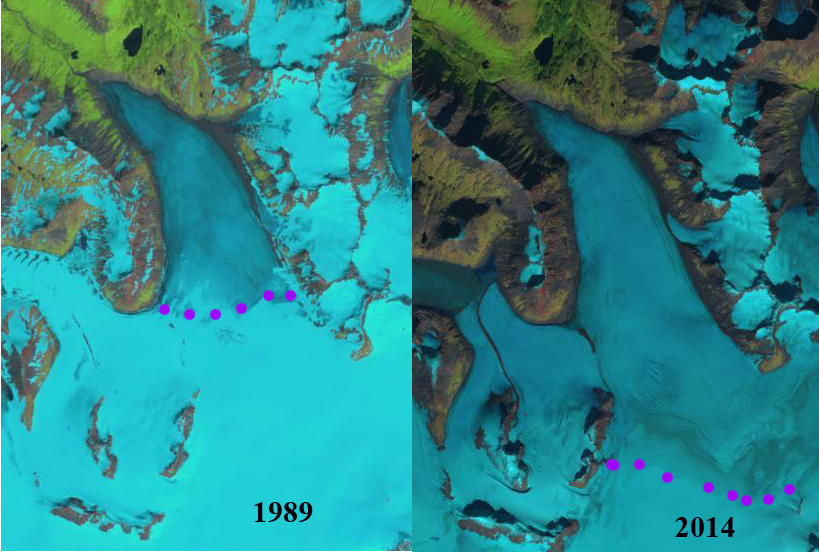
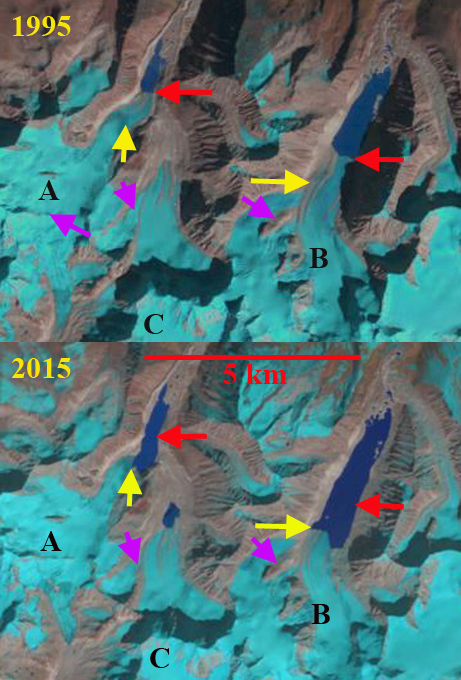
In Alberta, British Columbia, Washington and Alaska mass balance data from 17 glaciers was reported with a mean loss of -2590 mm, with all 17 being negative. This is the most negative mass balance for the region during the period of record. From Alaska south through British Columbia to Washington the accumulation season temperature was exceptional with the mean for November-April being the highest observed.
In the high mountains of central Asia six glaciers from Russia, Kazakhstan, and Kyrgyzstan reported data, all were negative with a mean of -660 mm.
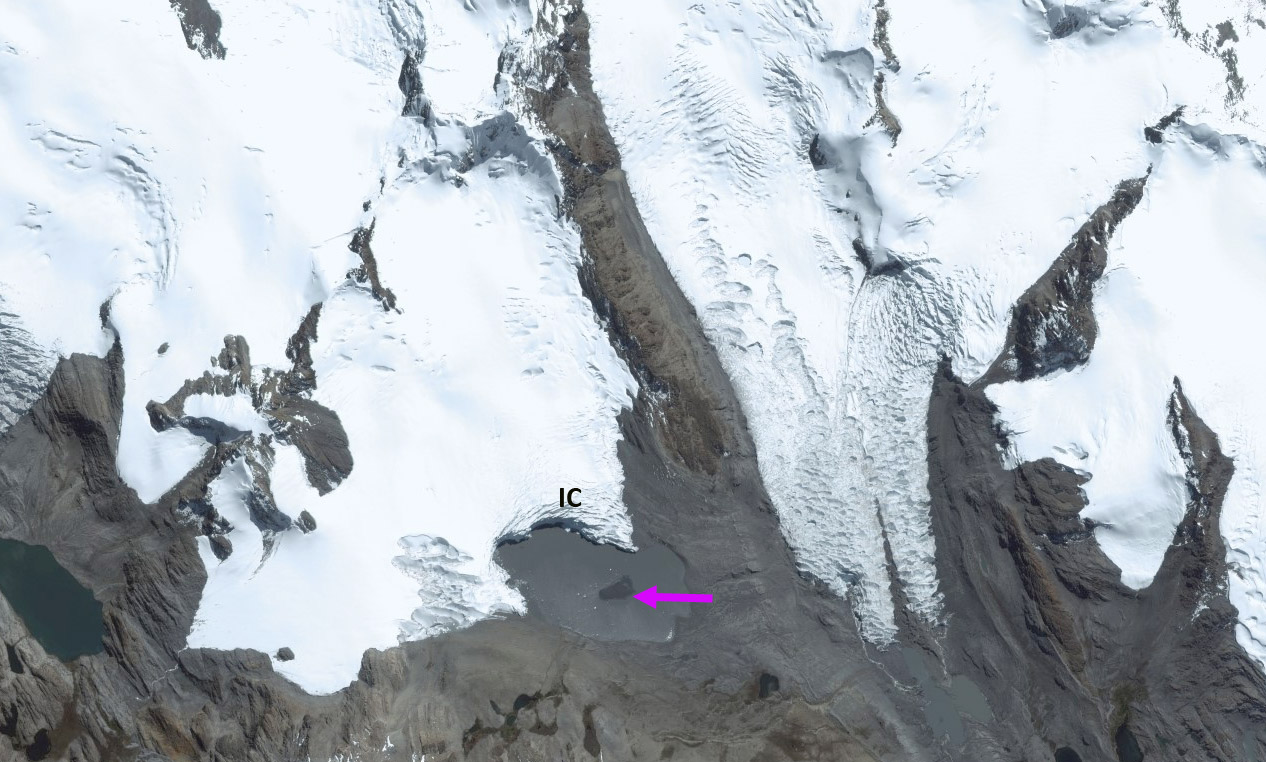
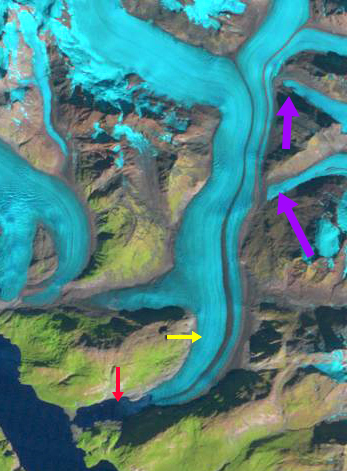
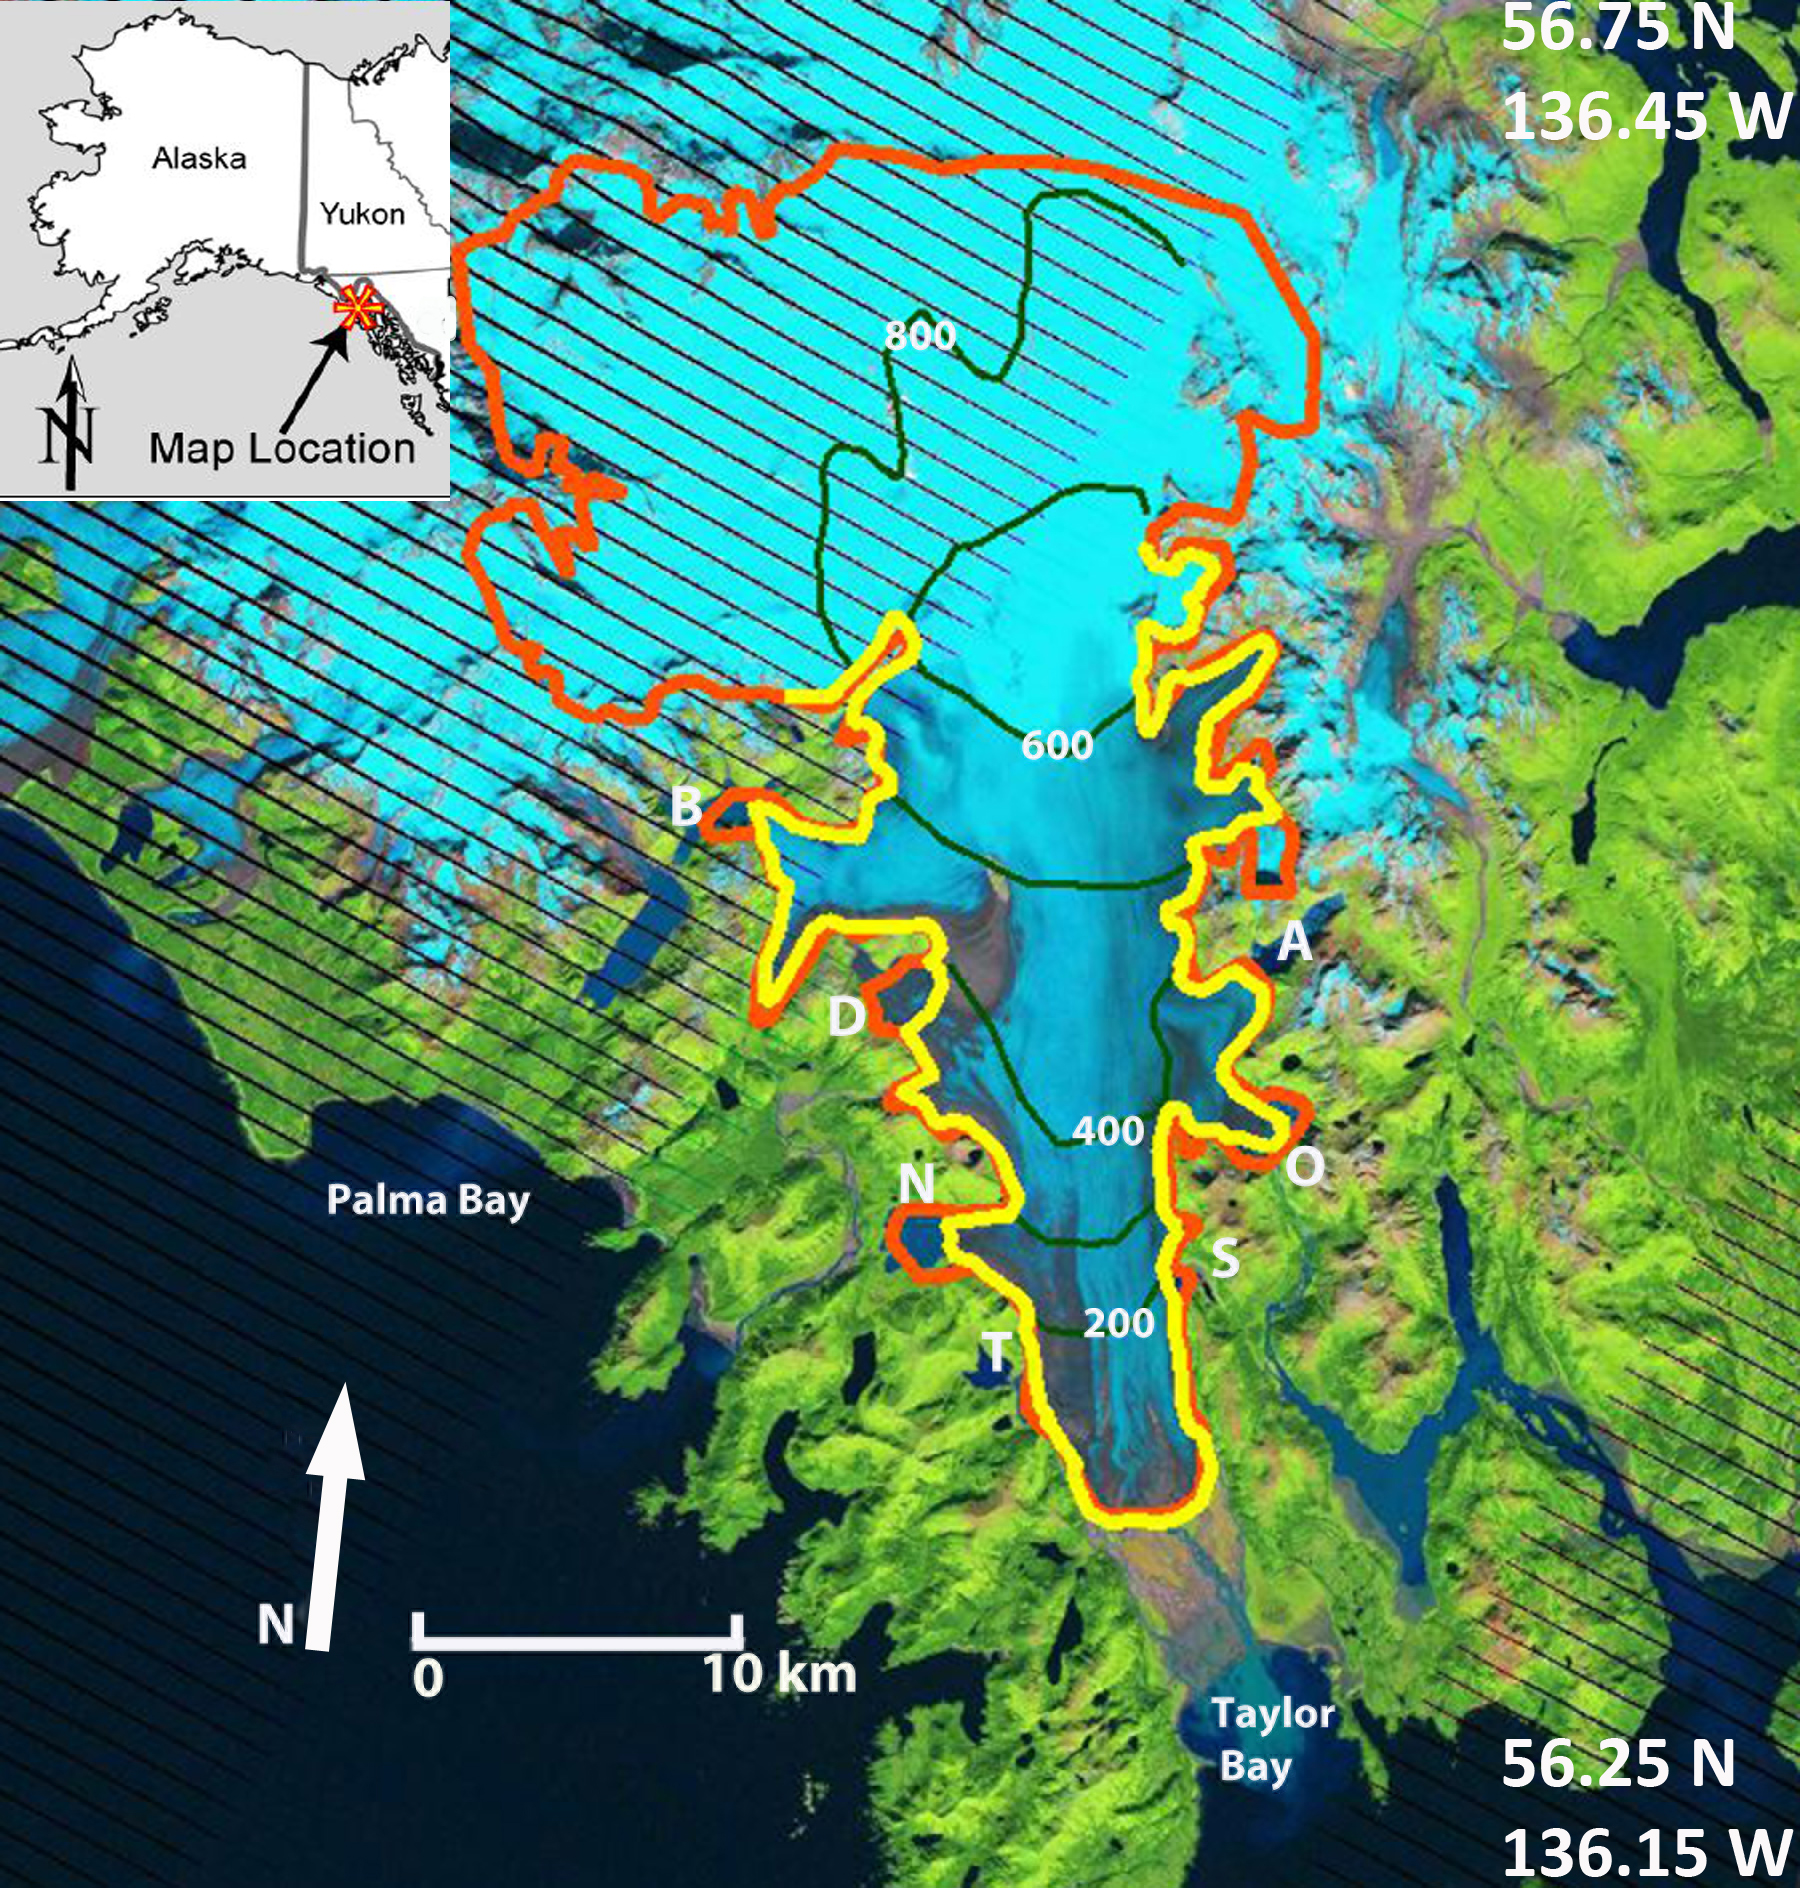
Columbia Glacier having lost nearly all of its snowcover by early August had its most negative mass balance of any years since measurements began in 1984