Gilkey Glacier drains the west side of the Juneau Icefield and has experienced widespread significant changes since I first worked on the glacier in 1981. Here we examine the changes from the August 17, 1984 Landsat 5 image to the August 21, 2014 image from newly launched Landsat 8. Landsat 5 was launched in 1984, Landsat 8 launched in 2013. The Landsat images have become a key resource in the examination of the mass balance of these glaciers (Pelto, 2011). The August 17th 1984 image is the oldest Landsat image that I consider of top quality. I was on the Llewellyn Glacier with the Juneau Icefield Research Program (JIRP) on the east side of the icefield the day this image was taken. JIRP was directed by Maynard Miller at that time and by Jeff Kavanauagh now. The Gilkey Glacier is fed by the famous Vaughan Lewis Icefall at the top of which JIRP has its Camp 18 and has monitored this area for 60 years. Here I examine changes both in images and text below. The same analysis in a more depth is contained in the screen capture video of the same images. Choose the format you prefer and let me know which works for you.
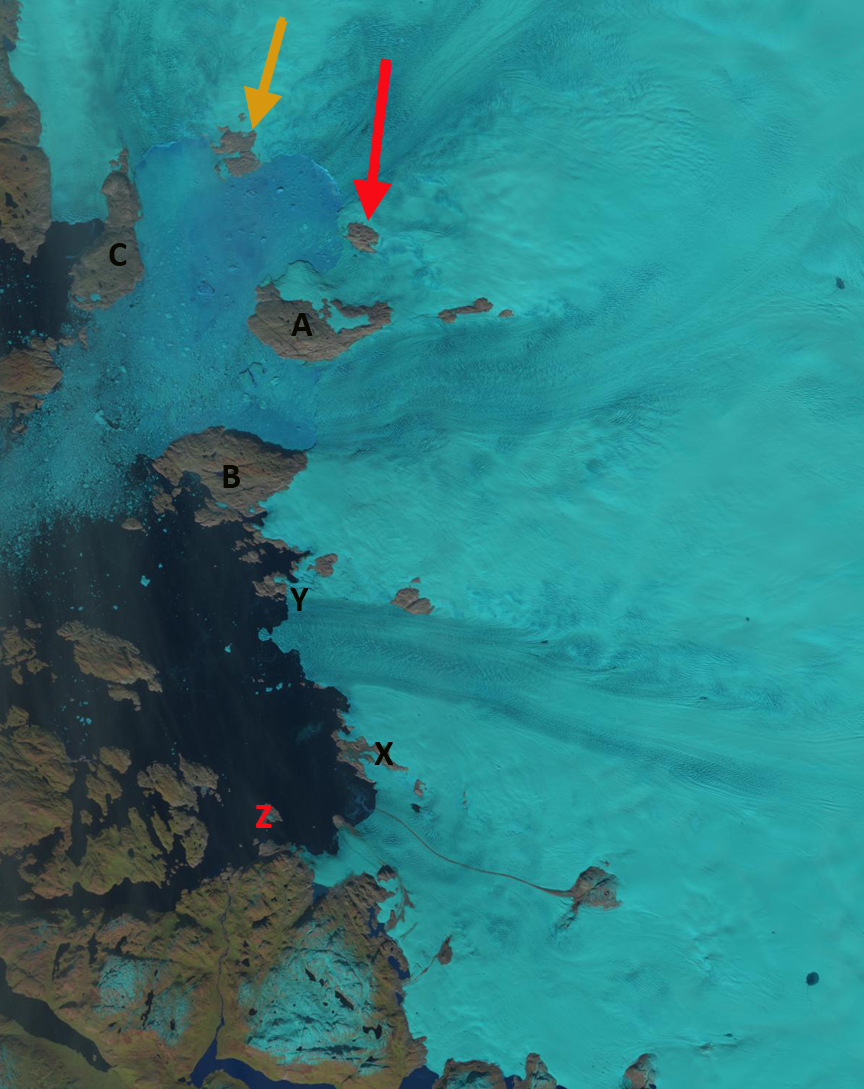
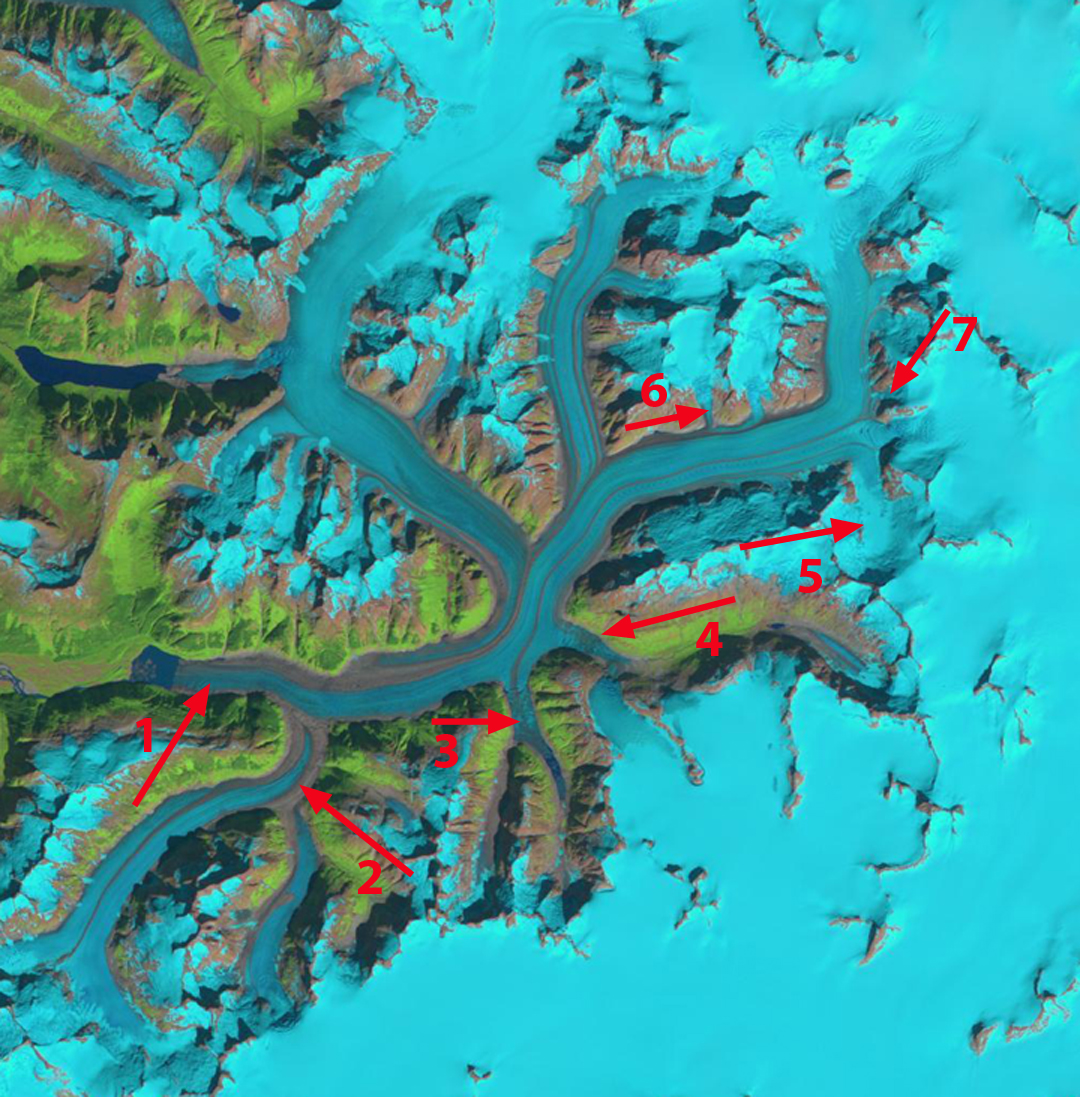
There are seven locations noted in the 1984 and 2014 image that are the focus of more discussion in a set of three more focused images
. 
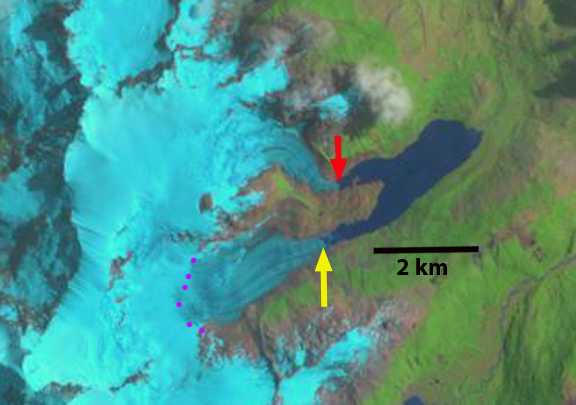
1984 Landsat Image

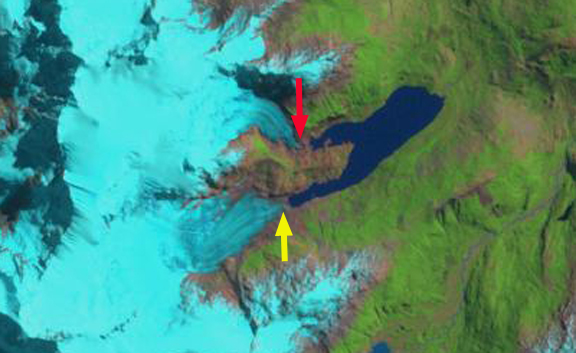
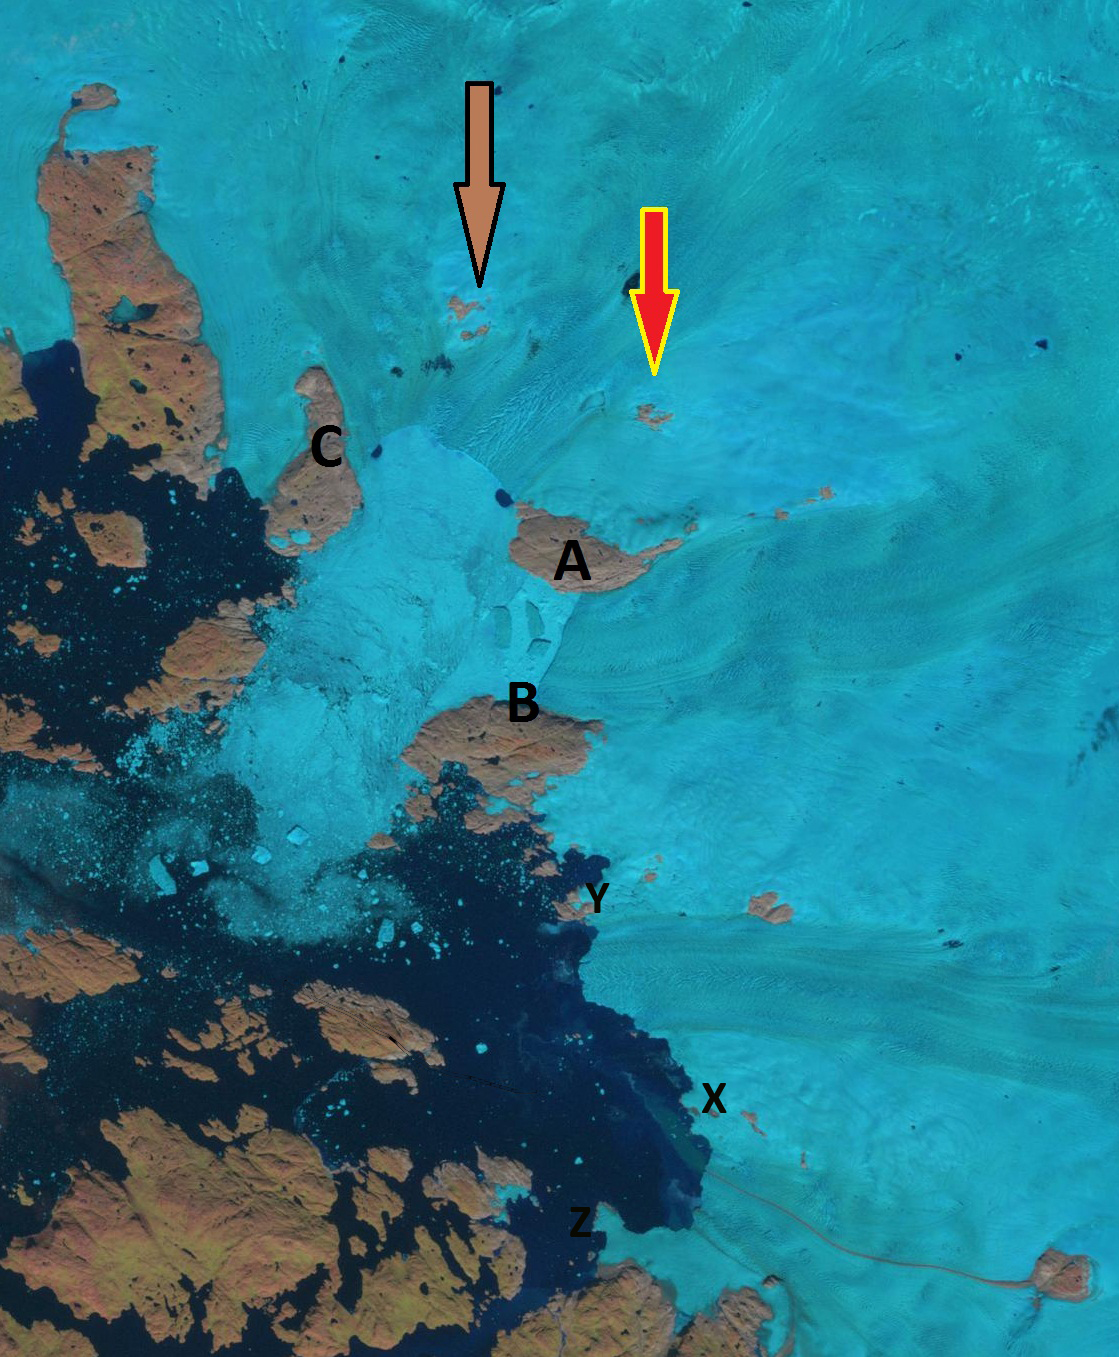
2014 Landsat image
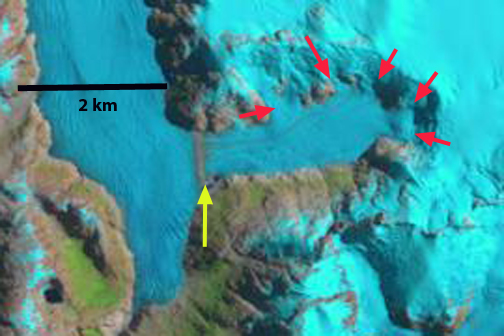
Arrow #1 indicates the Gilkey Glacier terminus area. Gilkey Glacier had begun to retreat into a proglacial lake by 1984, the lake was still just 1 km long. A short distance above the terminus the Gilkey was joined by the sizable tributaries of the Thiel and Battle Glacier. By 2014 the main glacier terminus has retreated 3200 m, the lake is now 4 km long. A lake that did not exist in USGS maps from 1948. Thiel and Battle Glacier have separated from the Gilkey Glacier and from each other. Thiel Glacier retreated 2600 m from its junction with Gilkey Glacier from 1984-2014 and Battle Glacier 1400 m from its junction with Thiel Glacier and 3500 m from the Gilkey Glacier. Melkonian et al (2013) note the fastest thinning in the Gilkey Glacier system from to is near the terminus and in the lower several kilometers of Thiel Glacier.

Above: 1984-2014 Comparison of Gilkey Glacier terminus area with Landsat imagery
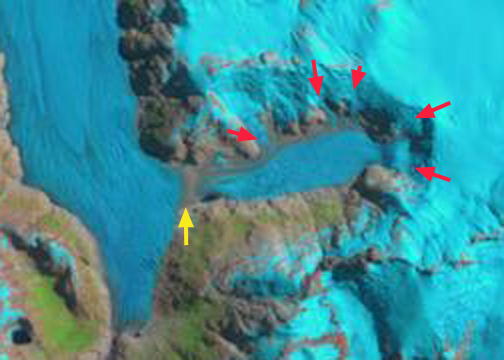
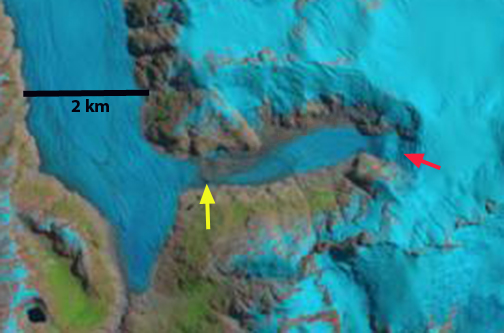
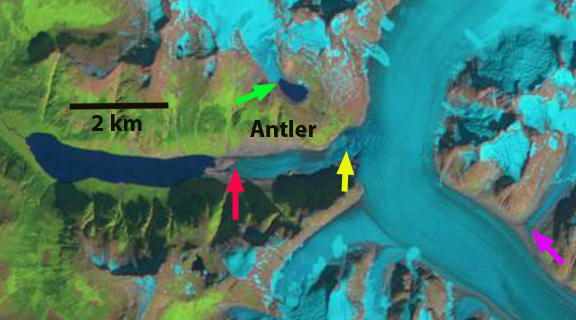
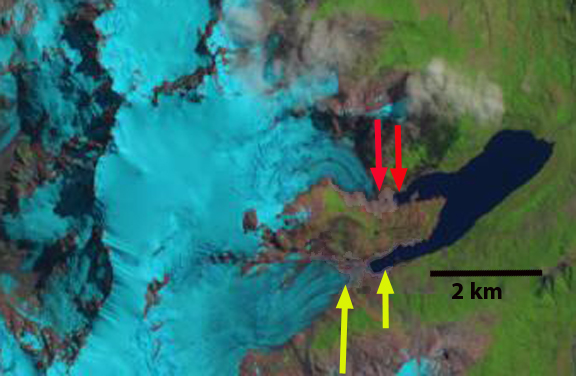
Arrow #3 and #4 indicates valleys which tongues of the Gilkey Glacier flow into. In 1984 at #3 the glacier extended 1.6 km upvalley ending where the valley split. The portion of the Gilkey flowing into the valley had a medial moraine in its center. At arrow #4 the glacier extended 1.5 km up Avalanche Canyon. In 2014 at #3 the glacier tongue ends 1.2 km from the valley split, and the medial moraine does not enter the valley. At #4 the glacier has retreated 1.3 km, leaving this valley nearly devoid of a glacier.
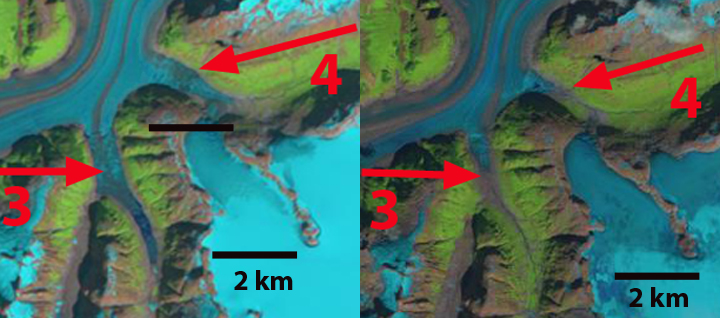
Above: Comparison of the Avalanche Canyon area 1984-2014.
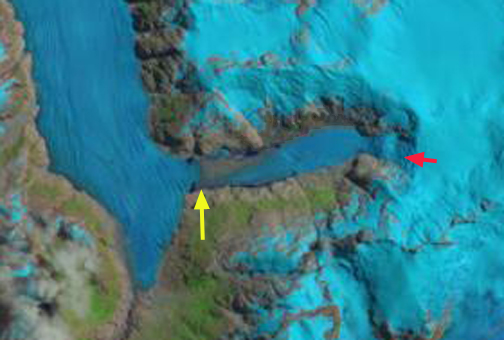
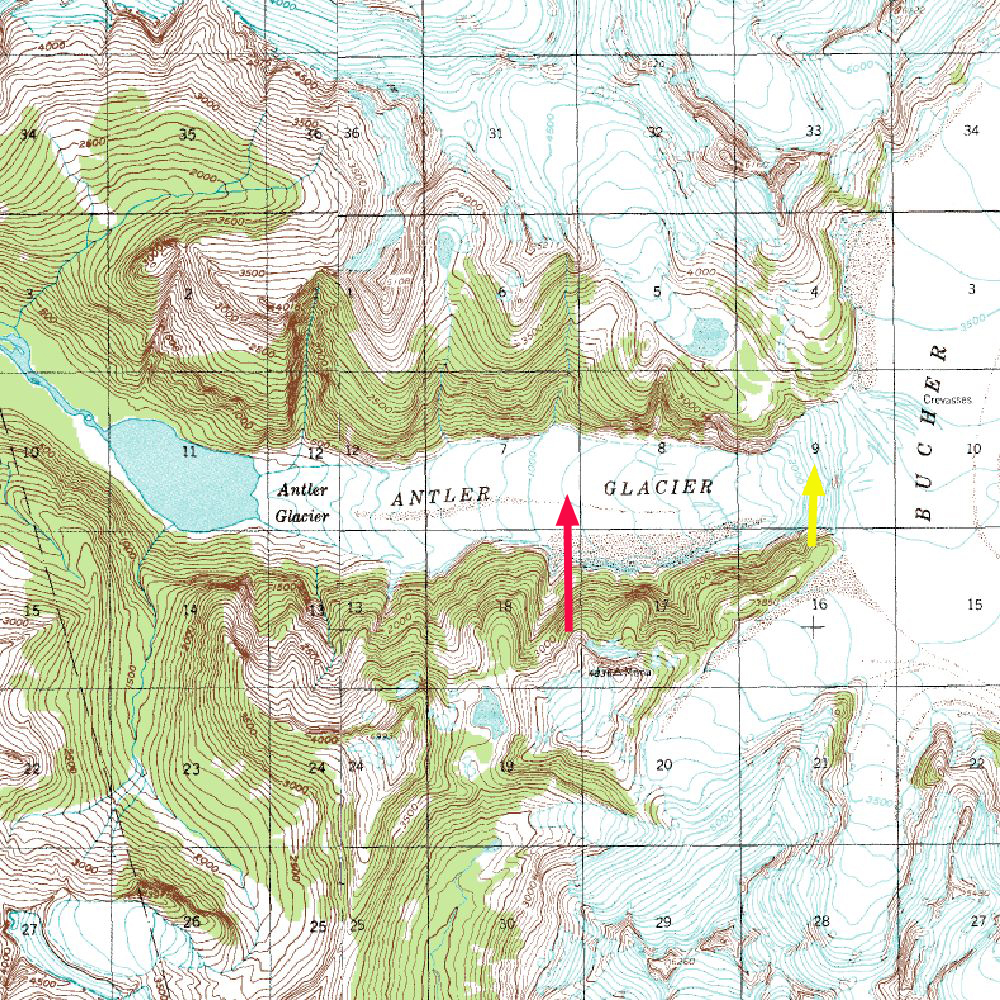
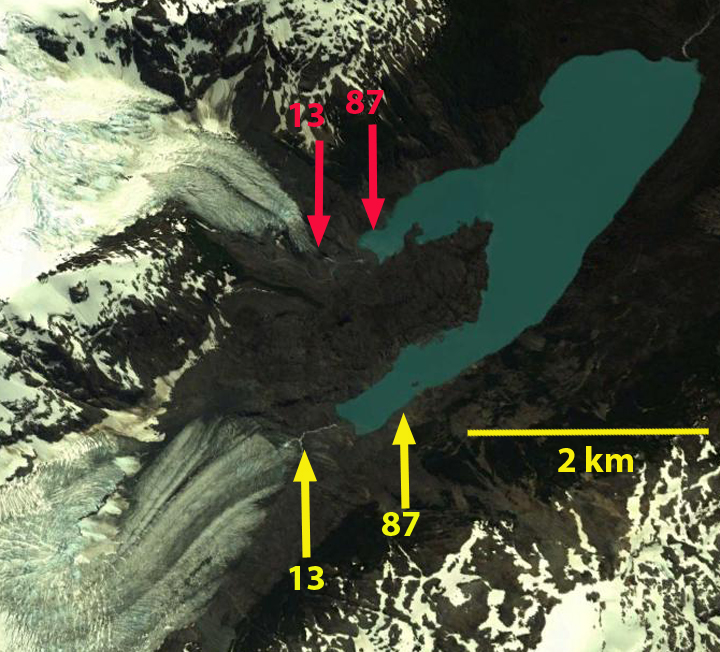
Further upglacier arrow #5 indicates a side glacier that in 1984 featured an unending system of glacier flowing down the steep mountain sides into the valley bottom. By 2014 two rock ribs extend along most of the east and west valley walls separating the glaciers on mountain side from the main valley glacier, which has as a result been reduced in width and velocity. At arrow #6 a tributary glacier is seen merging with Gilkey Glacier in 1984. By 2014 this tributary no longer reaches the Gilkey Glacier, ending 300 m up the valley wall. At arrow #7 the Little Vaughan Lewis Icefall in 1984 is seen merging with the Gilkey Glacier across a 300 m wide front. This I can attest from seeing the glacier that summer to be an accurate observation. By 2014 at arrow #7 the Little Vaughan Lewis Icefall no longer feeds ice directly to the Gilkey Glacier. There is still avalanching but not a direct flow connection. JIRP has Camp 19 in this area, a spectacular area of ongoing research by JIRP. The main Vaughan Glacier Icefall is still impressive, just south of the rib beyond arrow #7. Measurements of snowpack are made annually by JIRP above the icefall, and indicate a mean snow depth exceeding 3 m in early August, note image below of measuring annual snow layers in a crevasse at head of the icefall. Pelto et al (2013) summarize the results of this ongoing research that Chris McNeil (USGS) is working to enhance with newer technology. The terminus change of all Juneau Icefield glaciers from 1984-2013 has been summarized in a previous post. The 2015 season will be of interest, since the area had a remarkably warm yet wet winter. This will lead to high ablation at lower elevations, likely a higher snowline than usual, but above the Vaughan Lewis Icefall will those warm wet events dumped snow? The 2014 winters season was warm and the snowline seen in the 2014 satellite imagery was at 1500 m, yet snowpack at 1760 m on the Vaughan Lewis Glacier was 3.3 m deep in late July. This has been the case in the past with warm wet winters featuring heavy snow above 1600 meters on the icefield. JIRP will be in the field answering this question in 2015.
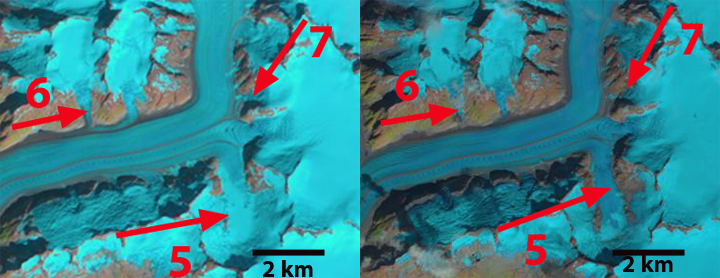
Above: Comparison 1984-2014 of the Vaughan Lewis Glacier area
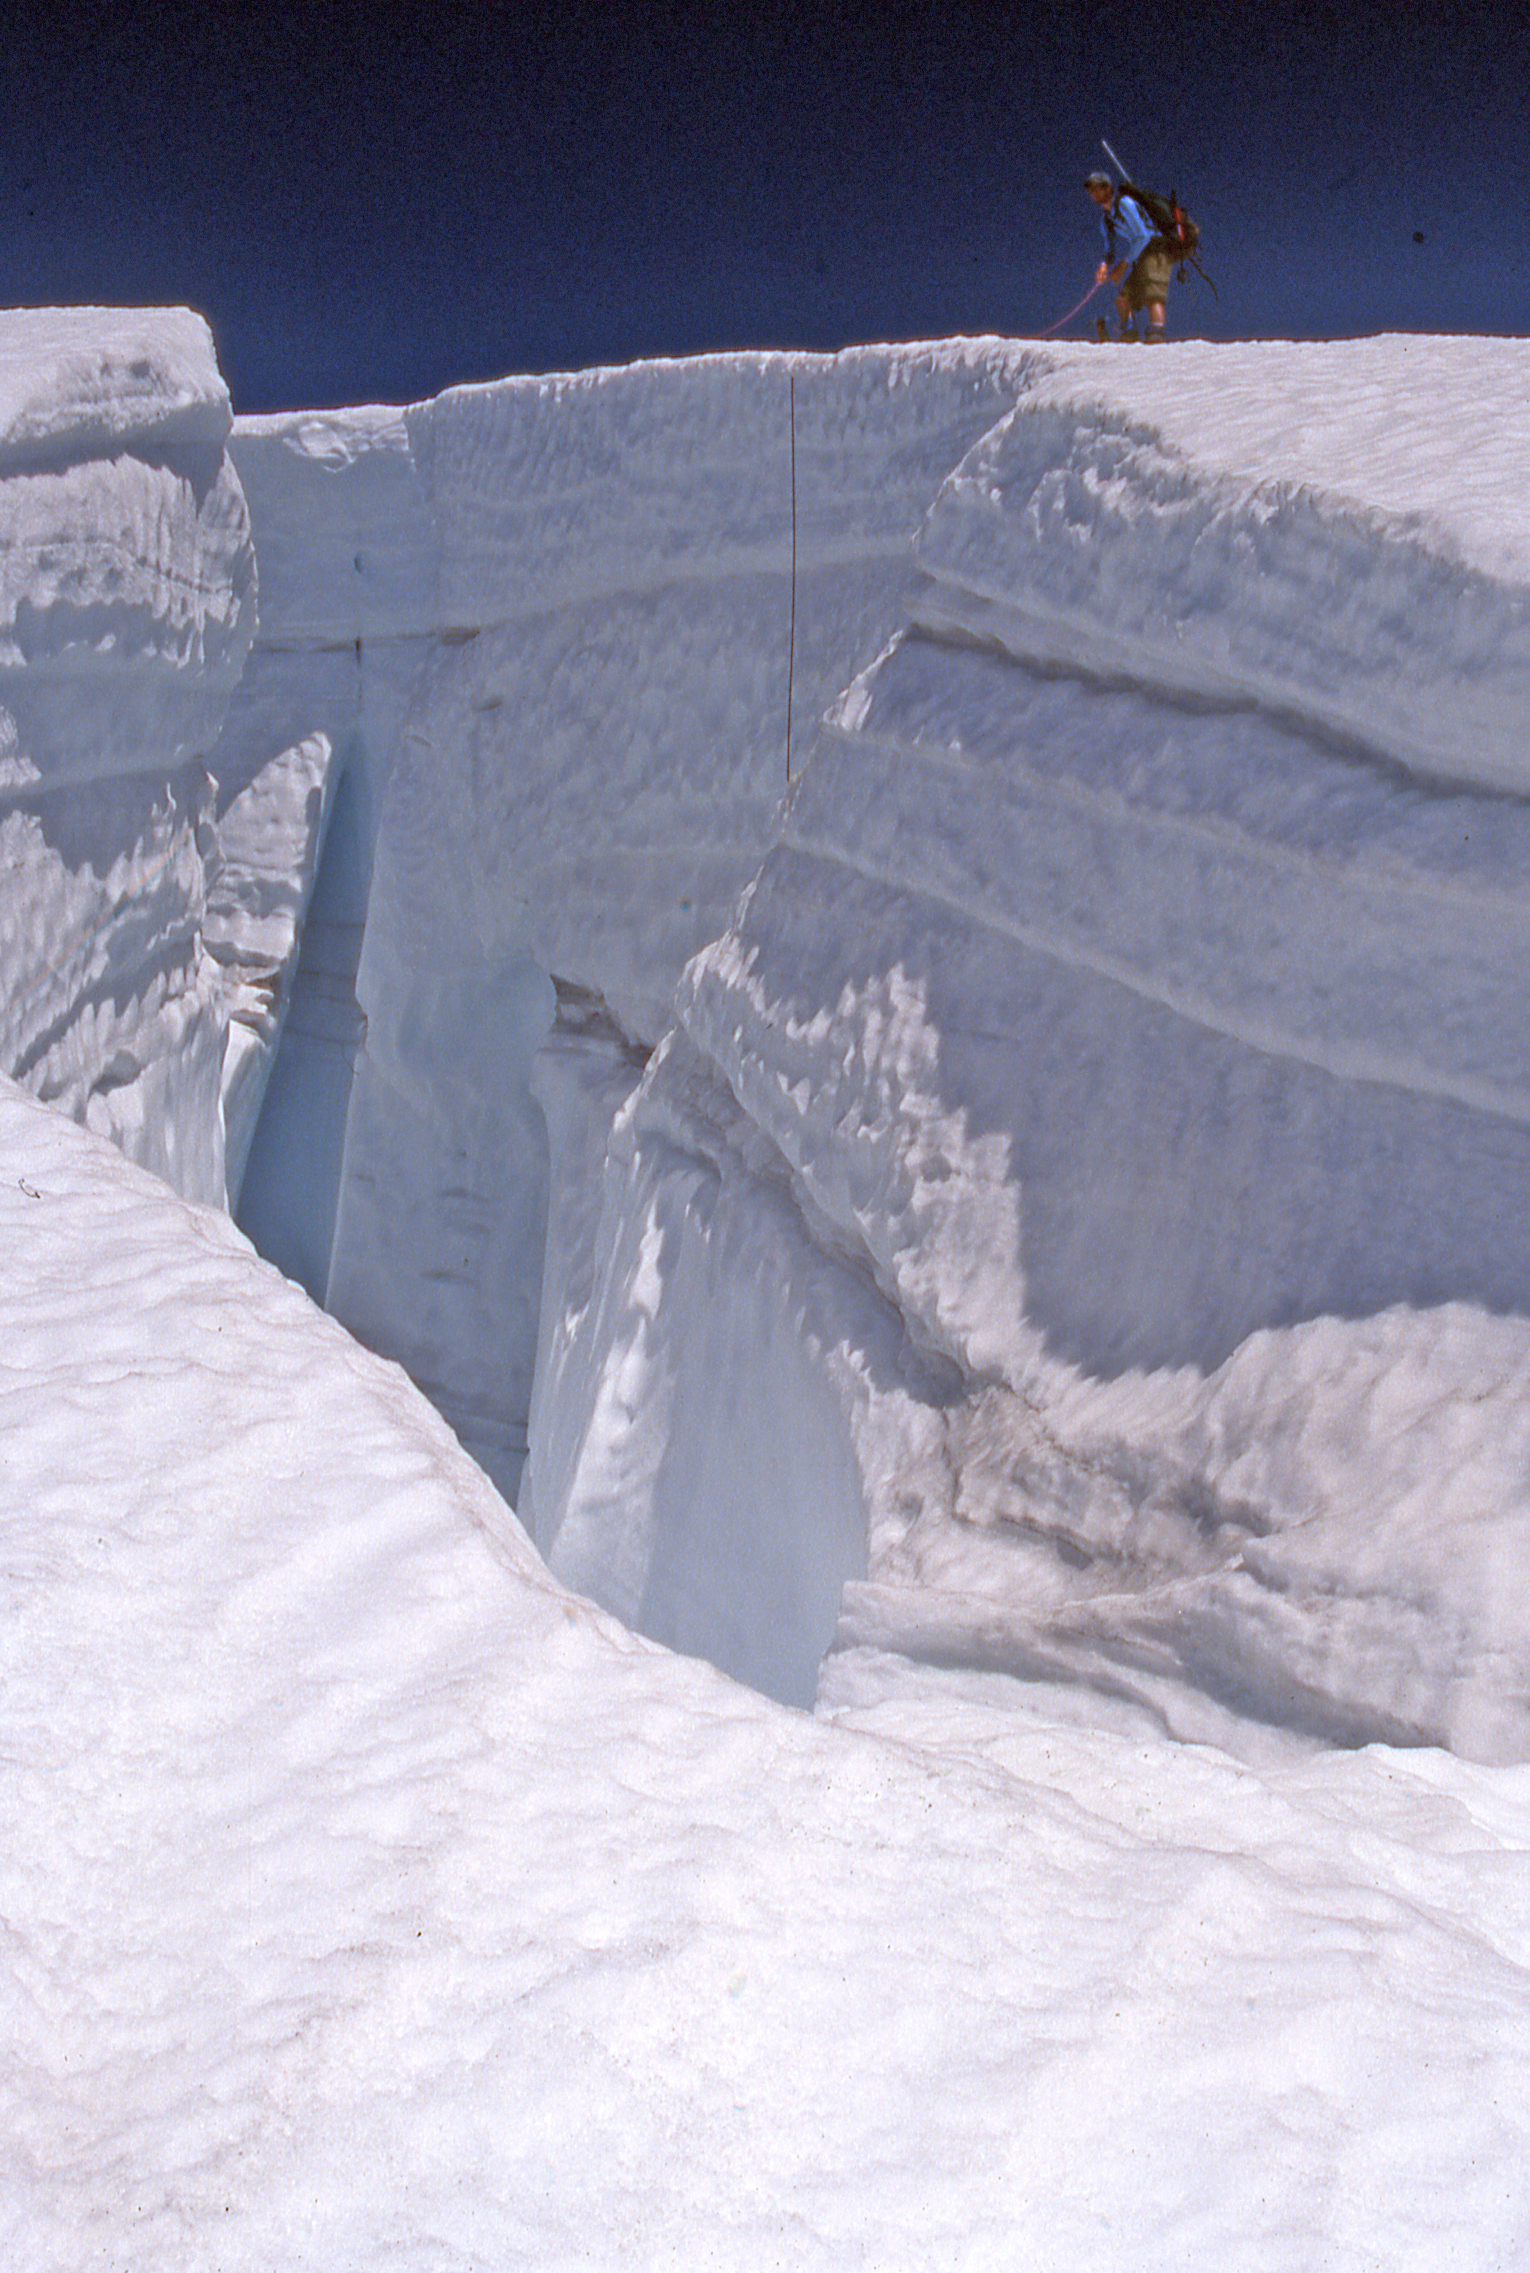
Crevasse stratigraphy Vaughan Lewis Glacier.