Canadian Columbia River Basin Winter 2016-2017: A Late Rally

Guest Post by Ben Pelto, PhD Candidate, UNBC Geography, pelto@unbc.ca

As the summer ticks by and the fall glacier field season approaches, I’ve realized that I never put out a winter 2016-2017 synopsis, so, like the snowfall this year, it’s arrived late.

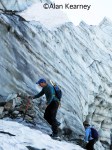
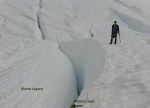
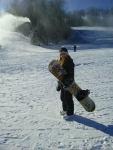
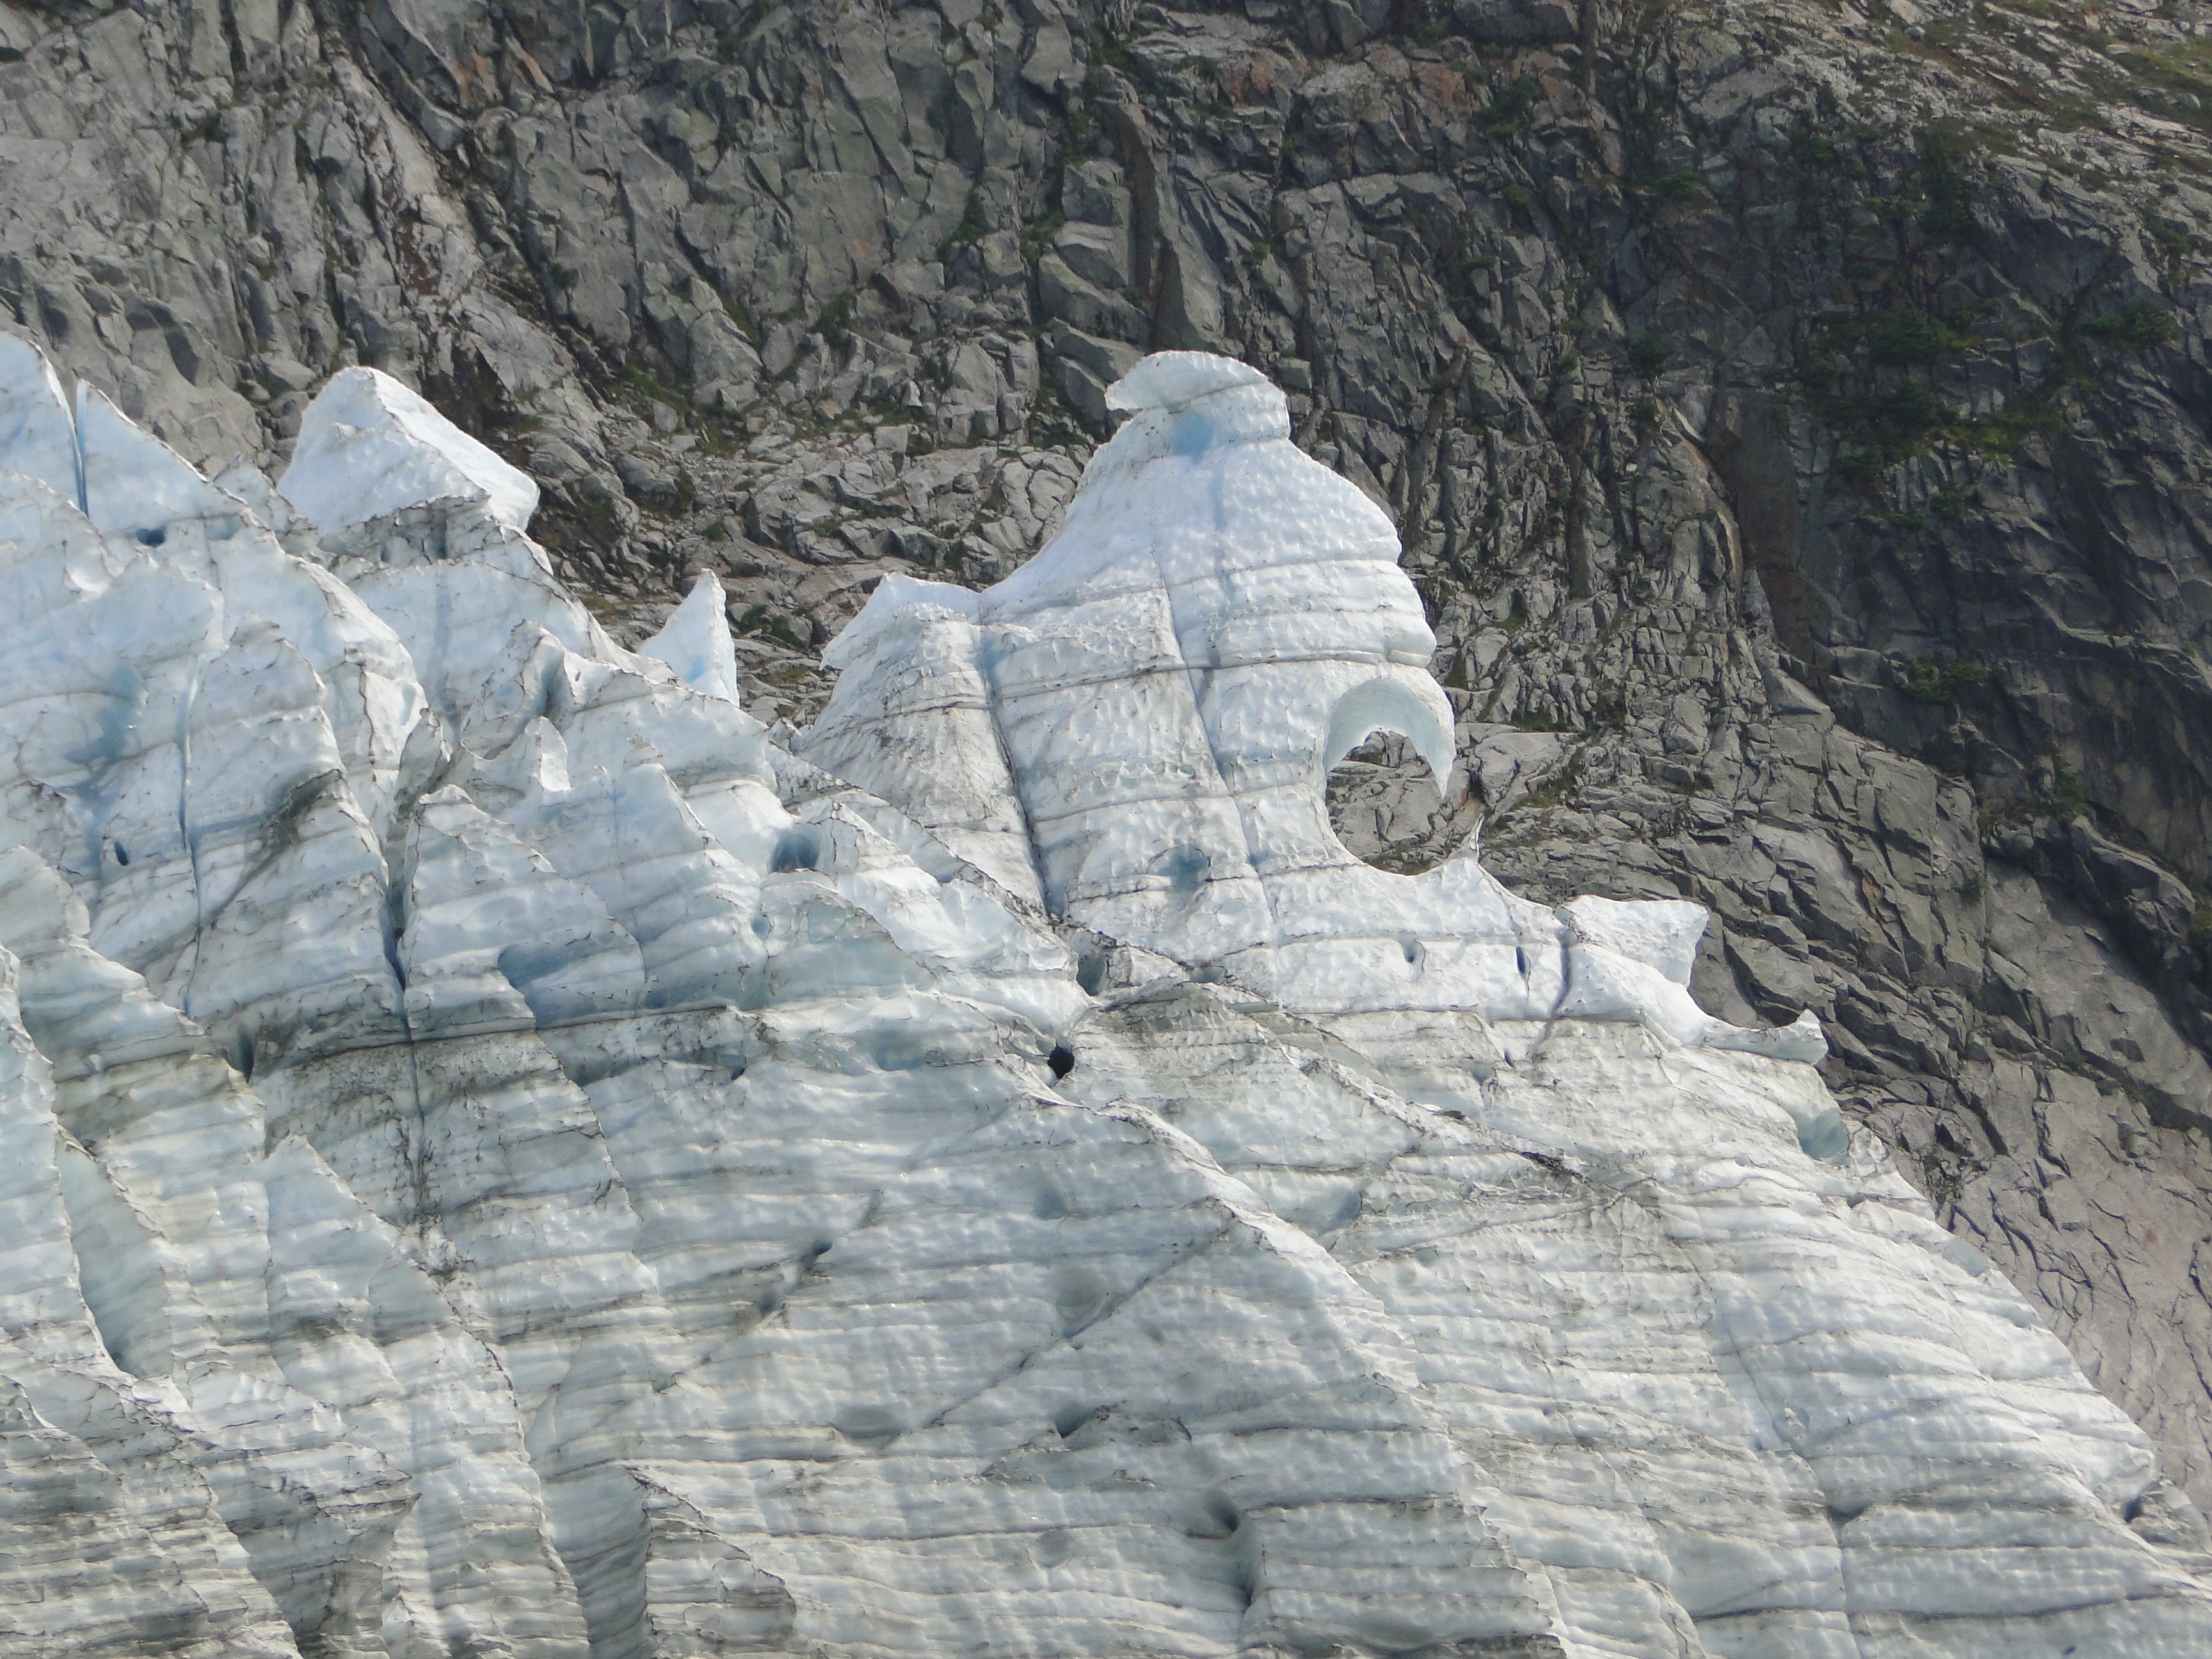
May 2017, Jesse Milner of the ACMG on the Nordic Glacier in front of the “meteor strike” a newly exposed rock face that spalls ice regularly. Photo by Ben Pelto.

Story of the winter

The winter began with an extremely warm November, featuring temperatures 2-5˚C above normal, with greater than average precipitation generally delivered via Pacific storm cycles. Arctic air masses moving south across BC dominated December, with a complete reversal of temperature to well below average temperatures (Figure 1), and drier conditions. By January 1st the BC River Forecast Center announced that the Columbia River Basin was at 80-88% of normal snowpack (Figure 2).

Figure 1. Maximum temperature anomaly for December 2016. Note Columbia Basin (SE BC) roughly 3˚C below normal (Pacific Climate Impacts Consortium).

Figure 2. January 1st snow survey data from the BC River Forecast Center. The Columbia River Basin is comprised of the Upper Columbia, East Kootenay, and West Kootenay Basins, which range from 80-88% of normal.

March and April brought cool and moist unstable conditions, leading to a significant increase in snowpack across southern BC, delaying the onset of the melt season by about two weeks. Snowpack measures for the basin were over 100% of normal for the first time of the winter; by May 1st, the Columbia Basin was at 115% of normal to the north and 135% in the south (Figure 3). By the first week of May, most regions had transitioned into the melt season, though at low to mid-elevations (below 1500 m) much of the snow had already melted.

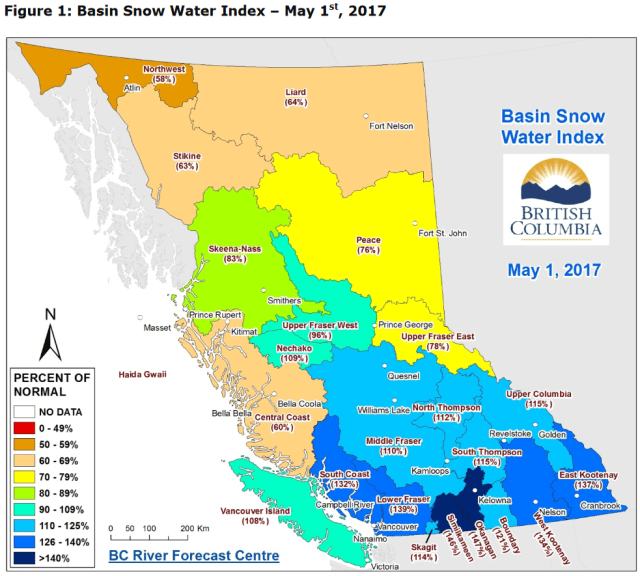
Figure 3. May 1st snow survey data from the BC River Forecast Center. The Columbia River Basin is comprised of the Upper Columbia, East Kootenay, and West Kootenay Basins, which ranged from 115 to 137% of normal.

Questions of alpine snowpack conditions

A trend seen over the past few winters is minimal to no snow at lower elevations with significant snow remaining higher, and it’s a pattern expected to continue in an era of rising temperatures leading to both rain on snow, and melt events through the winter. Unfortunately, current measurements, including the network of 70 automatic snow weather stations (ASWS) across the province, are all located at or below 2000 m. This leaves the alpine largely un-sampled. Rising temperatures may well be increasing the balance gradient of winter snow accumulation; that is, there will be a greater rate of change (increase) in snowpack with elevation than previously experienced, though data for this shift is lacking.

Our glacier research program

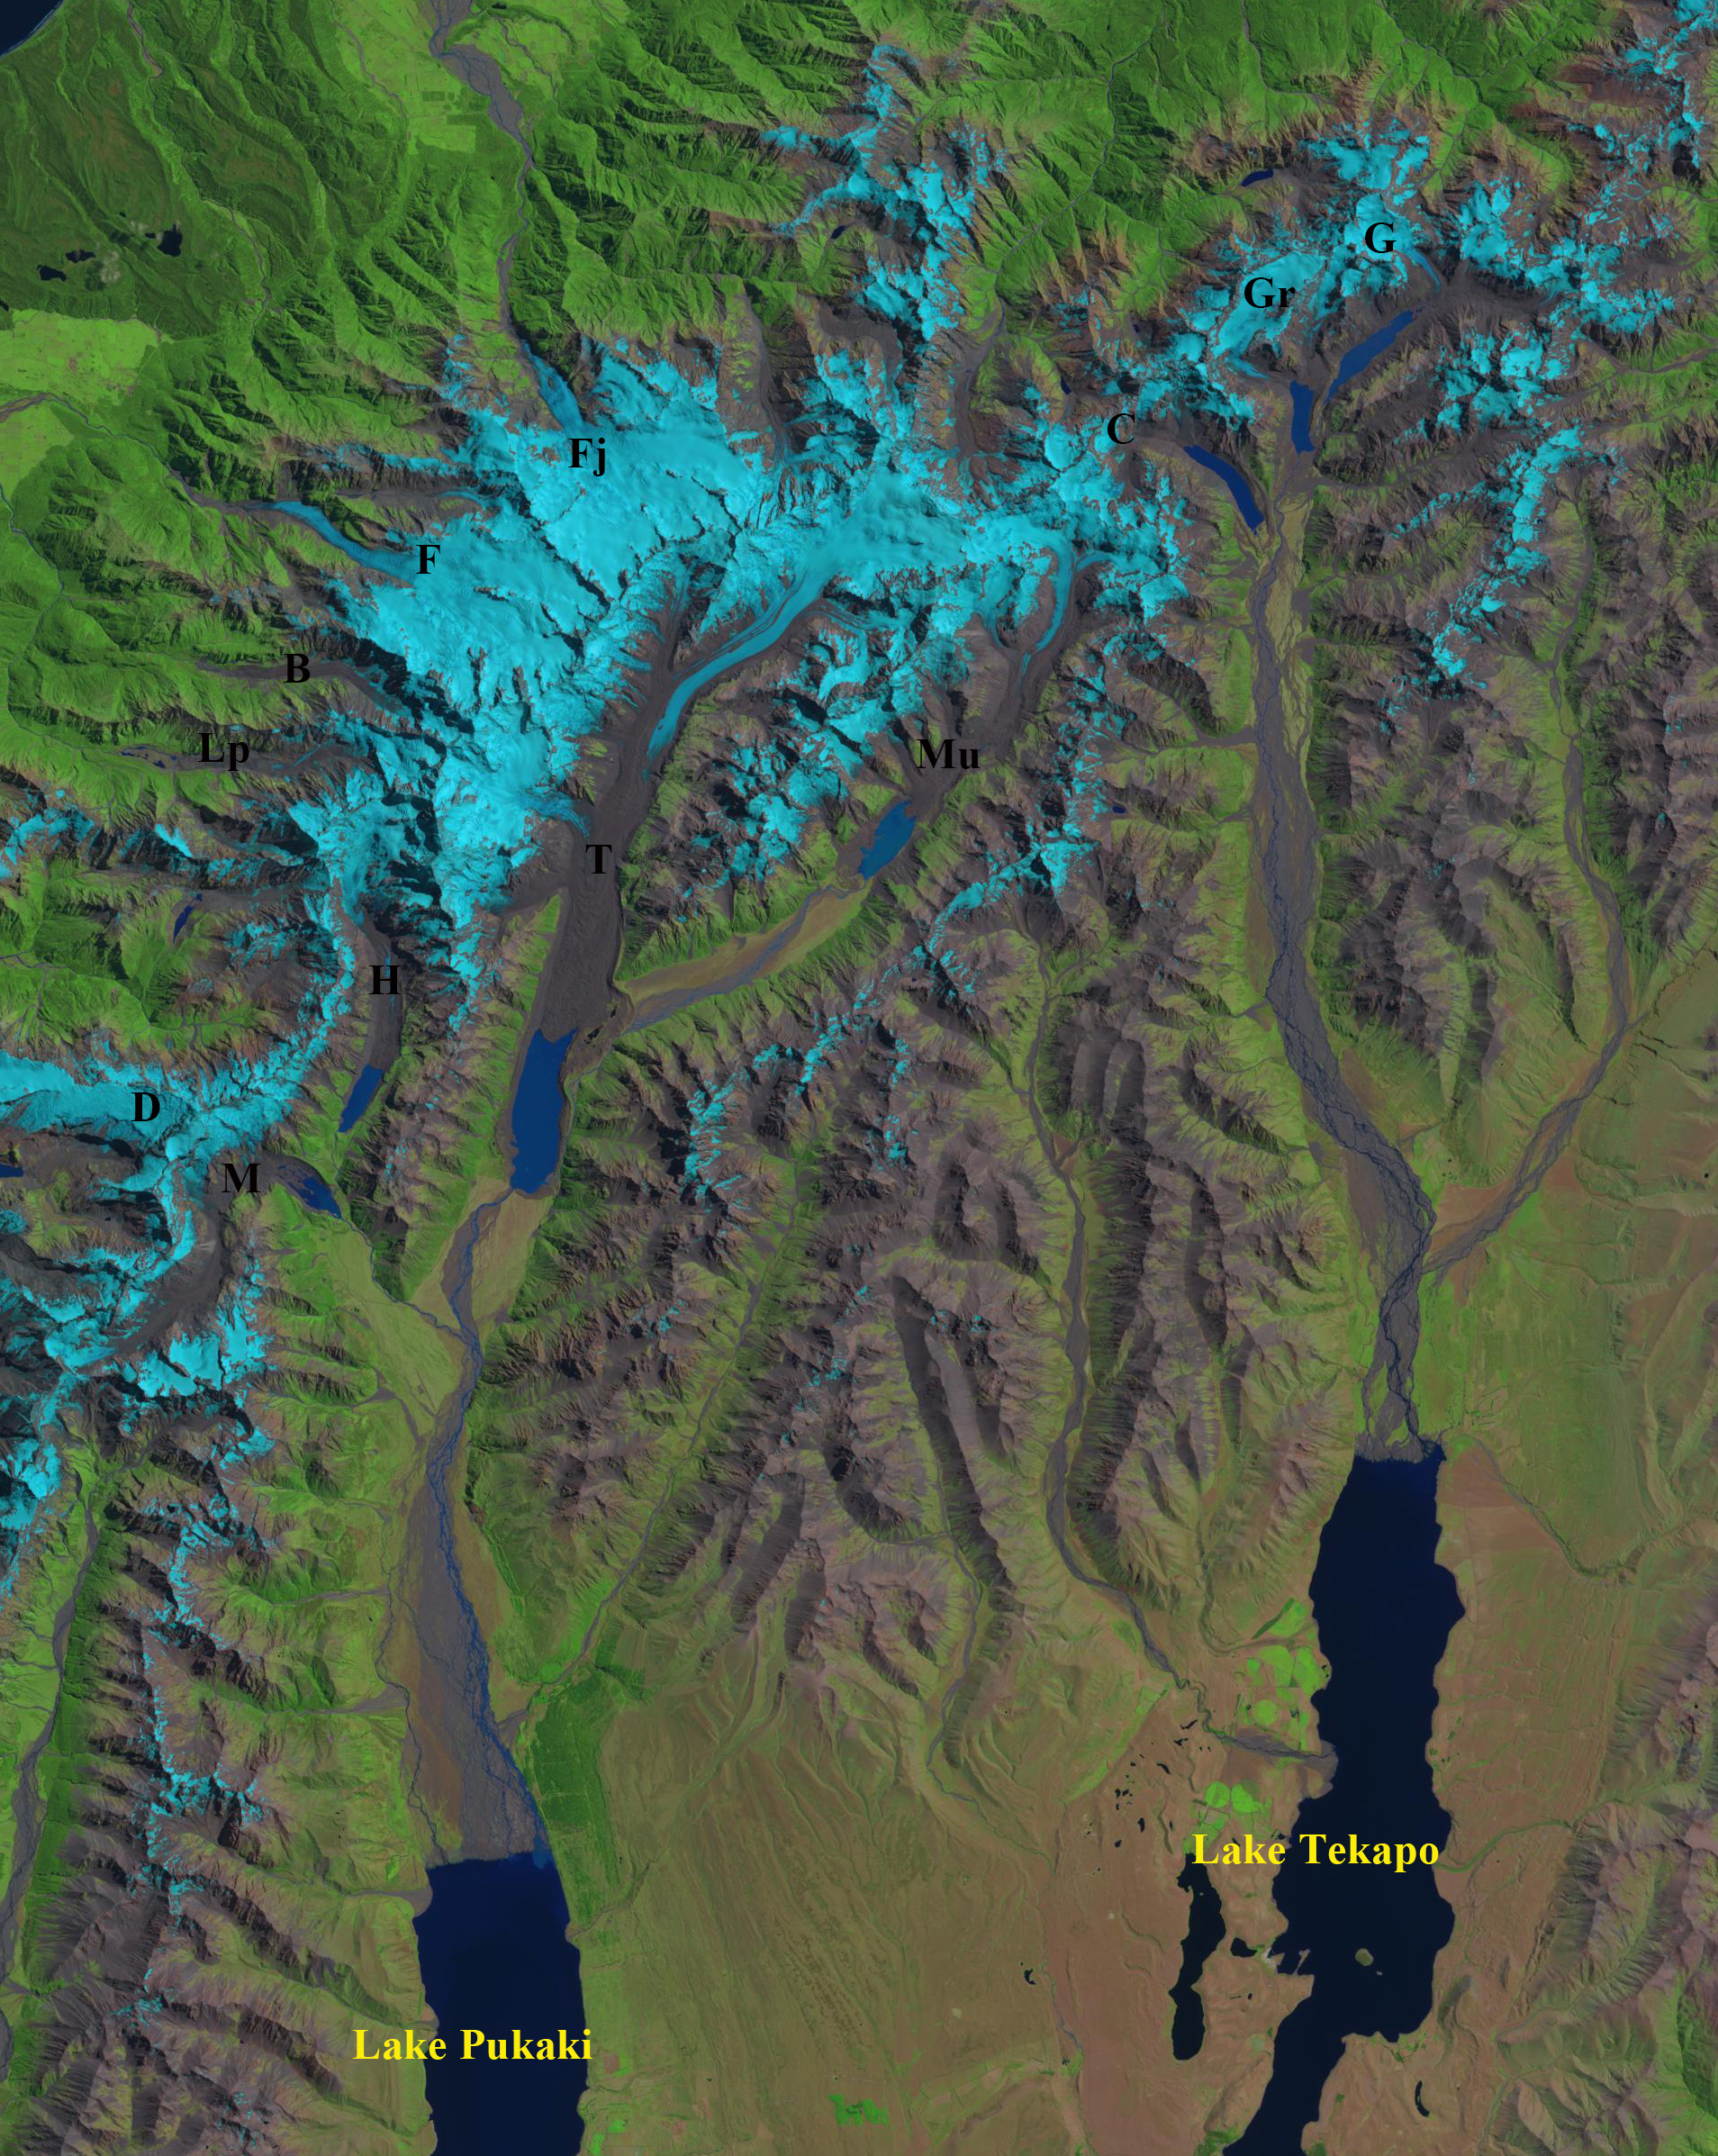
This information gap of alpine snowpack across BC is being addressed within the context of our glacier mass balance network funded by the Columbia Basin Trust. Each year we have been studying a series of five glaciers across the Basin, which from north to south are the Zillmer Glacier (Valemount), Nordic Glacier (northern boundary of Glacier National Park), Illecillewaet Glacier (Parks Canada, Rodgers Pass, Glacier National Park), Conrad Glacier (Golden, northern boundary of Bugaboo Provincial Park), and the Kokanee Glacier (Nelson, Kokanee Glacier Provincial Park). For more background see previous posts here and here.

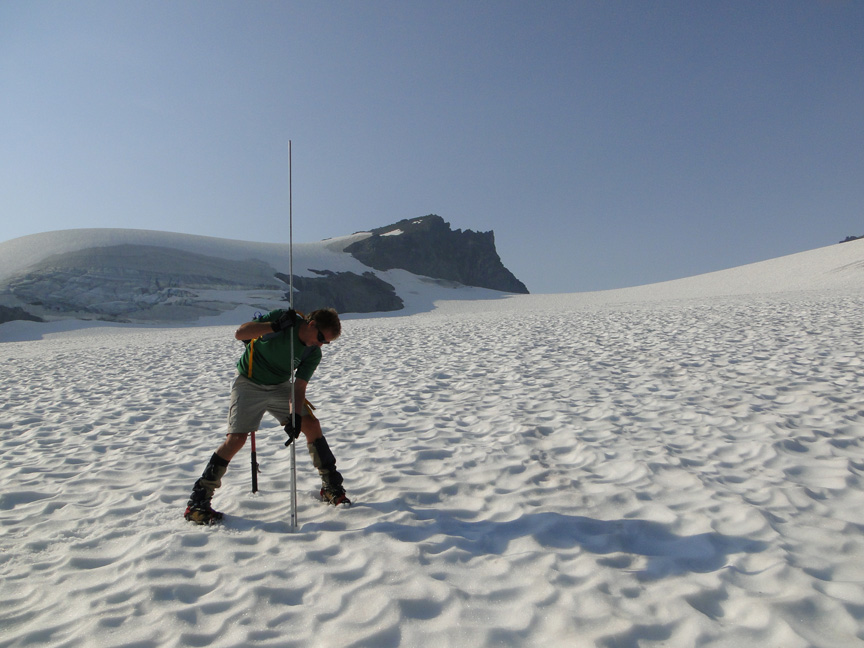
Our spring field season consists primarily of snow depth measurements and snow density measurements, used to determine the snow water equivalent (SWE) retained on each glacier at the winter’s end. We also conduct GPS surveys of the glacier height, which we use to account for any surface height change between field visits, and the subsequent airborne laser altimetry surveys (LiDAR)of each glacier and the surrounding area that we’re conducting every spring and fall for the five years of the project.

May 2017, Pulling the ground penetrating radar up the Kokanee Glacier to measure ice thickness. The Kokanee is 20-80 m thick, averaging around 30-40 m. Photo by Rachael Roussin.

Our LiDAR data allows us to calculate snow depth by comparing a fall LiDAR-derived digital elevation model (DEM) to our spring DEM. Off-glacier, the fall DEM represents bare earth, and on glacier, the glacier surface at the end of the melt season. The spring DEM thus captures the fall surface height plus the winter snowpack. The difference in height between the two is taken to be accumulated snow. While our manual snow depth and density surveys of the five study glaciers are incredibly valuable data, our LiDAR surveys cover roughly 10% of the Columbia Basin glacier area, a more than three-fold increase. This expanded footprint allows a better picture of alpine snowpack across the province at elevations largely un-sampled; highly important to downstream concerns such as spring flooding and  snow available for summer streamflow.

Fires and Floods

 Dramatic swings of weather patterns characterized the 2016-2017 winter, with snowpack well below average in February and early March for the province. By the end of April, snowpack across the Columbia Basin and southern half of the province had rebounded to average or record levels depending upon location with Vancouver and the lower mainland receiving significant snowfall to much fanfare. 

The late and cool spring saved the snow season, but also led to flooding across the province, particularly throughout the Okanogan and around Kelowna. As the wildfire season began in earnest, sandbags were still in place in Kelowna to protect properties against flooding from Okanogan Lake, which remained above full pool by 38 cms on July 10th. Wildfire crews had been tasked with fighting the flooding, and were removing many sandbags as lake levels began to fall before heading off to respond to escalating fires. The flooding began following a rapid warm-up combined with heavy rainfall that led to extreme avalanche risk and activity, with highway closures along the Trans-Canada and Icefields Parkway.

The record snowpack across the southern-most Columbia Basin such as around Nelson, BC, has long since disappeared, with Nelson implementing water restrictions to attempt to cut water usage by 50% in response to the rapidly diminishing snowpack which feed the town’s water supplies.

Forest fires have been raging over the province, burning an area larger than Prince Edward Island, in what is the worst fire season in BC since 1958. Forest fire impact on glaciers is largely unknown, as soot and ash from the fires may raise albedo, but smoke clouds reflect incoming solar radiation. One thing is for certain however, should the fires cloud the skies during our field season, spending 24 hours a day in fire smoke makes for a tough go.

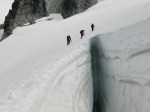
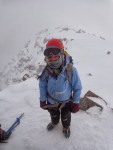
Team members at the foot of a recent avalanche preparing to head up to the Nordic Glacier in the first week of May 2017. Photo by Alex Bevington

Outlook

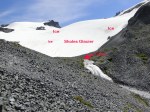
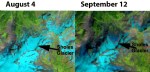
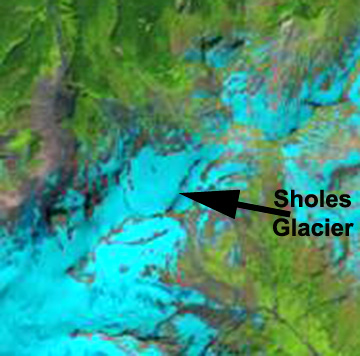
With our fall field season (August 19-September 21) only a week away, it will be an interesting time to observe how our study glaciers across the Columbia Mountains fared over this roller coaster of a year. After a cold, dry start to the winter, a late rally in March and April delayed the start of the melt season and raised snowpack to well above average across the Columbia Basin. A hot, dry summer led to flooding in May, and now wildfires in June-August, which reversed snowpack levels to below-average at most elevations. Satellite images of the study glaciers show rapidly rising snow lines, as above-average snow packs are reduced to average to below-average across most glaciers, with only the Kokanee Glacier appearing set for a possible positive mass balance year.

How do you get out? Jesse Milner at the bottom of a 5.5 m deep snow pit, which we use for sampling snow density. Nordic Glacier. Photo by Alex Bevington.

The field research is funded by the Columbia Basin Trust, with BC Hydro providing funds for the LiDAR surveys, and addition research support from the Natural Sciences and Engineering Research Council of Canada and the Canada foundation for innovation. The author is a supported by a Pacific Institute for Climate Solutions Fellowship and a scholarship from the University of Northern British Columbia.

State of Alpine Glaciers in 2016-Negative for 37th Consecutive Year

Figure 1. Global Alpine glacier annual mass balance record of reference glaciers submitted to the World Glacier Monitoring Service.

Each year I write the section of the BAMS State of the Climate on Alpine Glaciers.  What follows is the initial draft of that with a couple of added images and an added paragraph.

The World Glacier Monitoring Service (WGMS) record of mass balance and terminus behavior (WGMS, 2015) provides a global index for alpine glacier behavior.  Globally in 2015 mass balance was -1177 mm for the 40 long term reference glaciers and -1130 mm for all 133 monitored glaciers.  Preliminary data reported to the WGMS from Austria, Canada, Chile, China, France, Italy, Kazakhstan, Kyrgyzstan, Norway, Russia, Switzerland and United States indicate that 2016 will be the 37th consecutive year of without positive annual balances with a mean loss of -852 mm for reporting reference glaciers.

Alpine glacier mass balance is the most accurate indicator of glacier response to climate and along with the worldwide retreat of alpine glaciers is one of the clearest signals of ongoing climate change (Zemp et al., 2015).  The ongoing global glacier retreat is currently affecting human society by raising sea-level rise, changing seasonal stream runoff, and increasing geohazards (Bliss et al, 2014; Marzeion et al, 2014).  Glacier mass balance is the difference between accumulation and ablation.  The retreat is a reflection of strongly negative mass balances over the last 30 years (Zemp et al., 2015).  Glaciological and geodetic observations, 5200 since 1850, show that the rates of early 21st-century mass loss are without precedent on a global scale, at least for the time period observed and probably also for recorded history (Zemp et al, 2015). Marzeion et al (2014) indicate that most of the recent mass loss, 1991-2010 is due to anthropogenic forcing.

The cumulative mass balance loss from 1980-2015 is -18.8 m water equivalent (w.e.), the equivalent of cutting a 21 m thick slice off the top of the average glacier (Figure 2).  The trend is remarkably consistent from region to region (WGMS, 2015).  WGMS mass balance based on 40 reference glaciers with a minimum of 30 years of record is not appreciably different from that of all glaciers at -18.3 m w.e.  The decadal mean annual mass balance was -228 mm in the 1980’s, -443 mm in the 1990’s, 676 mm for 2000’s and – 876 mm for 2010-2016.  The declining mass balance trend during a period of retreat indicates alpine glaciers are not approaching equilibrium and retreat will continue to be the dominant terminus response. The recent rapid retreat and prolonged negative balances has led to some glaciers disappearing and others fragmenting (Figure 2)(Pelto, 2010; Lynch et al, 2016).

Below is a sequence of images from measuring mass balance in 2016 in Western North America from Washington, Alaska and British Columbia.  From tents to huts, snowpits to probing, crevasses to GPR teams around the world are assessing glacier mass balance in all conditions.

[ngg_images source=”galleries” container_ids=”7″ display_type=”photocrati-nextgen_basic_imagebrowser” ajax_pagination=”1″ template=”/nas/wp/www/sites/blogsorg/wp-content/plugins/nextgen-gallery/products/photocrati_nextgen/modules/ngglegacy/view/imagebrowser-caption.php” order_by=”sortorder” order_direction=”ASC” returns=”included” maximum_entity_count=”500″]

Much of Europe experienced record or near record warmth in 2016, thus contributing to the negative mass balance of glaciers on this continent. In the European Alps, annual mass balance has been reported for 12 glaciers from Austria, France, Italy and Switzerland. All had negative annual balances with a mean of -1050 mm w.e.  This continues the pattern of substantial negative balances in the Alps continues to lead to terminus retreat.  In 2015, in Switzerland 99 glaciers were observed, 92 retreated, 3 were stable and 4 advanced.  In 2015, Austria observed 93 glaciers; 89 retreated, 2 were stable and 2 advanced, the average retreat rate was 22 m.

In Norway, terminus fluctuation data from 28 glaciers with ongoing assessment, indicates that from 2011-15 26 retreated, 1 advanced and 1 was stable.  The average terminus change was -12.5 m (Kjøllmoen, 2016).  Mass balance surveys with completed results are available for seven glaciers; six of the seven had negative mass balances with an average loss of -380 mm w.e.

In western North America data has been submitted from 14 glaciers in Alaska and Washington in the United States, and British Columbia in Canada.  All 14 glaciers reported negative mass balances with a mean loss of -1075 mm w.e.  The winter of and spring of 2016 were exceptionally warm across the region, while ablation conditions were close to average.

In the high mountains of central Asia five glaciers reported data from Kazakhstan, Kyrgyzstan and Russia.  Four of five were negative with a mean of -360 mm w.e.  Maurer et al (2016) noted that mean mass balance in the eastern was significantly negative for all types of glaciers in the Eastern Himalaya from 1974-2006.

Figure 2. Landsat images from 1995 and 2015 of glaciers in the Clephane Bay Region, Baffin island.  The pink arrows indicate locations of fragmentation.  Glaciers at Point C and D have disappeared.


Recent Climate Change Impacts on Mountain Glaciers – Volume

fig10-1

Landsat Image of glaciers examined in the Himalaya Range: Chapter 10 that straddles a portion of Sikkim, Nepal and Tibet, China. Notice the number that end in expanding proglacial lakes. 

This January a book I authored has been published by Wiley. The goal of this volume is to tell the story, glacier by glacier, of response to climate change from 1984-2015. Of the 165 glaciers examined in 10 different alpine regions, 162 have retreated significantly. It is evident that the changes are significant, not happening at a “glacial” pace, and are profoundly affecting alpine regions. There is a consistent result that reverberates from mountain range to mountain range, which emphasizes that although regional glacier and climate feedbacks differ, global changes are driving the response. This book considers ten different glaciated regions around the individual glaciers, and offers a different tune to the same chorus of glacier volume loss in the face of climate change. There are 107 side by side Landsat image comparisons illustrating glacier response.  Several examples are below: in each image red arrows indicate terminus positions from the 1985-1990 period and yellow arrows terminus positions for the 2013-2015 period, and purple arrows upglacier thinning.

[ngg_images source=”galleries” container_ids=”17″ display_type=”photocrati-nextgen_basic_imagebrowser” ajax_pagination=”1″ template=”/nas/wp/www/sites/blogsorg/wp-content/plugins/nextgen-gallery/products/photocrati_nextgen/modules/ngglegacy/view/imagebrowser-caption.php” order_by=”sortorder” order_direction=”ASC” returns=”included” maximum_entity_count=”500″]

There are chapters on: Alaska, Patagonia, Svalbard, South Georgia, New Zealand, Alps, British Columbia, Washington, Himalaya, and Novaya Zemlya. If you are a frequent reader of this blog you will recognize many of the locations. This updates each glacier to the same time frame. The book features 100 side by side Landsat image pairs illustrated using the same methods to illustrate change of each glacier. The combined efforts of the USGS and NASA in obtaining and making available these images is critical to examining glacier response to climate change. The World Glacier Monitoring Service inventory of field observations of terminus and mass balance on alpine glaciers is the another vital resource.  The key indicators that glaciers have been and are being significantly impacted by climate change are the global mass balance losses for 35 consecutive years documented by the WGMS.  The unprecendented global retreat that is increasing even after significant retreat has occurred in the last few decades (Zemp et al, 2015).  Last, the decline in area covered by glaciers in every alpine region of the world that is documented by mapping inventories such as the Randolph Glacier inventory and GLIMS ( Kargel et al 2014)

fig6-2

Landsat Image of glaciers examined in the Svalbard: Hornsund Fjord Region: Chapter 6.

fig5-1

Landsat Image of glaciers examined in the South Georgia Island: Chapter 5.

fig8-9

Landsat Image of Mount Baker glaciers examined in the North Cascades, Washington:  Chapter 8.

fig11-1

Landsat Image of glaciers examined in the Southern Alps of New Zealand S: Chapter 11.


Canadian Columbia Basin Glacier Fall 2016 Field Season

Guest Post by Ben Pelto, PhD Candidate, UNBC Geography, pelto@unbc.ca

gmb

Figure 1. An illustration of the glacier mass balance sum. Mass balance is equal to the amount of snow accumulation and the amount of ice melt over time. Traditionally, this is reported as annual mass balance (how much mass a glacier gained or lost in a particular year) and is reported in meters water equivalent (mwe).

The Columbia Basin Glacier Project is studying the mass balance of several glaciers in western Canada to assess their ‘health’ over time (Figure 1) using field-based measurements and remote sensing. This work is funded by the Columbia Basin Trust and BC Hydro. During the fall season of 2016, we visited our four study glaciers in the Columbia Mountains (Figure 2). These form a transect from south to north: the Kokanee Glacier (in the Selkirk Range), Conrad Glacier (Purcell Range), Nordic Glacier (Selkirk Range), and Zillmer Glacier (Premier Range). We also visited Castle Creek Glacier and the Illecillewaet Glacier with Parks Canada. This post is an overview of the field season and some preliminary results for 2016.

 If you are interested in our main research objectives and methods, you can see the abstract from my recent talk at the American Geophysical Union conference and a video of an accompanying press conference (my piece starts at 18 minutes) with Gerard Roe (University of Washington) and Summer Rupper (University of Utah) titled: Attributing mountain glacier retreat to climate change. More information can be found in the November 29th episode of the Kootenay Co-op radio program Climate of Change (start at 34 minutes).

  areamap
Figure 2. Map of the Columbia River Basin in Canada. Our six study glaciers are marked by red stars. Other glaciers are in light blue (from the Randolph Glacier Inventory) and major rivers and lakes are in dark blue.

Our research consists of both field work and remote sensing. The fieldwork involves manually measuring the amount of snow that accumulates and ice that melts on each glacier at the start (spring) and end (fall) of each melt season (Figure 3). This gives us a mass balance measurement for individual glaciers but is very labor intensive (even if the views are great!). The remote sensing portion of the project is conducted using aerial laser altimetry (Figure 4). To conduct the laser altimetry we mount a Light Detection and Ranging (LiDAR) unit to the bottom of a fixed-wing aircraft and fly surveys of the glaciers twice each year. This creates two 3-Dimensional models of each glacier, one for the spring and one for the fall. When we subtract the spring model from the fall model, we are left with the thickness change of the glacier, and can thus derive mass change. We are still developing this method as a means of measuring more glaciers each year than could be achieved in the field.

 p1030807

Figure 3. To measure ablation (ice melt) we use ablation stakes drilled into the glacier in fall so that the top is flush with the ice surface. The following year, we visit the stakes to measure how much ablation has occurred during the summer, and then drill them in again to record the next year’s melt. In fall 2015, the top of this stake in the terminus of Nordic Glacier was flush with the ice surface, so it has lost nearly 3 meters of ice thickness (photo by Micah May). kokan

Figure 4. Kokanee Glacier elevation change map showing the difference in glacier elevation between September 2015 and September 2016. The difference can be used to calculate glacier mass loss. The glacier (black outline) flows from the bottom of the page to the top, so the terminus of the glacier lost the most mass whereas the middle reaches are net neutral and the upper reaches gained mass. Non-ice areas (e.g. rock) are white because there was no elevation change. The blue and red patches outside the glacier are changes in seasonal snow patches and fresh snow deposited in depressions after a small storm at the time of the 2016 survey.

The year of 2015 was a record for glacier melt across western North America. By contrast, 2016 resulted in slightly negative mass balance for our study glaciers. This means that on average the glaciers we studied lost far less mass in 2016 than in 2015 (and 2014, see Figure 5).

 
conrad

Figure 5. The Conrad Glacier terminus in 2014 (on the left) and 2016 (on the right). Between 2014 and 2016, the terminus of this glacier retreated by 75 m (yellow arrows) and the glacier also thinned markedly. The visibility of the rock band in the center of the image shows this thinning of the ice (red arrows). Also note the orbital crevasses (green arrow), which formed due to the collapse of ice caves along the margin. These ice caves formed in 2014 and 2015 as the surrounding exposed rock warmed (via solar heating) and melted the ice margins from below, and subsequently collapsed in 2016.

Spring arrived around four weeks earlier than normal this year, as we noted in our spring report, with the melt season commencing near the start of April instead of the start of May. At the beginning of April, the 2015-2016 winter had resulted in average snowpack in the northern half of the Columbia Basin and above-average snowpack in the southern half. However, early hot temperatures during April then led to early melt instead of a slow increase in snow throughout the rest of the spring. By mid-April, the snowpack across the entire basin had dropped to under 50% of the normal amount. One caveat here is that province-wide snow monitoring includes many measurements at around 2000 m, but very few above this elevation. Most glaciers in the Columbia Basin lie above 2000 m elevation, so our understanding of the snowpack affecting these glaciers is limited. While there are no long term records for higher elevations in the basin, our data, and discussions with local ski guides and lodge operators, suggests that the snowpack was probably around average during winter 2015-2016 until April.

Our measurements indicate that overall, the 2015-2016 winter resulted in a snowpack that was only 7% lower than the 2014-2015 winter. Why, then, was 2015 a year of substantial mass loss in the Columbia Basin but 2016 only a slightly negative year? The answer is that temperature difference has a far greater impact in this region than the amount of snow accumulation. In our region, at the elevation where glaciers are located (generally above 2000 m), the variability in snowfall year to year is far smaller than the variability in annual temperatures. Temperatures have risen over the Canadian portion of the Columbia River Basin by 1.5°C over the past century, more than double the global rate according to the Columbia Basin Trust. Due to rising temperatures, above-average snowpack is needed just to break even in a typical year. Thus, in order to have a positive mass balance year, you need above average snowfall and below average temperatures.

The summer of 2016 featured average to slightly above average temperatures (Figure 6), with a cooler-than-average July. This is in contrast to the last two years, which both featured well-above-average temperatures through the melt season. Precipitation was also about average over the basin during the summer months (Figure 7). The basin began with a roughly average alpine winter snowpack, experienced an early and hot spring, slightly warmer-than-average summer temperatures, and average precipitation. The combination of these factors led to a slightly negative mass balance overall for our glaciers in 2016: those in the north lost around 0.5 mwe and those in the south stayed around neutral or even slightly gained mass.

 2016jja_temp

Figure 6. Summer (June/July/August) mean daily maximum temperature anomaly for British Columbia in 2016. The red ellipse highlights the Columbia Basin, where temperatures were average to slightly above average (data from the Pacific Climate Impacts Consortium).

The 2016 trend was likely due, in part, to the prevailing position of the jet stream in the 2015-2016 winter. The northerly position of the jet stream, and persistent ridge over the Pacific Northwest, led to warmer winter temperatures over the southern part of the Columbia Basin but also more moisture and concentrated storm tracks (calcification: while accumulation variability resulting from winter weather patterns may have played a role in the north-south trend, the magnitude of mass change (small loss) was controlled by melt season temperatures). My favorite location to observe the jet stream in winter is from the California Region Weather Server at San Francisco State University. There have been many discussions of the jet stream behavior and its influence on winter weather in this region (here’s a simple overview from NOAA). The north-south trend was observed in 2015 as well, but in reverse, with the glaciers in the south experiencing greater mass loss.

2016jja_ppt

Figure 7. Summer (June/July/August) precipitation anomaly for BC. Red ellipse highlights the Columbia Basin. Columbia Basin precipitation was net average to slightly below average for summer 2016 (Pacific Climate Impacts Consortium).

Well-above-average snowfall and well-below-average spring, summer and fall temperatures would be needed for any of the Columbia Basin glaciers to gain substantial mass. This has happened just twice over the past 20 years, as recorded by the North Cascades Glacier Climate Program in the North Cascades of Washington, just southwest of the Columbia Basin. During the winter of 1999, Mt. Baker set the record for most snowfall ever recorded in the US at 1140 inches (or 2900 cm, yes…29 meters!), leading to average glacier mass gain of over 1 meter water equivalent (mwe). The winter of 2011 also featured above average snowpack, and in combination with a cool and cloudy summer, led to below-average melt and a positive mass gain of over 1 mwe. Unfortunately, closer to the Columbia Basin, the Peyto, Place and Helm Glaciers of British Columbia, have never reported a mass gain of 1 mwe since Geologic Survey of Canada records began for those glaciers in the 1960s and 1970s.

The take home points: 

  • In 2016, glaciers in the Columbia Basin experienced a slightly negative mass balance year. There was slight mass gain in the south (less than +0.25 mwe) and moderate mass loss in the north (around -0.5 mwe).
  • At present, an average year still results in moderate glacier mass loss in the Columbia Basin. Either above-average snowpack or below-average temperatures are needed during the melt season for a neutral mass change. A combination of both is required for the glaciers to gain mass.

 If you want to see what our fieldwork looks like in practice, see my video from the spring field season.


2016 Field Season Results-North Cascade Glacier Climate Project

For Mount Baker, Washington the freezing level from January-April 20 was not as high as the record from 2015, but still was 400 m above the long term mean. April 1 snowpack at the key long term sites in the North Cascades was 8% above average. A warm spring altered this, with April being the warmest on record. The three-four weeks ahead of normal on June 10th, but three weeks behind 2015 record melt.  The year was poised to be better than last year, but still bad for the glaciers.  Fortunately summer turned out to be cooler, and ablation lagged.  Average June-August temperatures were 0.5 F above the 1984-2016 mean and 3 F below the 2015 mean. The end result of our 33rd annual field season assessing glacier mass balance in the North Cascades quantifies this. Our Nooksack Indian Tribe partners again installed a weather and stream discharge station below Sholes Glacier.

The primary field team consisted of myself, 33rd year, Jill Pelto, grad student UMaine for the 8th year, Megan Pelto, Chicago based illustrator 2nd year, and Andrew Hollyday, Middlebury College.  We were joined by Tom Hammond, NCCC President 13th year, Pete Durr, Mount Baker Ski Patrol, Taryn Black, UW grad student and Oliver Grah Nooksack Indian Tribe.  The weather during the field season Aug. 1-17th was comparatively cool.

Mass Balance: Easton Glacier provides the greatest elevation range of observations.  On Aug 2, 2016 the mean snow depth ranged from 0.75 m w.e. at 1800 m to 1.5 m w.e. at 2200 m and 3.0 m w.e. at 2500 m. Typically the gradient of snowpack increase is less than this.  There was a sharp rise in accumulation above 2300 m.  This is the result of the high freezing levels.  The mass balances observed fit the pattern of a warm but wet winter.  The high freezing levels left the lowest elevation glaciers Lower Curtis and Columbia Glacier with the most negative mass balance of approximately 1.5 m. The other six glaciers had negative balances of -0.6 to -1.2 m. This following on the losses of the last three years has left the glaciers with a net thinning of 6 m, which on glaciers averaging close to 50 m is a 12% volume loss in four years.  We anticipate with that this winter will be cooler and next summer the glaciers happier.  We will back to determine this.

Snowpack loss from Aug. 5-Sept. 22 is evident in the pictures below on Sholes Glacier.  Detailed snow depth probing, 112 measurements, of the glacier on August 5th allows determination of ablation as the transient snow line traverses probing locations from Aug. 5. GPS locations were recorded along the edge of blue ice on each of the dates. Ablation during this period was 2.15 m.


Terminus Change: We measured terminus change at several glaciers and found that a combination of the 2015 record mass balance loss and early loss of snowcover from glacier snouts in 2016 led to considerable retreat since August 2015.  The retreat was 25 m on Easton Glacier, 20 m on Columbia Glacier, 20 m on Daniels Glacier, Sholes Glacier 28 m, Rainbow Glacier 15 m, Lower Curtis Glacier 15 m.  The main change at Lower Curtis Glacier was the vertical thinning, in 2014 the terminus was 41 m high, in 2016 the terminus seracs were 27 m high.  The area loss of the glaciers will continue to lead to reduced glacier runoff. We continued to monitor daily flow below Sholes Glacier which allowed us to determine that in August 2016 45% of the flow of North Fork Nooksack River came from glacier runoff.  This is turns has impacts for the late summer and fall salmon runs.


World Glacier Monitoring Service 30th Anniversary

Zemp_20160831-25

The numbers on the left y-axis depict quantities of glacial mass loss from the WGMS and sea level rise, and the suns across the horizon contain numbers that represent the global increase in temperature, coinciding with the timeline on the lower x-axis From Jill Pelto

The World Glacier Monitoring Service (WGMS) celebrated 30 years of achievement last week. I have had the privilege of being the United States representative to the WGMS and was an invited speaker for the Jubilee held in Zurich, Switzerland along with Matthias Huss, Wilfried Haeberli, Liss Marie Andreassen and Irene Kopelman. This post examines the important role that WGMS has and continues to serve under the leadership of Michael Zemp. The organization has been compiling, homogenizing and publishing data on glacier fluctuations and mass balance primarily from 1986-2013. WGMS remains the leading organization for the collection, storage and dissemination of information on the fluctuations of alpine glaciers. The resulting standardized collection of alpine glacier data that is archived by WGMS, is also leading to analysis efforts that otherwise would be hampered by limited data and lack of homogeneity to the data. Glaciers are recognized as one of the best climate indicators.  Mass balance data is the best parameter to measure on glaciers for identifying climate change, because of its annual resolution. The core of the WGMS data set has been frontal variations, which indicate longer response to climate as well as dynamic changes.  The key data set today provided by WGMS are the reference glaciers.

This set of glaciers has a 30-year continuous record of annual mass balance measured in the field, and each glacier also has geodetic verification.  This mass balance data set is featured on the Global Climate Dashboard at NOAA. I report the mass balance of two reference glaciers Lemon Creek Glacier in Alaska and Columbia Glacier in Washington.  Today the field based work is being increasingly supplemented and supplanted by remote sensing methods.  This data sets indicates a period of sustained mass balance loss, and glacier retreat that Zemp et al (2015) using WGMS data noted as historically unprecedented.  The most recent compilation publication is the Global Glacier Change Bulletin.

This data set is of particular value during this period of climate change and is already chronicling the disapperance of a number of glaciers in the data set. Glacier loss is not a process that has been well documented. The WGMS data set can be enriched by more data from expanding monitoring, reporting data from archives and simply adding the submission of data as a step in the research process for those monitoring alpine glaciers. The video of my presentation looking at 33 consecutive years of field work and sharing this data after compilation with the WGMS is below. The slides below are from the Jubilee presentations.


[ngg_images source=”galleries” container_ids=”32″ display_type=”photocrati-nextgen_basic_imagebrowser” ajax_pagination=”1″ template=”/nas/wp/www/sites/blogsorg/wp-content/plugins/nextgen-gallery/products/photocrati_nextgen/modules/ngglegacy/view/imagebrowser-caption.php” order_by=”sortorder” order_direction=”ASC” returns=”included” maximum_entity_count=”500″]

Disastrous Year for North Cascade Glacier Mass Balance (Snow/Ice Economy)


Mass loss of North Cascade glaciers visualized.

A disastrous year is unfolding in 2015 for North Cascade glaciers, if normal melt conditions continue the range will lose 5-7% of its entire glacier volume in one year! For the 32nd consecutive year we were in the North Cascade Range, of Washington to observe the mass balance of glaciers across the entire mountain range. The melt season is not over, but already the mass loss is greater than any other year, with six weeks of melting left. An alpine glacier’s income is the snow that accumulates, and to be have an equilibrium balance sheet for a year, alpine glaciers typically need 50-65% snowcovered surfaces at the end of the melt season.  Below the accumulation zone, net assets are lost via ablation.

In 2015 of the 9 glaciers we examined in detail, 6 had less than 2% retained snowcover, which will be gone by the end of August.  Two more had no 2015 snowpack greater than 1.7 m in depth, which will also melt away before summer ends.  Average ablation during the August field season was 7 cm per day of snow, and 7.5 cm of ice. Only one glacier will have any retained snowcover at the end of the summer, we will be checking just how much in late September. This is the equivalent of a business having no net income for a year, but continuing to have to pay all of its bills. Of course that comes on top of more than 27 years of consecutive mass balance loss for the entire “industry” of global alpine glaciers.  The business model of alpine glaciers is not working and until the climate they run their “businesses” in changes, alpine glaciers have an unsustainable business model. Below this is illustrated glacier by glacier from this summer.  A following post will look at the glacier runoff aspect of this years field season.  The Seattle Times also featured our summer research.JillPeltoGMB_720_494_s_c1_c_c

Jill Pelto Painting of mass balance time series loss from 1984 to 2014. 

In a recent paper published in the Journal of Glaciology spearheaded by the WGMS group  (M. Zemp,  H. Frey, I.Gartner-Roer, S.Nussbaumer, M.Hoelzle, F.Paul, W.Haeberli and F.Denzinger), that I was co-author on, we examined the WGMS dataset on glacier front variations (~42 000 observations since 1600), along with glaciological and geodetic observations (~5200 since 1850).  The data set illustrated that “rates of early 21st-century mass loss are without precedent on a global scale, at least for the time period observed and probably also for recorded history.The rate of melting has been accelerating, and in the decade from 2001 to 2010, glaciers lost on average 75 centimetres of their thickness each year”, this is compared to the loss in the 1980’s and 1990’s 25 cm and 40 cm respectively each year (Pelto, 2015).  A comparison of the global and North Cascade Glacier mass balance records since 1980 indicate the cumulative loss, at bottom.

DSC08917

Columbia Glacier terminus August 3, 2015 with new expanding lake.

DSC00199

Upper portion of Columbia Glacier on Aug. 5, 2015 note lack of snowcover and all previous firn layers (firn is snow that survived a melt season but is not yet glacier ice).

DSC00503

Foss Glacier lacking snowcover and losing area fast this summer, this glacier will lose more than 15% of its volume in 2015.

DSC00435

Measuring firn from 2011-2014 retained in a crevasse on Easton Glacier, 2015 snowpack lacking.

DSC00429

The typical end of summer snowline elevation on Easton Glacier, bare ice and firn in 2015.

DSC09197

Rainbow Glacier amidst the normal accumulation zone, where there should be 3-4 m of snowpack, none left.

DSC09602

Lynch Glacier view across the typical end of summer snow line region on Aug. 17th 2015.

DSC00413

Terminus of Lower Curtis Glacier with many annual layers exposed to rapid melt, 31 m of retreat from spring to August 11th, 2015.

DSC00448

ice worm firn

Only firn from 2013 and 2014 and bare ice at surface of Ice Worm Glacier.

ba2014


Comparison of cumulative glacier mass balance in the North Cascades and Globally (WGMS)

DSC00348

Primary field team for the from left, Mauri Pelto (Nichols College), Jill Pelto (UMaine), Tyler Sullivan (UMaine), Ben Pelto (UNBC) and Erica Nied (U-Colorado) summer with contributions from Justin Wright, Tom Hammond, Oliver Grah and Jezra Beaulieu not pictured

Sholes Glacier, Washington: Measuring Annual Glacier Mass Balance

Annual mass balance is the difference between ice and snow added to the glacier via accumulation and snow and ice lost via ablation and in some cases calving. Alpine glacier mass balance is the most accurate indicator of glacier response to climate and along with the worldwide retreat of alpine glaciers is one of the clearest signals of ongoing climate change (WGMS,2010). For 25 consecutive years we (North Cascade Glacier Climate Project) have measured the mass balance of Sholes Glacier. On Sholes Glacier in 2014 we completed 162 measurements of snowpack depth using probing and crevasse stratigraphy, mainly probing on this relatively crevasse free glacier.  We mapped the extent of snowcover on several occasions, and using the retreat of the snowline and stakes emplaced in the glacier observed the rate of ablation (melting). We also measured runoff from the glacier in a partnership with the Nooksack Indian Tribe, which provided an independent measure of ablation. The final mass balance in 2014 was -1.65 m of water equivalent, the same as a 1.8 meter thick slice of the glacier lost in one year. In 2014 we arrived at Sholes Glacier to find it already had 15% blue ice exposed, on August 7th. This had expanded to 25% by August 12th. This rapidly expanded to 50% by August 23rd, note Landsat comparison below. The snow free area expanded to 60% by the end of August and then close to 80% loss by the end of the summer. Glaciers in this area need 60% snowcover at the end of the melt season to balance their frozen checkbook. This percentage is the accumulation area ratio. This mass balance data is then reported to the World Glacier Monitoring Service, along with about 110 other glaciers around the world.  Unfortunately the WGMS record indicates that Global alpine glacier mass balance was negative in 2014 for the 31st consecutive year.  The video below explains how we measure mass balance each year with footage from the 2014 field season.  Of course a key aspect is hiking to the glacier and camping in a tent each year.

The Sholes Glacier thickness has not been measured, but there is a good relationship between area and thickness, that suggests the glacier would average between 40 and 60 m in thickness. The 15 m of water equivalent lost from 1990-2014 is equal to nearly 17 m of ice thickness, which would be at least 35% of the glaciers volume lost during our period of measurement.

DSC07194 sholes 915og

Sholes Glacier on August 7, 2014 and Sept. 15 2014, the glacier had lost 80% of its snowcover at this point an indicator of poor mass balance 2014.

sholes landsat 2014
Landsat 8 images of Sholes Glacier in 2014, with red line indicating snow line.

sholes probing snowpack rainbow stratigraphy

Measuring Accumulation on a glacier using Probing and crevasse stratigraphy.

DSC02001
Base Camp where we have spent more than 100 nights in a tent in the last three decades.

31 years of observations on Retreating Columbia Glacier, Washington

For the last 31 years the first week of August has found me on the Columbia Glacier in the North Cascades of Washington. Annual pictures of the changing conditions from 1984 to 2014 are illustrated in the time lapse video below. This is the lowest elevation large glacier in the North Cascades. Columbia Glacier occupies a deep cirque above Blanca Lake and ranging in altitude from 1400 meters to 1700 meters. Kyes, Monte Cristo and Columbia Peak surround the glacier with summits 700 meters above the glacier. The glacier is the beneficiary of heavy orographic lifting over the surrounding peaks, and heavy avalanching off the same peaks. This winter has been the lowest year for snowpack in the North Cascades in the 32 years we have worked here.  Below is a comparison from August 1, 2011 with Blanca Lake below the glacier still frozen and a beautiful scene on April 4, 2015 with the lake not frozen taken by Karen K. Wang.  The winter in the region was unusually warm, but not as dry as in California; however, in the snowmelt and glacier fed river basins summer runoff will be low this year.


Blanca Lake Aug. 1, 2011 on left and April 4, 2015 on right (Karen K. Wang, www.karenkwang.com)
Blanca Lake Aug. 1, 2011 on left,  and April 4, 2015 on right (Karen K. Wang, www.karenkwang.com)

Over the last 31 years the annual mass balance measurements indicate the glacier has lost 14 meters of thickness. Given the average thickness of the glacier of close to 75 meters in 1984 this represents a 20% loss in glacier volume. During the same period the glacier has retreated 135 meters, 8% of its length. Most of the loss of volume of this glacier has been through thinning not retreat.  To survive a glacier must have a persistent and consistent accumulation zone (Pelto, 2010).  On Columbia Glacier in 1998, 2001, 2003, 2004, 2005, 2009 and 2013 limited snowpack was retained, resulting in thinning even on upper part of the glacier.  This thinning of the upper glacier indicates the lack of a persistent accumulation zone such as in 2005, note the exposed annual ice and firn layers green arrows, this indicates the lack of retained accumulation in recent years.  This indicates the glacier is in disequilibrium and cannot survive. Mapping of the glacier from the terminus to the head indicates a similar thinning along the entire length of the glacier.  The overall mass balance loss parallels that of the globe and other North Cascade glaciers in the last three decades.

columbia accumulation zone 2005

2005 Accumulation zone of Columbia Glacier


On left cumulative mass balance of Columbia Glacier compared to the WGMS global record and other North Cascade glaciers. On right change in surface elevation along the glacier from terminus to head indicating a 14-15 m thinning on average.

A comparison of images from  1986, 2007 and 2013 photograph provide a view of  glacier change at the terminus. The blue arrows indicate moraines that the glacier was in contact with in 1986, and now are 100 meters from the glacier. The green arrow indicates the glacier active ice margin in 1986 and again that same location in 2007 now well off the glacier. The red arrow indicates the same location in terms of GPS measurements, this had been in the midst of the glacier near the top of the first main slope in 1986. In 2007 this location is at the edge of the glacier in a swale. The changes are more pronounced in 2013 as the terminus slope continues to decrease. The low snowpack in 2015 on the glacier in March, 2-3 m versus 6-8 m, will lead to considerable changes in the terminus this summer, that we will assess.

1986 Terminus Columbia Glacier

columbia 2007 comp

2007 Terminus Columbia Glacier

columbia glacier2013 comp.

2013 Terminus Columbia Glacier

Jill Pelto painted the glacier as it was in 2009 (top) and then what the area would like without the glacier in the future, at least 50 years in the future (middle), and Jill at the sketching location (bottom), turned 180 degrees to view Blanca Lake. The lake is colored by the glacier flour from Columbia Glacier to the gorgeous shade of jade.

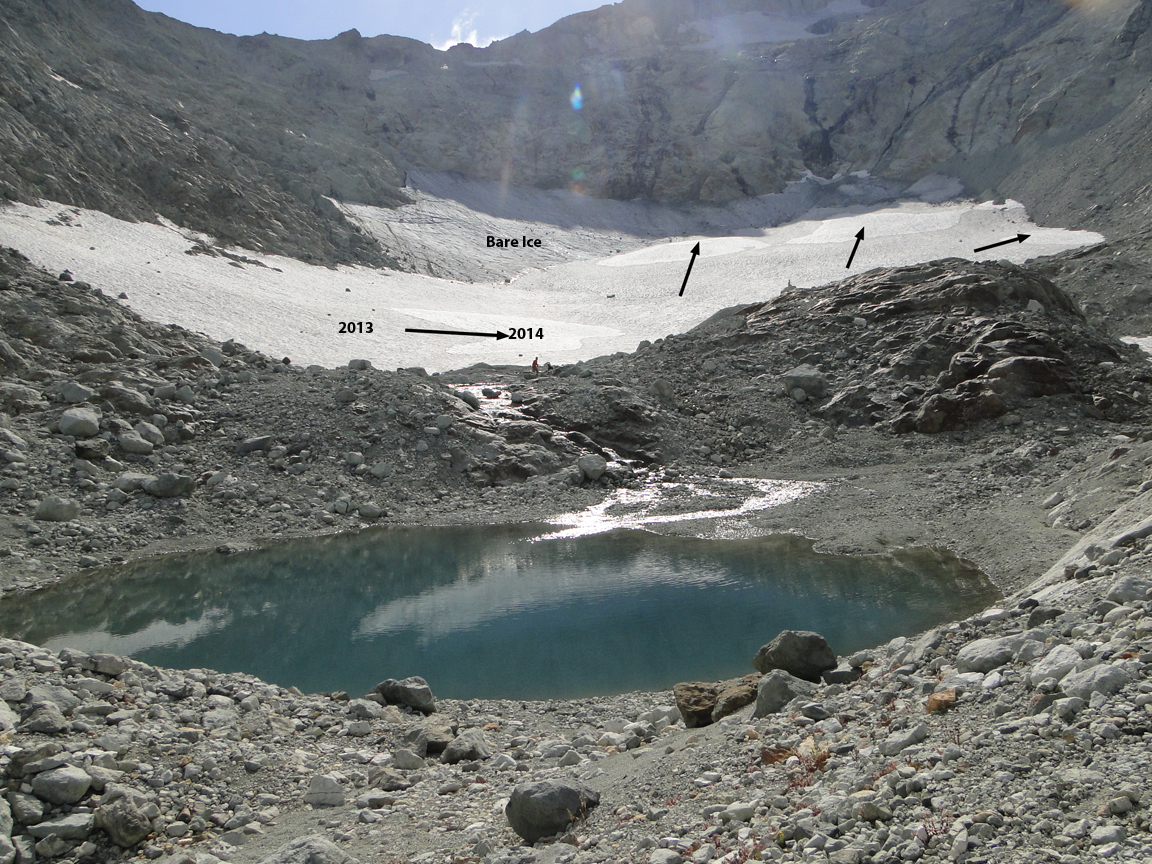
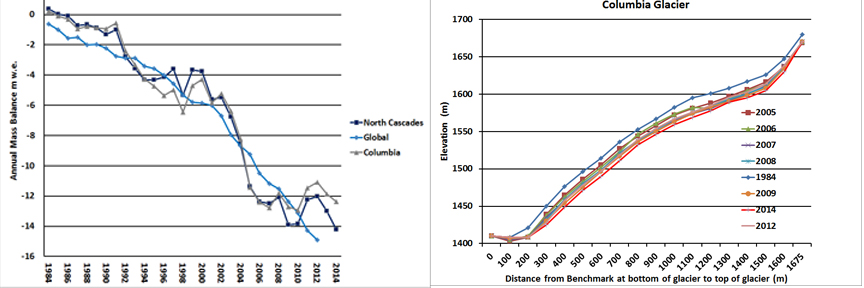
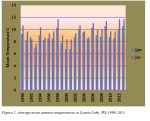
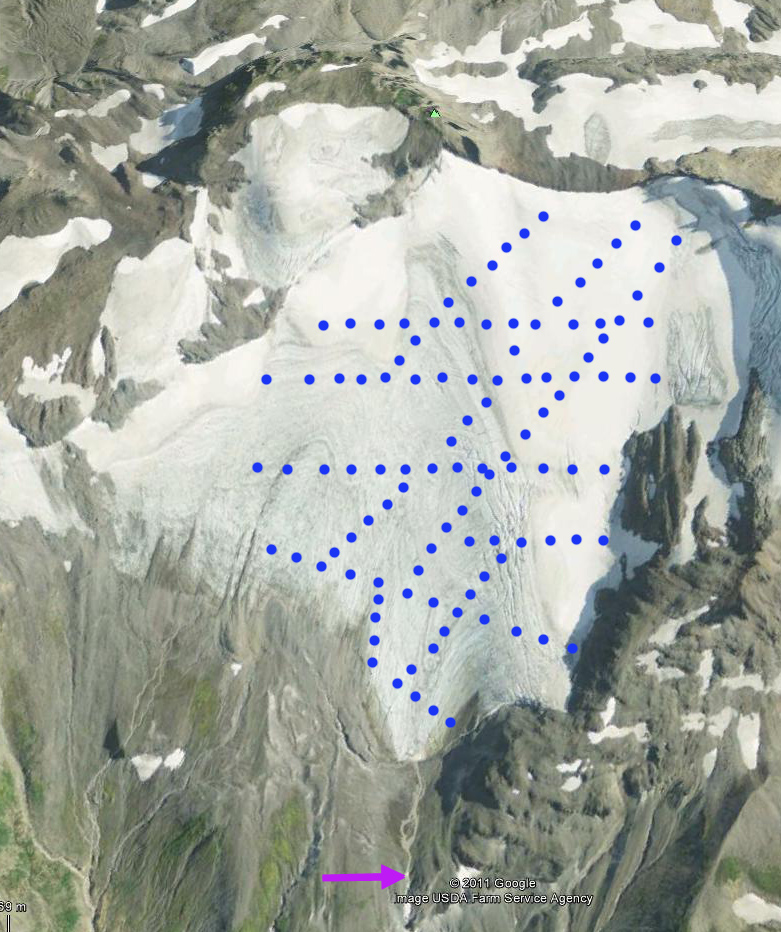
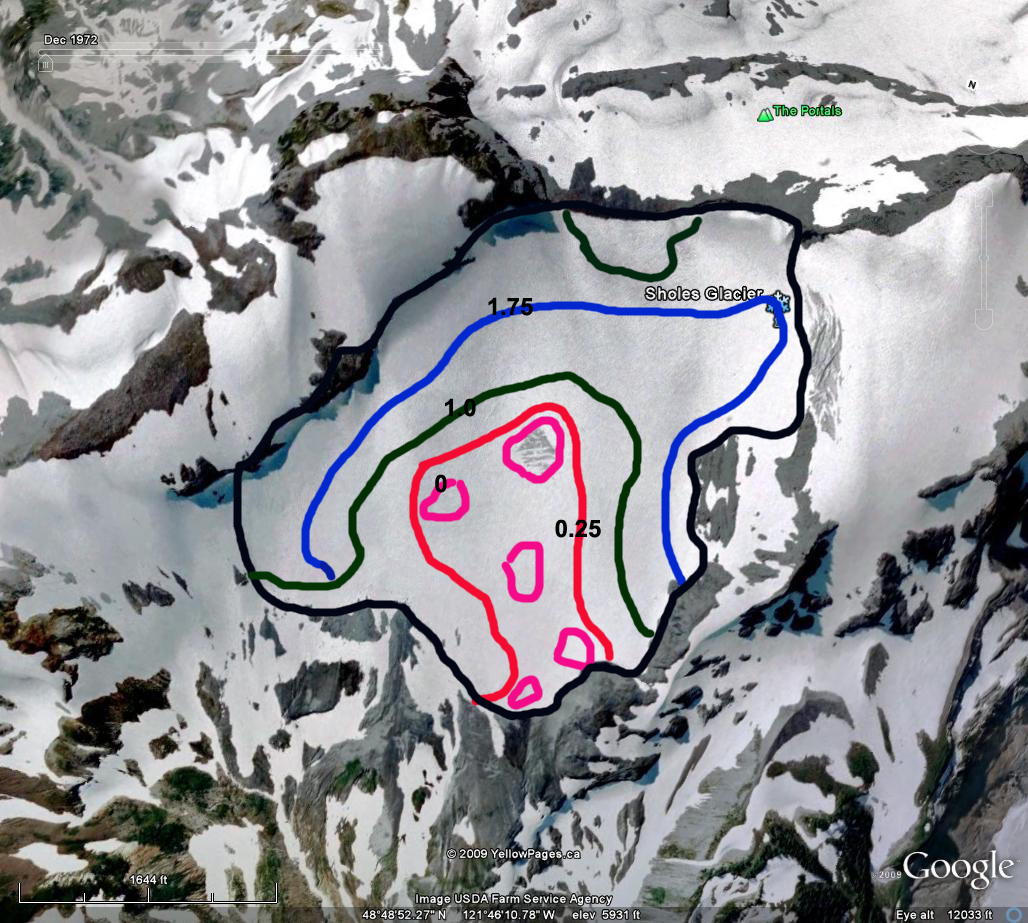
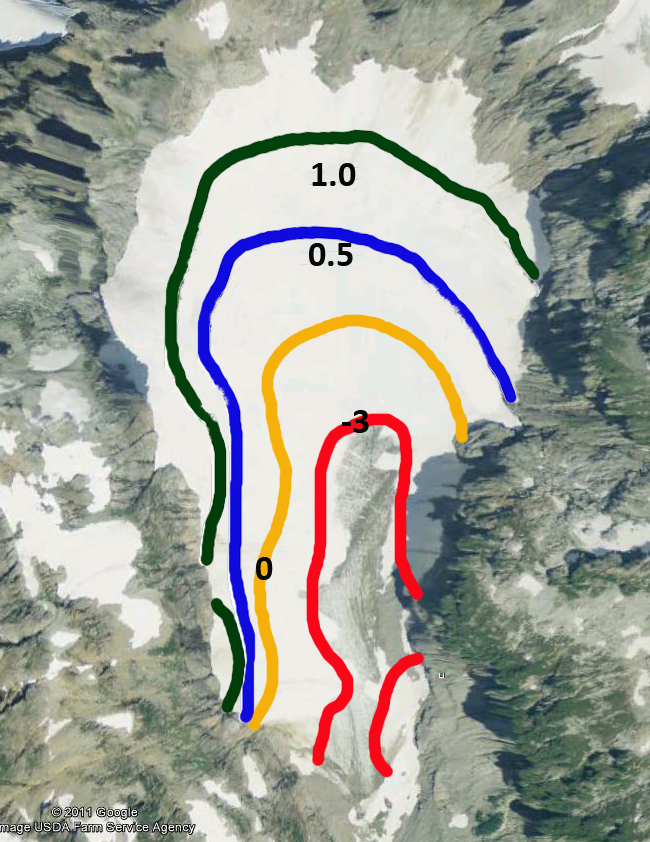
Clearly the area will still be beautiful and we will gain two new alpine lakes with the loss of the glacier. After making over 200 measurements in 2010 we completed a mass balance map of the glacier as we do each year. This summer we will be back again for the 32nd annual checkup.  There will be likely be record low snowpack, comparable to 2005 the worst year from 1984-2014.

2010 Mass Balance map of Columbia Glacier

2014 North Cascade Glacier Field Season, 31st consecutive year.

This is the 31st consecutive field season for the North Cascade Glacier Climate Project. This project begun in 1984 monitors the response of North Cascade glaciers to climate change and monitors the mass balance of more glaciers than any other program in North America. This entails measuring mass balance, terminus position, surface elevation changes and glacier runoff. This is done with a combination of field measurements and satellite imagery. The unique aspect is we use no helicopter or outside support, everything is backpacked in by us. This summer our main focus will be continued work with the Nooksack Indian Tribe particularly Oliver Grah and Jezra Beaulieu, who have worked with us in 2012 and 2013. We are quantifying the role of glacier runoff on conditions for salmon in the Nooksack River. The critical aspect of this is underscored by our findings on the impact on stream discharge and temperature. Our utilization of satellite imagery and ground truth measurements caught the attention of NASA last summer. We will continue our annual mass balance survey of 10 glaciers, terminus survey of which ever glaciers have exposed termini, mountain goat survey on Ptarmigan Ridge and ice worm survey on Sholes Glacier. What we do is march around each glacier and measure the snow accumulation, ablation, survey the terminus and elevations across the glacier, then head back to our tents for the night.  We will look to again combine our field data with Landsat 8 imagery.

Selected Posts on the glaciers we will be observing.  There will be no new posts for three weeks during the field season.

Columbia Glacier, Washington**********************Deming Glacier, Washington
Lower Curtis Glacier Annual Survey, Washington*****Easton Glacier Assessment, Washington
Mount Baker Mass balance, Washington**********Ptarmigan Ridge Glacier, Washington
Rainbow Glacier, Washington********************Daniels Glacier, Washington
Nooksack Basin********************************Mount Baker Glacier Mass Balance


The snowpack on June 1 was quite normal at glacier elevations in the North Cascades. The peak mean snow depth is typically on May 10th, but this year it was May 3rd. An El Nino is forecast to begin during the fall, though the forecast is not robust. This typically leads to warm conditions in the North Cascades. June and July have been warm and dry leading to forest fires east of the Cascade Crest, snow levels have dropped below normal by July 1, and a warm July had led to more exposed ice on the glaciers than usual. The field crew for 2014 consists of scientists and visual artists. The value of the scientific data from this program, the most extensive in monitoring glaciers in the United States continues to increase as the time series extends. It is equally evident that the data does not speak for itself to most people. This year we will have an additional focus on production of video and illustrative art that tells the story of glacier change in a different fashion. The goal will be to weave the four threads of science, nature, video and illustrations into the most compelling narrative we have produced.

Mauri Pelto:
The director of the project for 31 years and also the US representative for the World Glacier Monitoring Service. This includes more than 600 nights in a tent in the North Cascades measuring glaciers.

Ben Pelto
Ben has finished his MS at UMASS-Amherst in geosciences and will be heading to University of Northern British Columbia in the fall for a doctoral program. This will be his tenth year working in the North Cascades. He has also worked on glaciers at the summit of Mount Kilimanjaro and has taken part in scientific drilling voyage on the USCGC Healey in the Arctic Ocean.

Jillian Pelto:
Jill is a senior double major in Earth Sciences and Art at UMaine. She will be spending her sixth year in the field on North Cascade glaciers. This year she also worked in the Dry Valleys of Antarctica with a research team from the University of Maine and UC-Davis.

Ashley Edwards:
Is a senior in geology at Central Washington University, and has worked as an Aquatic Ecologist in Alaska. Most importantly is an avid skier.

Justin Wright Is a senior at Oregon State University. He has worked as a web developer before getting smart and going into the earth sciences. He has worked and climbed on Mount Saint Helens and Mount Adams.

Tom Hammond
Has spent portions of 11 field season with us. And visits one of our glaciers at the end of each melt season. He is Vice President of the North Cascades Conservation Council. He is also Project Manager at the University of Washington in the Information Technology and Services area.
Tom was in the Cascades for a spring avalanche assessment and has a report on it at NCCC


Visual Crew consists of

Melanie Gajewski, Videographer
Melanie has just graduated with a degree in business at Nichols College and is enrolled in the MBA program. At Nichols College she directed most of the TV commercials used by the college in the last two years. Her aim is to be a videographer specializing in Environmental Awareness issues. She is an avid hiker, this is a first trip to glaciers.

Welcome to Visual – Melanie Gajewski from Visual Communications on Vimeo.


Megan Pelto, Illustrator:

Megan is a senior in the Illustration program at Savannah College of Art and Design. She has an extensive camping background, but this will be a first visiting the glaciers.

Jillian Pelto, Painting and Printing: I a senior Art major at University of Maine.

Hike into Easton Glacier
Survey Easton Glacier terminus and Lower Bench
Survey Upper Easton Glacier
Hike out Easton Glacier-Hike in Heliotrope
Heliotrope Glacier survey
Hike Out Heliotrope- Hike in Rainbow Glacier
Sholes Glacier Survey
Rainbow Glacier Survey
Hike out Rainbow Glacier-Hike in Lower Curtis Glacier
Lower Curtis Glacier Survey
Hike out Lower Curtis Glacier; Hike in Columbia Glacier
Columbia Glacier survey
Hike out Columbia Glacier
Hike in Mount Daniels
Ice Worm Glacier Survey
Mount Daniels Survey
Lynch Glacier Survey
Hike out Mount Daniels

Pacific Northwest Glacier Mass Balance 2013

North Cascades Climate Conditions:
The 2013 winter accumulation season featured 93% of mean (1984-2013) winter snow accumulation at the long term USDA Snotel stations in the North Cascades, Washington (Figure 1). The melt season was exceptional by several measures. The mean summer temperature from June-September and July-September at Lyman Lake is tied with the highest for the 1989-2013 period (Figure 2). The average minimum temperature at Lyman Lake was the highest since 1989 for the July-September period, and tied with the highest for the June-September period (Figure 3). SeaTac airport minimums were high as well indicating the regional nature.

Glacier Mass Balance:
Snow depth was measured at a 30 m spacing across the entire glacier on August 4th. The position of the snowline indicates the location where snow depth is zero. Assessment of stakes emplaced in the glacier from Aug. 3-20 indicates mean ablation during the period of 7.8 cm/day. Assessment of ablation from remapping of the snowline on Sept. 1 indicates mean ablation of 7.5 cm/day during the August 4th-Sept. 1st period. A preliminary map of Sholes Glacier mass balance for Aug. 8th is seen below (Figure 6). The contours are in meters of water equivalent, which is the amount of water thickness that would be generated if the snow or ice was melted. Note the similarity of the 1.75 m contour and the Sept,. 12th snowline.The best measure of ablation over the period from August 4th to Sept. 12th is the shift in the snowline, as identified in satellite imagery (Figure 7 and 8). The snow depth at a particular location of the snowline on Sept. 12th indicates the snow ablation since August 4th. Observations of the snowline margin on Aug. 20, Sept. 1 and Sept. 12 indicated mean ablation of 7.4 cm per day from Aug. 4th to Sept. 12th.

sholes 2013 August melt
Figure 4 Comparison of snowpack on Sholes Glacier on August 4th and September 1st, 2013

sholes glacier network
Figure 5. Sholes Glacier snow depth measurement network

sholes 2013 8-8
Figure 6. Snow depth distribution in snow water equivalent on Sholes Glacier on Aug. 8th, 2013.

sholes 8-4-2013
Figure 7 August 4th satellite image showing snowline on Sholes Glacier from Landsat imagery.

sholes 9-12-2013
Figure 8. September 12 snowline on Sholes Glacier from Landsat imagery

Snow depth observations on Easton Glacier on the bench below the main icefall at 2000 m, yielded an average depth of 3.1 m on Aug. 10th. The bench was completely snowcovered on Aug. 10th. GPS measurements of the snowline on Sept. 15th indicate ablation of 2.75 m since Aug. 10th. This is an ablation rate of 7.6 cm of snow melt per day. This is 0.2 cm/day higher than Sholes Glacier. The time period is not identical either. The southern orientation of Easton Glacier typically leads to higher ablation rates at specific elevations than on Sholes Glacier. Satellite observations of the change in snowline position compared to snow depth observations from Aug. 4th to Sept 12th indicate mean ablation of 7.2-8.0 cm/day.

On the four Mount Baker glaciers a total of 380 snow depth measurements were made on (Figure 9). The initial mass balance assessment is -0.78 m on Columbia Glacier. -1.58 m on Easton Glacier, -0.5 m on Foss Glacier, -0.76 m Ice Worm, -0.85 m on Lower Curtis Glacier, -0.40 m Lynch Glacier, -1.85 m on Rainbow Glacier, -1.7 m on Sholes Glacier and -1.15 m on Yawning Glacier. easton crevasse depth
Figure 9 Snow depth in crevasse on Easton Glacier.

columbia glacier Ba 2013
Figure 10 Mass balance map for Columbia Glacier in meters of water equivalent.

On the Juneau Icefield in southeast Alaska the ablation season was warmer and longer than normal. The result was snowlines rising above average at Lemon Creek and Taku Glacier, where the Juneau Icefield Research Program measures mass balance. For Taku Glacier the ELA was 1050 m, 75 m above an equilibrium snowline, and 1115 m, 100 m above an equilibrium snowline for Lemon Creek Glacier. The final mass balance for these glaciers will be in the -0.5 to -1.0 m range for both. Further north the USGS reports preliminary results, from there two Alaskan benchmark glaciers, which indicate that Gulkana Glacier in the Alaska Range, mass balance was the 5th most negative year. At Wolverine Glacier in the Kenai Mountains mass balance will likely be the most negative on record. In British Columbia both the Helm Glacier and Place Glacier are observed annually for mass balance. On Sept 12, 2013 Landsat imagery indicates limited remaining snowcover on both of these glaciers. The snowline is at 2050 m on Helm Glacier and 2300 m on Place Glacier, red arrows. The snowcovered area is less than 20% on Helm Glacier and 30% on Place Glacier, which will lead to large negative mass balances (Figure 11 and 12). Hence, all 16 glaciers examined here will have significant negative mass balances in 2013.

taku lemon creek snowline 2013
Figure 11. Landsat image indicating the snowline on Sept. 24, 2013 on Lemon Creek and Taku Glacier.

helm glacier 2013
Figure 12 Helm Glacier in Landsat imagery 9-12-2013

place glacier 2013
Figure 13 Place Glacier in Landsat imagery 9-12-2013

Building a 30-year Glacier Mass Balance Time Series

The above video looks at the effort behind a long term field study, looking at images from 11 of the 30 years of our research, digital cameras became good then. Long term monitoring programs have until recently been unattractive for federal grantmakers, since they are not directly advancing the frontiers of science. However, many long duration time series from monitoring programs do advance science eventually as the response to changes in environmental or climate conditions are documented. In 1984, I responded to a request from the US National Academy of Sciences, “to monitor glaciers across an ice clad mountain range”, something that was not being done anywhere in Norther America. Thirty years later we are still pursuing this project. We have developed a 30 years time series of glacier mass balance on glaciers across the North Cascades of Washington. To ensure that the program could be sustained, we did not pursue any federal funding for the project. The data we, collect is submitted to the World Glacier Monitoring Service (WGMS) each year, the regional time series built in the North Cascade is just part of the contribution to the global glacier mass balance time series at WGMS. The cumulative North Cascades glacier mass balance record is in fact quite similar to the cumulative global mass balance time series. For the globe there have been 22 consecutive years of negative mass balance, that is the reality of the impact of global warming on mountain glaciers around the globe. The impact on the glaciers of Mount Baker was recently published Pelto and Brown (2012)
Slide1