HPS-12, Chile Spectacular Retreat 1985-2025

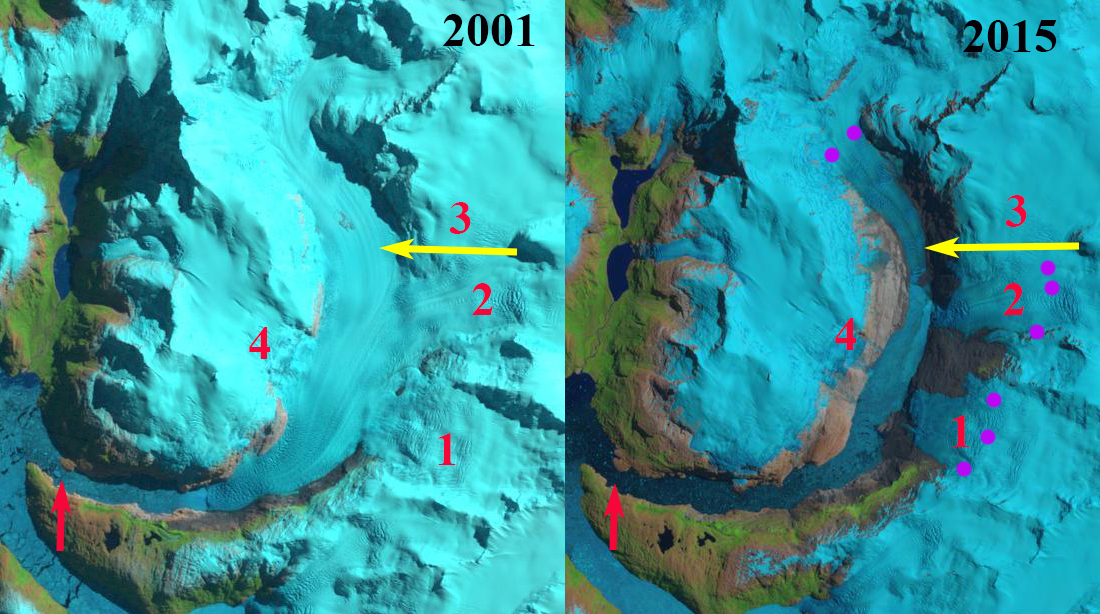
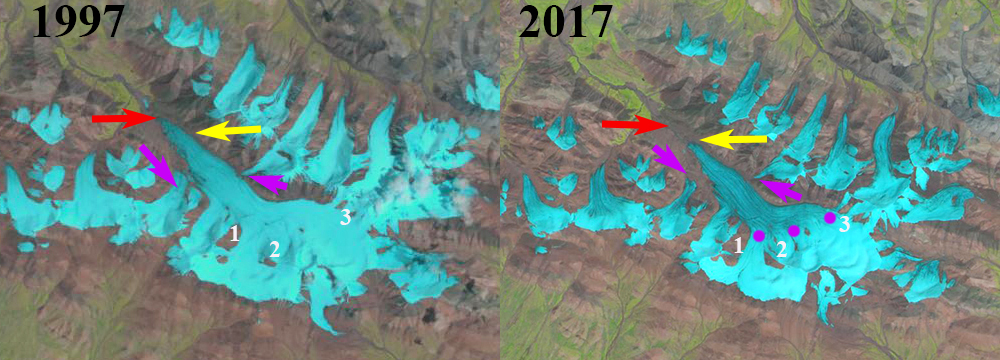
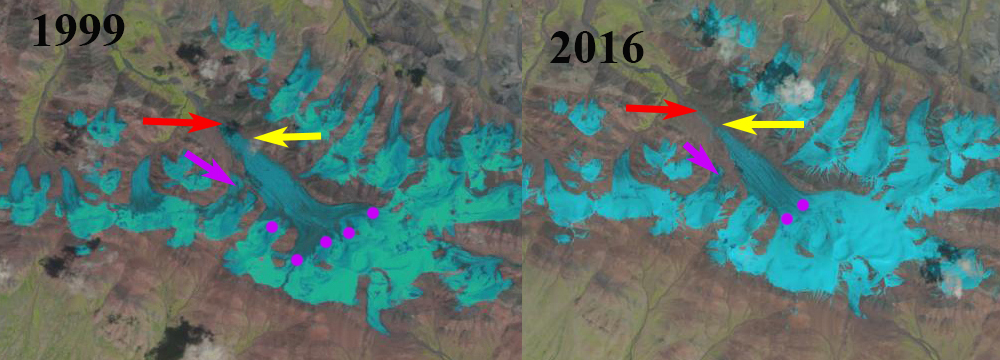
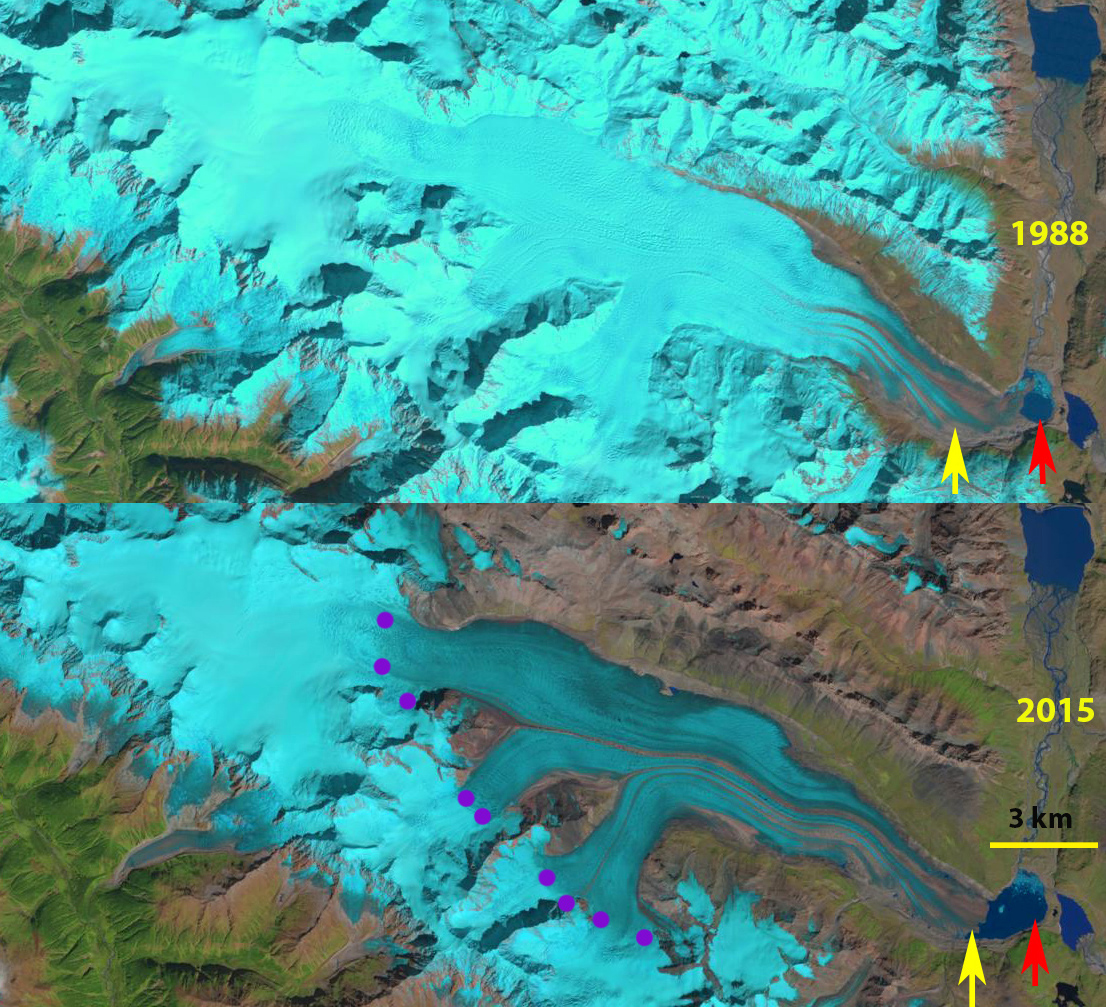
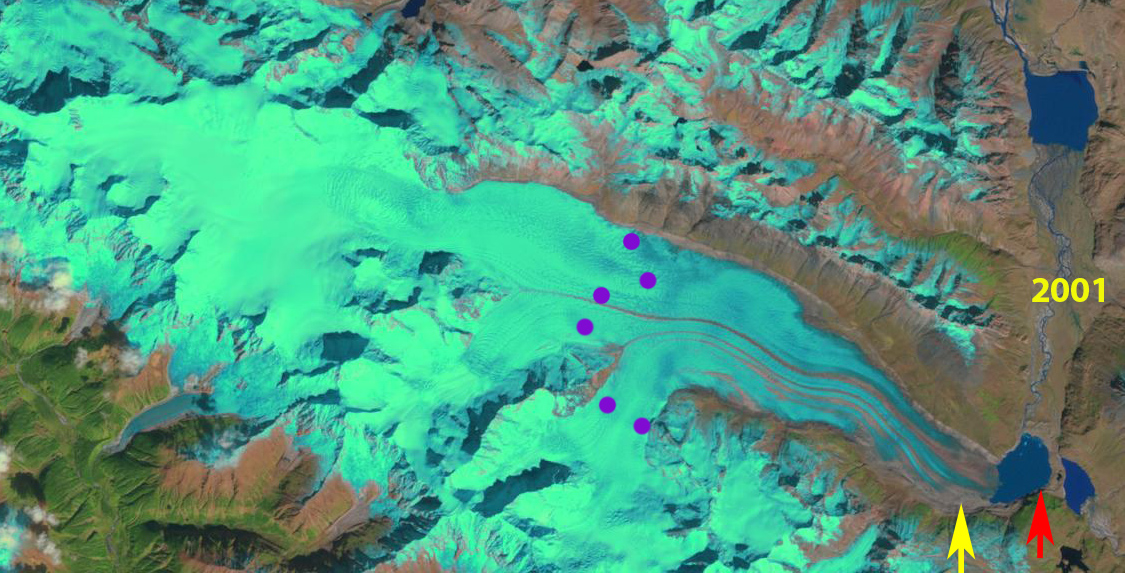
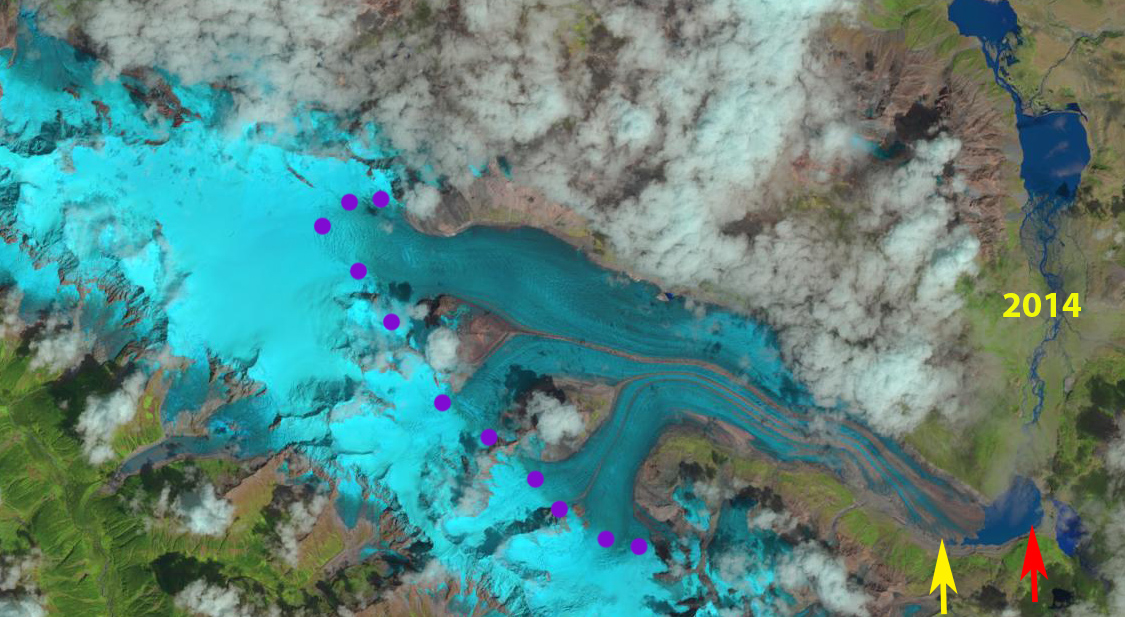
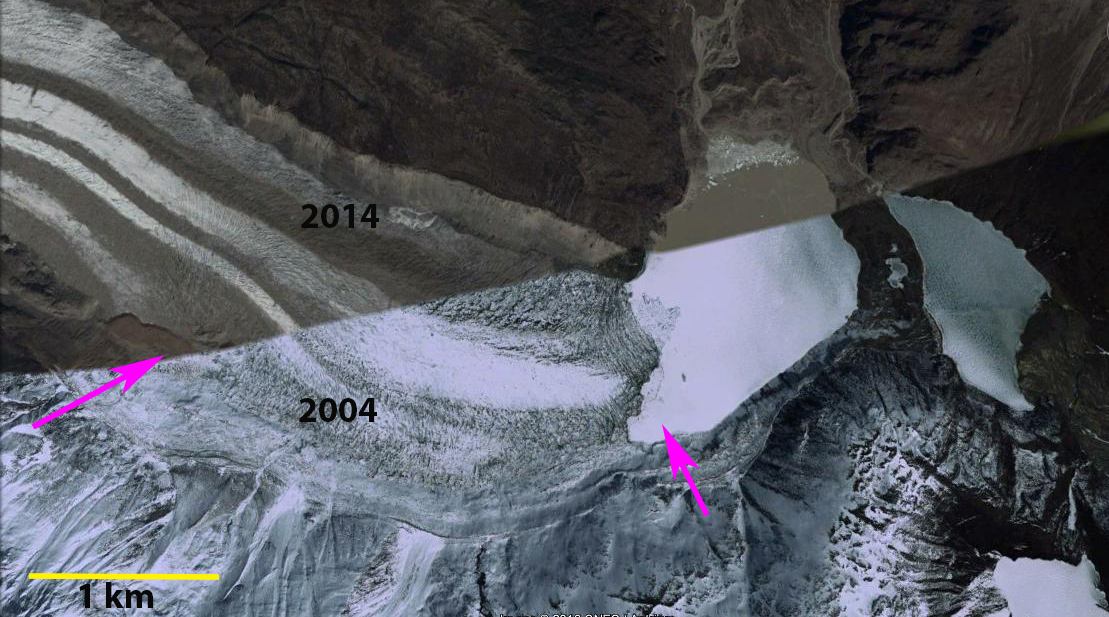
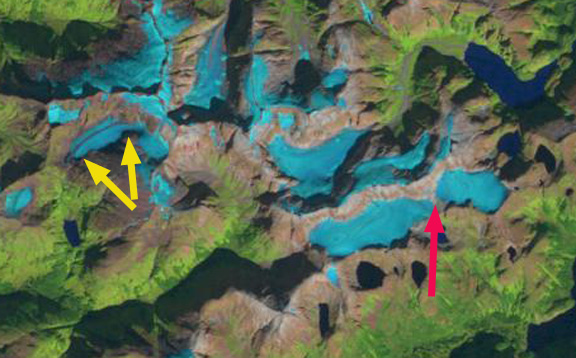
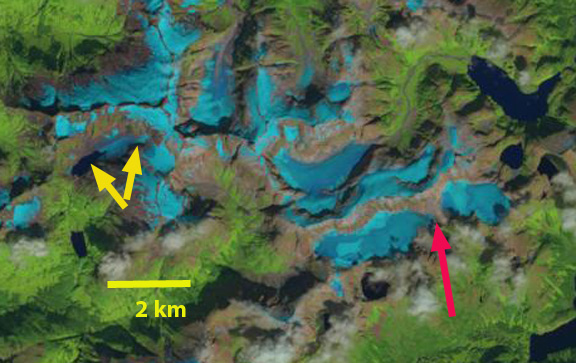
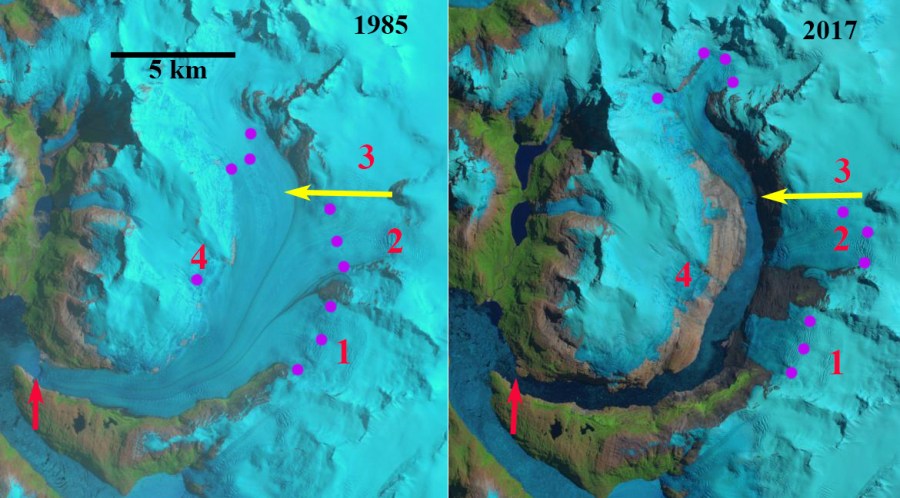
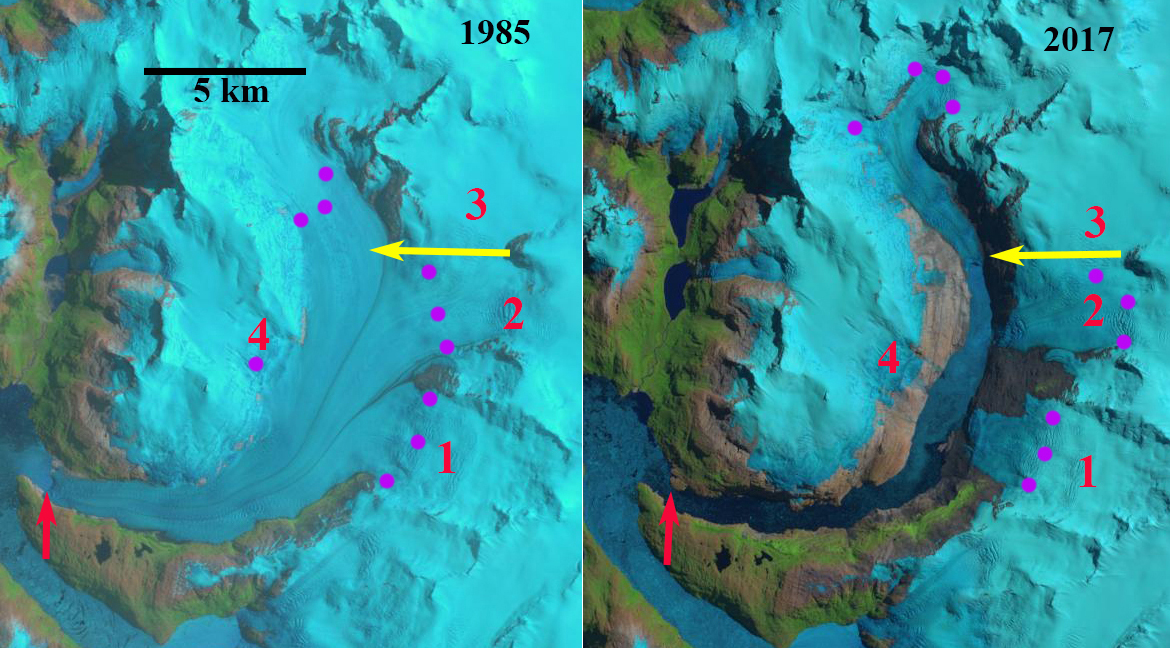
HPS-12 Glacier in 1985 and 2017 Landsat images.  The red arrow indicates 1985 terminus, yellow arrows the 2017 terminus, purple dots the snowline and 1-4 are tributaries.  By 2017 all tributaries have detached and the glacier has retreated 13 km. 

HPS-12 is an unnamed glacier draining the west side of the Southern Patagonia Ice Cap (SPI).  The glacier terminates in a fjord and is adjacent to Upsala Glacier to the east and Pio IX Glacier to the north. This developing fjord is also unnamed but feeds into Estero Falcon. Here we update the 2017 NASA Earth Observatory project I completed in 2017, that identified this as the fastest retreating glacier in Chile in the 1985-2017 period, using Landsat imagery from 1985-2025. 

HPS-12 Glacier in 2015 and 2025 Landsat images.  The red arrow indicates 1985 terminus, yellow arrows the 2025 terminus, black arrow the 2015 terminus. Former tributary 1 and 2 have declined in width . 

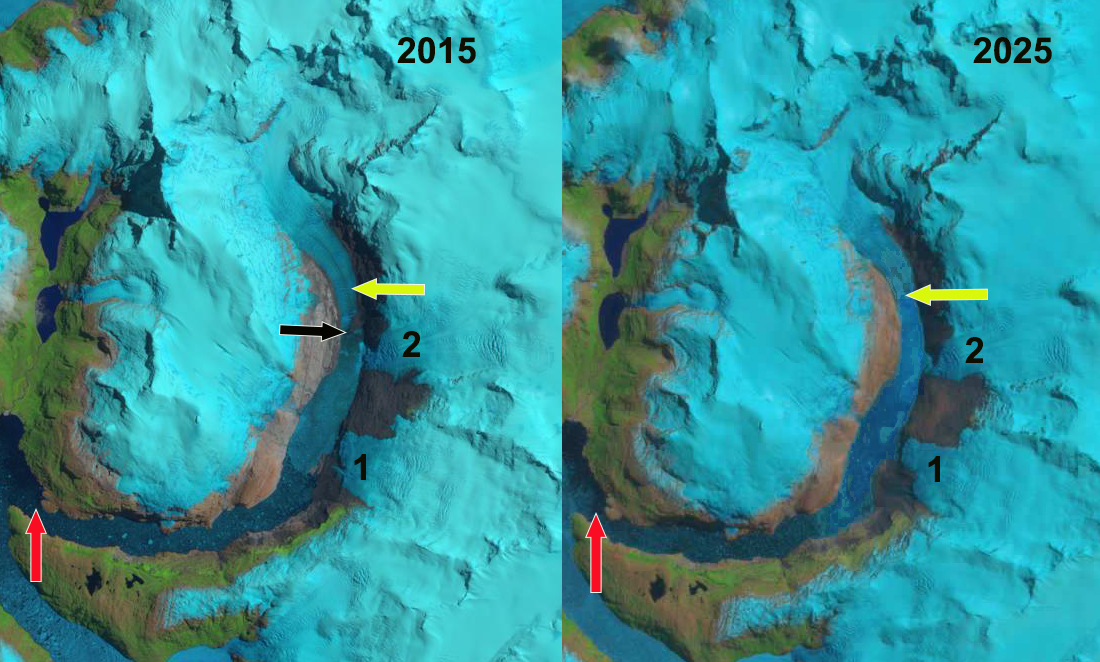
 In 1985 the HPS-12 terminates 1.5 km from the junction of two fjords that are occupied by HPS-12 and HPS-13.  These are separated by a peninsula.  The glacier is fed by four tributaries labelled 1-4. The snowline in 1985 is at 900 m.  In 2001 the four tributaries still join the main glacier, but the terminus has retreated 3.5 km.  In 2015 glacier retreat has led to separation of tributary 1, 2 and 4 from the main glacier, tributary 3 only feeds tributary 2 and not the main glacier.    The glacier retreat has continued to 2017, the current terminus is 800 m wide vesus 2800 m wide in 1985 .  Total retreat from 1985 to 2017 was 13 km.  By 2025 the glacier has retreated 14.75 km and has lost more than 50% of its total length. Tributary 1 and 2 continue to narrow from 2015 to 2025 illustrating that flow from the icefield accumulation zone is being reduced. This suggests less discharge into the terminus reach of HPS-12.

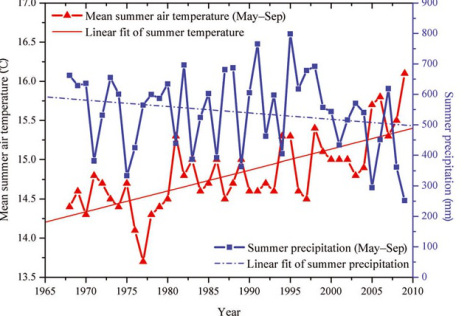
This glacier follows the pattern of retreat we have reported from Bernardo Glacier, O’Higgins Glacier, Tyndall Glacier and Upsala Glacier. The retreat is driven by the SPI have been experienced significant mass loss a. Malz et al (2018) noted a ~1 m/year mass loss from 2000-2016 with HPS-12 and Jorg Montt Glacier losing the most. Minowa et al (2021) found that 35% of all ablation of the Patagonia Icefields stemmed from frontal ablation.

HPS-12 Glacier in 2001 and 2015 Landsat images.  The red arrow indicates 1985 terminus, yellow arrows the 2017 terminus, purple dots the snowline and 1-4 are tributaries.  By 2015 tributaries 1, 2 and 4 have detached. 

Rikeva Glacier, Novaya Zemlya 2000-2025 Retreat Releases New Island

Rikeva Glacier retreat in Landsat images from 2020 and 2025. Illustrates new island at Point A and retreat of land terminus at Point B and from headland at Point C.

Rikeva (Rykacheva) Glacier flows from the Northern Novaya Zemlya Ice Cap to the west coast and the Barents Sea. The glacier has been retreating rapidly like all tidewater glaciers in northern Novaya Zemlya (Pelto, 2016) (Carr et al 2014) identified an average retreat rate of 52 m/year for tidewater glaciers on Novaya Zemlya from 1992 to 2010. Maraldo and Choi (2025) identified frontal retreat rate of Novaya Zemlya glaciers from 1931-2021 and found an increased each decade since the early 1970s, reaching a peak retreat rate of 65 m/year between 2011 and 2021. We have observed the impact at Vilkitskogo Glacier and Krayniy Glacier,

In 2000 Rikeva Glacier extended beyond the island that would emerge at Point A. The landbased terminus lobe extended just beyond Point B. By 2013 the glacier had retreated adjacent to the island, with the island acting as a stabilizing point for the terminus. The terminus lobe had retreated just south and east of Point B.

Rikeva Glacier in Landsat images from 2000 and 2013 illustrating retreat to island at Point A and retreat of land terminus at Point B.

In 2018 Rikeva Glacier terminus rested on an island at Point A that acted as a buttress for the glacier terminus. By 2025 the glacier had retreated from the island with 4.5 km2 of glacier retreat since 2018 and 8 km2 of retreat since 2000.

Rikeva Glacier in Sentinel images from 2018 and 2025 illustrates retreat from Island at Point A.

Gangge’er Glacier, Retreat & Tributary Separation Qilian Mt. China

Gangge’er Glacier, Qilian Mt., China comparison in 1997 and 2017 Landsat Images.  Yellow arrows indicates 2017 terminus, red arrows the 1990 terminus, and purple arrows tributaries that have detached.  The snowline is  purple dots and Points 1-3 indicate bare rock areas amidst the glacier.

The largest glacier in the Gangge’er Xiaoheli Shan range of the the Qilian Mountains in China, here referred to as Gangge’er Glacier, drains northwest into the Shule River.   Glaciers in the Qilian Mountains in northwest China’s Gansu Province have shrunk by 36 square kilometers, a 4.2 percent loss, during the past decade Quiang (2016).  Tian et al (2014) report Qilian Mountain glacier area shrank by 30% from 1956 to 2010 and the shrinkage accelerated remarkably in the past two decades.  Yang et al (2015)  Results show that mountain glaciers in China are very vulnerable to climate change with 41% of glaciers having had a high vulnerability in the period 1961–2007. For the Upper Shule Basin the impact of glaciers on the overall water resource is not known as Li  and Yang (2017) observe that  that the basic features of precipitation in the upper reaches of the Shule River were unexplored prior to their study and there is no national weather station in the basin.  They found that most of the precipitation occurred during the summer. 

What is apparent in a comparison of Landsat images from 1997-2017 is the changes in the glacier.  In 1997 the glacier is joined by three main tributaries from the south and four from the north.  The western most from the north and south are noted by the purple arrow.  The glacier terminates at the red arrow and the snowline is low on the glacier at 4600 m, likely after a summer snowstorm. The areas of bedrock amidst the glacier at Points 1-3 are limited.  In 1999 the snowline is above the main stem of the glacier at 4800 m.  There has been limited change since 1997, there is a small cloud causing a ground shadow right at the terminus.  By 2016 and 2017 the westernmost tributary from the north and south have detached from the glacier , purple arrows.  The areas of bedrock amidst the glacier at Point 1-3 have all expanded indicating upglacier thinning.  The terminus has retreated to the yellow arrow a distance of 900 m in 20 years.  In the digital globe image below extensive surface streams indicate significant meltwater drainage up to 4900 m, above the snowline in both images. The surface streams indicate a cold layer of ice preventing surface meltwater infiltration.  


Gangge’er Glacier, Qilian Mt., China comparison in 1999 and 2016 Landsat Images.  Yellow arrows indicates 2017 terminus, red arrows the 1990 terminus, and purple arrow tributary that has detached.   Points 1-3 indicate bare rock areas amidst the glacier.


Google Earth image of the glacier indicating flow directions dark blue arrows, surface streams light blue arrows and separated tributaries purple arrows.

Laigu Glacier, China Retreat Lake Expansion

laigu-compare

Landsat image comparison of the Laigu Glacier in 1988 and 2015.  The red arrow indicates the 1988 terminus and the yellow arrow the 2015 terminus location.  The purple dots in 2015 indicate the snowline.

Laigu (Lhagu) Glacier, China is in the Kangri Karpo Mountains of the Southeast Tibet Plateau and drains into the Salween River.  This is the largest glacier in its region at 32 km in length.  The glacier terminates in an expanding proglacial lake, Laigu Lake.  Here we examine changes in Landsat imagery from 1988 to 2015 to identify response to climate change. Wang and others (2011) note that glacial lakes have expanded from 1970-2009 by 19% and the area that is glacier covered has decline by 13% during the 1970-2009 period in the nearby Boshula Range. At the AGU this week research based on Landsat imagery indicates a 20% per decade velocity decline on the glacier (Landsat Science, 2016).

In 1988 Laigu Glacier terminated in the proglacial lake that was 2 km across from north to south and 1.3 km from east to west. By 2001 the lake had expanded to 1.6 km from east to west.  The transient snow line is at 4300 m.  In November, 2014 the snowline is at 4700 m. In October, 2015 the snowline is at 4700 m again.  The glacier has retreated 1900 m from its 1988 terminus along the southern shore of the expanding lake and 900 m along the northern shore.  The expansion of the lake along the southern shore is evident in the 2004 and 2014 Google Earth segmented image below, note the pink arrows.  The high snowline indicate a reduced accumulation, which reduces the flux into the ablation zone, this is evident in the reduced glacier velocity noted by Dehecq (2016).  The reduced velocity will lead to a continued retreat of the glacier and expansion of the lake. This region has experienced a sustained rise in summer temperatures (Wang and others, 2011).  The snowlines remaining high into November indicates warmer conditions in the post summer monsoon season also.  The high snowlines and lake expansion due to glacier retreat is a familar story in the region, Chutanjima Glacier and Menlung Glacier.

laigu-2001

Landsat image comparison of the Laigu Glacier in 2001.  The red arrow indicates the 1988 terminus and the yellow arrow the 2015 terminus location. The purple dots in 2001 indicate the snowline.

laigu-2014

Landsat image comparison of the Laigu Glacier in 2014.  The red arrow indicates the 1988 terminus and the yellow arrow the 2015 terminus location.  The purple dots in 2014 indicate the snowline.

laigu-ge

Google Earth image of the region indicating the lake expanding from the pink arrow at right to the pink arrow at left from 2004 to 2014.boshula-climate

Summer temperature rise form Wang and others (2011)

Mahsa Icefield Retreat and Separation, Baranof Island, Alaska

The Mahsa Icefield is at the headwaters of Takatz Creek.  This is a small glacier, not an actual icefield.  Five kilometers to the west is another small unnamed glacier at the headwaters of Sawmill Creek.  Here we focus on changes in the two glacier using Landsat images from 1986 to 2014.mahsa icefield ge

Google Earth image

In 1986 the Mahsa Icefield is a contiguous glacier that extended 5 km from east to west, red arrow indicates  the mid-section of the icefield.  A separate glacier in Sawmill Creek, yellow arrows, was 2.1 km long and has no lake at its terminus.  In 1997 the Mahsa Icefield has separated into an east and west half, at the red arrow, and has lost all of its snowcover.  The glacier in Sawmill Creek is still a single ice mass, but has lost all of its snowcover, which happened in 1998, 2003 and 2004. In 2014 the Mahsa Icefield’s east and west half are separated by 300 m, red arrow.  There is very little snowcover remaining despite there is a month left in the melt season.  At the headwaters of Sawmill Creek a lake has formed as the glacier has retreated, the lake is 600 m long in 2014.  The glacier has also separated into a small upper and lower section.  This glacier has lost half of its area since 1986.  The retreat of these glaciers on Baranof Island is similar to the retreat of nearby Carbon Lake Glacier,Lemon Creek Glacier, and Sinclair Glacier. Lemon Creek Glacier has lost more than 25 m of glacier thickness during the 1953-2014 period when its mass balance has been observed by the Juneau Icefield Research Program, and has retreated more than 1 km (Pelto et al, 2014).

mahsa icefield 1986

Landsat image 1986

mahsa icefield 1997

Landsat Image 1997

mahsa icefield 2014

Landsat image 2014