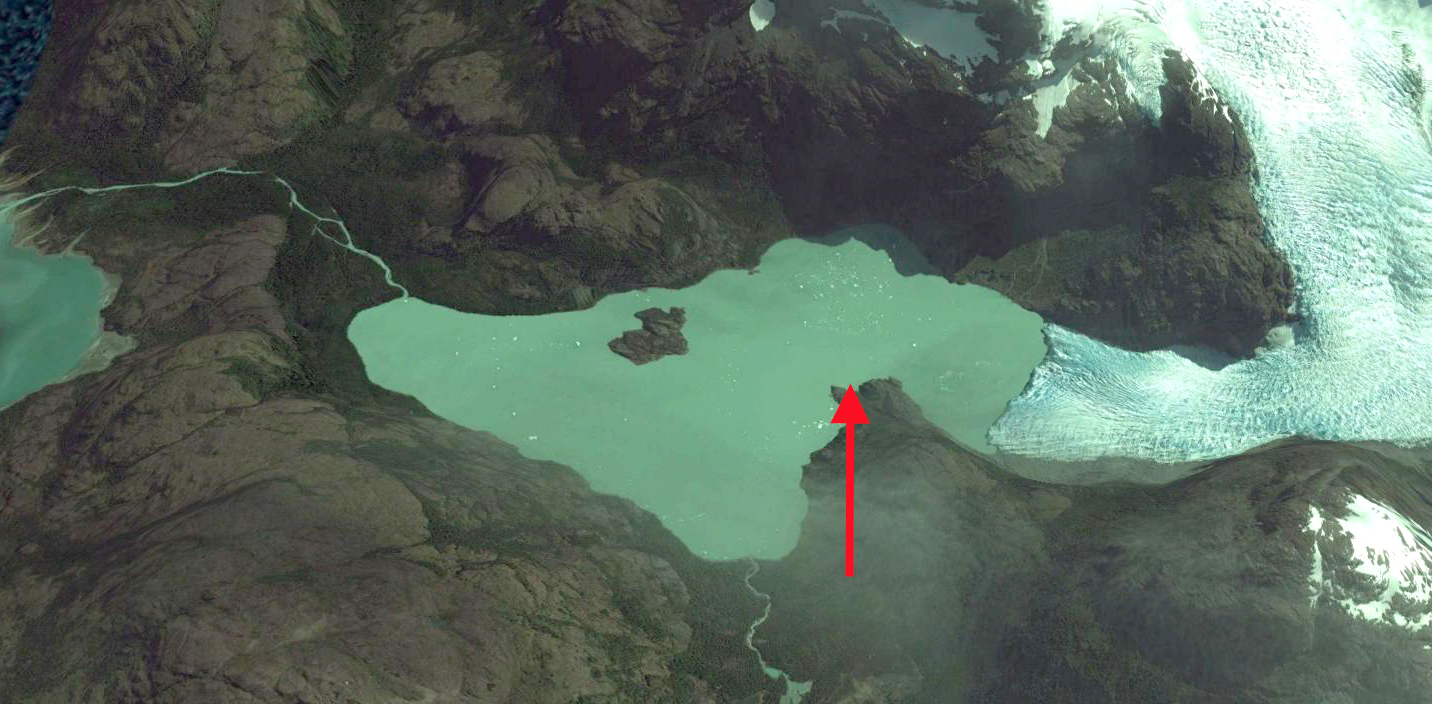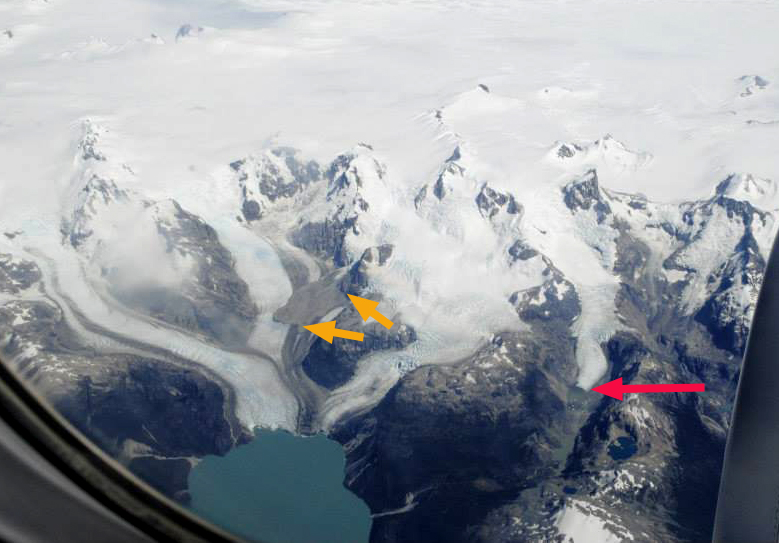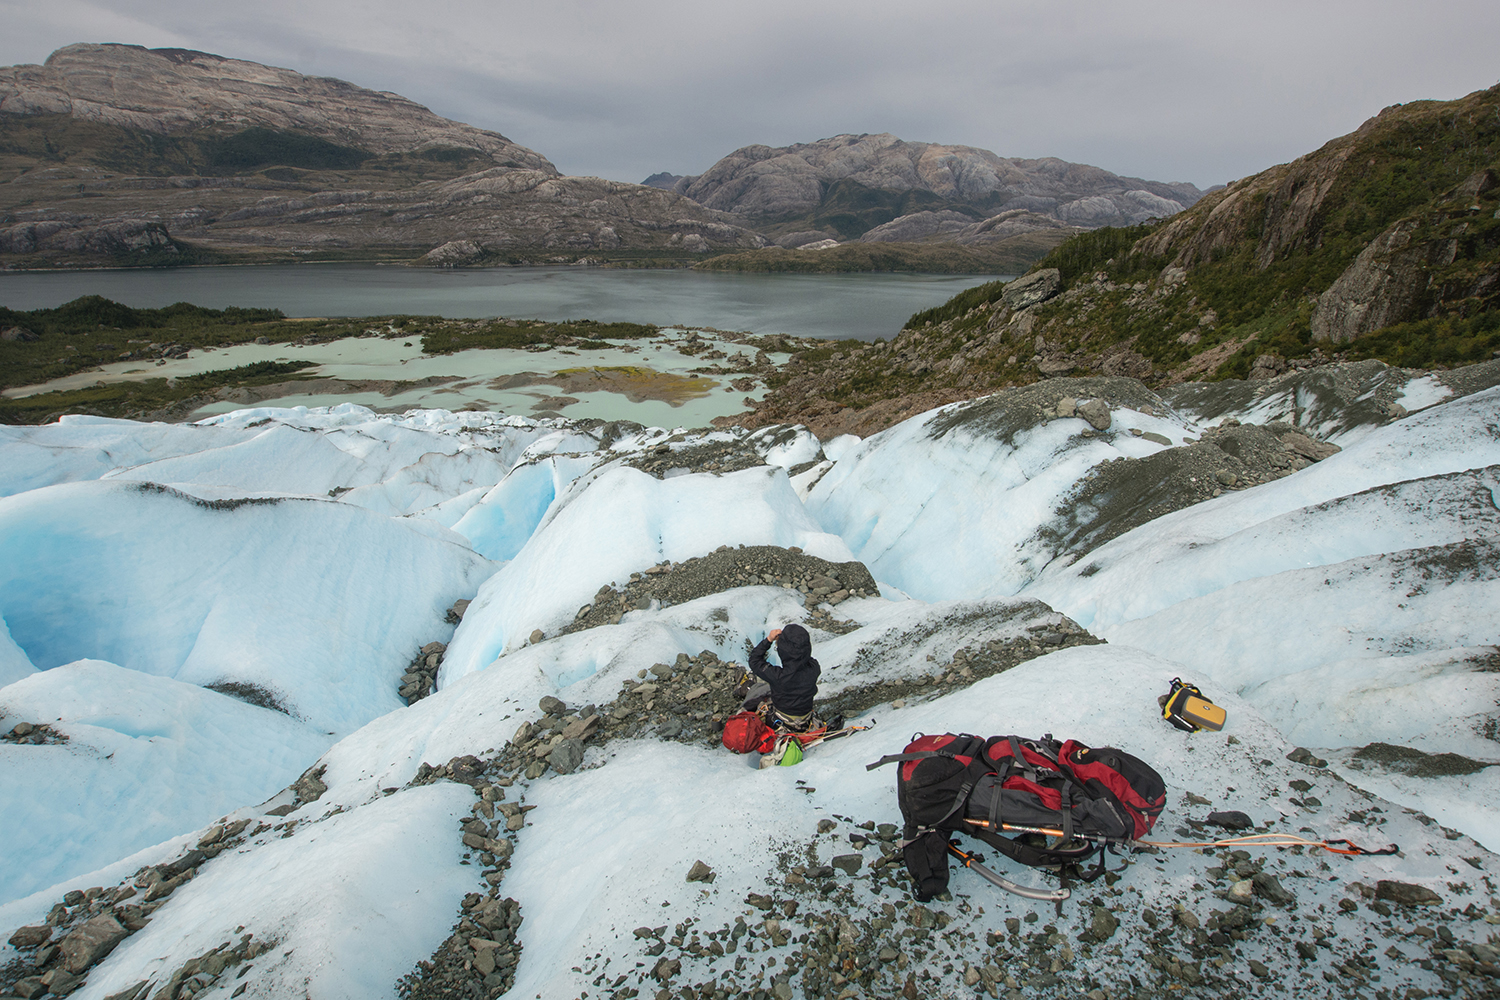
Bernal Glacier terminus looking towards Estero las Montañas from Eñaut Izagirre and Camilo Rada.
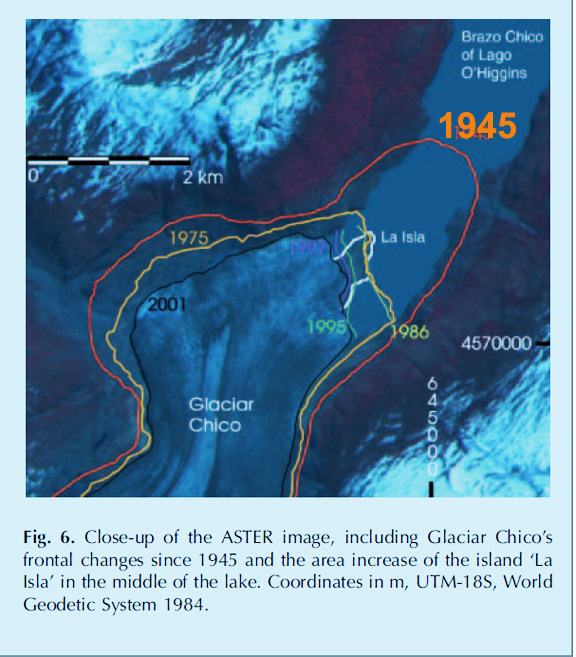
Bernal Glacier drains east from the Sarmiento de Gamboa Range in Southern Patagonia terminating a short distance from the Estero las Montañas. The glacier is in the Alacalufes National Reserve and can be seen from boats traveling up the fjord. Davies and Glasser, (2012) indicate extensive recession of almost all glaciers in the range from 1870-2011. The fastest recession rate of recession of Bernal Glacier is from 2001-2011. Melkonian et al (2013) observed that the Cordillera Darwin Icefield (to the south) had an average thinning rate of −1.5 m w.e/year from 2001-2011, while Willis et a (2012) quantify a rapid volume loss of the Southern Patagonia Icefield (SPI-to the north) from 2000-2012. Incognita Patagonia has been exploring and mapping glaciers in the region since 2015 including a visit to Bernal Glacier in March 2017 that inspired this post Izagirre (2017).
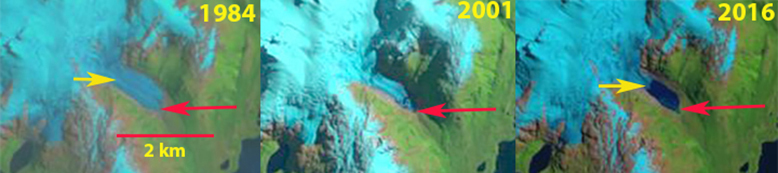
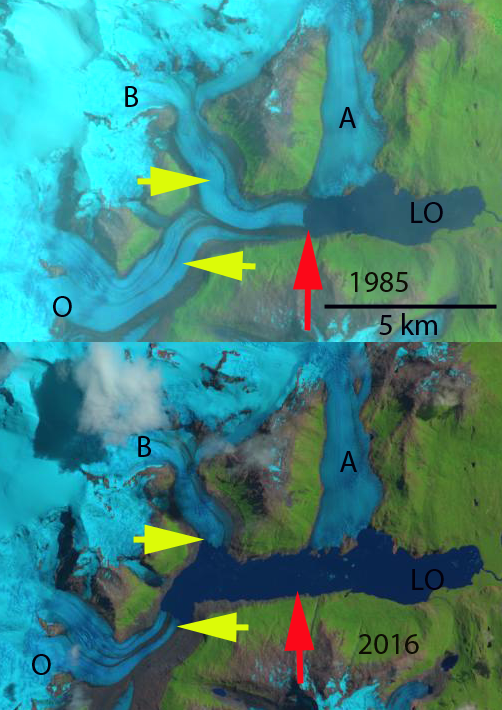
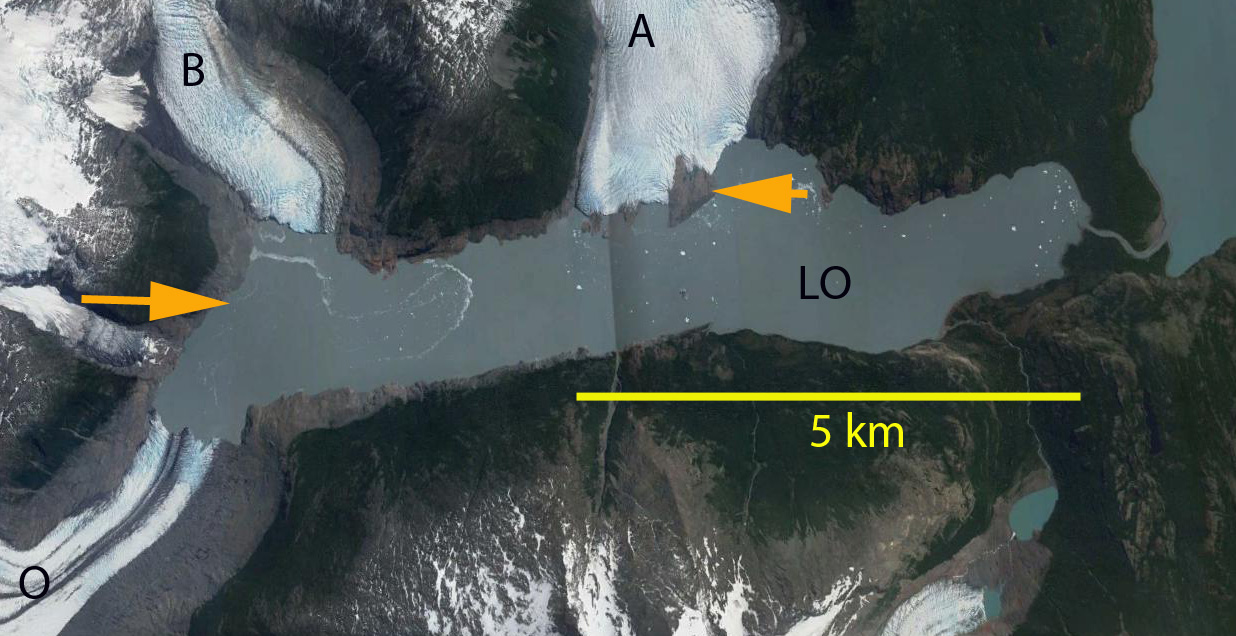
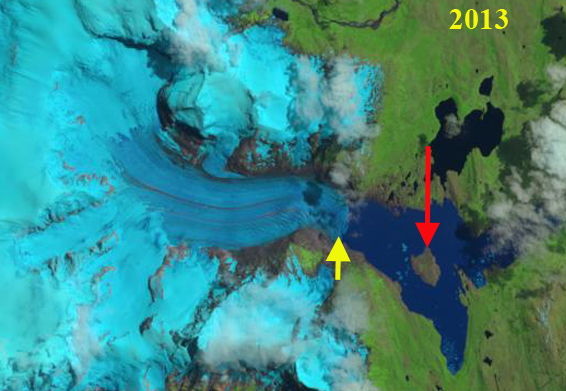
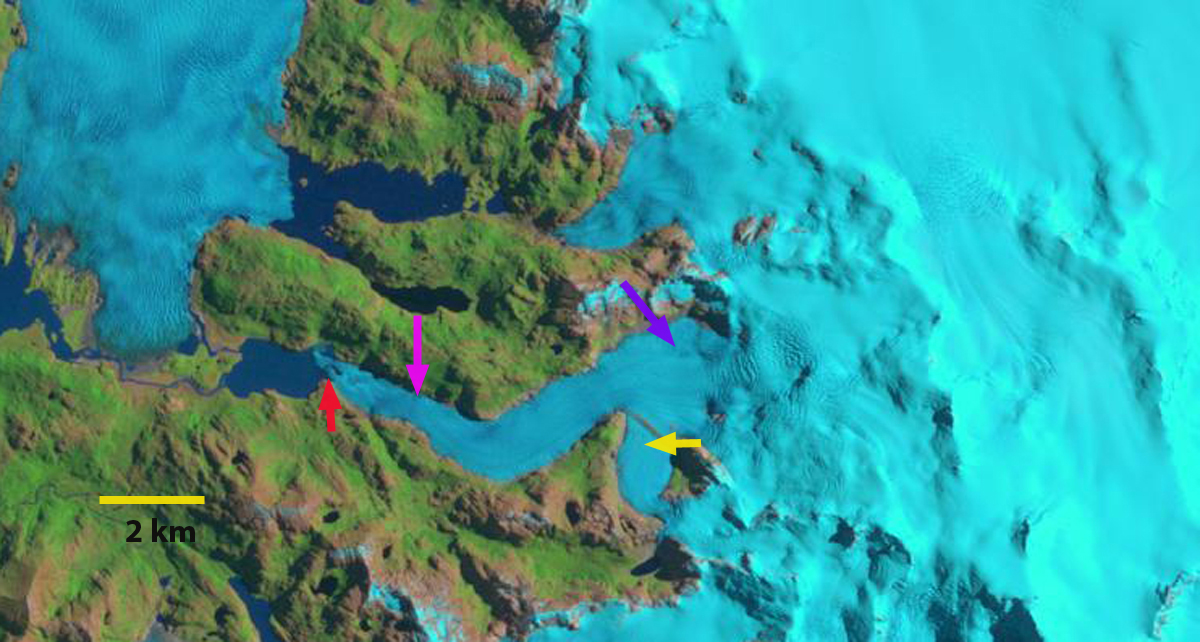
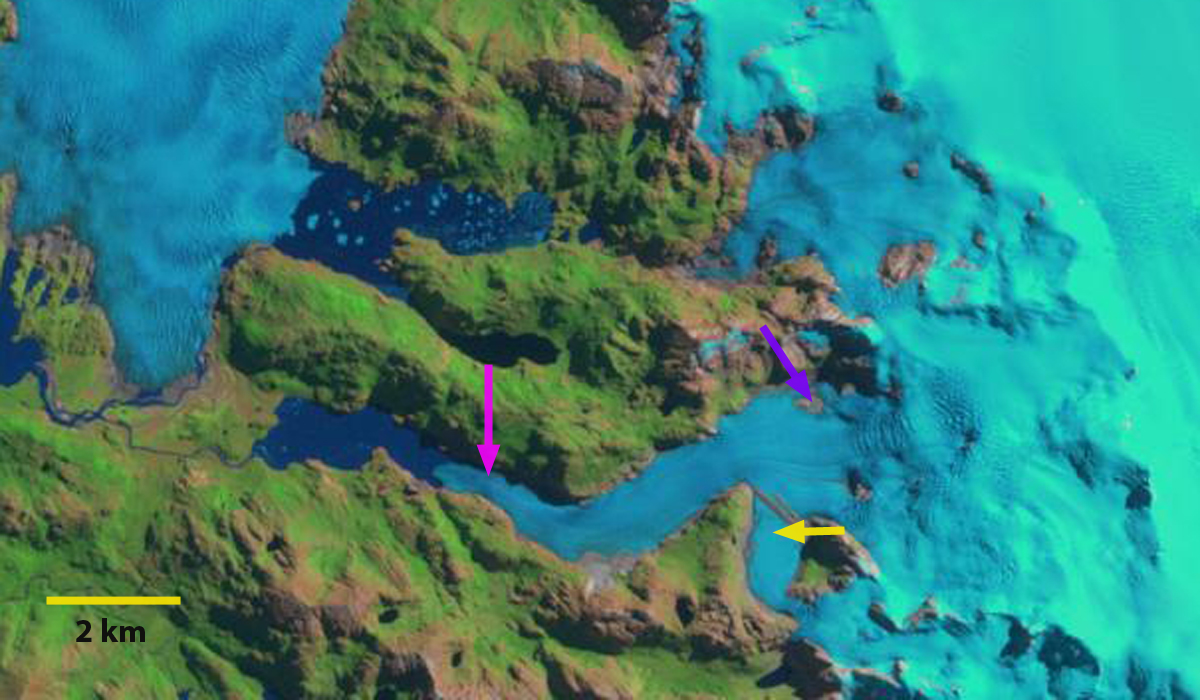
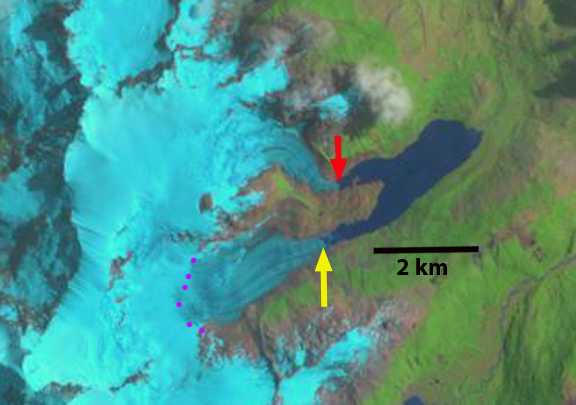
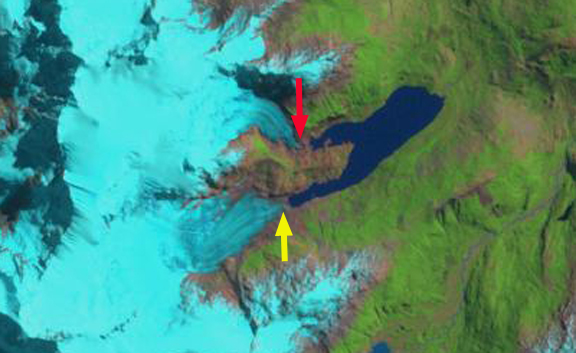
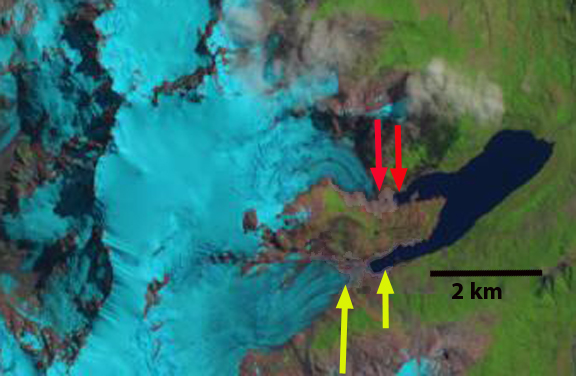
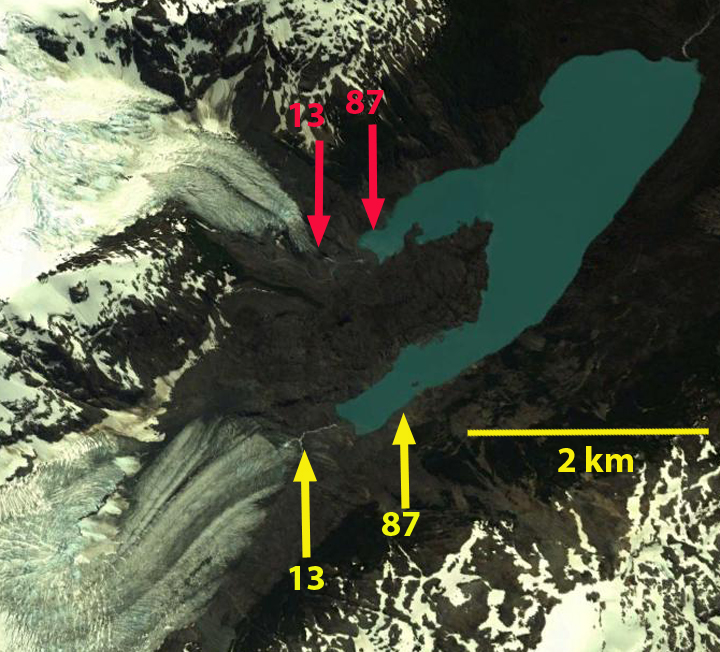
In 1986 there is no proglacial lake evident at the terminus of the glacier, red arrow. By 2013 the glacier has thinned and retreated enough to reveal a pair of proglacial lakes separated by a moraine where the glacier terminated in 1986, red arrow. By 2017 the proglacial lake has further expanded and glacier thinning has revealed larger areas of bedrock at the purple arrows. There is not significant calving in the shallow proglacial lake and the retreat is driven by surface melting. The revegetation of the proglacial outwash areas in 2017 is also apparent. The amount of retreat from 1986 to 2017 is best viewed in the Google Earth image below. The vegetation trimline from the 1980’s is evident. Total retreat from 1986 to 2017 is meters. It is The glacier drains the same ice field as the retreating Dama Blanca Glacier and Balmaceda Glacier.

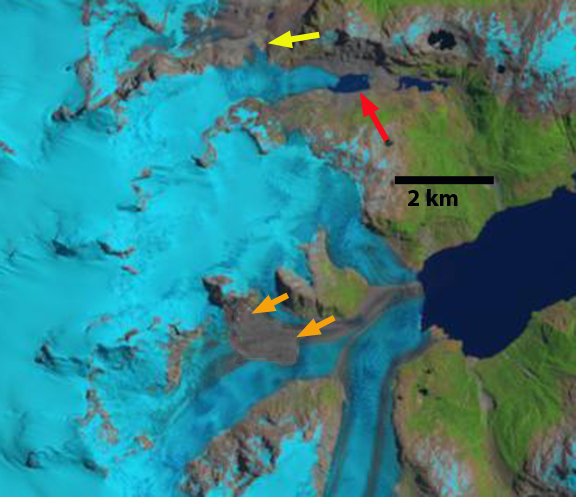
Landsat comparison of Bernal Glacier in 1986, 2013 and 2017 with the red arrow indicating the 1986 terminus. Purple arrows indicate two areas of bedrock that will be exposed.
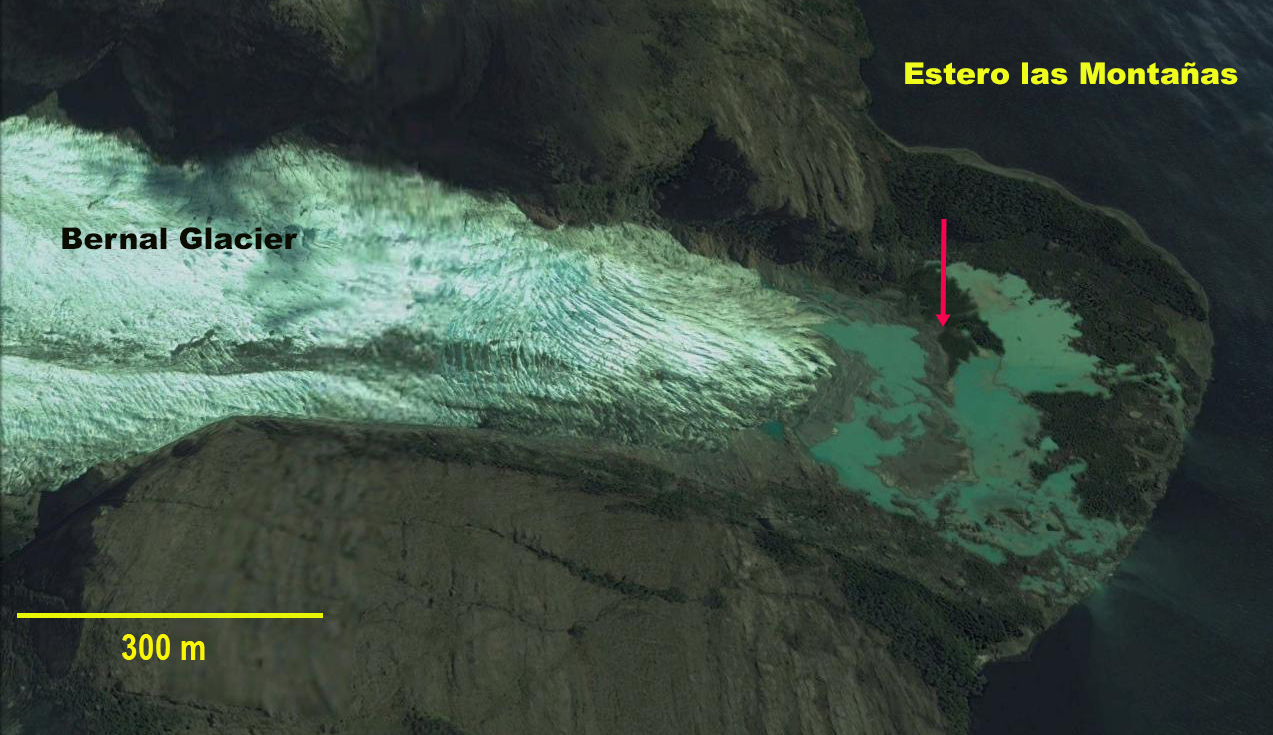
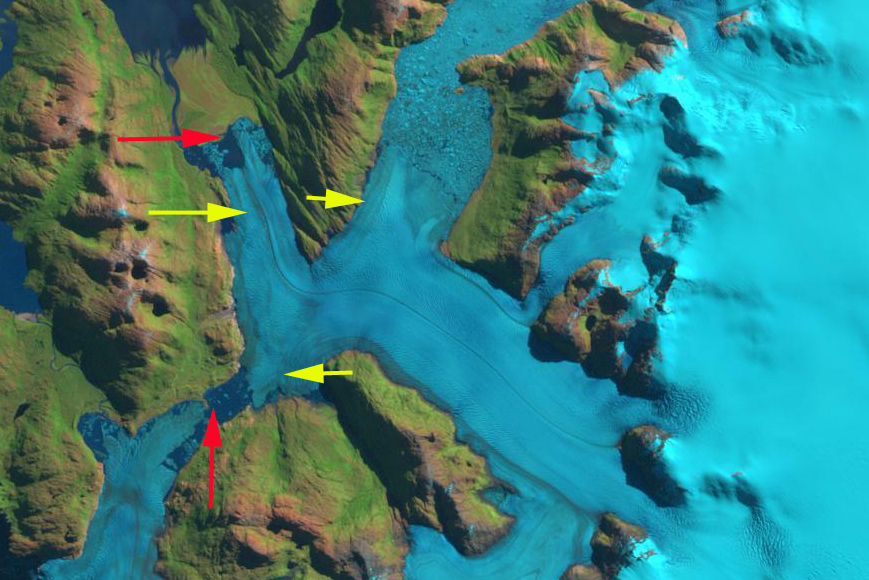
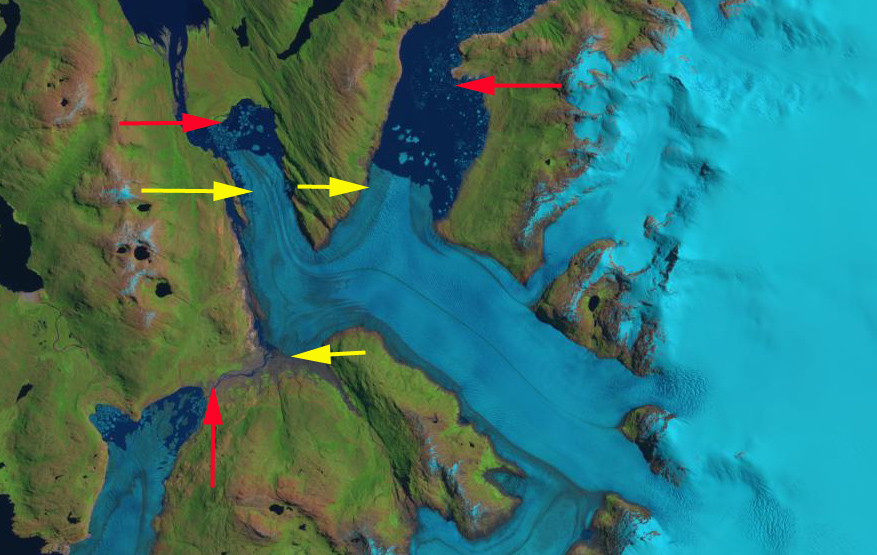
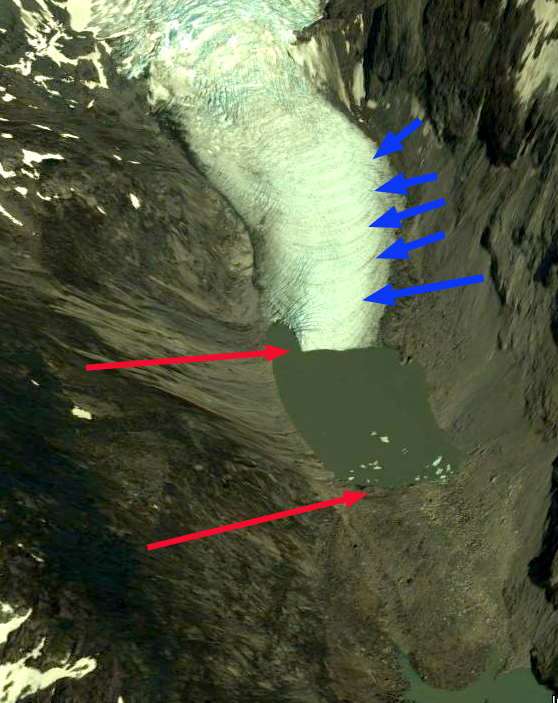
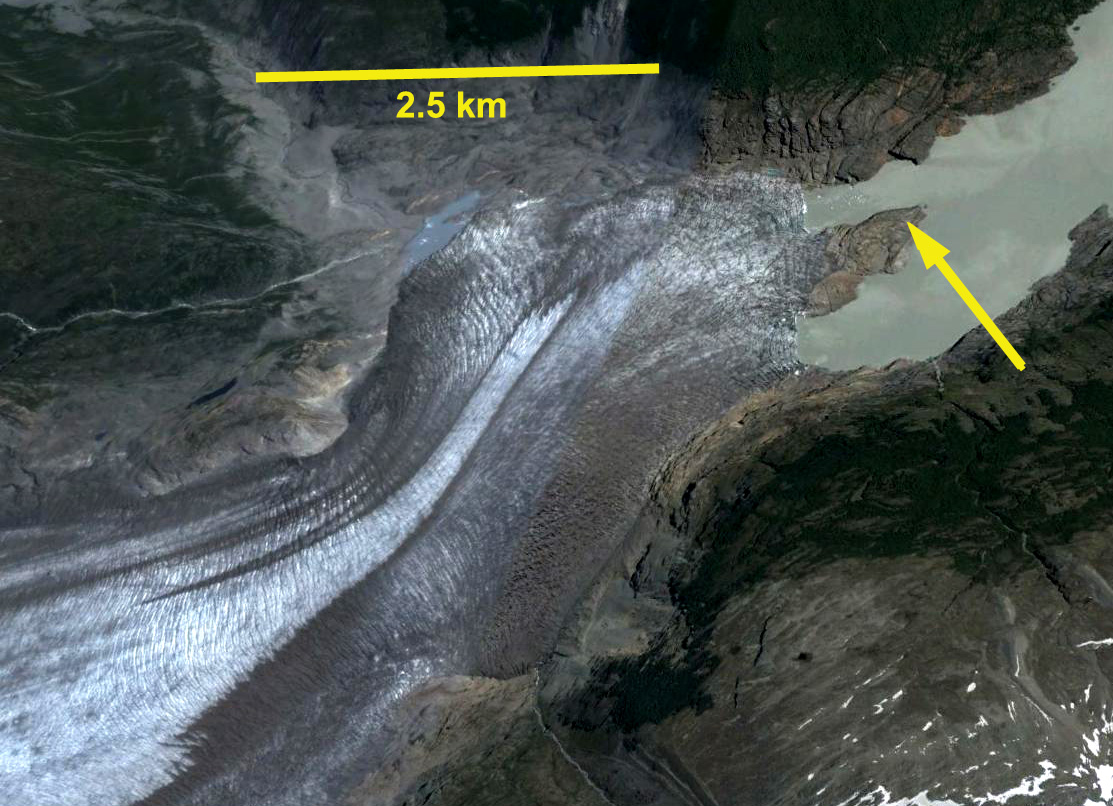
Bernal Glacier in Google Earth image from 2015. Red arrow is the 1986 terminus, note the vegetation trimline at that point.
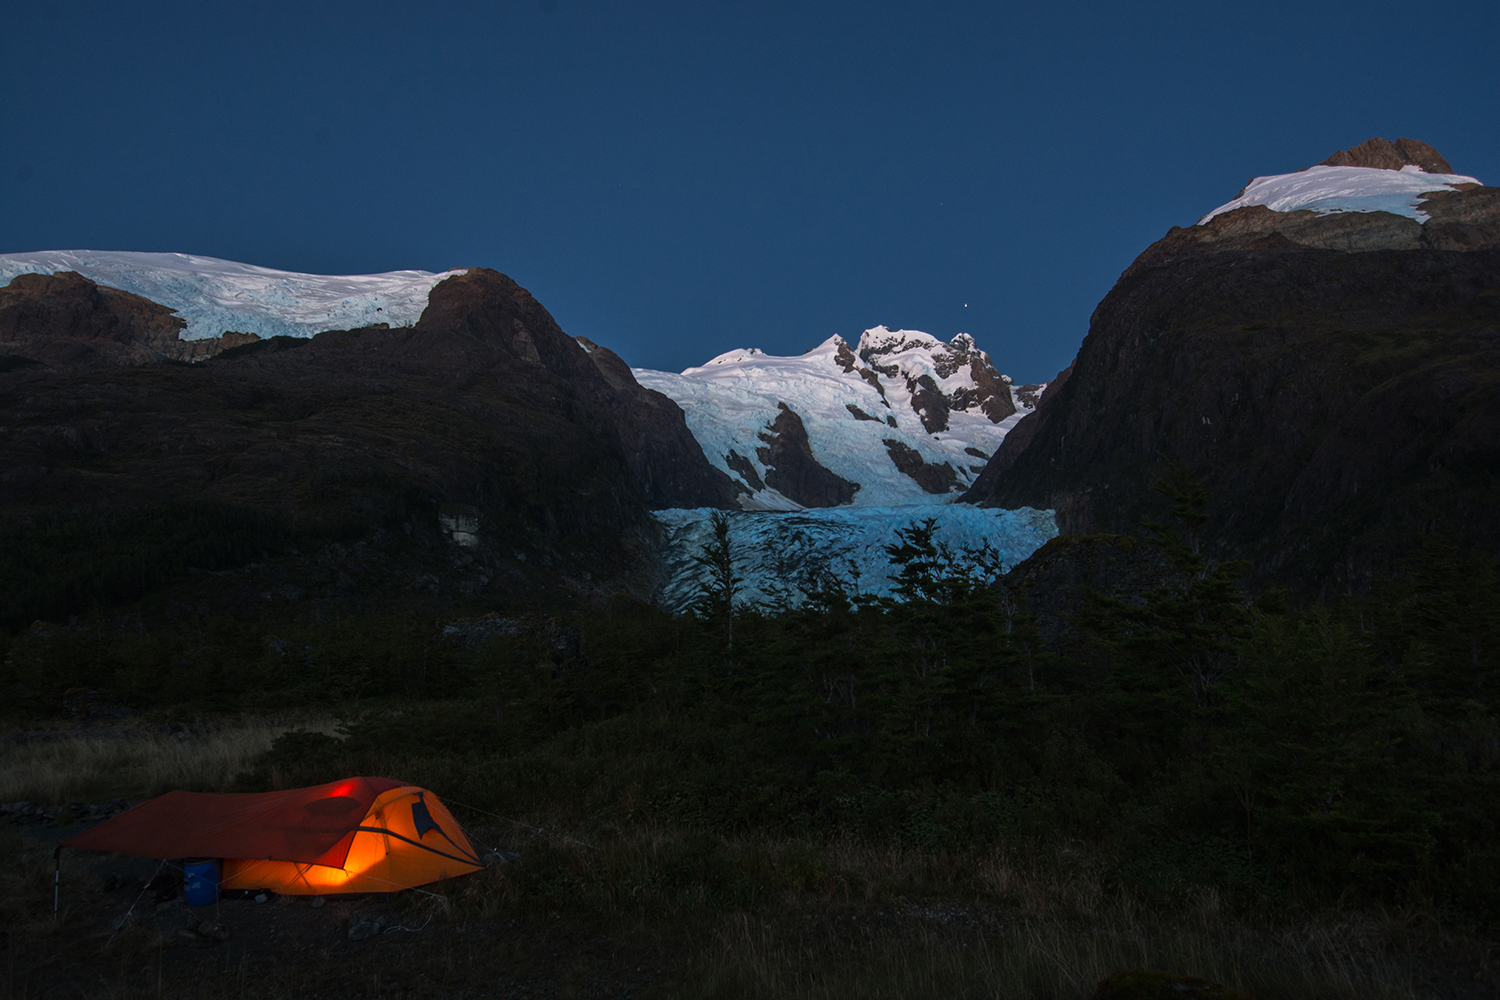
Looking at the Bernal Glacier from the base camp Eñaut Izagirre and Camilo Rada.