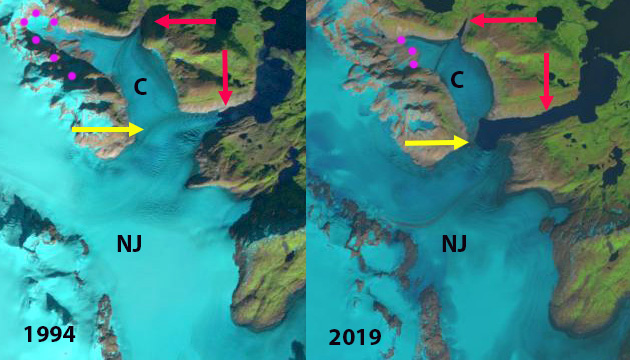
Upsala Glacier (U) in Landsat images from 1999, 2016 and 2021 illustrating both retreat and the separation from Bertacchi Glacier (B). Cono Glacier (C) is the next tributary to the north.
Upsala Glacier is a major outlet glacier of the Southern Patagonia Icefield. The glacier terminates in Lago Argentina and retreated substantially, 7.2 km from 1986-2014 (NASA, 2014). The retreat accelerated after 2008 (Sakakibara et al 2013). From 2014-2019 the rapid retreat had slowed, but given mass losses upglacier and consistent high snowlines ~1300 m in 2018-2021, not for long.
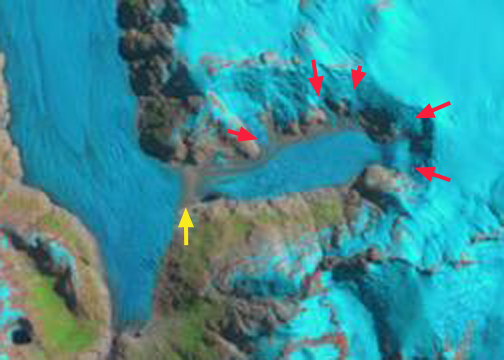
Landsat images from 1999-2021 illustrate the retreat of the glacier. In 1999 the terminus is 3 km south of the junction. By 2016 the terminus has retreated to the junction. The combined calving front has a width of 2.8 km, and there is a 1.3 km long connection zone between Bertacchi and Upsala. By April and May 2021 the separation is nearly complete with a 0.3 km long connection zone, and in increase to 3.3 km wide calving front, in a Sentinel 2 image from May 5, 2021. The glaciers that have been joined for many centuries if not millenia, provide stability to each other at the junction, as there is converging flow that buttresses both. As this buttressing is removed, the terminuses of both glaciers in the vicinity of the current terminus will be less stable.
De Angelis (2017) noted the equilibrium line for Upsala Glacier was 1170 m based on 2002 and 2004 observations, which equates to an AAR of 65%. On Feb 14, 2018 the TSL reached its highest observable elevation at 1275-1300 m. On March 14, 2019 the TSL reached 1300 m again. On April 8, 2020 the TSL reached 1325-1350 m upglacier of Point A and nearly to the Viedma Glacier divide. On April 17, 2020 the TSL had descended slightly to 1300 to 1325 m. The ELA of ~1350 m is the highest annual observation for Upsala Glacier and equates to an AAR of ~48%. On April 17, 2021 the snowline on Upsala Glacier is again at ~1300 m. The consistently high snowlines drive mass balance losses, which leads to thinning and reduced flux to the terminus. Malz et al (2018) indicated a 3.3 m thinning of Upsala glacier with significant thinning extending to the Viedma Glacier divide. Popken et al (2019) mapped the velocity at the confluence. The much slower Bertacchi has a low terminus velocity, in part due to the buttressing of Upsala.
The separation of Upsala Glacier due to rapid retreat parallels this pattern observed at other Southern Patagonia icefield outlet glaciers; Lago Onelli and Dickson Glacier

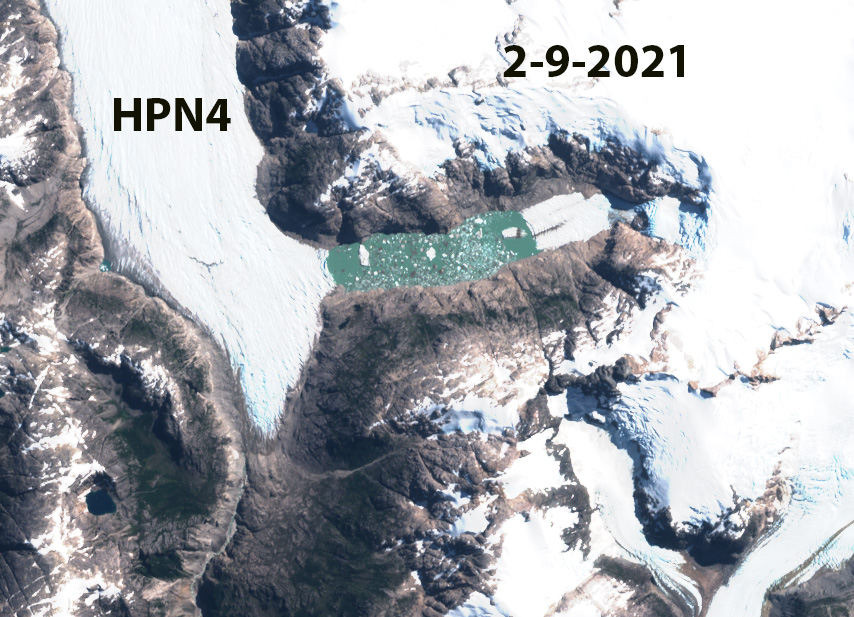
May 5, 2021 Sentinel image of terminus zone of Upsala and Bertacchi Glacier.

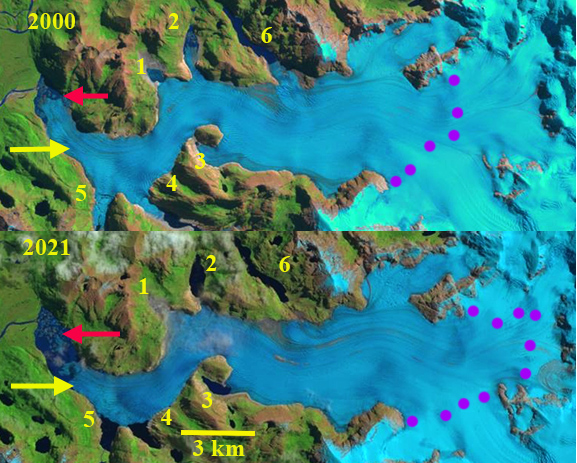
Snowline on Upsala Glacier in April 2020 and 2021 Landsat images-pink dots, both years above 1300 m.

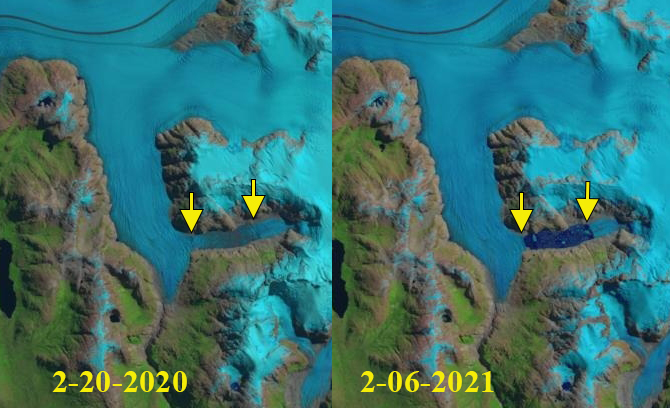
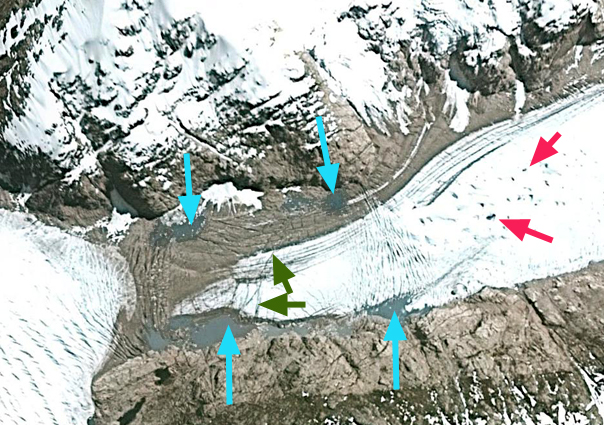
Terminus of Bertacchi and Upsala glacier in Apil 2020 and March 2021, note icebergs in March of 2021 from recent calving.