Bajo del Plomo Glacier, Argentina is 100% Bare Ice in February 2022

Bajo del Plomo Glacier in 2018 and 2022 Sentinel images illustrating the lack of any retained snowpack in 2022 and the expansion and emergence of bare rock areas amidst the glacier at Point A-D.

Bajo del Plomo Glacier at 7 km in length is one of two large glaciers at the headwaters of the Rio Plomo, Argentina, which is a tributary to Rio Tupungato and then Rio Mendoza. Glaciers in this region have lost ~30% of their area since 1955 (Malmros et al 2016). The majority of runoff to the Rio Plomo in summer is from snowmelt, with glaciers becoming more critical by late summer (Masiokas et al 2006)..  In February of 2022 with no snow evident in the upper basin on or off the glaciers, glaciers will dominate the runoff into the Rio Plomo  Earlier observations indicate this is a regional issue this summer with snowpack lost from Cortaderal Glacier, Palomo Glacier, Volcan Overo Glacier and Olivares Beta and Gamma Glaciers across the Central Andes of Chile and Argentina. Here we examine Sentinel and Landsat imagery to identify the lack of snowpack in summer 2021/22 on Bajo del Plomo Glacier and the expansion of bare rock areas.

Bajo del Plomo Glacier terminates at 4100 m and has two main accumulation zones that extend from 4600-5000 m near PointB and C respectively. In February 2018 there is limited bedrock expose near Point B and C, while Point A has two principal bedrock exposures with an area of   0.12 km2. In 2018 the snowline is at 4600 m.  The Dec. 21, 2021 Sentinel image indicates that the snowline is already at 4800 m. By January 18, 2022 Sentinel imagery indicates less than 10% of the upper glacier above 4900 m has retained snowcover.  By February 8, 2022  a Landsat 9 images indicates that all the snowpack on the glacier and surrounding area has been lost. The darker ice/firn surface of the glacier melts faster than a snow covered glacier surface leading to thinning and expansion of bedrock area including new exposures at Point B and D.  The area of exposed rock at Point A has doubled to 0.24 km2, and bedrock exposed at Point C is notably expanded too. The emergence of bedrock amidst the accumulation zone of a glacier is indicative of a glacier that cannot survive current climate as it is not consistently retaining snowpack (Pelto, 2010).

With a month left in the melt season Bajo del Plomo will continue to lose area and volume.

Bajo del Plomo Glacier in 2021 and 2022 Sentinel images illustrating the loss of snowpack from Dec. 21, 2021 to January 18, 2022 and the expansion and emergence of bare rock areas amidst the glacier at Point A-D.

Landsat 9 Image from Feb. 8, 2022 illustrating lack of retained snowpack.


Palomo Glacier, Chile Snow Cover Loss in 2022 and Accelerating Retreat

Palomo Glacier, Chile in Landsat 5, 8 and 9 images illustrating retreat from 1987 position, red arrow, and expansion of bare rock areas amidst the glacier at Point A,B and C. Note lack of retained snowcover in 2022.

Palomo Glacier is a large valley glacier in Central Andes of Chile. Adjacent to the Cortaderal Glacier and Universidad Glacier, it flows east from Volcan Paloma (4860 m)  and drains into the Rio Cortaderal. Rio Cortaderal is in the Cachapoal River watershed that supplies two Pacific Hydro projects; a 110 MW run of river project at Chacayes and the 78 MW Coya run of river project a short distance downstream. The glacier is an important water resource from December-March. Bravo et al (2017) quantified this resource for nearby Universidad Glacier that supplied 10-13% of all runoff to the Tinguirica Basin during the melt season. La Quesne et al (2009) reported that Palomo Glacier retreated 1160 m from 1955-1978 and advaned ~50 m from 450 m 1987-2007. They reported that Palomo Glacier had an equilibrium balance durng the 1987-2000 period, which drove the lack of retreat. Here we examine the changes of this glacier from 1987-2022 using Landsat 5, 7, 8 and 9 images, and the unusually high snow lines during the winter of  2022 due largely to a January heat wave (Washington Post, 2022). This is the first post using Landsat 9, that extends this invaluable data record.


In 1987 Palomo Glacier terminus had been in slight advance over the previous decade. The area of bare rock at Point A was 0.25 km2. At Point B and C limited exposed rock was evident on two rock ribs.  The snowline is below Point A at 3300 m. By 2002 there is minor retreat and the area of exposed rock at Point A has expanded, with the snowline at 3600 m. By 2015 the terminus has retreated 700 m to the north end of steep slope on the east margin of the glacier. The exposed bedrock area at Point A is now 1 km2. the snowline is at 3800 m.  By mid-January 2022 the glacier has only ~10% snowcover remaining, mostly above 4000 m. Retreat since 1987 is now ~1200 m. The bedrock area at Point A is 1.5 km2. Point B is expanding ridge of bedrock and the rib or rock at Point C now separates the glacier from flow on the south facing slope east of Point C.

By February 8, 2022 with six weeks left in the melt season there is no evident retained snowpack. This will accelerate both retreat, thinning and area loss of this glacier.  This story is playing out at glaciers across the region such at Olivares Glacier, Chile,  Cortaderal Glacier, Chile and Volcan Overo, Argentina

Palomo Glacier, Chile in Landsat 7 and 9 images illustrating retreat from 1987 position, red arrow, and expansion of bare rock areas amidst the glacier at Point A,B and C.

Firn Area Ratio an Emerging Metric for Glacier Mass Balance?

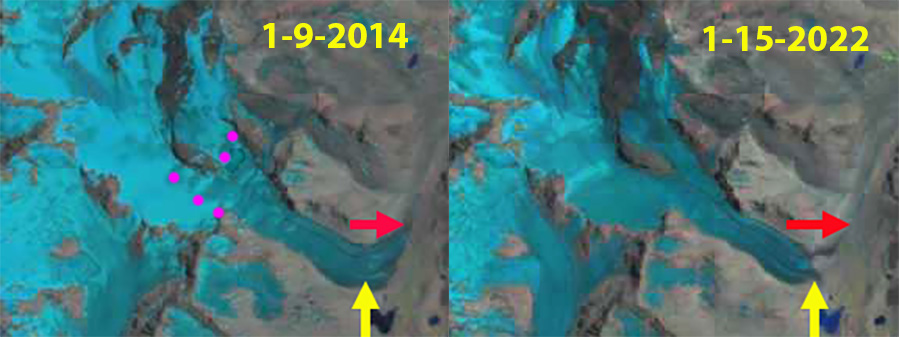
Columbia Glacier in 2015 viewed from the ridge above the glacier. The firn line is marked by blue dots. The age of the snow surface of 2015 and the firn surfaces of 2011-2014 are noted.

For an alpine glacier to be in equilibrium at the end of summer the glacier needs to be 50-70% covered in snow from the previous winter. This is the accumulation area ratio (AAR). AAR is a good measure of mass balance, which is why AAR is reported for WGMS reference glaciers. In recent years we have seen periodic strongly negative balance years that have removed all or nearly all of the snowpack from a glacier leaving an AAR of less than 10%, and considerable exposed firn. This typically occurs in assocation with  a year that feature prolonged dry warm conditions in winter that limit snow accumulation or even reduce it, and/or summers with heat waves and extended warm periods that melt away the snowpack rapidly, particularly early in the melt season.  This leads to exposure of firn, which is the snowpack retained from previous winters, hence more than a year old, but not yet glacier ice and significantly dirtier/darker than snow from the most recent winter. This firn melts more rapidly than snow, largely because it is darker.  This leads to additional mass loss for the glacier. By the end of summer in strongly negative years we can see where the firn area boundary with glacier ice.  This marks the region below which no accumlation has been retained in recent years, hence older ice is exposed.  As such it delineates the multi-year accumulation area, the effective accumulation zone of the glacier.  This would not be accuately determined from an simple average of annual AAR values. It is also readily visible in aerial or satellite imagery.

This scenario played out both in the Pacific Northwest in summer 2021 and in the Central Andes summer 2022. Pelto et al (2022) examine the impact of the heat waves on glacier runoff specifically. In New Zealand the 2022 NIWA annual snowline survey also indicate exposed firn below the annual snowline.

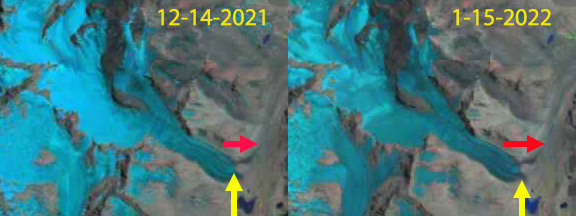
The blue dotted line on Columbia Glacier marks the accumulaiton zone for the 2011-2015 period, below that line no snow or firn was retained during that five year period. The is was a year of exceptional mass balance loss in the North Cascade Range (Pelto, 2018). Below is an example from Sholes Glacier in 2014 indicating the snow line in August and again in September now with a separte firn line apparent. Note the difference between the snowline for 2014 and the firn line for the 2011-2013 period. Below that point no firn has been retained.

Sholes Glacier snowline and firn line in August and September of 2014.

High negative balance years exposing significant firn areas at he surface have played out with increasing frequency in glaciated mountain regions from the North Cascade Range north through British Columbia to Alaska and across continents to the Alps, Canadian Arctic, Himalaya, and Andes.  Glaciers where much of their snow cover is lost by mid-summer, then have the darker firn and ice exposed for enhanced ablation for the rest of the summer.  There is no sunscreen they can apply for protection.

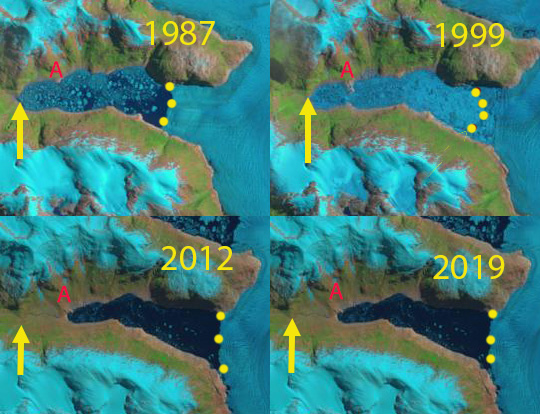
For Blackfoot and Jackson Glacier in Glacier National Park, Montana just one small area of snow remained on Blackfoot Glacier in early September of 2021.  The area of firn on both glaciers is extensive nearly 50% of the glacier indicating overall an accumulation area of significant size. For Adams Glacier in late summer 2021 there is ~10% snowcover (A), while firn cover is 40% at the end of August.

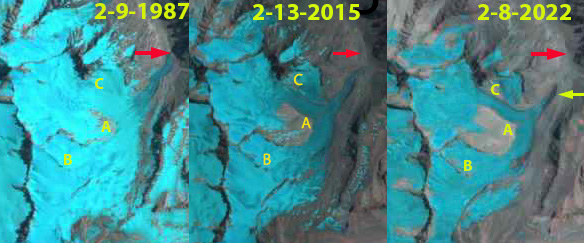
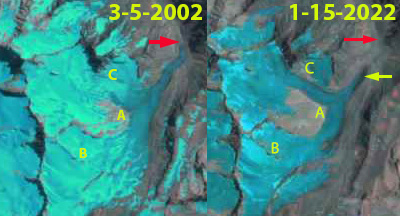
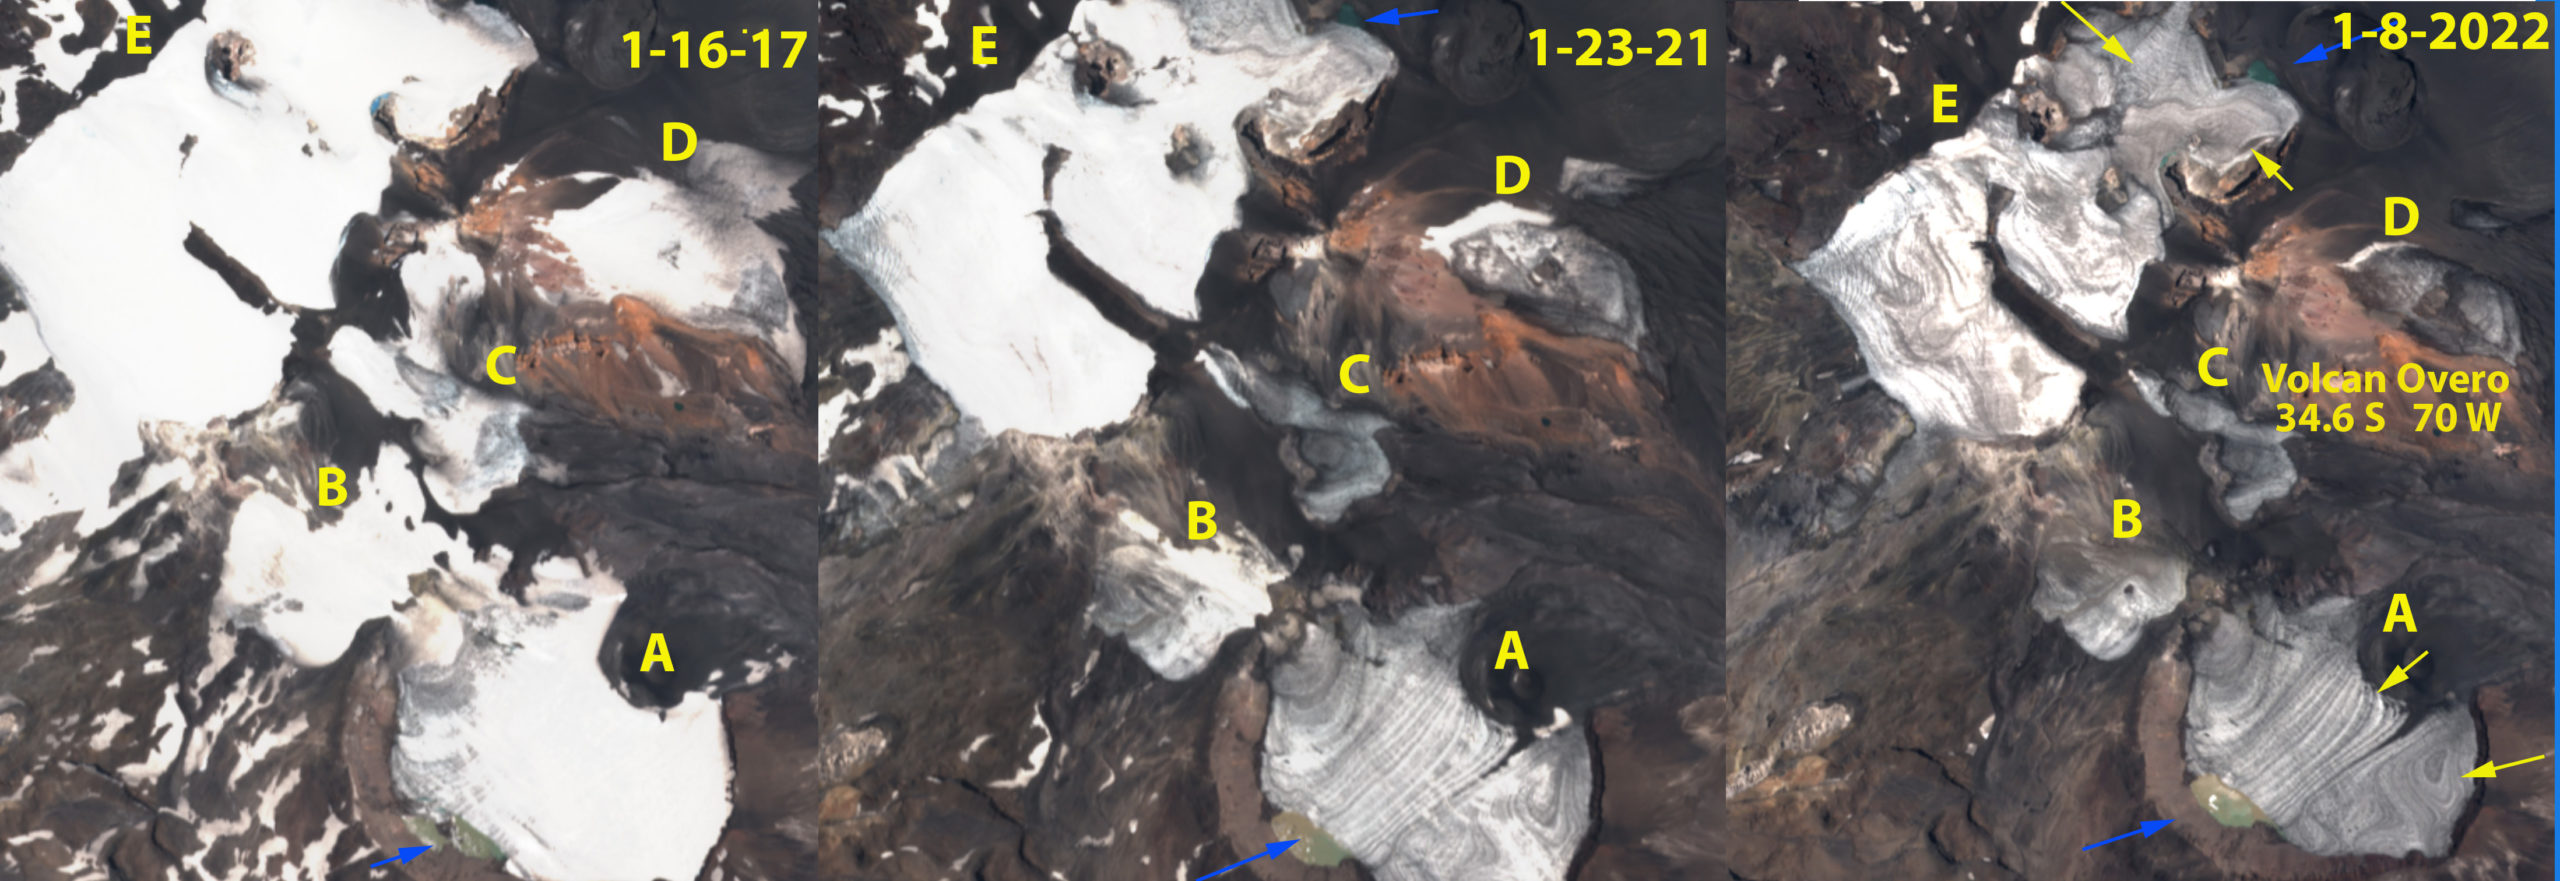
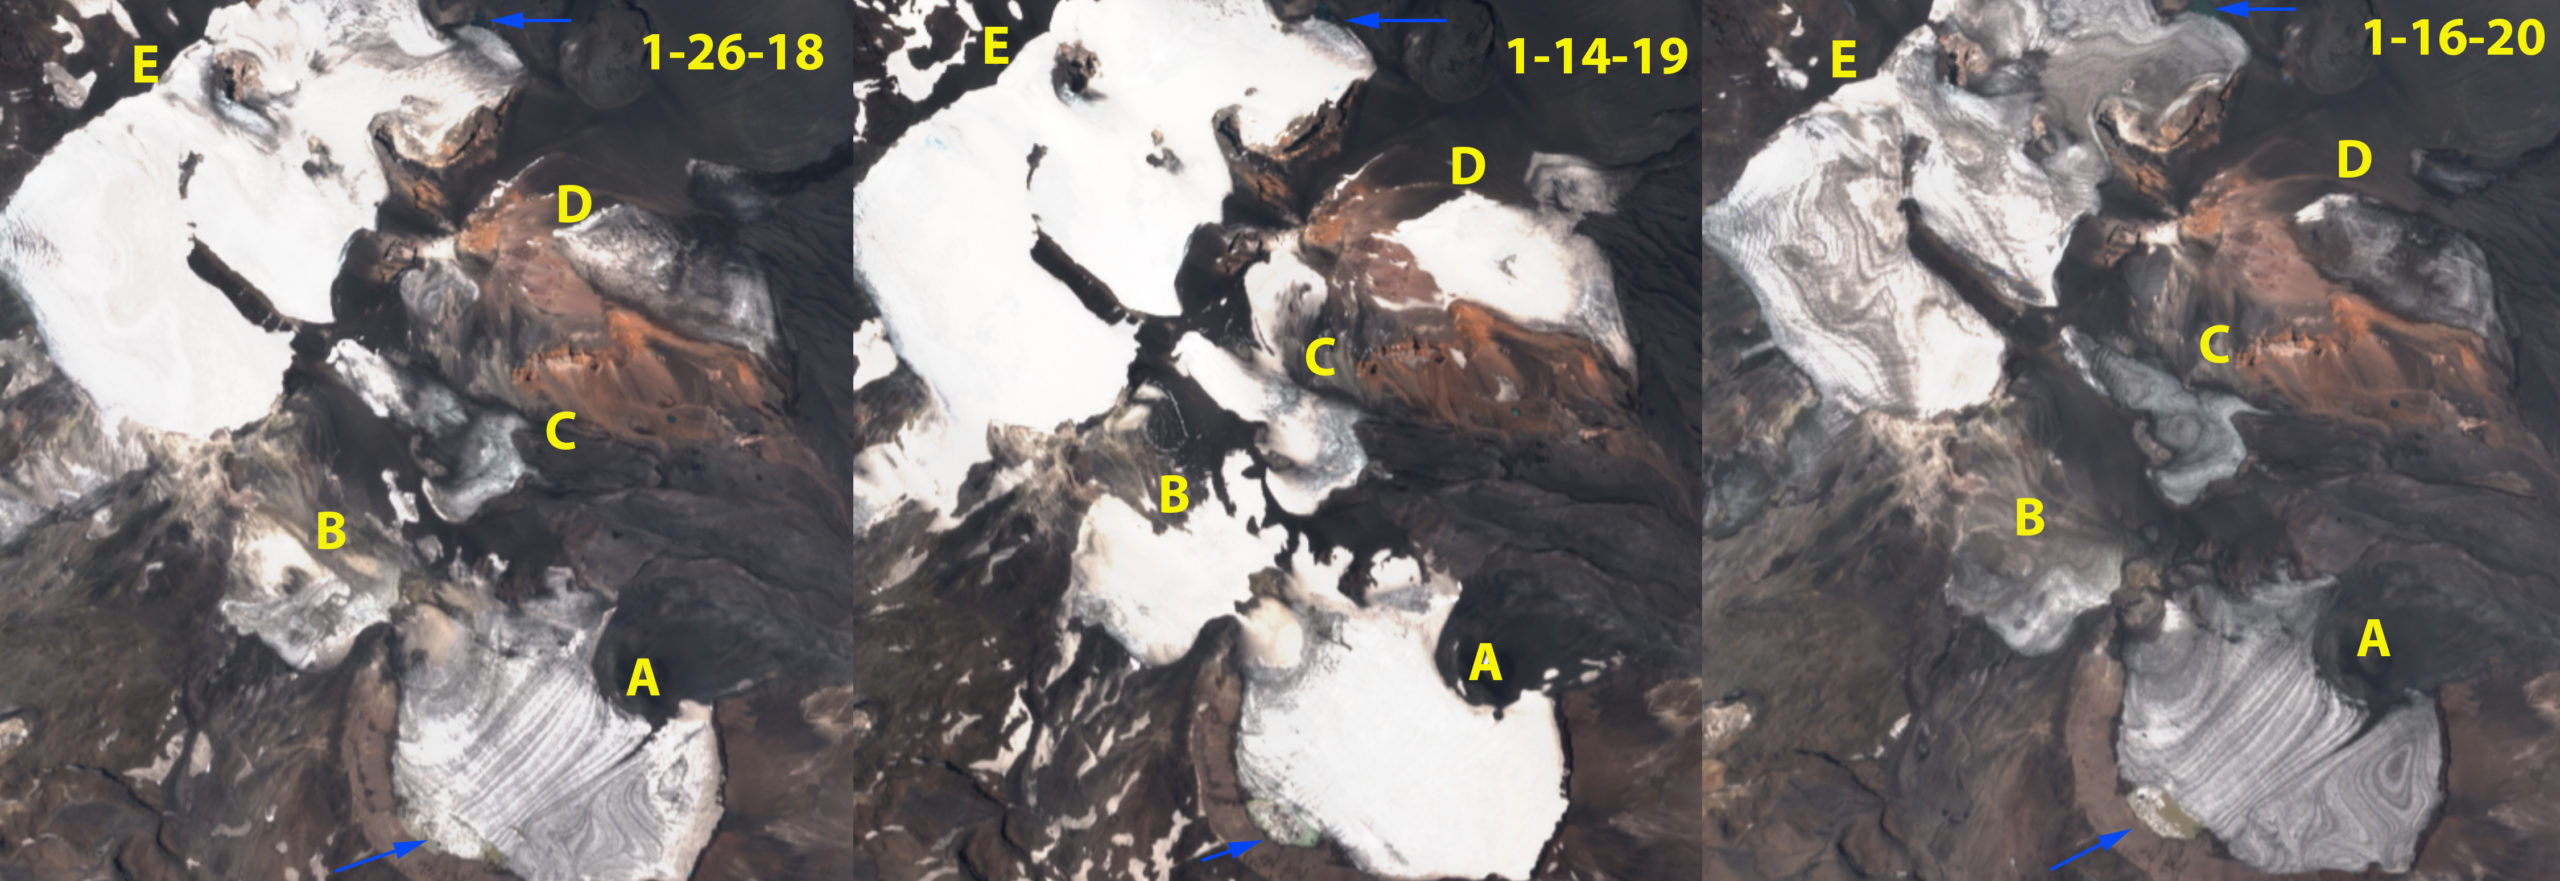
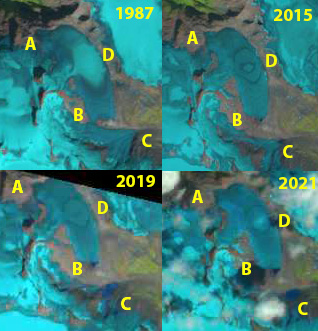
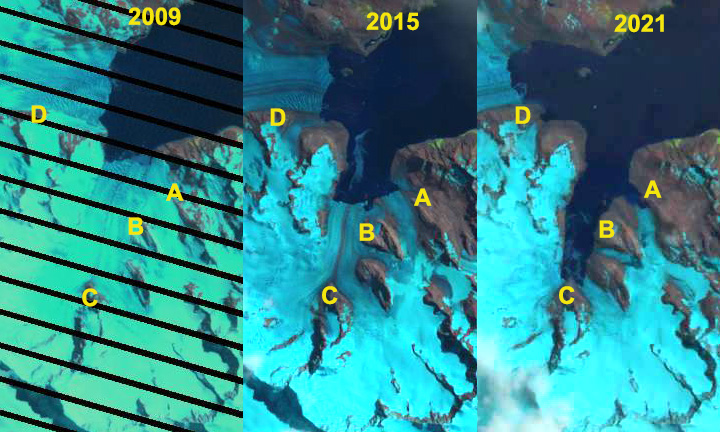
In January 2022 the Central Andes of Argentina and Chile have experienced nearly complete snowcover loss on many glaciers. Volcan Overo, Argentina has four ice masses A-D with limited firn or remaining snowpack. Ice mass E has limited snowcover, but reasonable firn cover extent, not blue dots between firn and bare ice. On Olivares Beta and Gamma Glacier, Chile almost no snowcover remains from Winter 2021, the firn line is limited to the upper portion of both glaciers. This indicates less than 30% of the glacier is an accumulation zone during recent years. There is still six weeks left in the melt season to further reduce this area. The bare surfaces lasted from mid-January into late March leading to extensive mass loss.

For each of the glaciers illustrated here the firn area can be delineated accurately due to the glacier having a significant mass balance loss.  The age of the firn cannot be determined without specific knowledge of the glacier or area, but for temperate alpine glaciers firn typically is converted to ice is 5-7 year

The snow cover (S) reamining on Jackston and Blackfoot Glacier in a Sentinel image by early September of 2021 is minimal. The firn area (F) in gray is more extensive.

Adams Glacier with areas of acccumulation (A) and firn (F) in a Sentinel image from Aug. 30, 2021. Green dots indicate the glacier boundary.

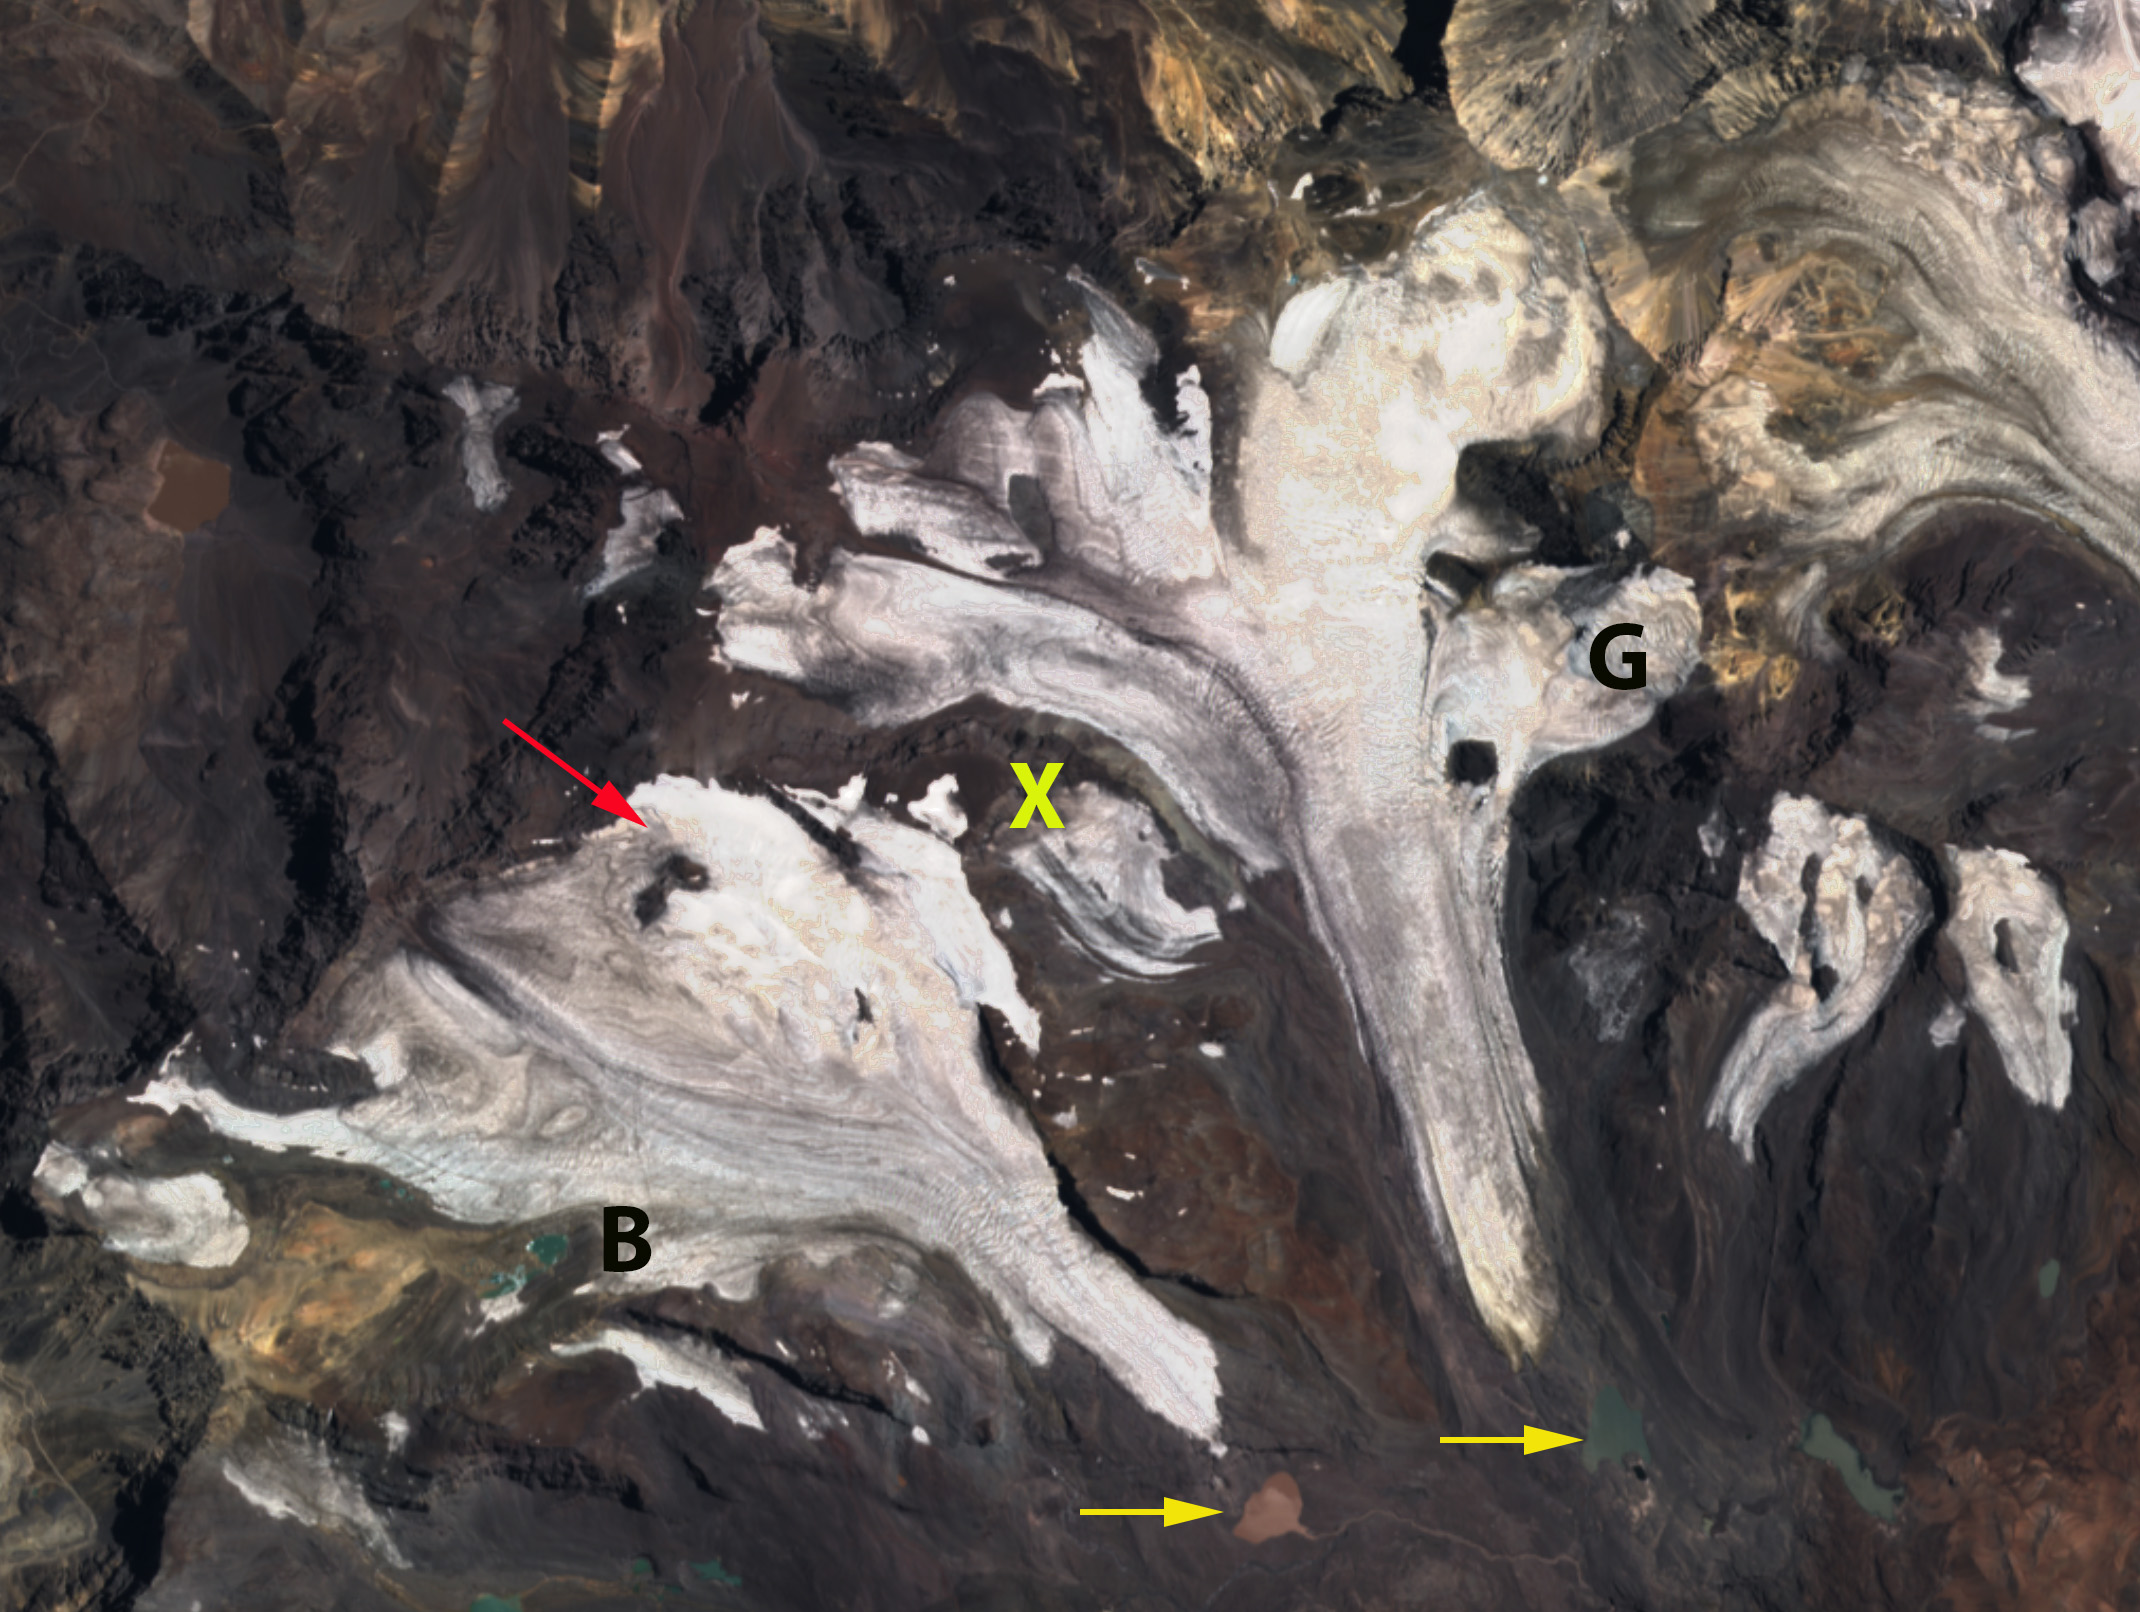
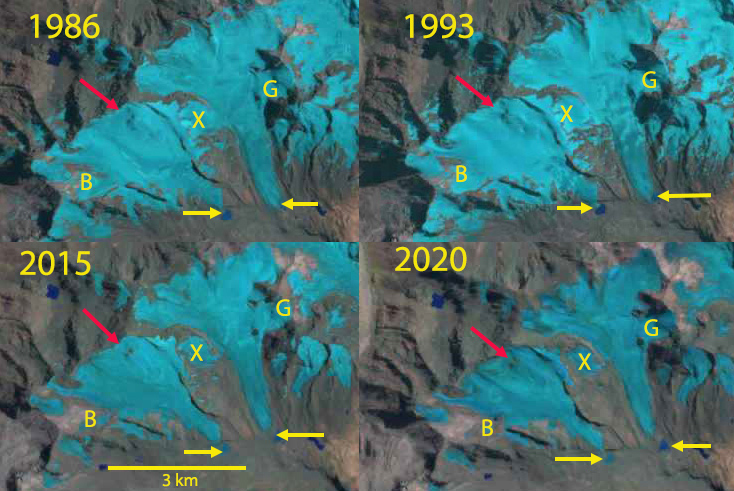
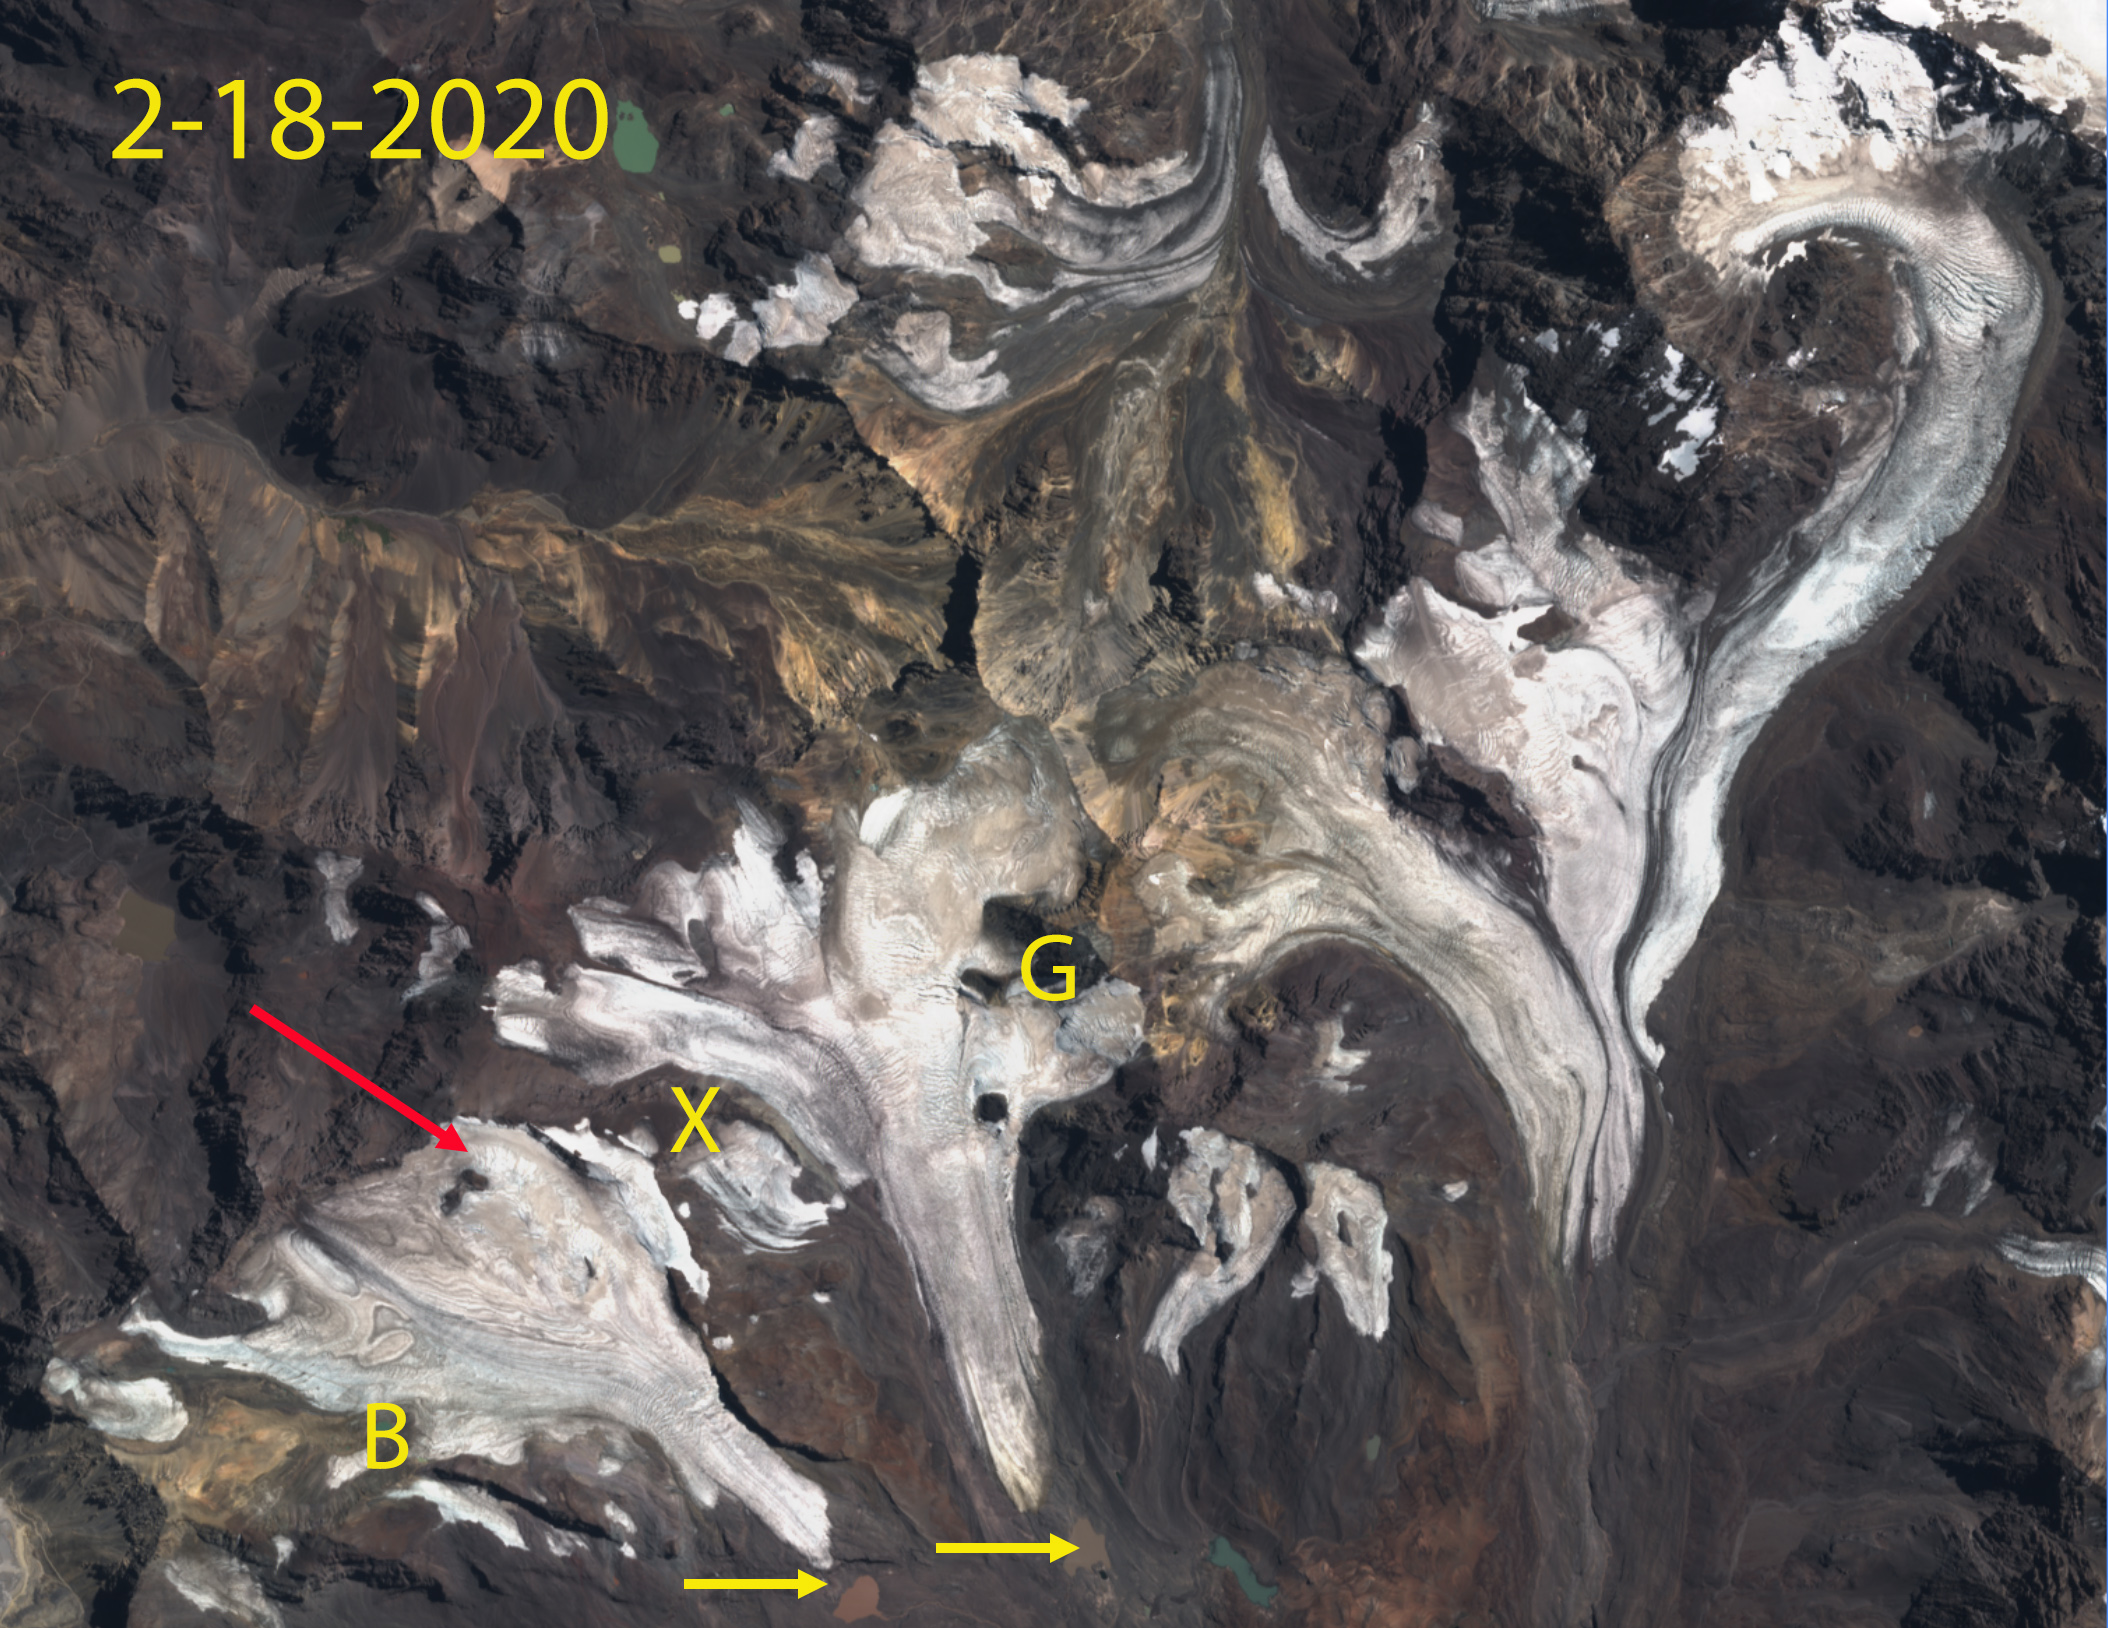
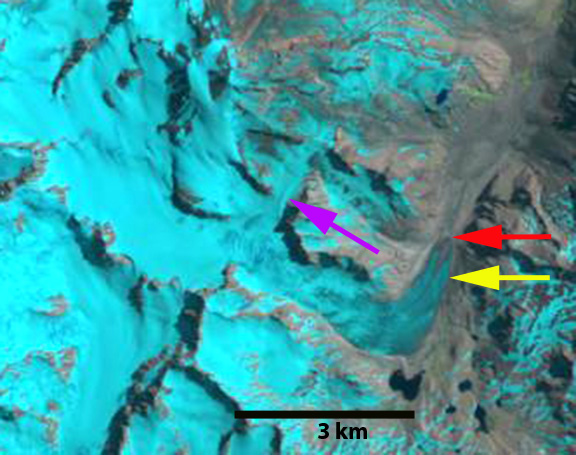
Olivares Beta and Gamma Glacier in Sentinel image, with ~10% snowcover remaining and 30% firn cover (blue dots) on January 20, 2022.


Olivares Beta and Gamma Glacier in Sentinel image indicating days of exposure at surface of firn and ice , March 26, 2022.


Volcan Overo, Argentina in January 13, 2022 Sentinel image, with  negligible snowcover remaining in mid-summer and firn cover remaining on 30% of the Glacier E.

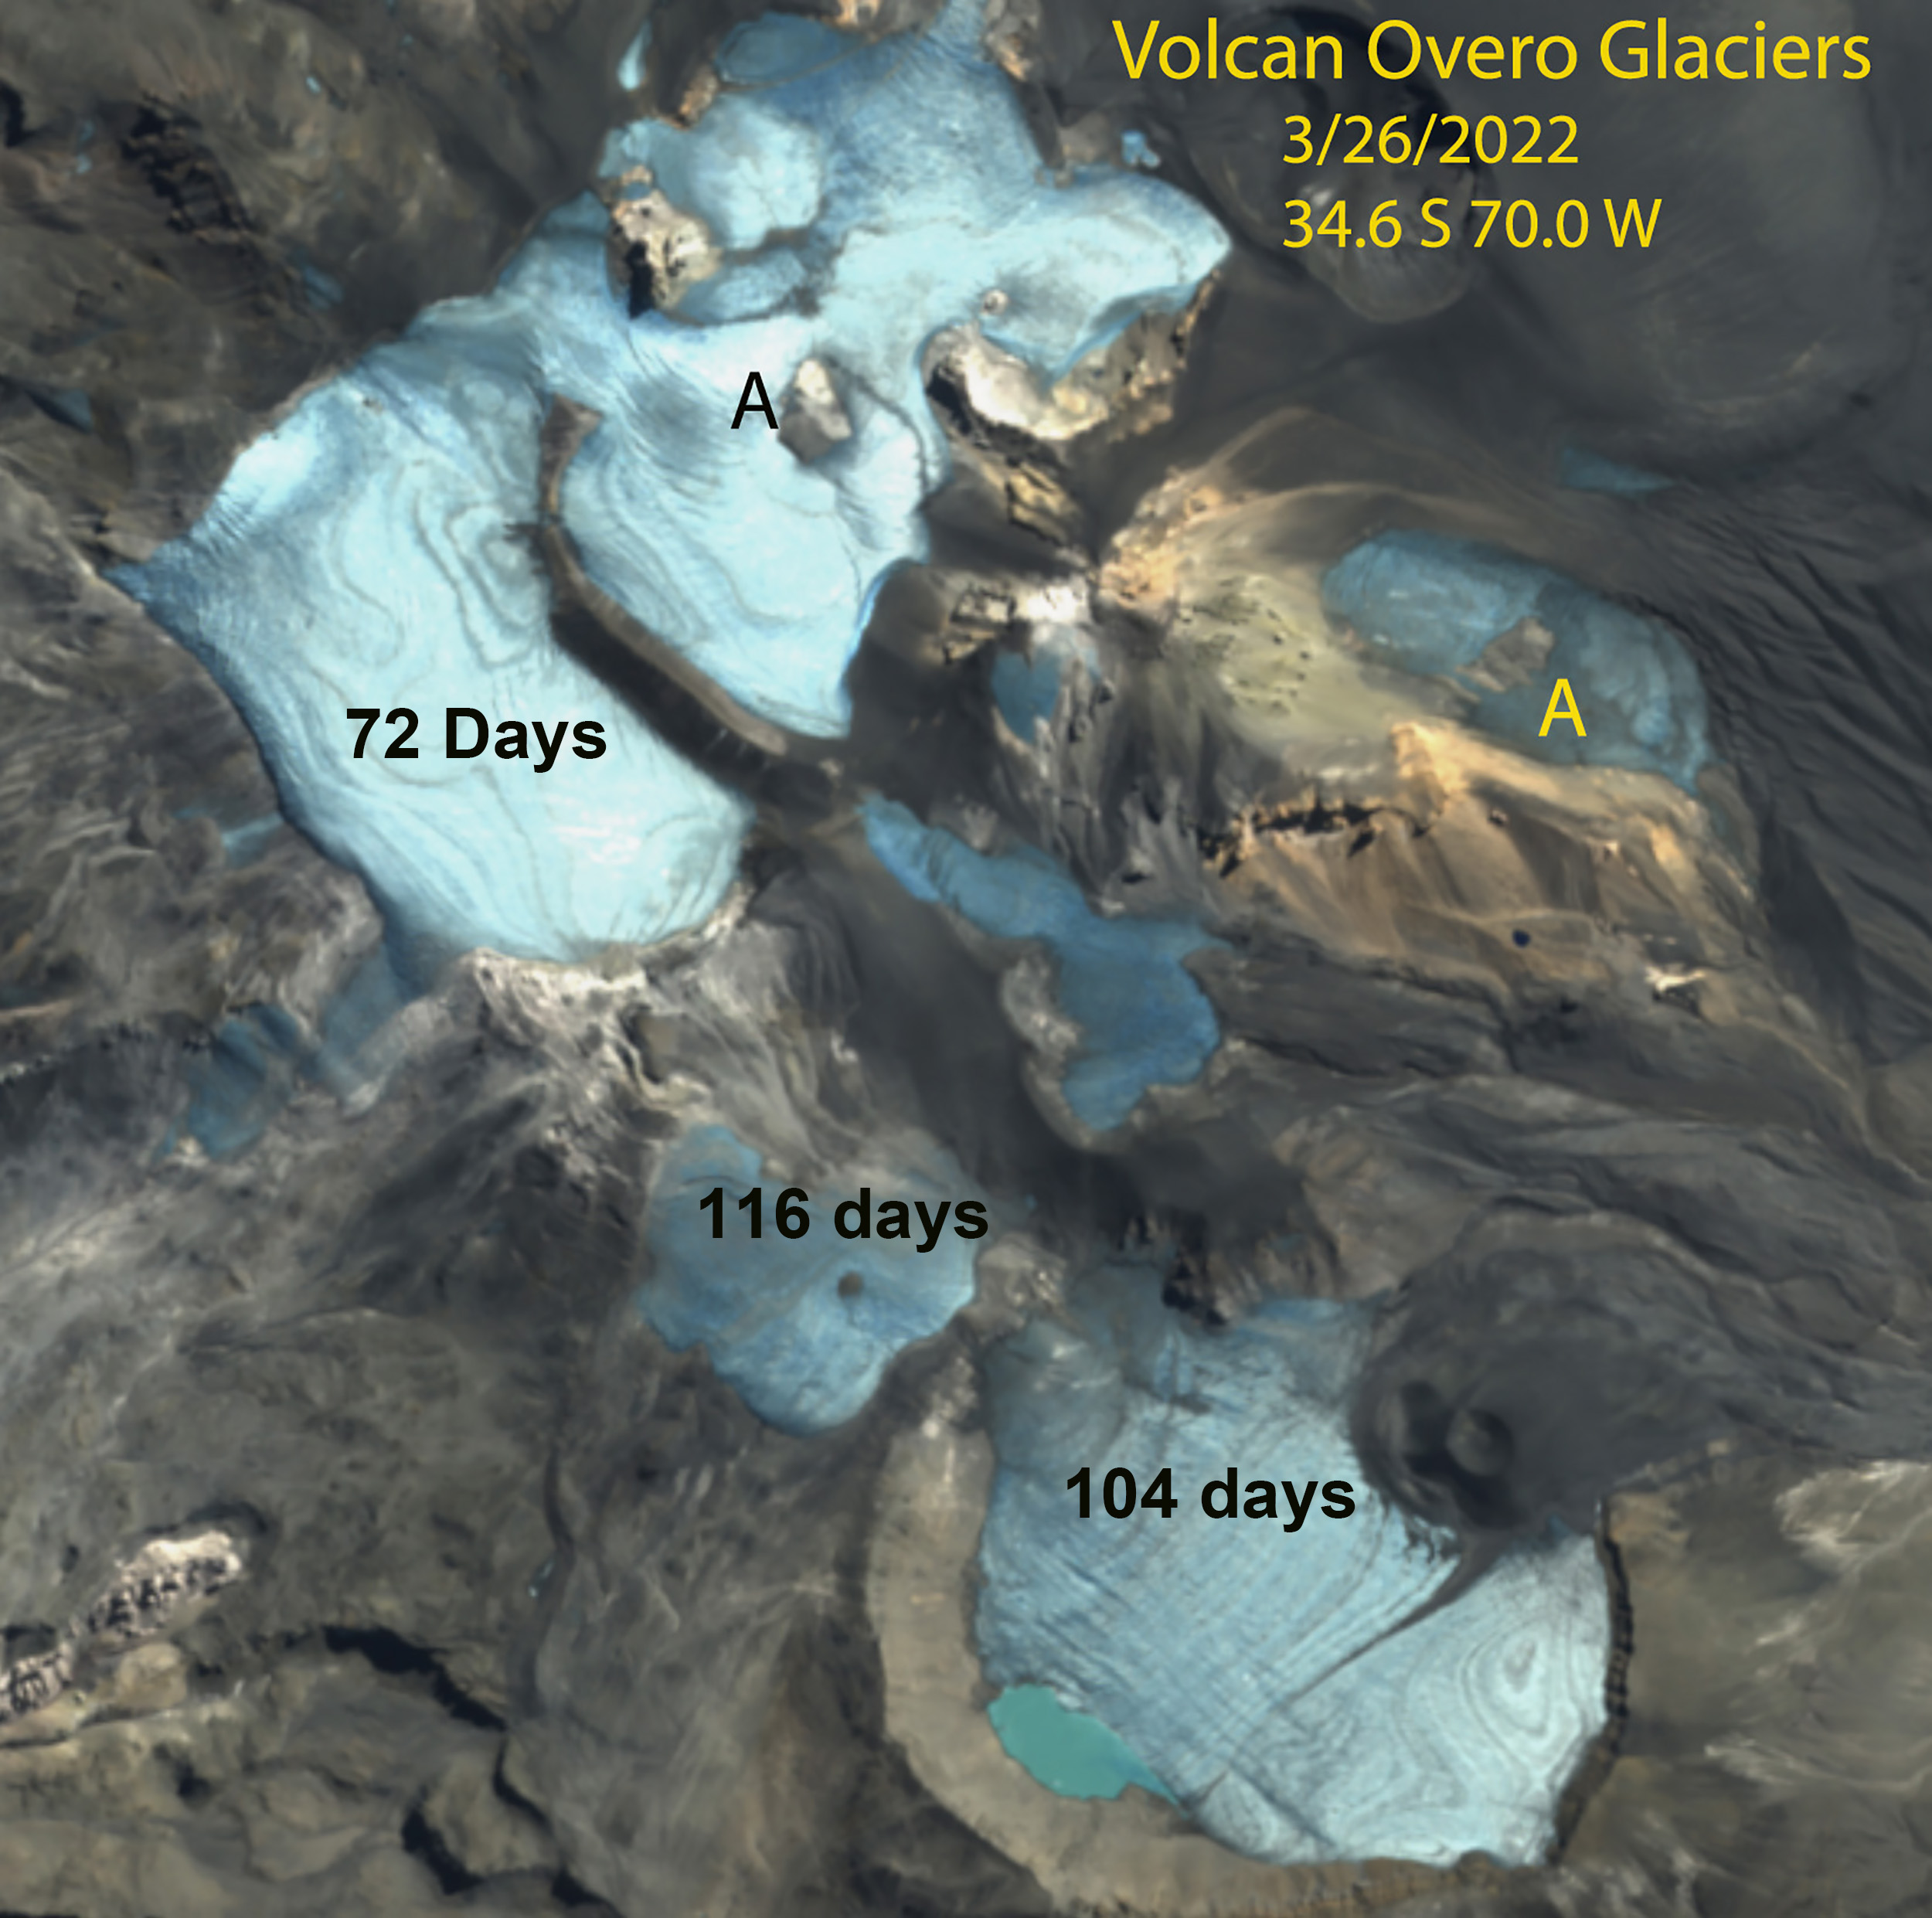
Volcan Overo  in Sentinel image indicating days of exposure at surface of firn and ice , March 26, 2022.

Honeycomb Glacier (H) with evident firn lines below the annual snowline on Oct. 19, 2022 in a Sentinel image.


Olivares Beta and Gamma Glaciers, Chile Bare of Snowcover in 2022

Olivares Beta (B) and Olivares Gamma (G) Glacier in Sentinel image from 1-23-2022, illustrating the lack of retained snowcover with 8 weeks left in the melt season. The yellow arrow marks proglacial lakes below each glacier. The red arrow an area of emerging bedrock on the upper Beta, X marks a location where the glaciers were joined in 1986 and now have separated. 

Olivares Beta and Olivares Gamma Glacier are adjacent glaciers 50 km NE of Santiago Chile in the central Andes of Chile. The glaciers are at the headwaters of the Olivares River, which drains into the Coloardo River. The Alfalfal Hydropower Planton the Colorado River is a 178 MW run of river plant completed in 1991 and owned by AES Andes. Malmros et al (2016) identified the retreat and area change of te Olivares glaciers for the 1955-2013 period. They noted a retreat of 979 m from 1955-1994 on Olivares Beta and 753 m on Olivares Gamma Glacier. The identified area loss from 1955-2013 was 21% on Olivares Beta and 34% Olivares Gamma.  Dussaillant et al (2019) identified a slower mass loss  -0.28 m/year in this region from 2000-2018, than further south in the Patagonia Andes or north in the Tropical Andes. Here we examine Landsat imagery from 1986-2020 and Sentinel Imagery from 2020-2022 to identify changes in area and snowcover.  The lack of retained snowcover indicates mass balance losses which will drive further retreat.

Olivares Beta (B) and Olivares Gamma (G) Glacier in Landsat images from 1986, 1993, 2015 and 2020. The yellow arrow marks the terminus location in 1993 of both glaciers, the red arrow an area of emerging bedrock on the upper Beta, X marks a location where the glaciers were joined in 1986 and now have separated. 

In  1986 and 1993 both glaciers terminated in small proglacial lakes, yellow arrows, and were connected adjacent to Point X.  There is no evident bedrock emerging on the upper Beta. In 1986 there is limited retained snowcover, ~10% of total area by early March. In 1993 there is 30% snowcover on the glaciers in March. By 2015 the glacier had receded from the proglacial lakes, bedrock is emerging at the red arrow on the upper Beta, and the glaciers are barely connected at Point X. Snowcover is ~10% of total area in mid-February.  In 2020 the glaciers have disconnected at Point X and there is less than ~10% retained snowcover by mid-February. The proglacial lakes are also quite brown suggesting high runoff from the dirtier/darker glacier. By January 23, 2022 both glaciers have again lost almost all snowcover with 8 weeks left in the melt season. The dirtier firn and ice at the surface melts at a faster rate than snow for the same weather conditions.  The result will be large mass balance losses in 2022 that will further lead to glacier thinning and recession. Both glaciers currently extend from ~3800 m to ~4800 m, with areas below 4600 m consistently being in the ablation zone.

The early loss of snowcover has been seen on other nearby glaciers Cortaderal Glacier, Chile and Volcan Overo, Argentina due to the unsually warm conditions in the region, particularly in the first half of January.

Olivares Beta (B) and Olivares Gamma (G) Glacier in Sentinel image from 2-18-2020 illustrating the lack of retained snowcover with 4 weeks left in the melt season. The yellow arrow marks proglacial lakes below each glacier. The red arrow an area of emerging bedrock on the upper Beta, X marks a location where the glaciers were joined in 1986 and now have separated. 

Olivares Beta and Olivares Gamm


Volcan Overo, Argentina Glaciers No Retained Snowcover at Midsummer

Volcan Overo glaciers in Sentinel images from January-2017, 2021 and 2022 illustrating fragmentation and no retained snowcover in 2022 with half the summer to go.

Volcan Overo is a 4619 m high Andean mountain in Argentina with a relatively low sloped broad summit region above 4000 m. This mountain has been the site of sulfur mining, with both an old tram and mining road leading to the summit region. The summit region is host to a glacier complex that is shrinking and fragmenting. In mid-January, 2022 the glacier has lost all of its snow cover.  La Quesne et al (2009) reported significant annual thinning in the latter half of the 20th century on nearby glaciers in Argentina and Chile. Dussaillant et al (2019) identified a slower mass loss  -0.28 m/year in this region from 2000-2018, than further south in the Patagonia Andes or north in the Tropical Andes. Here we examine Landsat images from 1986-2022 to identify longer term changes and with Sentinel images from 2017-2022 the recent changes including the impact of the recent January heat wave (Washington Post, 2022).

In 1986 there are four discrete glaciers around the caldera, covering ~12 km2 the largest E around the summit ranges in elevation from 4200-4500 m.  D is an isolated area at 4000-4100 m. A,B and C is a single glacier extending from 3900-4300 m. F is an area of rapidly diminishing glacier ice. In the early February image snowcover is good across all ice areas except F. In 2003 there is limited evident change with good snowcover across all except D. By 2013 A, B and C have fragmented into three separate glaciers and F is nearly gone. Only E has significant snowcover. In 2022 C and D have declined to less than 50% of their 1986 area, the overall Volcan Overo glaciated area has decline to ~8.1 km2.  It is not quite mid-summer on January 8, 2022 yet all snowcover has been lost from the glaciers of Volcan Overo. The glacier remnants at F are now gone.

Sentinel images in January of 2017 indicate good snowcover across the caldera glaciers with a total glacier area of 9.4 km2.  In January 2018 snowpack has been lost from A-D, exposing annual layers on A. Only the higher elevation E has retained snowcover. In January 2019 snowcover is good across all of the glaciers. In January 2020 snowcover is minimal on all glaciers except E. In January 2021 A, C and D have lost nearly all snowcover while B and E both are at least 50% snowcovered. In January 2022 there is no retained snowcover on any of the glaciers. The glacier area has been reduced as well. Glacier A, B, C and D no longer retain snowcover consistently and cannot survive current climate. Glacier B, C and D will continue rapidly diminishing.  Glacier A is much thicker and will take longer to disappear. The persistent lack of an accumulation zone indicates the glacier cannot survive (Pelto, 2010). Glacier E continues to recede at a slower rate, and continues to maintain snowcover most summers, but not in 2022.

The minimal snowcover of January 2022 on Volcan Overo matches that of Corataderal Glacier, Chile 30 km due west.

.

Volcan Overo glaceir complex in Landsat images from 1986-2022. The three main glaciers in 1986 have fragmented into five glaciers by 2022 and one glacier (F) has disappeared. Glacier area declined by ~30% and no snowcover is retained in mid-January of 2022.

Volcan Overo glaciers in Sentinel images in January-2018, 2019 and 2020 illustrating fragmentation and snowcover.

Cortaderal Glacier, Chile 2022 Heat Wave Reduces Snow Cover, Retreat Continues

Cortaderal Glacier in Landsat images from 2014 and 2022. The glacier retreated 1400 m during this interval. The snowline in January 2014 is at 3750 m. On January 15, 2022 the snowline averages 4100 m with less than 15% snowcovered with 2.5 months left in the melt season. Red arrow is 2014 terminus and yellow arrow is 2022 terminus.

Cortaderal Glacier is a large valley glacier in Central Andes of Chile. Adjacent to the Universidad Glacier, it flows from Volcan Paloma (4860 m) and Nevado Penitente (4350 m) and drains into the Rio Cortaderal. Rio Cortaderal joins the Cachapoal River, that supplies two Pacific Hydro projects; a 110 MW run of river project at Chacayes and the 78 MW Coya run of river project a short distance downstream. The glacier is an important water resource from December-March. Bravo et al (2017) noted for Universidad Glacier that it supplied 10-13% of all runoff to the Tinguirica Basin during the melt season. La Quesne et al (2009) reported that Cortaderal Glacier retreated 110 m from 1970-2000 and 450 m from 2000-2007. Here we examine the retreat of this glacier from 2014-2022 and the unusually high snow lines in mid-January of 2022 due to the recent January heat wave (Washington Post, 2022).

Cortaderal Glacier in Sentinel images from 2016 and 2022. Point A is the bedrock area that emerged in 2016 and was at the glacier front by 2022. Point T marks the 2016 terminus position, Point B is at 3750 m and Point C is at 4200 m. Snowline on January 22, 2016 is at 3200 m and averages 4100 m on January 13, 2022.

In February of 2014 the glacier terminated on the outwash plain at 2800 m. The snowline in mid January was at 3750 m. On January 9, 2016 the snowline was at 3200 m.  At Point A a small bedrock area has emerged from beneath the ice  1 km upglacier of the terminus. On January 16, 2017 the snowline is at 3750 m. On January 19, 2019 the snowline is at 3700 m. The bedrock exposed at Point A is no longer surrounded by ice due to expansion and glacier retreat. On December 14th the snowline is at 3700 m and the glacier is 50% snowcovered. By January 15 there is less than 15 % snowcover, and the snowline averages 4100 m, nearly at the top of the glacier. With 10 weeks left in the melt season snowcover will decline further. This is reminiscent of reduced snowcover on glaciers in the Pacific Northwest due to the summer 2021 heat wave (Pelto, 2021).

The glacier has retreated to Point A, with an average frontal recession of 1300 m from 2014-2022. This is greater than the retreat from 1990-2014 of ~800-900 m (Pelto, 2014).  The glacier now terminates at 3050 m in a region of much steeper slope that will reduce the retreat rate in the near future.

Cortaderal Glacier snow covered area change in two Landsat images one month apart. Snowcover declined from ~50% to 15%.

Cortaderal Glacier in Sentinel images from 2017 and 2019. Point A is the bedrock area that emerged in 2016 and was at the glacier front by 2022. Point T marks the 2016 terminus position, Point B is at 3750 m and Point C is at 4200 m. Snowline on January 16, 2017 is at 3750 m and averages 3700 m on January 19, 2019.

Landsat image indicating retreat from 1990-2014 of Cortaderal Glacier, red arrow 1990 position, yellow arrow 2014 position.

Braithwaite Icefield, British Columbia Fragments, Proglacial Lakes Develop and Accumulation Zone is Lost

East Creek Glacier, a Braithwaite Icefield glacier in Sentinel images from 2018, 2019 and 2021 illustrating the at Point A and B  where the glacier has disconnected from other glaciers of the icefield . Point C is a the terminus of one icefield outlet glacier that develops a proglacial lake. Point D is adjacent to the ice divide where ice flows both north and south from.  Note the area is snow free in 2018, 2019 and 2021. The ice divide has ~12 annual layers exposed as rings.

The Braithwaite Icefield is east of Hobson Lake is in the Columbia Mountains an interior range of British Columbia. Our focus here is on a glacier at the headwaters of East Creek, “East Creek ” Glacier. This glacier has experienced changes that exemplify the recent changes of glaciers across western Canada. An extensive western Canada glacier inventory of the 1984-2020 period using optical satellite imagery noted an accelerated area loss Bevington and Menounos (2022).  Specifically they quantified glacier fragmentation accelerated from 26  to 88  occurrences per year. They note that about 1141 glaciers disappeared from the inventory falling below the 0.05 km2 detection limit. The retreat also led to proglacial lake area formation accelerating from ~9 km2/year to 49 km2/year.

In 1987 East Creek Glacier accumulation zone adjacent to Point D drains north and south to separate terminus areas. In 1987 the outlet glacier that terminates at Point C is connected at Point B to the East Creek Glacier at its southern terminus.  Adjacent to its northern terminus it is connected at Point A to another icefield glacier.  By 2015 the glacier has separated at Point B from the outlet glacier terminating at Point C. There is not retained accumuluation at the glacier divide adjacent to Point D. This exposes a ring of ~12 annual layers preserved in glacier ice, from former annual accumulation layers that had been retained. In the ensuing summers of 2016, 2017, 2018 2019 and 2021 all of the snowpack was lost. Two proglacial lakes have formed, the area of the lake at the East Creek southern margin is 0.03 km2, the area of the lake at Point C is now 0.1 km.

The persistent lack of an accumulation zone indicates the glacier cannot survive (Pelto, 2010).  The glacier still has an area of 2.5 km2, that will allow it to endure for several decades. Ben Pelto,  and Menounos a(2021) reported that the mass balance of Zillmer Glacier, due east in the same range, had a mean negative balance of ~-0.7 m/year from 2014-2018, with an average ELA of 2465 m. The glacier had a mean altitude of 2380 m and a high elevation of 2860 m. The mean elevation of Zillmer Glacier is higher than the divide on East Creek Glacier, which along with a relatively steep mass balance gradient of 5 to 8 mm w.e. m-1, leads to the glacier maintaining an accumulation zone.  The retreat is not as substantial as many glaciers in the region, note Kiwa Glacier or Franklin Glacier, but the overall changes are profound.

East Creek Glacier a Braithwaite Icefield glacier in Landsat images from 1987, 2015, 2019 and 2021 illustrate the changes. Point A and B are points where the glacier is connected to other glaciers of the icefield that separate-fragment during this period. Point C is a the terminus of one icefield outlet glacier that develops a proglacial lake. Point D is adjacent to the ice divide where ice flows both north and south from.  Note the area is snow free in 2015, 2019 and 2021.


Changsang Glacier, Sikkim 2 km retreat and Lake Expansion 1989-2021

Changsang Glacier in Landsat images from 1989 and 2021, illustrating a 2.05 km retreat from 1989 terminus position-red arrow to the 2021 terminus position-yellow arrow.  Formation of a new lake is also evident. The snowline is marked by purple dots.

Changsang Glacier (Karda Glacier) is a valley glacier just north of Kanchengjunga, Nepal/Sikkim. A comparison of Landsat imagery from 1989 to 2021 identifies the formation of a lake at the end of the glacier.

The Changsang Glacier was reported to be retreating 22 m/year from 1976 to 2005 (Raina, 2009). Shukla et al (2018) inventoried lakes in Sikkim during the 1975-2017 period and found 35 proglacial lakes in contact with a glacier in 2017. The number and area of these lakes had increased 34% and 90% respectively during this period. One of the rapidly expanding lakes is at Changsang Glacier.

In 1989 there is no evidence of a significant lake either on top of the glacier-supraglacial or proglacial, at the end of the glacier. In 2000 there are a several small lakes beginning to develop with a combined area of 0.22 km2 (Shukla et al., 2018), the snowline is at 5650-5700 m. In 2002 the supraglacial lakes are noticably more connected, and the snowline is at 5700 m in mid-December . By 2011 the main lake is 1000 meters long and has one debris covered ridge that separates it from a second lake. By 2015 the lake has expanded incorporated the second lake and is now 1600 meters long with an area of 0.70 km2 .  The snowline is notably high at 6000 m in mid-October . On Christmas Day 2020 the snowline is particularly high at 6100 m, reflecting the warm post-monsoon early winter period observed at Mount Everest last year (Pelto et al , 2021). In December 2021 the proglacial lake at ~5400 m is 0.93 km2 and the glacier has retreated 2050 m since 1989. Lake expansion since 2015 has been slower. The lake is impounded by a 400 m wide moraine belt on the low slope valley floor beyond the lake margin, and does not appear to be a significant GLOF risk. The retreat of this glacier is similar to that of Kokthang Glacier and Middle Lhonak Glacier.

Changsang Glacier in Landsat images from 2000 and 2020 illustrating retreat from 1989 terminus position-red arrow to the 2021 terminus position-yellow arrow.  Transition from small supraglacial lakes to a single proglacial Lake is evident. The snowline is marked by purple dots, which in late Deember 2020 reached 6100 m.

Changsang Glacier in Landsat images from 2002 and 2015 illustrating retreat from 1989 terminus position-red arrow to the 2021 terminus position-yellow arrow.  Coalescing supraglacial lakes into a single proglacial lake is evident. The snowline is marked by purple dots which in October 2015 reached 6000 m.

Oriental Glacier, Chile Retreats from Island Poised for Rapid Lake Expansion

Oriental Glacier in 1986 and 2021 Landsat imagery illustrating retreat from the island (I) and diminishing width and flow of tributaries at P0int A and B. A marginal lake has formed at Point M as the glaciers terminus section has thinned and narrowed.

Oriental Glacier terminates in an expanding proglacial Lago Oriental at the northeastern margin of the Southern Patagonia Icefield (SPI). The glacier had terminated on an island in this lake for several decades until 2019. In this region glaciers thinned ~0.5 m/year from 2000-2012 with Oriental Glacier thinning 0.5-1.0 m/a (Falaschi et al 2017)..  Mouginot and Rignot (2014) identified a velocity peak at 1 km/year extending from the Cerro Azul (3018 m) eastward to the northward terminus bend.  Oriental Glacier had a slower retreat than most SPI  glaciers from 1870-2011 at 0.1-0.15 km/a, and the fastest rate from 2001-2011 Davies and Glasser (2012). Here we examine Landsat imagery from 1986 to 2021 to illustrate glacier changes and Sentinel imagery from 2020 and 2021 illustrating island separation and retreat acceleration.

In 1986 the glacier terminates on the island with a small proglacial outwash plain in front of the eastern tongue, marginal connection is 1.5 km long. Tributary A and B are both significant contributors to the terminus tongue. At Point M the glacier is 1.75 km wide.  The surface slope of the lower 6 km of the glacier in from 1986-2002 is ~4-5%, this is a low surface slope, suggesting this section of the glacier occupies a basin, a continuatin of the current Lago Oriental.  In 1998 there is little evident change.  By 2002 the glacier connection to the island has a similar length, but the ice is thinner than in 1986. In 2015, tributary A and B are narrower, contributing less ice to the terminus region. The connection to the island is reduced to ~1 km, while the proglacial outwash plain is still similar in size. In January of 2019 the connection to the island is almost gone and the proglacial outwash plain is significantly reduced. The marginal lake is ~0.05 km2. By February of 2020 the connection to the island has been lost and the marginal lake has expanded to 0.1 km2. In 2021 the glacier has retreated 150 m from the island and a rift has formed that will lead to a signficant calving event ~0.125 km2, probably this summer. The marginal lake has expanded to 0.2 km. Tributary B has essentially separated from the main glacier in 2021.

Calluqueo Glacier retreat and Lucia Glacier retreat have been significantly larger; however, Oriental Glacier is poised for a rapid retreat and lake expansion. The lake basin likely extends at least 5 km from the present terminus. At that point Lago Oriental would be 9 km long.

Oriental Glacier terminus reach in 2019, 2020 and 2021 Sentinel 2 imagery illustrating retreat from the island (I) and expansion of the marginal lake at Point M. Note tributary B has essentially disconnected in 2021. A rift is forming at yellow arrow, poised for a calving event this summer.

Oriental Glacier in 2002 and 2015 Landsat imagery illustrating connection remaining to the island (I). A small marginal lake has formed at Point M as the glaciers terminus section has thinned and narrowed.

Oriental Glacier in 1998  Landsat image and topographic map of area. Elevation contours indicates low slope of termius reach from 600 m to terminus. Blue arrows indicate glacier flow. 


Hindle Glacier Retreat Causes Rapid Opening of Fjord, South Georgia

Hindle Fjord opening comparison in 2009, 2015 and 2021 Landsat images.  Point A is the northern tributary, Point B the middle tributary, Point C separates the eastern and western tributary and Point D is Ross Glacier.

Hindle Glacier enters Royal Bay on the east coast of South Georgia Island.  The British Antarctic Survey (BAS) has been the  examining glacier change on South Georgia Island, Cook et al (2010) noted a pattern island wide with many calving glaciers having the fastest retreat.  Alison Cook (BAS) identified that 212 of the Peninsula’s 244 marine glaciers have retreated over the past 50 years and rates of retreat are increasing.  In 2017 we examined Landsat imagery from 1989 to 2017 to identify the rapid retreat rate of Hindle Glacier. NASA Earth  piggy backed on this assessment, with excellent imagery, since the retreat rate has increased. Here we focus on the formation of the fjord from 2009-2021.

For Ross-Hindle Glaicer in 1989 the glaciers joined 2.5  km from the terminus spanning Royal Bay with a 3.2 km wide calving front.  By 2001 the glacier front had retreated 800 m, but was still a single joined calving front. By 2009 the glaciers had separated due to an additional retreat of  1.4 km. The Hindle Glacier front was now retreating south up opening a new separate fjord from Ross Glacier.  The calving front in 2009 was 1.6 km wide.  By 2015 a 1.6 km retreat led to the separation of Hindle from the northern tributary, Point A.  From 2015 to 2019 the main terminus retreated another 2.1 km, passed the middle tributary at Point B, to a prominent rock knob, Point C, separating the two main tributaries of the glacier with total retreat of  6.1 km in 30 years, an exceptional rate of over 200 m/year. The western tributary is at the head of the fjord and no longer calves significantly, while the eastern tributary has another 1 km to an increase in slopes that likely is close to head of the fjord. The new fjord is 4.5 km long and averages 1.1 km in width and has an area of 5.5 km2.  The northern tributary near Point A is also still calving and retreating.

This embayment opens up new areas for Gentoo Penguins and Elephant Seals to occupy. There are current colonies in Royal Bay and like at Moraine fjord, these two species are early colonizers of deglaciated terrain (see map below from BAS). In particular the beaches adjacent to the northern tributary, just north of Point B and northwest of Point A are wave protected and low slope.  Levy et al (2016) discuss that the southern Gentoo Penguins tend to remain within the same archipelago year around. They examined DNA from 39 Gentoo at Bird Island, adjacent to South Georgia, and found none were migrants.

Hindle Fjord in 2020 and 2021 Sentinel images indicating ongoing retreat at Point A and C, with a significant sediment plume from Point B in December 2020. Point A is the northern tributary, Point B the middle tributary, Point C separates the eastern and western tributary and Point D is Ross Glacier.

Hindle Glacier comparison in 2001, 2017 and 2019 Landsat images.  The red arrow is the 2001 glacier terminus. Point A is the northern tributary, Point B the middle tributary, Point C separates the eastern and western tributary and Point D is Ross Glacier.

British Anatarctic Survey map of Royal Bay area showing Elephant Seal beaches (yellow X) and Gentoo Penguin colonies (purple dots).

Steffen Glacier, Chile Drainage of Laguna de Los Tempanos

Laguna de los Tempanos full on February 9, 2021 and drained on December 6, 2021 in Sentinel 2 images. Point A marks the western margin when full. Point C marks the western margin when drained. 

Steffen Glacier is the south flowing glacier from the 4000 km2 Northern Patagonia Icefield (NPI). Several key research papers have reported on the spectacular retreat of this glacier in recent years.  Glasser et al (2016) reported that Steffen Glacier proglacial lake area expanded from  12.1 km2 to 20.6 km2 from 1987 to 2015, due tin part to a 100 m snowline rise. noted to have risen ~100 m.  Dussaillant et al (2018) determined the annual mass loss of NPI at ~-1 m/year for the 2000-2012 period, with Steffen Glacier at -1.2-1.6 m/year. Millan et al (2019) indicate the area of tributary glacier convergence near the northwest terminus and above the glacier is 700 m thick, and that the glacier has been retreating along an area where the glacier bed is below sea level, though the terminus now is close to sea level. Steffen Glacier retreat from 1987-2019 was 4.4 km, ~137 m/year (Pelto, 2019). Aniya et al (2020) reported on 19 glacier drainage events from 1974-2020, with most occurring in late summer or early Fall. They noted the largest in 2016 and 2017 were the first to expose much of the lake bottom.

There are two large ice dammed proglacial lakes on the west side of the glacier.  Laguna de Los Tempanos is the southern one 6 km upglacier of the current terminus and 11 km upglacier of the 1987 terminus position. Here we utilize Landsat and Sentinel imagery to examine the evolution of the lake from 1987-2021, Including the 2021 drainage event.

Laguna de los Tempanos in Landsat images from 1987, 1999, 2012 and 2019. Yellow arrow is western extent of the lake in 1987 and 1999, while Point A is the western extent in 2012 and 2019.

In 1987 the area of the lake is 5.2 km2 extending west past point A to the yellow arrow. In 1999 the water level is lower leading to a peninsula developing at Point A, with a lake area of 5.0 km2.  By 2012 the water level had dropped further and the west margin of the lake was now at Point A and the lake area was 4.8 km2.  The filled size remained unchanged for most of the 2012-2021 period, though there was large drainage events in 2016 and 2017 the lake rapidly refilled.

I

On November 17, 2016 the lake is full, but it is drained on April 16, 2017 with evident icebergs on the bottom, the drainage event occurred on March 30/31 2017 (Aniya et al 2020)

By January 21, 2018 the lake is again full and is full again on December 7, 2018 in Sentinel 2 images.

The lake is full on March 27, 2019 and on Feb. 20, 2020 in Sentinel 2 images.


On March 31, 2021 the lake is still full, by November 16, the lake area had declined from 4.5 km2 to 1.9 km2, in Sentinel 2 images.

The drainage event appears to have been in the early spring as the lake is full on May 20, 2021 at the start of the winter season and at the end of the winter season on August 8, 2021 in Sentinel 2 images. The lake remained largely filled on Sept. 7, 2021, but had drained by Oct. 7, 2021.

By October 7, 2021 the  lake had drained and two months later the lake is still not filling.  As Steffen Glacier thins, its ability to impound this lake has diminished from 1987 to 1999, from 1999 to 2012 it diminished again.   Now we may have another evolution in this process, with the more complete drainage starting in 2016 and now in 2021 the first event where refilling is not progressing.

Swanson River Glaciers Retreat: Two Very Bad Summers in 2018 & 2019

Swanson River glaciers, British Columbia in Landsat images from 1984 and 2019. EM=East Meade Glacier, CG=Canning, red arrows=1984 terminus, yellow arrow=2019 terminus, purple dots=snowline. Points 1-8 are specific glacier locations with very limited to no retained snowcover.

The Swanson River feeds into Tagish Lake in NW British Columbia. The watershed is host to dozens of glaciers. Here we exaine the retreat of the two largest glaciers in the watershed from 1984-2019, referred to as “East Meade” and “Canning Glacier” in this post. We also look at the loss of snowcover on glaciers across the watershed in 2018 and 2019. These glaciers are in the northeast sector of the Juneau Icefield, sharing a divide with the retreating Meade Glacier, Alaska.  The Juneau Icefield Research Program focuses on glaciers to the south of these including  the retreating Llewellyn Glacier.

In 1984 the two glacier tongues terminated at 1000 m, red arrow and the snowline was at 1350 m, purple dots. This was a year of positive glacier mass balance on the Juneau Icefield, where I was working that summer. By 1998 there has ben modest retreat and the snowline is at 1400-1450 m. The retained snowpack at the end of the summer is limited to the upper reaches of the tributary glaciers. This year was a negative balance year on the Juneau Icefield where I was busy probing snowpack.

By 2018 Canning Glacier had retreated 1400 m since 1984 and terminated at 1100 m.  East Meade Glacier had retreated 1100 m since 1984 and terminated at 1100 m. In 2018 there is no retained snowpack on East Meade Glacier. There is limited snowpack at the top of some of the tributaries in wind deposition zones, but many ofthe small alpine glaciers in the area have no accumulation zone. This summer led to the highest snowline ever observed on the Taku Glacier (Pelto, 2019). In 2019 the snowlineis even higher and the glaciers of the Swanson River basin are laid bare. There is no snowpack on East Meade (1) or on the adjacent tributaries at Point 2 and 3. There is no snowpack retained on Canning Glacier (4) or on the alpine glaciers east of the Juneau Icefield at Point 6 and 8.  At Point 5 and 7 each has a small patch of retained snowpack at its upper margin close below a peak.

These back to back summers are the type of conditions that lead to the loss of alpine glaciers when they become frequent enough to remove any retained snowpack not just from that year, but from previous years. The retreat of East Meade and Canning Glacier is much less than Meade Glacier, 4 km 1986-2018, and similar to Warm Creek Glacier.

.

Swanson River glaciers, British Columbia in Landsat images from 1998 and 2018. EM=East Meade Glacier, CG=Canning, red arrows=1984 terminus, yellow arrow=2019 terminus, purple dots=snowline. 

Canadian Topographic map of the area EM=East Meade Glacier, CG=Canning Glacier and TL=Tagish Lake