Mount Cayley Glacier, BC Loses 40% of Length 1985-2020

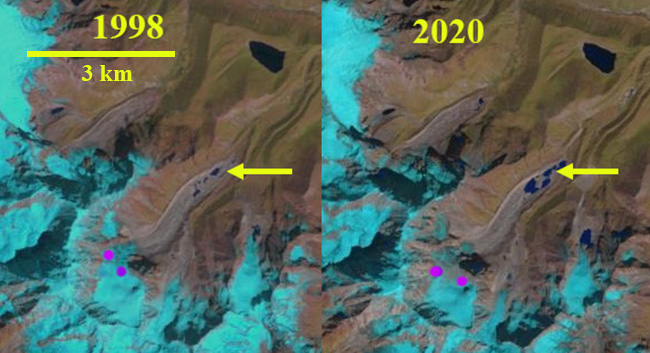
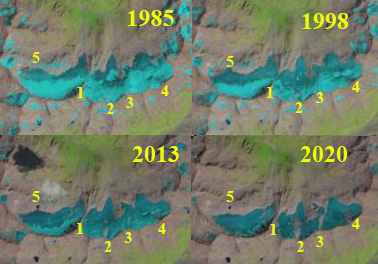
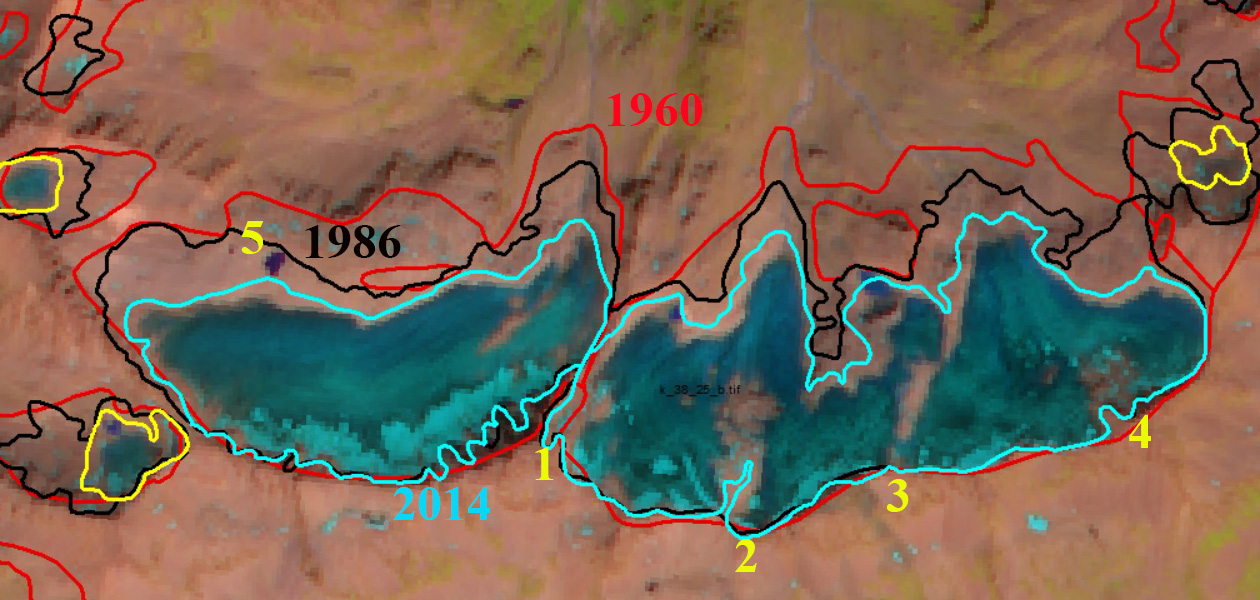
Mount Cayley Glacier (MC) and Brandywine Glacier (B) near Callaghan Lake (CL) in 1985 and 2020 Landsat Images. Yellow arrow indicates 2020 terminus, red arrow indicates 1985 terminus location.

Mount Cayley Glacier and Brandywine Glacier drain the northeast flanks of Mount Cayley and Brandywine Mountain in the Coast Range,  25 km west of Whistler, BC.  Both glaciers drain in to Callaghan Creek, a tributary to Cheakamus Rover. Retreat of Mount Cayley Glacier has led to separation into two glaciers. Retreat of Brandywine Glacier has led to development of a proglacial lake. BC Hydro operates the 157 MW Cheakamus Generating Station with a tunnel and two penstocks carrying the water 11 kilometres from Daisy Lake Reservoir  to the Cheakamus GS. The Cheakamus River has substantial salmon populations including Pink, Coho, Steelhead and Chum. For Chum BC Hydro maintains an annual escapement and spawning survey.  The main run for Chum is in the fall from Oct. 15 to early December, with most years seeing more than 100,000 adult Chum heading upstream to spawn (Middleton et al 2019). This is a 4% survival rate from the typical salmon fry population that exceeds 2.5 million (Middleton et al 2019). Here we examine Landsat imagery to indicate the glacier change from 1985-2020.

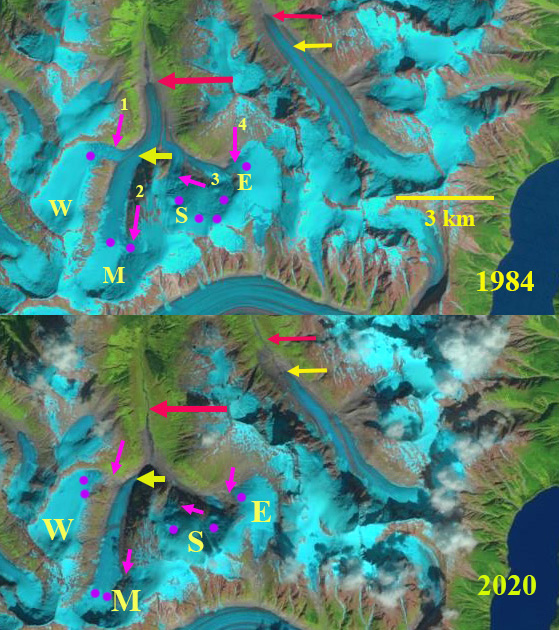
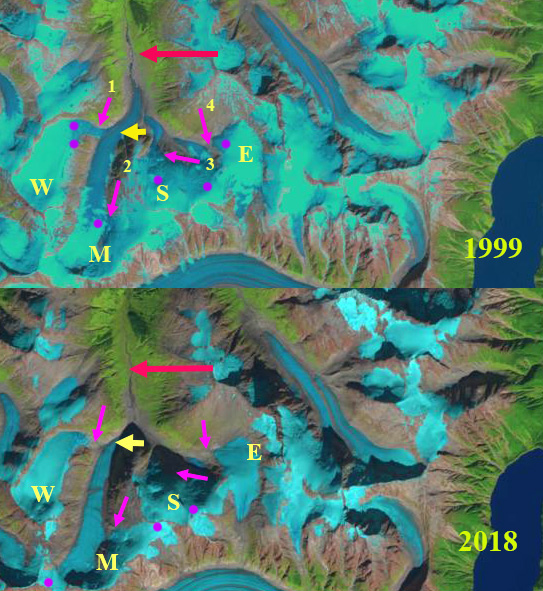
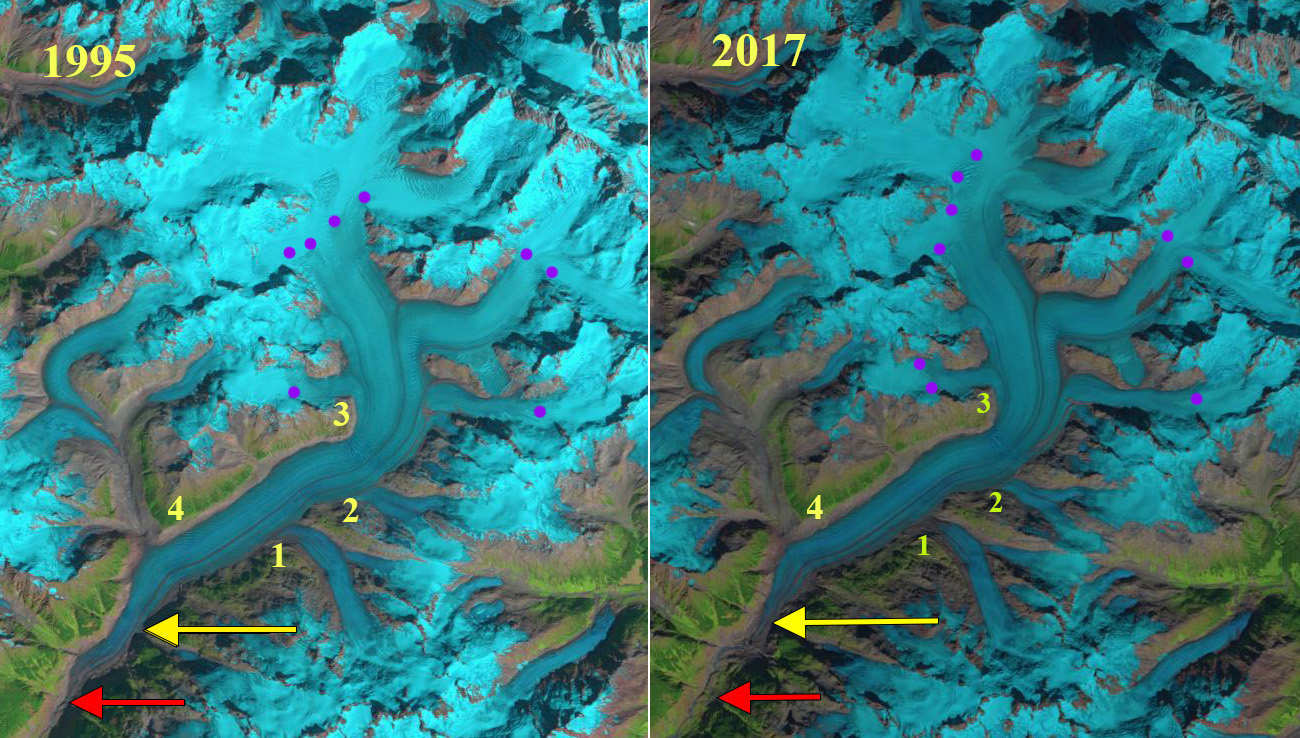
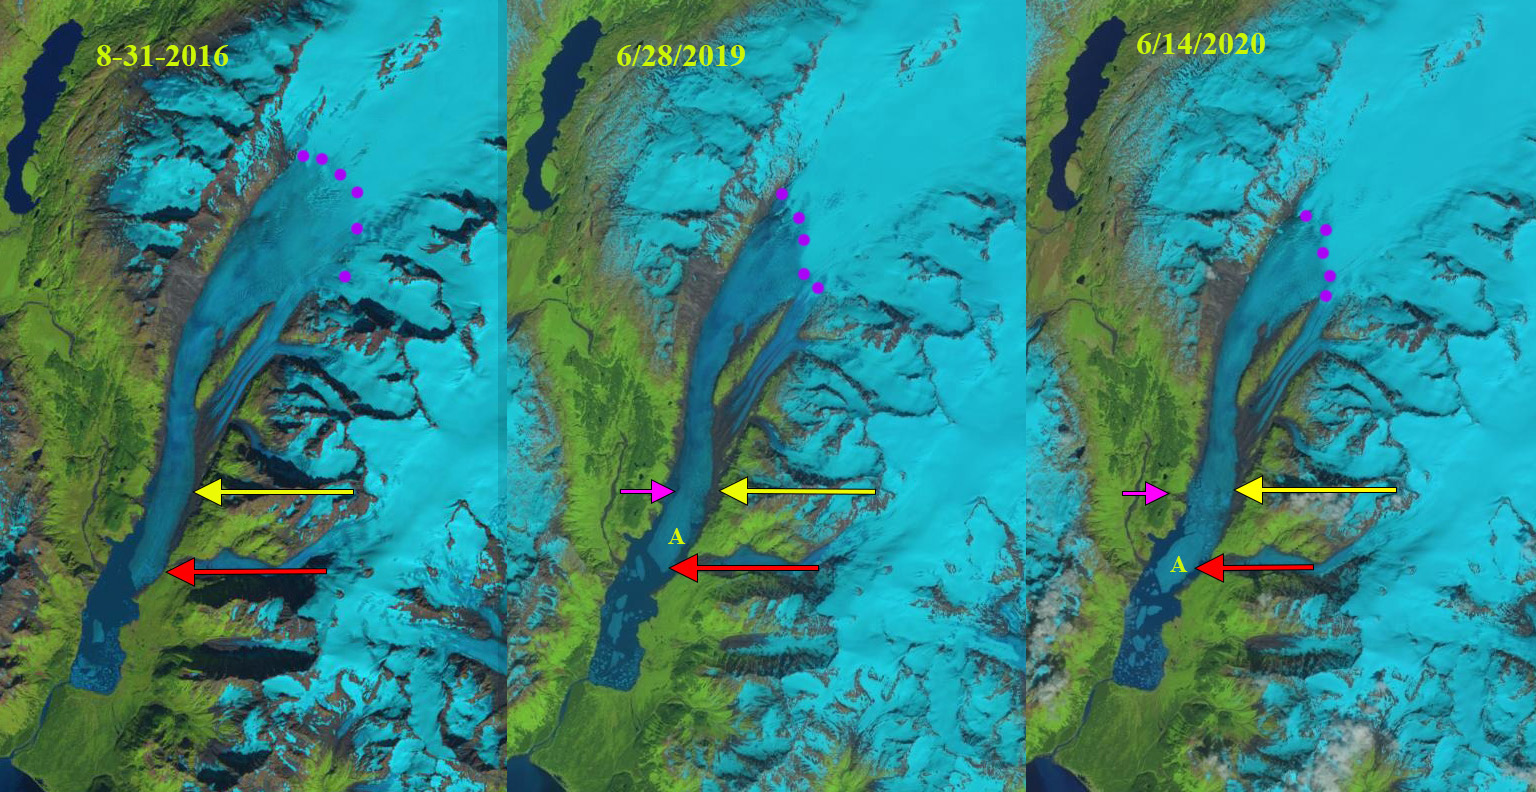
In 1985 Mount Cayley Glacier had two branches that merged and terminated in a proglacial lake at  1520 m. The east arm flowed north from the west ridge of Brandywine Peak and the west branch drained the east side of Mount Cayley.  The west arm was 3.75  km long and the east branch 1.8 km long. Brandywine Glacier was 1.2 km long terminating at 1575 m. By 1993 the two arms of the Cayley Glacier had separated. The snowline was particularly high with less than 10% of each glacier retaining small snowpatches above 2000 m.  The end of winter in 2015 a UBC Ski trip  across this area illustrates how beatiful it is and how snowy. Depsite this snow covered look, the snowpack in 2015 was low and near the end of a warm summer the snowline was again above 2000 m. In 2017 the proglacial lake in front of Brandywine Glacier is 300 m long.  The snowline is lower at 1850 m. In 2020 Brandywine Glacier  continues to terminate in the small proglacial lake and has retreated 400 m during the 1985-2020 period. The east arm and west arm of Cayley Glacier have retreated  950 m and 1400 m respectively in this 35 year interval. In both case this is 40% of the entire length of the glacier lost. The glacier now terminates at 1720 m.

In 2020 the snowline was  1900-1950 m.  The continued limited area of the accumulation zone is driving mass balance losses and retreat.  Across this region Menounos et al (2018) identified a mass loss for glaciers in this region of ~0.5 m year from 2000-2018.  This has driven retreat of small and large glaciers such as Franklin Glacier, Bridge Glacier and Stave Glacier. In 2015 the snowline was the highest of the last 37 years in the North Cascades, WA a short distance south (Pelto, 2018).

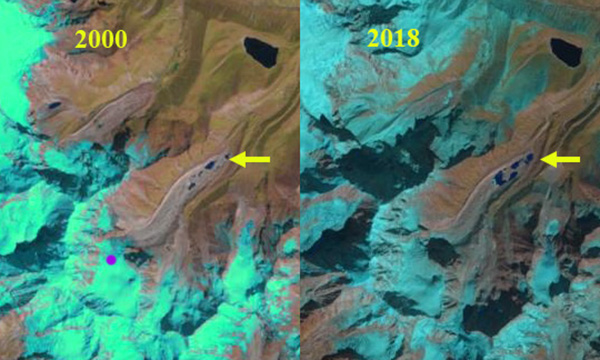
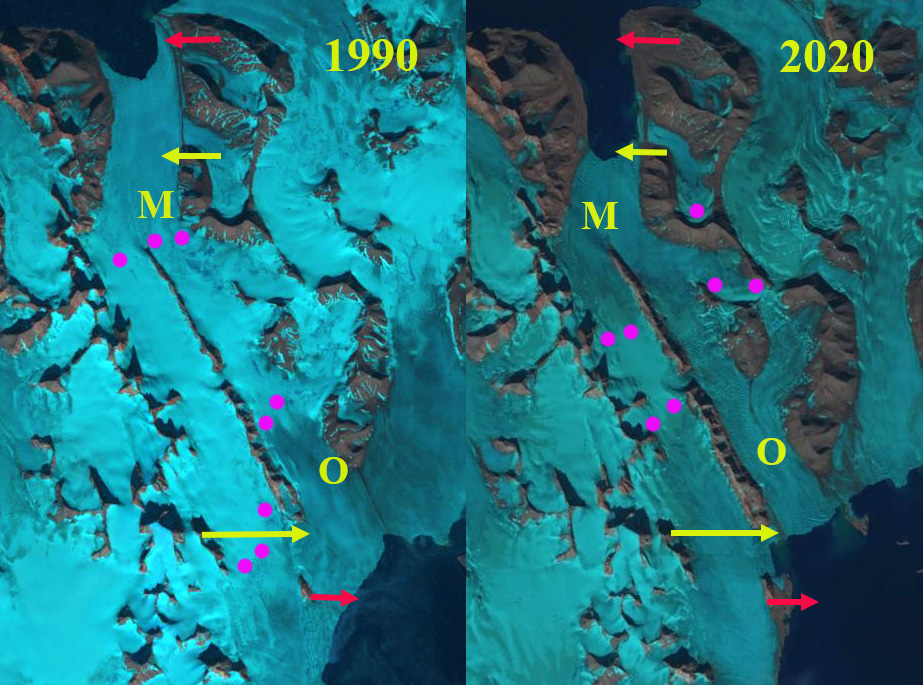
Mount Cayley Glacier (MC) and Brandywine Glacier (B) near Callaghan Lake (CL) in 1993 and 2017 Landsat Images. Yellow arrow indicates 2020 terminus, red arrow indicates 1985 terminus location.

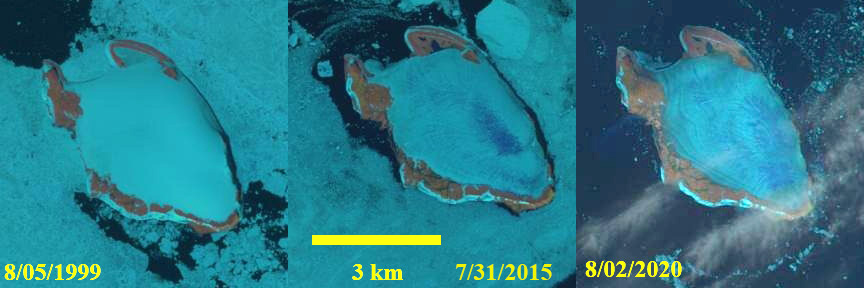
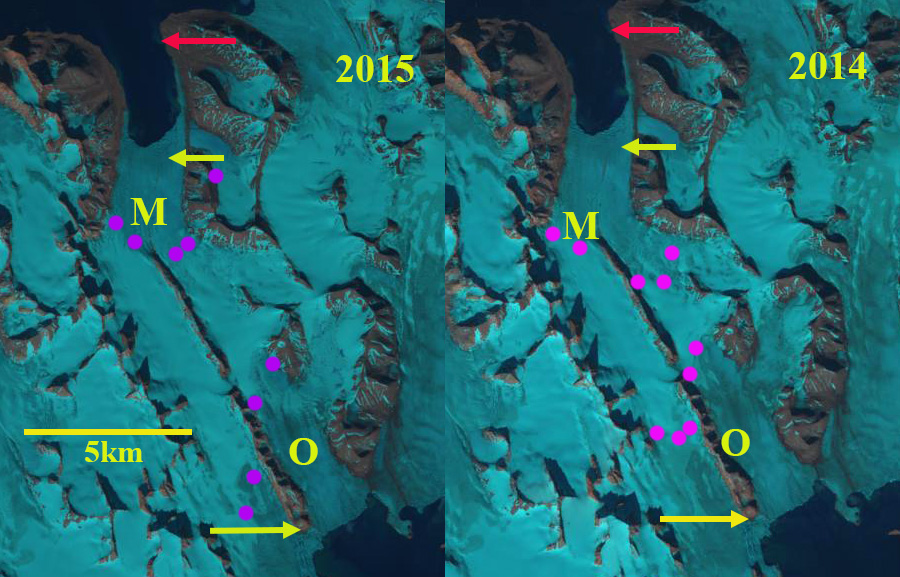
Mount Cayley-Powder Mountain Icecap in 2015 illustrating lack of retained snowcover in late August. Purple dots indicate snowline above Mount Cayley Glacier. MC=Mount Cayley Glacier, B=Brandywine Glacier

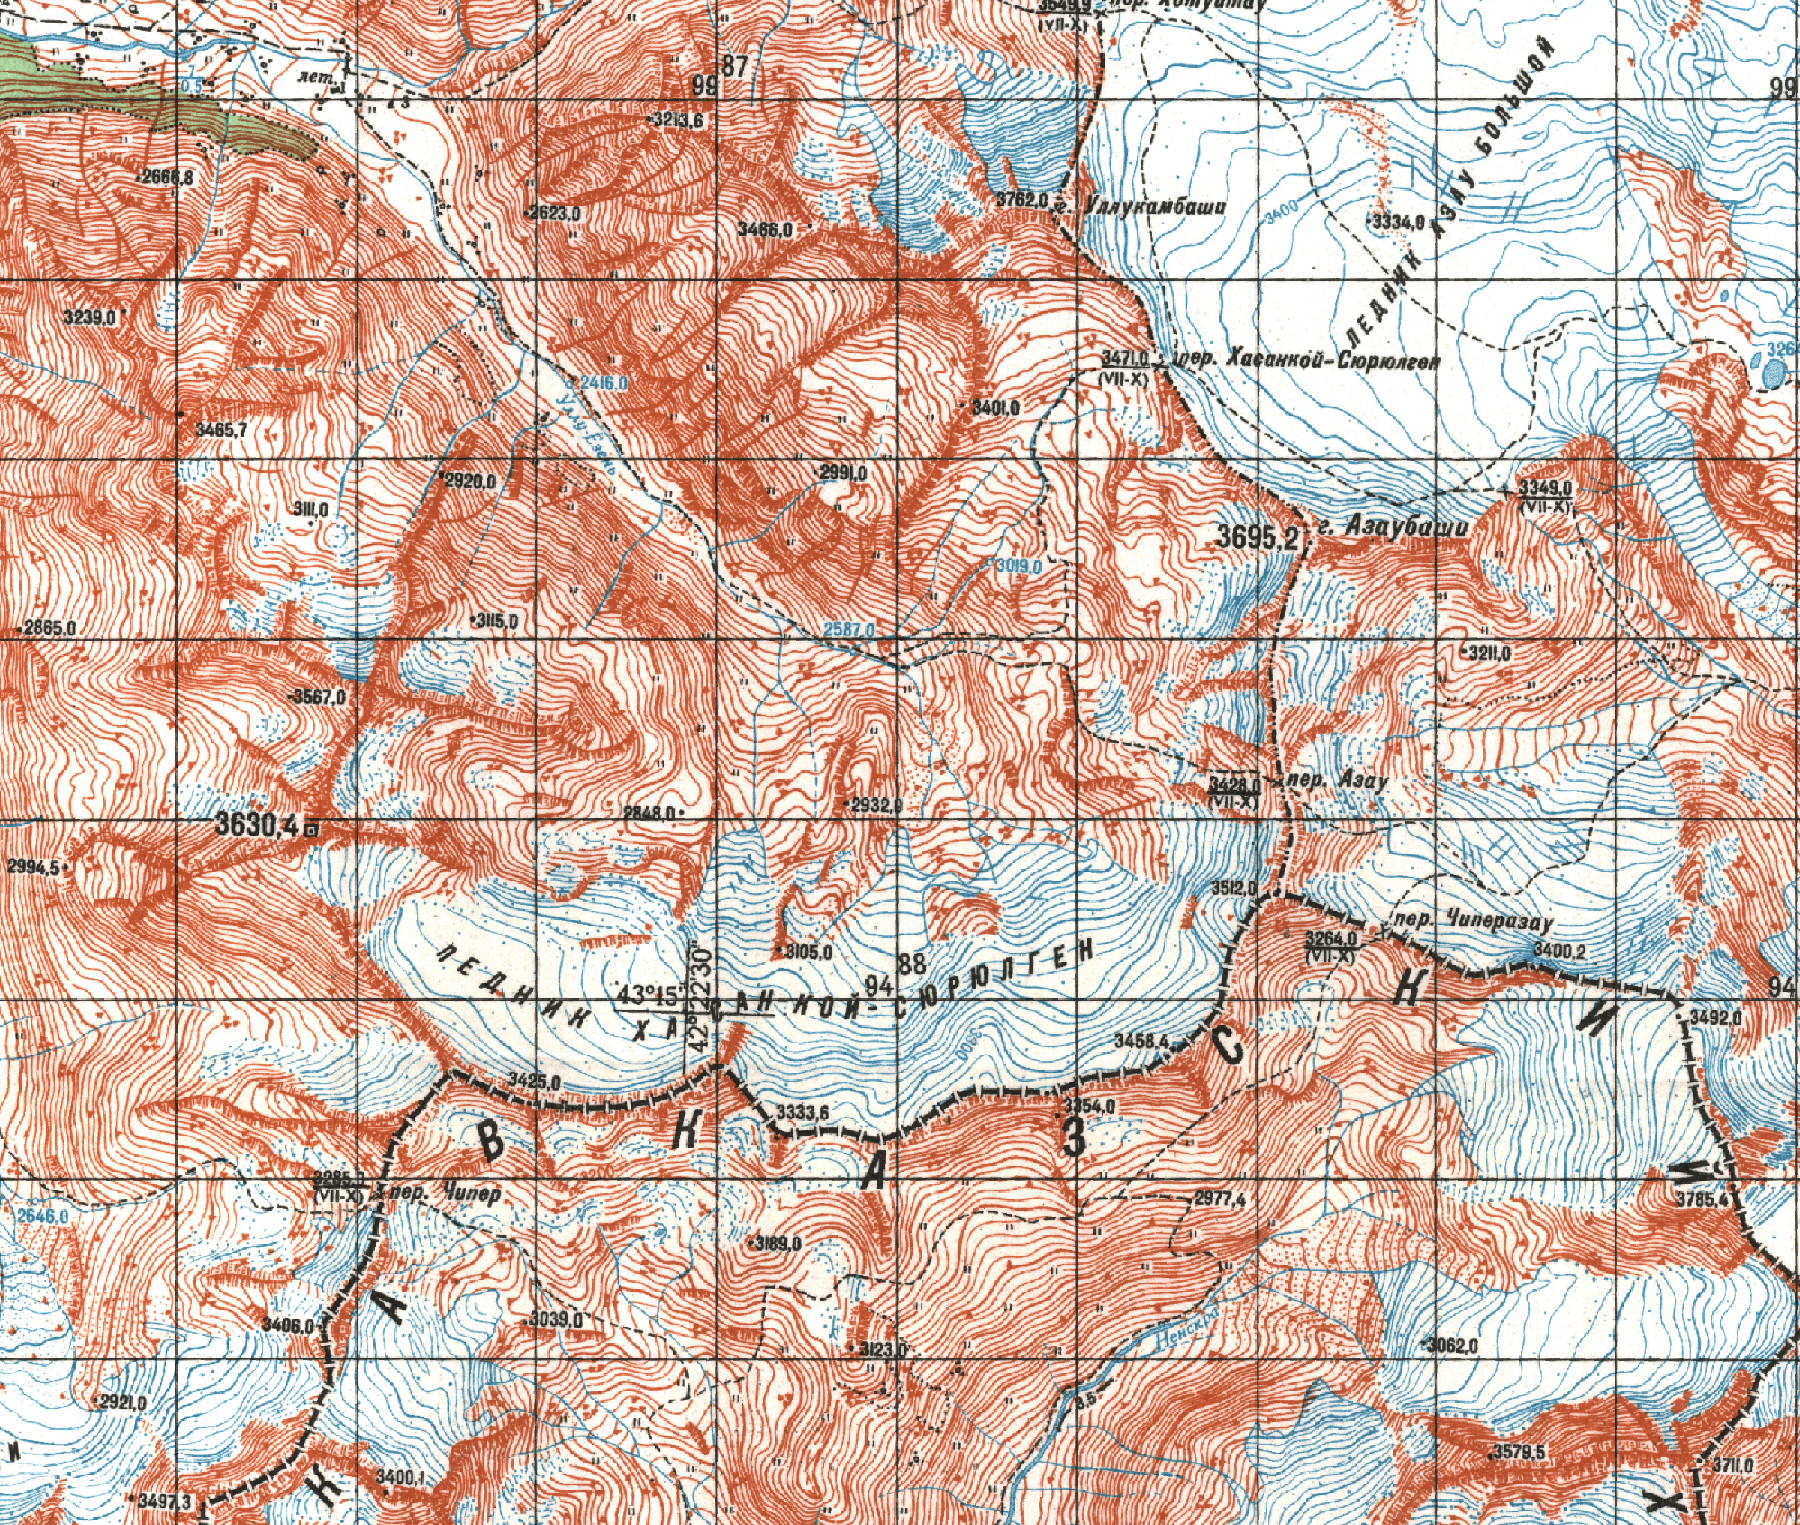
Canadian National Atlas map of region indicating flow direction of Mount Cayley and Brandywine Gacier.

Baqupu Glacier, China Merging Supraglacial Lakes 1998-2020

Baqupu Glacier in Landsat images from 1998 and 2020 indicating the expansion of supraglacial lakes in the terminus zone.  Purples dots indicate the snowline in October of each year.

Baqupu Glacier is in the Poiqu River watershed in southern Tibet, China.  The Poiqu River becomes the Bhote Koshi as it crosses into Nepal before joining the Sun Koshi River. The terminus of the glacier extending from 4500-4800 m is debris covered. An icefall extends from 4800-5300 m, above which the accumulation zone extends up to 5900 m. Shrestha et al (2010) examined the risk of a glacier lake outburst flood in the Sun Koshi basin from a Lumichimi Lake further north in the Poiqu Basin.  They identified the potential for damage to the  45 MW Bhote Koshi Hydropower Plant.  A  July 2016 GLOF in the basin did in fact severely damage the Bhote Koshi Hydropower Plant. In a 2020 ICIMOD report (Bajracharya et al 2020) inventory of glacial lakes and potentially dangerous ones in the Koshi, Gandaki and Karnali Basin’s was updated. In the Sun Koshi Basin they mapped 181 lakes with an area of over 0.02 km2 with four being potentially dangerous lakes. The developing Baqupu Lake is not listed as potentially dangerous.

In 1998 Baqupu Glacier features a 0.03 km2 network of small supraglacial ponds at its surface at ~4500 m.  The snowline is near the top of the icefall at 5200 m in October.  By 2000 some evident expansion of the ponds is evident.  The snowline in October is again near the top of the icefall at 5200 m.  By 2018 there are four substantial ponds that have nearly coalesced. In 2019 the ponds have coalesced into two lakes.  The snowline is just above the icefall at 5300 m.  In 2020 the supraglacial lake system has an area of 0.24 km2.  Average area of  glacial lakes in basin is 0.12 km2 (Bajracharya et al 2020). The snowline is above the icefall at ~5400 m.  The persistent equilibrium line above the icefall during this period is reducing the flux through the icefall to the debris covered tongue.  The tongue is increasingly stagnant and the thinning will lead to continued lake expansion into what will be a proglacial lake.  This expansion is similar to that on Rongbuk Glacier, while other nearby lakes have had expanding proglacial lakes, Drogpa Nagtsang Glacier and Yanong Glacier.

.Ya

Baqupu Glacier in Landsat images from 2000 and 2018 indicating the expansion of supraglacial lakes in the terminus zone.  Purples dots indicate the snowline in October of each year.

Baqupu Glacier in Digital Globe image from 2019. A=Accumulation zone; D=Debris cover, I=Icefall, S=Supraglacial lake. 

Tungnafellsjökull, Iceland Recession and Thinning 1999-2020

Tungnafellsjökull Ice Cap in 1999 and 2020 Landsat images indicating  terminus changes at three northern outlets, red arrows, and at four locations of bedrock exposure.

Tungnafellsjökull Ice Cap is a ~32km2 ice cap located between Vatnajökull and Hofsjökull.  Gunnlaugsson (2016) reported on the mass balance changes of the Tungnafellsjökull Ice Cap and found it had lost 20 of its volume and 16% of its area from 1960-2013.  The ice cap was essentially in balance from 1960-1986 and had a slight mass balance loss from 1986-1995.  Almost all of the loss has been since 1995. Belart et al (2020) report on losses from 14 smaller glacier in Iceland including Tungnafellsjökull and found signficant increase in mass loss from a near equilibrium 0.07 m/year from 1960-1994 to -1.20 m/year from 1995-2010. Here we examine the impact of the 25 years of sustained mass loss on Tungnafellsjökull using Landsat images.

In 1999 the transient snow line in August is at ~1200 m.  Point A,B and D indicate bedrock knobs amidst the ice cap and Point C a bedrock ridge that the ice cap flows over near Point C.  The three northern outlets terminate at the red arrows. From east to west they are Nordur Tungnafellsjökull, Innri Hagajökull and Fremri Hagajökull. In 2000 the transient snowline in August is again at ~1200 m. In 2014 the snowline was above 1500 m laving the ice cap without any retained snowpack from the previous winter.  The area of exposed firn encompasses 40% of the ice cap indicating the size of the accumulation zone in the several years prior to 2014. By 2016 the ice cap no longer flows over the ridge near Point C.  The transient snowline is at ~1400 m. In 2020 the transient snowline is at ~1350 m.  The bedrock knob at Point B is no longer surrounded by the ice cap. The bedrock at Point A and D have expanded.  The retreat from 1999-2020 is most significant at the three northern outlet glaciers, where Gunnlaugsson (2016)  indicated thinning was greatest. The retreat has been 200 m at Nordur Tungnafellsjökull,  600 m at Innri Hagajökull and  500 m at Fremri Hagajökull.

With an accumulation area covering approximately 40% of the ice cap, mass balance losses will continue and the ice cap will continue to retreat.  Retreat has been the consistent response of more than 90% of  Iceland glaciers since 2000 (Iceland Glaciological Society), such as at Norðurjökull.

Tungnafellsjökull Ice Cap in 2000 and 2016 Landsat images indicating  terminus changes at three northern outlets, red arrows, and at four locations of bedrock exposure.

Landsat image in August 2014 indicating the lack of retained snowcover.  The glacier surface is bare ice blue-gray and exposed firn indicated by the zone inside of the yellow dots.

Whiting River Headwater Glacier, British Columbia Separates into Four

Whiting River headwaters glaciers in 1984 and 2020 Landsat images.  The red arrows indicate 1984 terminus positions, yellow arrow the 2020 terminus locations, pink arrows locations of glacier detachment and purple dots the snowline.

In Northwest British Columbia on the northeast side of the Stikine Icefield the Whiting Rver drains a series of glaciers, many unnamed.  Here we are focusing on a pair of glaciers just west of Whiting Lake the headwater of Whiting River, which is on the east margin of the Landsat images from 1984-2020. Glacier mass loss in the region has been extensive leading to substantial glacier recession. Melkonian et al (2016) dentified a mass loss for glaciers for Stikine Icefield of ~0.6 m year from 2000-2013 which is driving retreat.

In 1984 the four branches of the westernmost glacier: west (W), main (M), south (S) and east (E) join together at ~900 m and the glacier flows downvalley to approximately 2 km to an elevation of 700 m.  The snowline is at 1250 m on the main branch. By 1999 the east branch has separated both from the south branch but also from the higher icefield at arrow #4. The snowline of the main branch is at 1300 m. By 2018 the west glacier has separated from the main branch at arrow #1, the south branch has also separated from the main branch near arrow #3. The four former tributaries are all separated.  The snowline in 2018 is the highest observed at 1550 m with a very limited accumulation area less than 10%, this year was a record high for the previous 70 years at nearby Taku Glacier. By 2020 the main branch has retreated 2300 m since 1984.  At arrow #2 there is a further detachment occurring from the east side accumulation are to the main branch. The eastern Whiting River Glacier has retreated 1250 m in this same period.

The retreat here is substantial in terms of the overall glacier length, and illustrates detachment as also noted for Farragut River, Alaska near the southwest corner of the Stikine Icefield. The retreat is less than that observed for the large outlet glaciers of Stikine Icefield such as South Sawyer, Dawes and Great Glacier. Whiting River is a remote and wild river that is host to six salmon species.


Whiting River headwaters glaciers in 1999 and 2018 Landsat images.  The red arrows indicate 1984 terminus positions, yellow arrow the 2020 terminus locations, pink arrows locations of glacier detachment and purple dots the snowline.

Franklin Glacier, British Columbia Tributary Detachment and Retreat 1987-2020

Franklin Glacier, British Columbia in 1987 and 2020 late summer Landsat images.  Red arrow is the 1987 terminus, yellow arrow the 2020 terminus, and purple dots the snowline.   Point 1 is the junction with Dauntless Glacier, Point 2 is the junction with an unnamed glacier, Point 3 is where Whitetip Glacier joins the glacier, and Point 4 is where Jubilee Glacier previously joined.

Franklin Glacier is one of the largest glaciers in the British Columbia Coast Range extending 24 m southwest from the summit region of Mount Waddington. VanLooy and Forster (2008) observed that of the outlet glaciers from the five large icefields in this region Franklin Glacier had the greatest retreat from 1927-1974 of 4100 m. Mood and Smith (2015) note this glacier has had many Holocene advances with the mid-19th to early 20th century advance reaching its maximum Holocene extent. Here we examine late summer Landsat images from 1987-2020 to identify the ongoing response of this glacier to climate change.

In 1987 the Dauntless Glacier (Point 1) is a tributary joining the glacier at 1300 m.  The Whitetip Glacier joins the main glacier adjacent to (Point 3) averages 1900 m. The glacier separates into two main tributaries at 1800 m, with the snowline in 1987 being at m.  In 1995 the glacier retreat from the 1987 position, red arrow is evident, the snowline is at  1950 m. By 2000 the glacier has retreated ~900 m in the previous 13 years, the snowline is at  1900 m. In 2014 Dauntless Glacier (Point 1) has separated from Franklin Glacier.  The snowline  in 2014 is at 2050 m.  In 2017 the snowline is at 2100 m.  The trimline on the north side of the main trunk of the glacier between Point 3 and Point 4 that illustrates thinning is quite apparent and illustrates reduced thinning with distance upglacier.  There is a low surface slope of the glacier upglacier of Point 4 to Point 1 which hints at the potential of a basin where a proglacial lake could form.  In 2019 the snowline is at 2100 m.  By 2020 the glacier has retreated 2700 m from the 1987 position, the rate of  ~120 m/year is an increase from the 20th century rate after 1927. The unnamed tributary at Point 2 is detached from the main glacier. The snowline is at 2050 m in early September, 2020 dropping to 1700 m at the end of September. The high persistent snowlines averaging ~2100 m since 2014 indicate continued mass loss and increased retreat, this is also higher than the 1900 m ELA reported by VanLooy and Forster (2008). 

Menounos et al (2018) identified a mass loss for glaciers in this region of ~0.5 m year from 2000-2018 which is driving retreat.  The retreat rate during this period is slightly less than the 130 m/year at Bridge Glacier,or Klinaklini Glacier, and slightly more than at Bishop Glacier and Klippi Glacier.  The retreat has been more consistent, likely due to the fact there has been no proglacial lake at the terminus during this period. Franklin Glacier begins at an elevation of 3300 m, this results in the glacier continuing to have a significant accumulation zone in todays climate.

Franklin Glacier, British Columbia in 1995 and 2017 late summer Landsat images.  Red arrow is the 1987 terminus, yellow arrow the 2020 terminus, and purple dots the snowline.   Point 1 is the junction with Dauntless Glacier, Point 2 is the junction with an unnamed glacier, Point 3 is where Whitetip Glacier joins the glacier, and Point 4 is where Jubilee Glacier previously joined.


Franklin Glacier, British Columbia in 2000 and 2014 late summer Landsat images.  Red arrow is the 1987 terminus, yellow arrow the 2020 terminus, and purple dots the snowline.   Point 1 is the junction with Dauntless Glacier, Point 2 is the junction with an unnamed glacier, Point 3 is where Whitetip Glacier joins the glacier, and Point 4 is where Jubilee Glacier previously joined.

Jiemayangzong Glacier, Tibet Retreat, Separation and Lake Expansion 1991-2020

Jiemayangzong Glacier in 1991 and 2020 Landsat images.  The red arrow is the 1991 terminus location, yellow arrow is the 2020 terminus location and purple dots mark the snowline. Point A indicates a tributary that has disconnected, while bedrock expanded at Point B. 

Jiemayangzong Glacier drains east from 6200 m peaks along the Nepal-China border. The glacier ends in a lake- Jiemayangzong Tso. Ren et al (2016)  identify this as the headwaters of  the Yarlung Tsangpo (Zangbo), which becomes the Brahmaputra River. The Zangmu hydropower project was completed on the river in 2015, it is a 510 MW project. Here we examine Landsat and Google Earth imagery from the 1991-2014 period. This is a region where Li et al (2011) noted that increasing temperature during the 1961-2008 period, especially at altitude, led to the retreat of glaciers and expansion of glacial lakes in this region. Liu et al (2011) noted that this glacier’s area has decreased 5%, retreating 768m ( 21 m/year), leading to lake expansion of ~64% during the 1974-2010 period.

In 1991 the lake was 1.1 km long, the snowline was at 5500 m near the elevation where the northern tributary joined at Point A.  In 1998 the snowline was at 5600 m, the glacier had not retreated appreciably.  In 2017 tributary A no longer is connected to the main glacier, the snowline is at 5600 m and the lake has expanded to a length of 1.9 km.  In 2020 the snowline in mid-September, with the melt season still going, is at  5700 m. The glacier has retreated 1000 m from 1991-202o a rate of  ~33 m/year. The lake is now 2.1 km long and has an area of  1.3 km2.  The glacier has a wide stable moraine belt (M) and does not pose a GLOF threat. Immediately downstream of the lake is a 10 km2 braided valley/wetland area (W) as well that would mitigate any potential flood hazard. This glaciers retreat is similar to many others draining north into Tibet from the Himalayan crest, Chako Glacier, West Ganglung Glacierand Asejiaguo Glacier

Jiemayangzong Glacier in 1998 and 2017 Landsat images.  The red arrow is the 1991 terminus location, yellow arrow is the 2020 terminus location and purple dots mark the snowline. Point A indicates a tributary that has disconnected, while bedrock expanded at Point B. 

Jieayangzong Glacier (JG) in 2015 Digital Globe image indicating the expanding proglacial lake (JL), moraine belt (M) and large wetland (W)

Ellsworth Glacier, Alaska Calves Major Iceberg in 2020

Ellsworth Glacier in Landsat images from 2018, 2019 and 2020. Red arrow is the 2016 terminus location, yellow arrow is the 2020 termins location, pink arrow is the rift, purple dots is the snowline, iceberg is Point A. Glacier retreated 2.4 km, main iceberg 1 km2

Ellsworth Glacier is a valley glacier draining south from Sargent Icefield on the Kenai Peninsula in Alaska. Along with the Excelsior Glacier it has been the longest glacier of the icefield.  The glacier retreated into an expanding proglacial lake in the early 20th century (USGS-Molnia, 2008). The terminus in 2000 was reported to be  3.5 to 4.5 km from the 1908 position (USGS-Molnia, 2008).  In a previous post we examined Landsat images from 1989-2016 to identify the changes including a 500 m retreat on the east margin of the lake and a 3400 m retreat on the west margin.  It as noted that “this rapid lake expansion indicates that the lower 3 km of the glacier occupies a basin that will become a lake and that the tongue is partially afloat and given the narrowing thinning tongue is poised for collapse”.  Here we document that collapse with Landsat images from 2016-2020.

In 2016 the snowline is at 975 m, the lake has now extended 3 km along the western edge.  The terminus is just east of  a former tributary glacier, red arrow. The number of icebergs in 2016 indicates that significant ice calved during that year. The retreat of the eastern margin has been 500 m, with a 3.4 km retreat on the west margin.  The main tongue in the lower two kilometers is 800 m wide versus 1200 m wide in 1989.  In 2018 the snowline is at 1100 m, the terminus remains just west of a former tributary glacier.  There is a rift forming near the pink arrow, where an iceberg will eventually detach (A).  In late June of 2019 the rift has further developed, but the iceberg to be (A) has not detached.  By mid-August of 2019 the rift has nearly led to detachment of an iceberg (A), the snowline is at 1075 m.  In June of 2020 the iceberg has detached and there is a considerable melange of ice between the iceberg (A) and the main terminus.  By Sept. 11, 2020 the iceberg remains in much the same position.

The glacier has retreated 2.4 km since 2018, and now terminates at yellow arrow 1 km downglacier of the junction of the two main tributaries.  The iceberg has maintained an area of ~1 km2.  The snowline in 2020 is at 1125 m indicating another of mass balance loss for the glacier. The lake is now 7 km long and the lake area is ~7.5 kmup from 5 km2 in 2016. The retreat of this glacier paralells that of its neighbor Excelsior Glacier that retreated 4.7 km from 1994-2018. This continues to be a developing lake district including Grewingk Glacier.

Ellsworth Glacier in Landsat images from 2016-2020. Red arrow is the 2016 terminus location, yellow arrow is the 2020 termins location, pink arrow is the rift, purple dots is the snowline, iceberg is Point A.

Ellsworth Glacier in 2019. Point A is future iceberg is, yellow arrow is 2020 terminus locations and pink arrow is rift.  Image from Johnstone Adventure Lodge.

Leningradskiy Ice Cap Snowcover Vanishes in 2020 More Thinning, Svernaya Zemlya

Leningradskiy Ice Cap  north to south strip in 2000 and 2020 Landsat images illustrating thinning leading to separation of parts of the ice cap at Point 1 and 4 and expansion of bedrock leading to merging bedrock regions at Point 1 and 2. R=snow/firnpack saturated with meltwater and consequent potential refreezing. S=superimposed ice development from surface refreezing.

Leningradskiy Ice Cap is oriented east to west across Bolshevik Island in the Svernaya Zemlya Archipelago of the Russian Arctic. Annual snowfall on the ice caps is limited ~0.4-0.5 m (Sharov and Tyukevina, 2010).  During the brief summer melt season from June-late August, much of the melt is refrozen within the snow/firnpack or as superimposed ice (Bassford et al 2006).  The low snowpack makes the glaciers vulnerable to warm summer conditions. The summer of 2020 has been remarkably warm in the Russian High Arctic leading to high melt rates and surface mass balance loss as shown by Xavier Fettweise MAR model. Here we examine Landsat images from 2000 to 2020 to identify a pattern of thinning on the northern margin of the ice cap.

In 2000 the glacier has a well established glacier runoff stream at yellow arrow. Point 1 is a nunatak amidst a peripheral segment of the ice cap. Point 2 is an area of bedrock separated by a narrow section of ice cap from adjacent bedrock. Point 3 and 4 are locations where the ice cap is thick enough to spillover in to an adjacent basin.  There is little visible snowpack on the ice cap, but a significant area of azure blue indicates snow/firnpack (R) that is saturated with meltwater, some of which will refreeze. There are zones of superimposed ice development(S)  where meltwater is refreezing on top of the cold surface ice. In 2018 there an area of unsaturated snowpack, white area, and saturated snow/firnpack (R) azure blue and areas of superimposed ice development (S).

On August 3, 2020 the ice cap has lost its snowcover with limited areas of firn, limiting the ability of meltwater to refreeze except on the surface as superimposed ice (S).  The lack of snow/firnpack at the surface will lead to a more negative balance as meltwater is not retained. At Point 1 this peripheral glacier area has been cutoff from the main ice cap as thinning has exposed more of the encircling ridge.  At Point 2 bedrock areas have expanded and merged together. At Point 3 there is some spillover still but thinning has led to a reduction and consequent retreat and thinning of this terminus. At Point 4 the ice cap no longer spillovers into the adjacent basin due to thinning. Each location indicates significant thinning that is hard to recover given the slow flow and limited accumulation on these glaciers. On Aug. 22 2020 the surface of the ice cap is frozen, leading to a whiter surface.

The lack of retained snowcover in 2020 was also seen at Hochstetter Ice Cap in Franz Josef Land.  In both cases the high summer temperatures led to more meltwater, and the lack of snowpack to retain leads to more escaping the system. Bassford et al (2006) describe this process “Intense surface melting in the accumulation zone during warm summers prevents the buildup of a thick firn layer by rapid transformation of firn to ice through refreezing and by removing
mass through runoff.”

Leningradskiy Ice Cap  north to south strip in 2018 and 2020 Landsat images illustrating changing distribution of melting (R) and superimposed ice development (S)

Khanasankoi Glacier, Russia Separation and Full Snowcover Loss

Khasankoi Glacier in 1985, 1998, 2013 and 2020 Landsat imagery with Point 1-4 indicating locations where bedrock expansion is occurring with Point 1 and 3 separating the glacier into three parts. Note complete lack of snowcover on 8-26-2020.

Khasnakoi Glacier is a north facing slope glacier just south of Mount Elbrus that drains into the Kuban River. The Greater Caucasus contain approximately 2000 glaciers with a total area of ~1200 km2(Tielidze and Wheate, 2018).  Significant positive trends in annual and summer temperature from 1960-2014 have driven large overall glacier area loss, 0.53% per year, leading to the loss of over 300 glaciers (Tielidze and Wheate, 2018).  Here we examine Landsat images from 1985-2020 to identify key changes of the glacier.

In 1985 the glacier extended 4.6 km from east to west without interruption and featured three primary termini.  The glacier in 1985 has an accumulation area ratio (percent snowcovered) of 60%.  By 1998 there is limited retreat the glacier is still once continuous glacier and the accumulation area ratio is 40. By 2013 at Point 1 a bedrock ridge is emerging. At Point 2 a few outcrops of rock are evident emerging from under the thinning glacier.  The same is the case at Point 4. At Point 5 a new lake has developed at the margin.  The accumulation area ratio in 2013 is 25%.  In 2020 the accumulation area ratio is 0% snowcover.  A pair of ridges now bisect the glacier at Point 1 and Point 3. At Point 2 the rock outcrop has expanded into one large region.  At Point 4 a bedrock area has expanded at the head of the glacier.  At Point 5 retreat has left the newly formed lake of less than a decade ago isolated from the glacier.  This is not the first year of poor snowcover.

The mapped boundary of the glacier below provided by Levan Tieldze illustrates the glacier boundary in 1960, 1986 and 2014, illustrating a 29% decline in area. The loss of snowcover in 2020 is not the first summer when this has been observed in the Caucasus in 2017 Gora Gvandra did not retain snowcover. For Dzhikiugankez Glacier on the slopes of Mount Elbrus there has been a persistent low snowcover by end of summer since 2013. Tieldze (2019) explained the connection of climate to receding glaciers in the Caucasus using Tviberi Glacier in Georgia as an example.

Image from Levan Tieldze indicating the extent of the glacier in 1960 (red), 1986 (black) and 2014 (blue) on a 2016 SPOT image. There is still some connection above Point 1.

Map of the region from when Khasankoi Glacier was contiguous.

North Cascade Glacier Climate Project Observations 2020, 37th Field Season

The North Cascade Glacier Climate Project 2020 field season was our 37th consecutive year of glacier observations.  The field team consisted of Cal Waichler, Mariama Dryak, Jill Pelto and Mauri Pelto.  Each team member has studied glaciers on more than one continent and is passionate about science communication, using either art, videography or writing.

Mauri Pelto, Jill Pelto, Cal Waichler and Mariama Dryak from left to right on Easton Glacier the 2020 field team (Jill Pelto Photograph).

At Columbia Glacier the field team  was joined by Michelle Tanz a Wlderness Stewardship Fellow for the National Forest Service.  The initial observation was that the 2 km bushwhack around Blanca Lake has gotten much brushier as the alpine meadow becomes more sub-alpine. Columbia Glacier is a low elevation avalanche fed glacier that developed a new lake at its terminus a decade ago that continues to expand.  The east side of the glacier has been thinning much faster than the west side altering the very shape of the glacier.  Observed snowpack in 2020 was below average except for on the slopes of the main west side avalanche fans. The upper basin at 1550-1650 m averaged 2.2 m of snowpack at the 70 probing locations, which is 70% of normal.  This snowpack will not survive the melt season, only snowpack in the main avalanche fans will remain. Terminus retreat has been 217 m since our first observation in 1984.

Lower Curtis Glacier is fed by avalanches from the slopes of Mt. Shuskan.  We were joined in the field by Tom Hammond for the 17th consecutive year and artist Claire Giordano.  There was a similar pattern to Columbia Glacier in that snowpack across most of the glacier was below average, while the primary avalanche fan on the east side had above average snowpack.  The avalanche fans on the central headwall of the glacier fed from the Upper Curtis Glacier continue to thin rapdily, as avalanching has declined.  The terminus slope which had been a daunting 42 degrees in 2015 is now 34 degrees. For the sixteenth consecutive year we had at least one artist in the field, below are field sketches from Cal Waichler and Jill Pelto and a painting from Claire Giordano.  We will be combining the science findings and art in forthcoming articles on Lower Curtis and Easton Glacier.

Claire Giordano working on painting of Lower Curits Glacier and Mt. Shusksan (Mariama Dryak Photograph).

Jill Pelto completes sketch, while sitting on ice chunk, of Easton Glacier icefall (Mariama Dryak Photograph).

Cal Waichler annotated story board style sketches both capture and explain the scene at Columbia Glacier (Mariama Dryak Photograph).

Rainbow Glacier has a terminus that is largely buried by avalanches, but is now is close to detaching from the main valley glacier.  Snowpack at 1700 m averaged 2.4 m which is 75% of average. The saddle with Mazama glacier at 2000-2100 m averaged 3.9 m, which is 85% of normal. Subglacial bedrock knobs continue to become more prominent in expanding crevassing above and slope below the slope change, as the glacier thins.

Sholes Glacier had the highest percentage of surface blue ice of the glaciers observed.  Snowpack had been reduced from at a rate of 8 cm/day during the first week of August, a relatively warm period. A snow cave at the terminus could be entered from a terminus crevasse that was 50 m long, 10 m wide and 2-5 m high.  This is indicative of a relatively stagnant rapidly retreating terminus. From 2014-2020 the glacier has retreated 80 m, which is equivalent to the retreat from 1990-2014. Glacier runoff continues to be monitored just below the glacier by the Nooksack Tribe, while we provide continued rating curve development.  Runoff during early August was averaging 0.25 m3/sec.

On Easton Glacier the terminus slope was the gentlest we had seen in our 31 years of consecutive observations.  The terminus has retreated 430 m in this period. The significant thinning in the last few years had both reduced crevassing in the lowest icefall, but had reduced crevasse depth.  Jill Pelto has been observing the crevasses depth in all the open crevasses in this icefall over the last decade.  The biggest change has been from 2018-2020 with average depth being reduced by 40%. Snowpack on the bench at 2000 m averaged 2.4 m at the 45 observation sites, which is 75% of normal.  The snowpack remained below normal at 2200 m, before a sharp increase to above normal snowpack averageing 5.1 m in 14 crevasse observations at ~2500 m. At this same elevation retained snowpack, now firn from previous years averaged 2.25 m. Based on the storm stratigraphy one significant difference was the result of an atmospheric river precipitation event of 12+ cm of precipitation from 1/31-2/2, that led to a snow depth and snow water equivalent decline at the Middle Fork Nooksack Snotel at 1550 m, while above 2300 m this all fell as snow.  The freezing levels were above 2000 m for much of the event.  The better high elevation snowpack will help Easton Glacier’s mass balance in 2020.

Easton Camp from adjacent to 1990 terminus position (Jill Pelto Photograph).

Crevasse stratigraphy at 2500 m on Easton Glacier indicates an average of 5.1 m of 2020 snowpack in crevasses and 2.25 m for previous annual layers from the 2016-2019 period (Mauri Pelto and Jill Pelto Photographs)


Hochstetter Ice Cap Loses All Snowcover in 2020, Franz Josef Land

Landsat images from 1999, 2015 and 2020 of Hochstetter ice Cap.  Snowcover=100% in 1999, 80% in 2015 and 0% in 2020.

Hochstetter Ice Cap covers most of Hocstetter Island (Ostrov Khokhshtettera) in the the southern part of the Franz Josef Land archipelago.  Situated ~1000 km from the North Pole this area is known for its white ice caps and cold summer temperature averaging 2 C.  The lack of sea ice in the region is exposing the marine margins of the ice caps in Franz Josef Land to enhanced melting.  This has and will lead to more coastal changes and island separations (Ziaja and Ostafin, 2019), such as occurred on Hall and Littow Island. Here we examine Landsat imagery from 1999-2020 to reveal changing snowcover. The summer of 2020 featured record low sea ice in the Barents Sea by mid July (NSIDC, 2020),  due to the Siberian heat wave this past spring which led to early ice retreat along the Russian coast.

In early August 1999 the island is mostly surrounded by sea ice and the ice cap is fully snowcovered. In July 2000 and 2002 the situation is similar with insignificant exposed ice. At the end of July 2015 the island is mostly surrounded by sea ice, while the island is largely snowcovered there are meltwater saturated blue areas on the ice cap.  On August 2, 2020 there is no snowcover on the ice cap and very limited sea ice around the island.  Three weeks later on August 22, 2020 the ice cap remains bare of snowcover and is hardly the bright white that the area is known for.  This period of extensive ice exposure leads to significant ablation of the exposed darker and older glacier ice leading to a large mass balance loss and glacier thinning.

Hochstetter Ice Cap in  early August 2020 has lost all of its snowcover and has little sea ice in the vicinity. The blue coloration to the ice cap indicates meltwater is present.

Landsat images from 2002 and 2020 of Hochstetter ice Cap.  Snowcover=100% in 2000 and 0% in 2020.

Mendeleevbreen/Øydebreen, Svalbard Terminus Retreat and Snowline Rise

Øydebreen (O) and Mendeleevbreen (M) in 2002 and 2020 Landsat images.  Red arrow is the 1990/2002 terminus, yellow arrow the 2020 terminus and purple dots the snowline.

Øydebreen and Mendeleevbreen are a pair of glaciers in Sørkapp Land, Svalbard that a share a divide. Mendeleevbreen flows north to Hornsund and Øydebreen south to Isbutka, meeting at the ice divide at 300 m.  The Institute of Geophysics Polish Academy have maintained a Polish Research Station in Hornsund since 1957. The 1984 map, from the University of Silesia, of the glaciers and geomorphology document the extent of the glaciers in 1983 in the region indicating Mendeleevbreen being connected beyond the northern end of its fjord to its neighbor to the east Svalisbreen.  A detailed examination by Blaszczyk, Jania and Kolondra (2013) reported the total area of the glacier cover lost in Hornsund Fjord area from 1899–2010 was approximately 172 km2. The average glacier area retreat increased from a mean of 1.6 km2/year to 3 km2/year since 2000.  Pelto (2017) reported significant retreat of all 10 major tidewater glaciers of Hornsund Fjord. In the August 4, 2020 image it is apparent that one could walk from the terminus of the Mendeleevbreen over the divide to the terminus of the Øydebreen without encountering snow.

In 1990 the distance from the front of Mendeleevbreen to Øydebreen was ~17.5 km. Øydebreen terminated just east of Fallknatten, a rib of rock separating the glacier from Vasilievbreen. Mendeleevbreen terminates adjacent to a tributary from the east Signybreen. The snowline in the 1990 August Landsat image is at 200 m.  By 2002 Øydebreen has retreated substantially across its entire front.  Jania et al (2006) noted a 400 m advance of  the center of Mendeleevbreen from 1990 to 2004.  The east margin retreated and the west margin was stable during this period, with the overall front position advancing ~100 m. The glacier is known to have surged in the past, and this could have been a small surge event.  The snowline in the August 2002 Landsat image is at 225 m.  By 2014 the distance from the front of Mendeleevbreen to Øydebreen was 13.5 km.  The Mendeleevbreen terminus had retreated to the eastern tributary of Grobreen. The snowline in August 2014 is at ~225 m.  The snowline in August 2015 is at ~200 m.

By August 2020 the distance from the front of Mendeleevbreen to Øydebreen was 12.5 km, a combined retreat of 5 km since 1990.  Øydebreen is now poised to retreat into its own fjord. The snowline at the start of August 2020 is above the 300-m ice divide, leaving the possibility that no snow at all will remain by the end of the melt season on either glacier.  It was noted in early July how high the snowline was on Svalbard glaciers.  The retreat of these two glaciers fits the pattern of Svalisbreen, Samrarinbreen and Vasilievbreen.  Unfortunately the high snowlines of 2020 indicate large mass losses will occur that will only accentuate ice loss.

Øydebreen (O) and Mendeleevbreen (M) in 1990 and 2020 Landsat images.  Red arrow is the 1990/2002 terminus, yellow arrow the 2020 terminus and purple dots the snowline.

Øydebreen (O) and Mendeleevbreen (M) in 2014 and 2015 Landsat images.  Red arrow is the 1990/2002 terminus, yellow arrow the 2020 terminus and purple dots the snowline.

TopoSvalbard map of the region with ice flow indicated by blue arrows.