NORTH CASCADE GLACIER CLIMATE PROJECT 2020-37th Annual Field Program

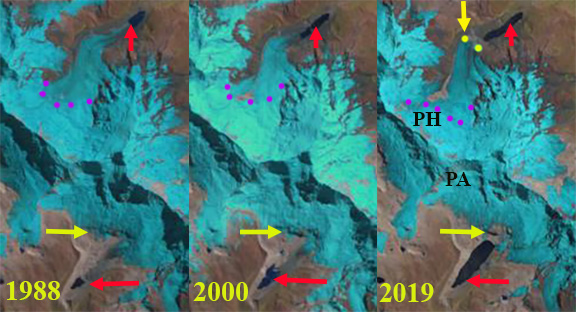
Field season images from 2019 indicating crevasse stratigraphy, annotated by Clara Deck.

Director: Mauri S. Pelto, mspelto@nichols.edu-Nichols College

Field Artist & Scientist: Jill Pelto, pelto.jill@gmail.com

Who we are? NCGCP was founded in 1983 to identify the response of North Cascade glaciers to regional climate change, particularly changes in mass balance, glacier runoff and terminus behavior.   NCGCP is a field project that has a broader interdisciplinary scope and examines more glaciers than any other program in North America.  It does so cost effectively relying on no permanent camps, helicopter support or salaries for the director. The field season includes no days off and each day is spent completing measurements on glaciers.  The focus is on glacier mapping, mass balance measurement, terminus observations and glacier runoff monitoring.  This program monitors two of the World Glacier Monitoring Service’s reference glaciers. There are ~45 such glaciers in the world with 30 years of continuous measurements. We complete mass balance and terminus observations on Columbia, Daniels, Easton, Ice Worm, Lower Curtis, Lynch, Rainbow and Sholes Glacier with runoff measurements below Sholes and Ice Worm.

Why study glaciers in the North Cascades? Glaciers are one of the world’s best climate monitors and are a critical water resource to many populated glaciated regions. This is particularly true in the North Cascades where 700 glaciers yield 200 billion gallons of summer runoff and glaciers have lost 30 % of their area in the last century.

Field Team 2020:

Jill Pelto is an artist and scientist from New England who grew up loving winter sports and trips to the mountains. She incorporates scientific research and data into paintings and prints to communicate environmental changes. Her multi-disciplinary work weaves visual narratives that reveal the reality of human impacts on this planet, as earlier in July was illustrated on the cover of TIME. She completed both her B.A. degrees in Studio Art and Earth and Climate Sciences and her M.S. focused on studying the stability of the Antarctic Ice Sheet at the University of Maine, spending two field seasons at a remote camp in the southern Transantarctic Mountains. Jill will be joining the project for her 12th field season. She is excited about continuing to document the change in North Cascade glaciers that she has witnessed each of the last ten years — through science and art.

Mauri Pelto has directed the project since its founding in 1984, spending more than 700 nights camped out adjacent to these glaciers. He is the United States representative to the World Glacier Monitoring Service, author of the AGU blog “From a Glacier’s Perspective”, and on the Science Advisory Board for NASA’s Earth Observatory.  His primary job is Dean of Academic Affairs at Nichols College, where he has been a professor since 1989.

Cal Waichler is an environmental science major at Colby College in Maine and is from Winthrop, WA. She looks to bridge the gap between science and the public by creating impactful, accurate climate art and storytelling. This summer’s research goal is to generate building blocks to contextualize her work within two fields: glacier science and climate communication.

Mariama Dryak (she/her) is an earth scientist, science communicator/writer and an advocate for action on creating solutions to the global climate crisis. Mariama is the creator and editor of an environmental advocacy blog Let’s Do Something BIG. and the ‘we persist.’ podcast, which shares the stories of underrepresented people in the earth, ocean and environmental sciences. Mariama received her Master’s from the University of Maine in 2019 in Earth and Climate Science, during which she drew connections between inferred ocean conditions and glacier change along the Antarctic Peninsula. Mariama can most often be found chatting science, going on adventures or getting muddy whilst doing something outdoors.

Columbia Glacier terminus with the 2018 field team.

 Field Partners 2020

Victoria Jarvis and Michelle Tanz are Wilderness Stewardship Fellows who will be gathering information about the Henry M Jackson Wilderness including the glacier. They are looking to understand the Columbia Glacier and our research within the scope of the 5 qualities of wilderness character (untrammeled, undeveloped, natural, solitude and primitive rec, other). They will then be able to incorporate our long-term monitoring efforts into their wilderness character narrative– a synthesized agency document providing insight about the wilderness.

Alia Khan, Western Washington University Cryosphere Studies and Aquatic Biochemistry Lab:

The research team including grad students Molly Peek and Shannon Healy focus on environmental chemistry in the cryosphere, including black carbon and snow algae to document global change of glacier and snow melt in mountainous and polar regions.

Tom Hammond, North Cascade Conservation Council,Will be joining us for the 17th year leveraging his experience with our for understanding the ongoing impact of climate change and our stewardship on the region.

Nooksack Indian Tribe, for the 9th consecutive year we will be conducting field work aimed at providing field validation and streamflow calibration data below Sholes Glacier for the ongoing work of the tribe.

Measuring flow below Sholes Glacier

Dzhikiugankez Glacier, Russia Persistent Limited Retained Snowpack 2013-2020

Dzhikiugankez Glacier in 1985 and 2020 Landsat images with the snowline shown by purple dots. A tributary at Point A has disappeared and tributary at the red arrow has separated.  Thinning and marginal retreat is emphasized by blue and green arrows.

Dzhikiugankez Glacier (Frozen Lake) is a large glacier on the northeast side of Mount Elbrus, Caucasus Range. The primary portion of the glacier indicated in the map of the region does not extend to the upper mountain, the adjoining glacier extending to the submit is the Kynchyr Syrt Glacier. The glacier is 5 km long extending from ~4000 m to 3200 m.  Shahgedanova et al (2014) examined changes of Elbrus glaciers from 1999-2012 and found a 5% area loss in this short period, with accelerattion retreat from the 1987-2000 period.  Of the glaciers on Elbrus over 10 km2 in area Dzhikiugankez Glacier experienced a high rate of reduction, the relative loss was 27% between 1960 and 2014 (Tielidze and Wheate, 2018). This is driven by a persistent lack of retained snowcover, here we examine Landsat imagery to illustrate that. This post is inspired by the frequent imagery of Caucasus glacier change posted on Twitter by @LevanTielidze.

In 1985 the glacier connects beneath the subsidiary rock peak at the red arrow, a tongue of ice extends on the east side of the rock rib at the yellow arrow, Point A. The transient snow line is at 3550 m and less than 30% of the glacier is snowcovered. The medial moraine at the blue arrow is just beyond the glacier terminus, green arrow. In 2013 a wide zone of bare rock extends up to the subsidiary peak at the red arrow and the glacier has separated from the western tributary.  The medial moraine, blue arrow is exposed all the way to its origin near the red arrow.  In 2013 the tongue of ice at Point A, is gone.  This glacier is retreating faster on its lateral margins than at the terminus, a 20% reduction between red and yellow arrows from 1985 to 2013. In 2013 the snowline is at 3600 m, with several weeks of the melt season left.

In 2018 the transient snowline near the end of the melt season is at 3900 m, leaving less than 10% of the glacier snowcovered. In 2019 the transient snowline is at 3800 m near the end of the melt season leaving 10-15% of the glacier snowcovered. In mid-July 2020 the transient snowline is already at 3600 m with at least 6 weeks left in the melt season. It is evident from the Landsat images from the 2013 to 2020 period that  Dzhikiugankez Glacier consistently has the lowest percent of overall snowcover on Elbrus and too small of an accumulation zone to persist. The limited snowcover and glacier separation in also seen at Azaubashi Glacier  on Mount Elbrus


Dzhikiugankez Glacier in 2013, 2018 and 2019 Landsat images with the snowline shown by purple dots. 

Map of northeastern side of Mount Elbrus, summit on left. Dzhikiugankez Glacier (Dzhikaugenkjoz) is outlined in black.

Oscar Lake Expansion Carves Away at Brady Glacier, Alaska

Oscar Lake growth on the east margin of Brady Glacier in Landsat images from 2000-2020. Point A indicates glacier tongue that becomes iceberg. Blue arrows indicate flow direction.

Brady Glacier,  is a large Alaskan tidewater glacier, in the Glacier Bay region that is beginning a period of substantial retreat Pelto et al (2013).   The glacier has a number of expanding lakes that are expanding as the secondary termini feeding them retreat. The lakes Trick, North Deception, Dixon, Bearhole, Spur, Oscar, and Abyss continue to evolve. Pelto et al (2013) noted that the end of season observed transient snowline averaged 725 m from 2003-2011, well above the 600 m that represents the equilibrium snowline elevation.In 2018 and 2019 the melt season has been intense for the Brady Glacier in Alaska reaching 1100-1200 m both years. Here we examine the expansion of Oscar Lake from 2000-2020.

In 2000 the lake was just developing and had an area of ~0.5 km2.  In 2004 the lake had expanded to ~0.8 km2.  In 2006 the glacier was 1.0 km2 in area, Capps et al (2010) reported the maximum lake depth measured with a remote control boat at 140 m near the ice front.  The glacier still reaches the east margin of the basin separating the lake into a northern and southern section. They further noted that nearby Abyss Lake had begun to drain subglacially into Oscar Lake. In 2010 Oscar Lake had doubled since 2006 to an area of 2 km2.  In 2004 the glacier tongue that extends to the east margin of the lake is still in place, but is too narrow to be stable. In 2016, 2018 and 2019 very high snowlines led to extensive melt and glacier thinning, reported in 2016 (Pelto, 2016), and on nearby Taku Glacier setting a record (Pelto, 2019).  In 2018 and 2019 a debris covered tongue, Point A, remained attached to the main glacier.  In July 2020 this tongue has broken free.  The lake now has an area of 4 km2.  The high snowline in 2019 exposed many firn layers from previous years.  These layers were the retained snowcovered from previous winters, that had survived summer and been buried by the next years snowfall.  The collective melt of the recent years is exposing the layers.

Oscar Lake growth on the east margin of Brady Glacier in Landsat images from 2000-2010 Blue arrows indicate flow direction. There is a southern and northern part of the lake separated by the glacier tongue during this period.

Oscar Lake in 2014 in a Digital Globe image. Note unstable tongue exteding to east end of basin.

Brady Glacier in 98/2019 Landsat image indicating snowline at 1100-1200 m with purple dots. S=Spur Lake, O=Oscar Lake, A=Abyss Lake,  F=Firn lines, D=Dixon Lake, B=Bearhole Lake, N=North Deception Lake, T=Trick Lake


Firn layers on upper Brady Glacier in 9/8/2019 Landsat image.


Harrietbreen, Svalbard Retreats From Coast Loses Accumulation Zone

Harrietbreen (H) and Kjerulfbreen (K) in 1990 and 2020 Landsat images.  Red arrow 1990 terminus, yellow arrow 2020 terminus and purple dots the snowline.  No snow on Harrietbreen in early July 2020. Point 1 and 2 are divides between glaciers.

Harrietbreen is small glacier that feeds into Trygghamna a small fjord the is part of the large Isfjorden on the east coast of Svalbard, mergin with Kjerulfbreen near the terminus.  The glacier extends from 400 m to tidewater in 1990. Here we examine the changes in both terminus position and accumulation zone in Landsat images from 1990-2020. Nuth et al (2013) determined that the glacier area over the entire archipelago has decreased by an average of 80 km2 per year over the past 30 years, a 7% reduction, this loss is ongoing (NASA, 2018).

In 1990 Harrietbreen (H) and Kjerulfbreen (K) merge 1.5 km above the terminus at Point 1 and both reach tidewater.  The snowline is at 200 m and the divide at Point 2 with Protektorbreen to the south is wide and partly snowcovered.  In 1993 the snowline in mid-July is at 150 m.  Kjerulfbreen has retreated from tidewater. In 2018 and 2019 by the end of August Harrietbreen has lost all of its snowcover nd Kjerulfbreen is now 700 m from the coastline.

On July 8, 2020 the warm early summer temperatures have already melted all the winter snowcover from Harrietbreen.  With two months left in the melt season this will result in substantial mass loss. Harrietbreen has retreated 500 m  during the 1990-2020 period and is no longer a tidewater glacier. The connection with Kjerulfbreen at Point 1 has been reduced to 0.6 km.  The connection with Protektorbreen at Point 2 has thinned substantially too.  The persistent lack of retained snowcover indicates a glacier without a consistent accumulation zone which means Harrietbreen cannot survive (Pelto, 2010).

The retreat here is less significant than at nearby Austre Torelbreenor at Orsabreen, but the prognosis for survival much worse.

Harrietbreen (H) and Kjerulfbreen (K) in 1993 and 2019 Landsat images.  Red arrow 1990 terminus, yellow arrow 2020 terminus and purple dots the snowline.  No snow retained in 2019. Point 1 and 2 are divides between glaciers.

TopoSvalbard map of the region, the 250 m contour is indicated.

Global Glacier Change Bulletin 3 (WGMS) Reports Increasing Mass Balance Losses

Figure 1. Regionalized mean annual mass balance of WGMS reference glaciers 1980-2018, with 2019 being a mean of reference glaciers.

Glaciers have been studied as sensitive indicators of climate for more than a century and are now experiencing a historically unprecedented decline (Zemp et al, 2015).  Glacier fluctuations in terminus position, mass balance and area are recognized as one of the most reliable indicators of climate change. This led to glacier mass balance being recognized during the International Geophysical Year (IGY) in 1957 as a key focus area for developing long term data sets and the need to establish an international data repository.

Today this data reporting system is managed by the World Glacier Monitoring Service (WGMS). WGMS annually collects standardized observations on changes in mass, volume, area and length of glaciers with time, and additionally collecting statistical information on the distribution of glaciers from inventories.  WGMS just published their third Global Glacier Change Bulletin, a comprehensive data report covering the 2015/2016 and 2016/2017 hydrologic years. I review some of that information here with updated reference glacier mass balance data from WGMS for 2018 and 2019.

The data set compiled by the World Glacier Monitoring Service has 45,840 measurements on 2540 glaciers (WGMS, 2020). Annual mass balance measurements are the most accurate indicator of short-term glacier response to climate change.  WGMS, (2020) data set has 7300 annual balance values reported from 460 glaciers, with 41 reference glaciers having 30+ year consecutive ongoing records. Annual mass balance is the change in mass of a glacier during a year resulting from the difference between net accumulation and net ablation.

The key data set is the annual balance record from the reference glacier network, these glacier have extensive continuous field monitoring programs with at least a 30 year record.  For example on Columbia Glacier, Washington I have been in the field 36 consecutive summers, over 120 days taking 4600 measurements with 63 assistants. Figure 1 above illustrates glacier mass balance for the set of global reference glaciers for the time-period 1980-2019. Global values are calculated using a single value (averaged) for each of 19 mountain regions in order to avoid a bias to well observed regions.

In the hydrological year 2016/17, observed glaciers experienced an ice loss of -550 mm, and 2017/18 of -720 mm. For 2018/19 hydrologic year a regionally averaged value will not be available until December 2020, the overall mean of all reference glaciers of -1241 mm, compared to -1183 mm in 2017/2018. This will make 2019 the 32nd consecutive year with a global alpine mass balance loss and the tenth consecutive year with a mean global mass balance below -700 mm. The simple mean mass balance of WGMS records has a slight negative bias compared to geodetic approaches, but this bias has been effectively eliminated with the regionalized approach now used by WGMS, see Figure 2 (WGMS, 2020).

Figure 2. Glaciological mass balance of all glacier, reference glaciers (mean), regional mean of reference glaciers and regionalized mean geodetic mass balances for the 1930-2017 period.  Pay particular note to the 1960-2017 period where the data records are better.  Observe the similarity in cumulative mass balance losses regardless of approach.

The decadal averaged annual mass balance was -172 mm in the 1980’s, -460 mm in the 1990’s, 500 mm for 2000’s and – 889 mm for 2010-2019.  The increasing rate of glacier mass loss, with eight out of the ten most negative mass balance years recorded after 2010, during a period of retreat indicates alpine glaciers are not approaching equilibrium and retreat will continue to be the dominant terminus response (Pelto, 2019; WGMS, 2020).  The accumulation area ratio is an indication of the expansion of the ablation areas globally, despite retreat accumulation areas are shrinking.  The decline in accumulation area extent, hence AAR has been rapid, the data in 2017/2018 yields a mean of 13%, whereas the average needed to be in balance is 56%. The low AAR in 2019 is illustrated at two reference glaciers Lemon Creek, Alaska and Alfotbreen, Norway below.

Years

Ba

AAR

1980-1989

-172

47

1990-1999

-460

44

2000-2009

-525

35

2010-2019

-889

28

Table 1 Glaciologic annual balance for each decade from the WGMS reference glacier mean of the 19 regions. The AAR is a simple mean of the reference glaciers.

Landsat images of Lemon Creek Glacier, Alaska and Alfotbreen, Norway in 2019. White dots indicate the glacier boundary on Alfotbreen, purple dots the snowline. Lemon Creek AAR=0%  Alfotbreen AAR=~15%

Detailed information is reported for 20 glaciers distributed around the globe that includes annual mass balance maps as illustrated from Columbia Glacier. The relationship between elevatation and annual balance is the balance gradient seen below for Mocho Glacier, Chile. This glacier is in the lake district of Chile at 39.90° S and 72.00° W and did not have significant accumulation in 2016 or 2017.  The  AAR-annual balance relationship and the ELA-annual balance relationship and annual balance record are reported, as exemplied by Silvretta Glacier, Switzerland, where negative balances occurred in 2016 and 2017.

The result of the rising snowline is mass losses, which drives glacier retreat. This also leads to decreased average albedo and surface lowering, which in turn cause pronounced positive feedbacks for radiative and sensible heat fluxes. This rapid decline in mountain glaciers chronicled by WGMS is expected to accelerate.  Huss et al (2017) describe a cascade of effects that are occuring, impacting ecosytems, communites and our economy.

Annual mass balance maps and measurement network on Columbia Glacier.

Annual balance gradient for Mocho Glacier, Chile.

Annual balance record and annual balance relationship to both AAR and ELA on Silvertta Glacier.

Upsala Glacier, Argentina Limited Snowcover Cloak as 2020 Melt Season Ended

Upsala Glacier transient snowline (TSL) in Landsat images from April 8 and April 17, 2020. TSL is indicated by purple dots, Point A and B are the same nunataks in each image. On April 8 the TSL almost reaches the divide with Viedma Glacier (V). 

Glaciers exist and survive when the majority of the glacier is always snow covered even at the end of the summer melt season. For a calving glacier the percentage of the glacier in the accumulation zone (accumulation area ratio: AAR) required to be in equilibrium is at least 65%, depending on calving rate. At the end of the melt season the transient snow line (TSL) is the equilibrium line where melting equals accumulation, above this point accumulation is retained. In the last year we have observed a number of glaciers with exceptionally limited retained snow cover at then end of summer in 2019. The limited AAR is a driver of mass balance loss and future terminus retreat. Here we report on the TSL on Upsala Glacier, Argentina in April 2020. This glacier flows south from a divide with Viedma Glacier and is fed from the crest of the Southern Patagonia Icefield. The glacier terminates in Lago Argentina and has retreated substantially, 7.2 km from 1986-2014 (NASA, 2014).

De Angelis (2017)  noted the equilibrium line for Upsala Glacier was 1170 m based on 2002 and 2004 observations, which equates to an AAR of 65%. Landsat images from 2001 and 2014 both from March indicate a TSL at 1075 m in 2001 and 950 m in 2014. With the snowline downglacier of Point B. On Feb 14, 2018 the TSL reached its highest observable elevation at 1275-1300 m. On March 14, 2019 the TSL reached 1300 m. On April 8, 2020 the TSL is between 1325 and 1350 m upglacier of Point A and nearly to the Viedma Glacier divide. On April 17, 2020 the TSL has descended slightly to 1300 to 1325 m.  The ELA of ~1350 m is the highest annual observation for Upsala Glacier and equates to an AAR of ~48%. Malz et al (2018) indicated a 3.3 m thinning of Upsala glacier with significant thinning extending to the Viedma Glacier divide. Since 2014 retreat has largely paused, but given mass losses upglacier and consistent high snowlines ~1300 m in 2018-2020, not for long.

The unusually high snowlines in 2019 were observed at the Northern Patagonia IcefieldTaku Glaicer, Alaska and on Penny Ice Cap, Baffin Island.

Upsala Glacier transient snowline (TSL) in Landsat images from March 2001 and March 2014. TSL is indicated by purple dots, Point A and B are same location on each map.

Upsala Glacier transient snowline (TSL) in Landsat images from February 14, 2018 and March 14, 2019. TSL is indicated by purple dots, Point A and B are same location on each map.

Map from GLIMS of the glacier divide of Upsala and Viedma Glacier with contours in meters noted.

Vilkitskogo Glacier, Novaya Zemlya Retreat Releases Islands 1990-2020


Vilkitskogo Glacier North (VN) and South (VS) terminus in 1990 and 2020 Landsat images. Terminus in 1990 ends on an island forming. Red arrow is 1990 terminus, yellow arrow is the 2020 terminus.  The 2020 image is from early June and shows low snowpack for so early in summer.

Vilkitskogo Glacier has two termini that had just separated in Vilkitsky Bay in 1990.  The glacier flows from the Northern Novaya Zemlya Ice Cap to the west coast and the Barents Sea. The glacier has been retreating rapidly like all tidewater glaciers in northern Novaya Zemlya (LEGOS, 2006;)(Pelto, 2016), Carr et al (2014) identified an average retreat rate of 52 meters/year for tidewater glaciers on Novaya Zemlya from 1992 to 2010 and 5 meters/year for land terminating glaciers. For Vilkitskogo they indicate retreat into a widening fjord, and that the south arm has a potential bathymetric pinning point. The increased retreat rate has occured synchronously with sea ice cover depletion in the Barents Sea and sea surface temperature increases. Both factors would lead to increased calving due to more frontal ablation.

The north and south glaciers both terminated at the mouth of their respective fjords in 1990, with the southern arm ending on a small island/peninsula extension. In 1994 there is limited evident retreat.  By 2001 embayments had developed particularly along the peninsula separating them and the south terminus still ended on a developing island.  By 2015 Vilkitskogo North has retreated 5000 m along the northern side of the fjord and 4000 m along the south side since 1990.  This fjord has no evident pinning points, and the rapid calving retreat should continue.  Vilkitskogo South has retreated 1000 m on the west side and 1800 m on the east side.  The retreat had exposed a new island in the center of the glacier.  The glacier in 2015 terminates on another island.  Retreat from this pinning point will allow more rapid retreat to ensue.

In 2020 the northern arm has retreated 5500 m since 1990 a rate of  ~180 m/year. The southern arm has retreated from the island with an overall retreat of 2300 m, a rate of ~75 m/year.

The front of the terminus in each case remains heavily crevassed indicating  high frontal velocity and ablation.  This indicates the calving retreat will be ongoing. The retreat has the same unfolding story as KrivosheinaNizkiy and Glasova Glacier and Krayniy Glacier.

Vilkitskogo Glacier  terminus in  2020 Landsat image showing two new islands. Terminus in 1990 ends on an island forming. Red arrow is 1990 terminus, yellow arrow is the 2020 terminus. 

Vilkitskogo Glacier terminus in 2001 and 2015 Landsat images. Terminus in 2001 ends on an island to be. Terminus in 2015 ends on a second island forming. Red arrow is 1990 terminus, yellow arrow is the 2015 terminus. Purple arrows show areas of expanding bedrock.

Pacliash Glacier, Peru Retreat and Lake Expansion

Retreat and lake expansion at Pacliash Glacier (PH) and Palcaruja Glacier in the Cordillera Blanca, Peru illustrated with 1988, 2000 and 2019 Landsat images.  Red arrow is the 1988 terminus, yellow arrow the 2019, purple dots are the snowline.

Pacliash Glacier is in the Cordillera Blanca of Peru, on the northeast flank of Palcaraju and Tocllaraju had until recently terminated in Laguna Pacliashcocha.  This region has seen substantial glacier retreat and area loss.  Glacier lakes have increased in number and expanded during this retreat.   Laguna Pacliashcocha is impounded by a glacier moraine that experienced a breach in 1997, resulting in minor GLOF in 1997 (Carey, 2010).  This led to the temporary drainage of this lake over the next several years (Carey, 2010).  Palmer (2019) reported on the expanding lake volume, continued GLOF hazard and engineering mitigation at the Palcacocha Lake that lies below the Palcaruja Glacier.  Veettil and Kamp (2019) note a 25% decline in glacier area in the Cordillera Blanca after 1987. Here we examine the rapid retreat of the glacier and the consequent expansion of the lake and the impact on GLOF potential.

In 1988 Pacliash Glacier terminated in the lake, which had an area of 0.1 km2 and was 0.4 km long. The lowest 2 km of the glacier was heavily snowcovered and the snowline is at 5000-5100 m.  In 2001 the lake had expanded to an area of 0.18 km2 and 1.0 km long, the snowline was at 5000-5100 m.  By 2016 the glacier has retreated from the lake and terminated 250 m from the lake margin.  The snowline is at 5300-5400 m.  In 2019 the glacier terminates 300 m from the lake margin, the retreat from 1988-2019 is 1500 m.  The lake is 1.25 km long and has an area of 0.28 km2 in 2019.  The snowline is at 5300-5400 m, the higher snowline is the driving force behind the retreat.  The smaller glacier yields less glacier runoff (Carey, 2010).  This is one of many clear examples of glacier watershed fed hydrologic systems and the connected social systems in the Andes being transformed by global change (Mark et al, 2017).

The GLOF threat in this case has declined as the glacier has receded from the lake and is ending on a slope that is not steep enough to easily have an avalanche travel across/from the glacier to the lake.  Palcaruja Glacier has experienced a similar retreat and lake expansion, but has a much steeper slope from the terminus to the lake, hence the avalanche risk into the lake generating a GLOF remains high (Palmer, 2019). Emmer et al (2016) notes that the number of GLOF’s were greater from moraine dammed lakes in the region early in the retreat phase in the 1940’s and 1950’s.  This suggest the moraines are becoming more stable with time since formation and glacier retreat.

Digital Globe image of Pacliash and Palcaruja Glacier in 2016, red arrow is the 1988 and yellow arrow the 2019 terminus.  Blue arrows show glacier flow direction. 


Darwin Glacier, Chile 1986-2020 Retreat Opens New Fjord Arm

Darwin Glacier in Landsat images from 1986 and 2020. Red arrow indicates 1986 terminus location, yellow arrow 2020 terminus location, purple dots the snowline.  Point 1,2 and 3 indicate the same specific location.

Darwin Glacier flows east from the main divide of the Cordillera Darwin entering the head of Fjord Parry. Here we examine changes illustrated by Landsat images from 1986-2020.   Melkonian et al (2013) note widespread thinning of four large glaciers in the Cordillera Darwin Range from 2000-2011; Ventisquero Grande, Marinelli, Darwin and Roncagli, while the Garibaldi Glacier increased in volume.  They note a maximum velocity of 9.6 m/day at Darwin Glacier and thinning of over 3 m/year during the 2000-2011 period, which emcompasses a period of rapid retreat noted below. Davies and Glasser (2012) note that during the 1870-2011 period the Cordillera Darwin area loss was most rapid from 1986 to 2001. Dussaillant et al (2019) note the mass loss for the central Cordillera Darwin at -0.4 to -0.6 m/year from 2000-2018.

In 1986 Darwin Glacier extended beyond the end of a southwest trending valley (Point 3) and had fully separated from the former tributary flowing eastward. Tributaries at Point 1 and 2 join the main glacier within a 2 km of the current terminus. The snowline is at 500 m. By 2000 the glacier had retreated into the southwest trending valley, with a peninsula emerging on the west side at point 3.  The snowline is at 500 m. By 2019 the glacier had retreated beyond the former tributaries at Point 1 and 2. The snowline in 2018 is at 750 m.  In 2020 the peninsula at Point 3 has greened up with new vegetation, the glacier has retreated 3100 m since 1986 exposing a new fjord arm. Point 2 is largely a glacier free valley bottom.  The snowline is at 800 m.  A further 1 km retreat will lead to another tributary separation much as has happened at Ventisquero Grande.

Darwin Glacier in Landsat images from 2000 and 2019. Red arrow indicates 1986 terminus location, yellow arrow 2020 terminus location, purple dots the snowline.  Point 1,2 and 3 indicate the same specific location.

GLIMS view of Darwin Glacier with 1986-2007 margins indicated (Bethan Davies delineated margins).  Flow arrows added.

Talking about Iceberg Melt Rates and Glacier Frontal Ablation: Seller and Heim Glacier, Antarctica

Figure 1: Study sites considered in this article: Seller Glacier and Heim Glacier (Landsat-8 image courtesy of the U.S. Geological Survey)

Post by Mariama Dryak

Iceberg melt is caused by the temperature of the water in which an iceberg floats and the velocity of the water flowing around the iceberg. As a result, iceberg melt is an excellent indicator for the ocean conditions in which an iceberg resides. Given the remote location of Antarctica, and the difficulty in taking direct oceanographic measurements immediately in front of glacier termini in Antarctica, icebergs near glacier fronts can act as a useful proxy for what the ocean conditions are in these areas, especially under changing climate.

Dryak and Enderlin (2020) compared remotely-sensed iceberg melt rates (2013 – 2019) from eight study sites along the Antarctic Peninsula (AP) to glacier frontal ablation rates (2014 – 2018) where they overlapped in time and found a significant positively correlated relationship between the two. In general, iceberg melt rates were found to be much lower on the eastern AP where ocean waters are characterized as very cool relative to the heterogeneous, but generally warmer, waters on the western AP–where iceberg melt rates were higher. When we take a closer look at the data and consider what this means in the context of a stratified water column, the iceberg melt rate magnitudes also make sense relative to one another and what is known of regional ocean conditions.

Here we take a look at the results from two of those study sites: Seller Glacier and Heim Glacier.

Seller Glacier is the southernmost study site considered in our study on the Antarctic Peninsula, and produces very large, sometimes tabular icebergs with relatively high mean melt rates. Figure 2 indicates the changes in the same iceberg at two points in time. These icebergs are larger than and different in style to all of the other study sites, with the Seller Glacier terminus also being the widest of all the glaciers considered in the study. Due to the large area of the icebergs produced, we know that the keel depths of these icebergs also extend deep into the water column (See Table 1, Dryak and Enderlin, 2020), contacting warm subsurface waters (and some contacting Circumpolar Deep Water (CDW)) as characterized by Moffat and Meredith (2018) in Figure 3 below. In the upper layers these icebergs also sit in the very cold Winter Water (WW) layer and expanded section of Antarctic Surface Water (AASW) prevalent in the Seller region.

Figure 2: An iceberg from Seller Glacier in 2014 and later in 2016. Mean submarine melt rates for the Seller Glacier icebergs from this time period were 6.54 cm/day (Imagery © [2019] DigitalGlobe, Inc.)

Figure 3: Figure 3 from Moffat and Meredith (2018).

Frontal ablation rates at Seller Glacier are higher than expected given iceberg melt rates at the other sites on the western Antarctic Peninsula (Figure 4). Dryak and Enderlin (2020) suggest this to be because of a long-term dynamic adjustment of the Seller Glacier in response to the collapse of the Wordie Ice Shelf, which occurred between 1966 and 1989 (Vaughan, 1991)-a similar case to the sustained elevated velocities witnessed at Crane Glacier on the eastern Antarctic Peninsula following the collapse of the Larsen B Ice Shelf in 2002.


Figure 4:     Scatterplot of iceberg melt rates and frontal ablation  for nearby glaciers over near-coindicdent time periods. Symbols indicate median frontal ablation rates. Figure 8 from Dryak and Enderlin (2020)

In contrast, the study site at Heim Glacier, north of Seller Glacier, contains smaller, shallow icebergs with low iceberg melt rates on par with iceberg melt rates found on the eastern Antarctic Peninsula. The glacier that produced the sampled icebergs, though not the smallest of the sites sampled, produces icebergs small in area that often do not last from one season to the next. The keel depths of the sampled icebergs at Heim Glacier likely do not reach below the cold WW layer (Table 1, Dryak and Enderlin, 2020), terminating in the very cold water layer or above in the compressed and comparatively cool AASW. However, the Heim study site is also located near the Marguerite Trough, an area of deep bathymetry known for the presence of warm waters, so the low melt rates here may be surprising to some without taking a closer look at the specific locale. Our study suggests that the bathymetry of the area in which the icebergs reside might be sheltered due to the presence of Blaiklock and Pourquoi Pas Islands, which may deflect warmer waters from reaching the Heim Glacier.

Frontal ablation rates at Heim Glacier are low, and of a similar magnitude to eastern Antarctic Peninsula sites, corresponding in magnitude to the low iceberg melt rates for the site as well (Dryak and Enderlin, 2020; Figure 8).

Overall, this paper re-emphasizes the importance of considering the ocean’s role in forcing changes on glaciers that terminate in the ocean around Antarctica, especially under changing climate. With the ocean acting as a large sink for excess heat in the atmosphere, evaluating the consequences of the storage of this heat in the ocean is essential when attempting to understand the feedback mechanisms associated with such change. The moral of the story is that we must keep one eye on the ocean going forward and how it could lead to changes in glacier dynamics, which could lead to changes in the contributions of glaciers to sea level and the marine ecosystems that exist within the ocean.

For full results and discussion of all of the study sites considered along the western and eastern sides of the Antarctic Peninsula, read the full Dryak and Enderlin (2020) article in the Journal of Glaciology.

*Note the Seller Glacier like many others in the region have experience rapid retreat in the last 30 years, Fleming Glacier, Sjogren Glacier and Boydell Glacier.

Frank Mackie Glacier, BC Retreat Forming Lake

Frank Mackie Glacier, British Columbia in Landsat images from 1987 and 2019.  Red arrow is the 1987 terminus location, yellow arrow the 2019 terminus location and purple dots the snowline. Point 1-3 are specific locations where bedrock exposure has expanded.

Frank Mackie Glacier is at the headwaters of the Bowser River which flows into Bowser Lake and the Nass River in NW British Columbia. The glacier has repeatedly advanced across the Bowser River valley in northwestern British Columbia into standing forests to impound Tide Lake during the Holocene (St. Hilaire and Smith 2015).  They reported that the last advance creating the lake ended around 1930 when the lake drained catastophically.  The Nass Riverhas significant salmon populations with the Coho Salmon populations doing well with ove 150,000 returning spawners annually, which is above the historic average Nass River salmon.  Chum Salmon are significantly below the historic average near historic lows in recent years (Salmon Explorer).

In 1987 the glacier extends across a basin in the valley bottom terminating at bedrock knob,  1 km south of a proglacial lake.  The snowline is high at 1600 m.  Point 1 is a narrow bedrock ridge and limited bedrock is exposed at Point 2 and 3.  By 1997 the glacier had retreated into a developing proglacial lake basin, there is not lake just some small fringing areas of surface water. The snowline is at 1600 m, with the bedrock ridge at Point 1 having expanded in width and the amount of bedrock exposed at Point 2 having increased significantly.  In 2007 the terminus has retreated into the expanding lake that now has an area of ~0.8 km2.  The snowline is at 1500 m.  In 2018 the snowline by Aug. 26 is at ~1800 m, which is near the crest of two of the three main trunks. By 2019 the lake has expanded to an area of ~1.8 km2. The retreat from 1987-2019 is  1900 m.  The snowline is reaches the divide of two of the three main trunks of the glacier, slightly higher than in 2018 at +1800 m (see below).  There are some small high elevation mountain sides feeding the glacier that have retained snowpack. The consistently high snowline underscores the mass loss of the glacier that is driving retreat. For a glacier in this region to be in equibrium it needs at least 55% of its area (AAR) to be in the accumulation zone.  In 2018 and 2019 this area is below 20%.

The snowline was also a record high on the Juneau Icefield in both 2018 and again in 2019 (Pelto, 2019). Menounos et al (2018) identify large mass balance losses from 2009-2018 in this region.  The nearby Porcupine Glacier has experienced an even more rapid retreat.

Frank Mackie Glacier, British Columbia in Landsat images from 1997 and 2007.  Red arrow is the 1987 terminus location and yellow arrow the 2019 terminus location. Point 1-3 are specific locations where bedrock exposure has expanded.

Map of Frank Mackie Glacier (FM) with adjacent Berendon (B), Clara Smith (SC) and Knappi (K) Glaciers indicated.  Blue arrows indicate flow direction.  The map indicates the terminus position close to the 1987 position.

Frank Mackie Glacier  (FM)snowline on 8/26/2018 and 8/29/2019 in Landsat images-purple dots indicate the snowline, B=Berendon Glacier, K=Knappi Glacier.

Huron Glacier Retreat, Livingston Island, Antarctica 2001-2020

Huron Glacier (H) and Kaliakra Glacier (K) in 2001 and 2020 Landsat images.  Extensive retreat at bedrock locations Point A and B with limited retreat at C and D.

Livingston Island, Antarctica is part of the South Shetland Island chain and is primarily covered by glaciers.  At the eastern end is Huron Glacier. Huron Glacier and the adjacent Kaliakra Glacier are tidewater outlet glaciers terminating in Moon Bay on the east end of Livingston Island. Molina et al (2007) noted that persistent warming had led to mass loss  from 1956-2000 on Johnson and Hurd Glacier further west on the island. Osmanoglu et al (2014) observed the velocity and frontal ablation rates of Livingston Island glaciers.  Frontal ablation includes losses from calving and surface melting of the ice face from contact with the ocean and air.  They observed that frontal ablation losses were the same magnitude as surface ablation. Huron Glacier had the highest frontal ablation by a significant amount from 2007-2011 and the higest location of velocity at 250 m/year.  Here we examine Landsat images from the 2001-2020 period to illustrate the retreat of the glacier fronts in Moon Bay.

In 2001 the icefront is 3 km beyond Point A a bedrock knob at the end of a ridge, 3.5 km beyond Point B also bedrock at the end of a ridge, 1800 m beyond Point C and 1500 m beyond Point D.  Snowcover extends to the ice front.  In 2004 there is not a significant change in the ice front position and snowcover again extends to the ice front.  By 2015 the ice front has retreated to within 1 km of Point A. In March 2018 there is evident ablation in the lowest reaches of Huron Glacier.  In February 2020 the ice front has retreated to the bedrock knob at Point A , a 3000 m retreat since 2004. The ice front is 2 km from the bedrock ridge at Point B, a 1500 m retreat since 2004. The ice front retreat on the north side of Kaliakra at Point C has retreated 400 m since 2004.  Retreat on the south margin of Huron Glacier at Point D has retreated 500 m.  Surface melting is also evident in 2020 from Point B to the ice front, with a lateral moraine exposed as was the case in 2018. The 2020 melt season featured record high temperatures in this region of Antarctica leading to high surface melt, such as at Eagle Island Ice Cap.  Surface melt on Livingston Island is less extensive than on the Warsaw Icefield on King George Island  (Petlicki et al, 2017). Retreat of Huron Glacier has been more rapid than on other glacier fronts on Livingston Island this is reflective of the higher frontal ablation rate, which is significantly due to its high velocity.  Osmanoglu et al (2014) note a significant summer velocity increase on Livingston Island glaciers, will increased melt enhance basal water pressure and velocity or lead to a more mature drainage reducing basal water pressure limiting summer velocity increases? The retreat of the calving front is similar to that of Endurance Glacier on Elephant Island.

Huron Glacier (H) and Kaliakra Glacier (K) in 2004 Landsat image and 2015 Landsat image based contour map from Antarctic REMA Explorer.  

Huron Glacier (H) and Kaliakra Glacier (K) in 2018 Landsat image portrayed in Antarctic REMA, note surface melt and lateral moraine material near Point A and B.