
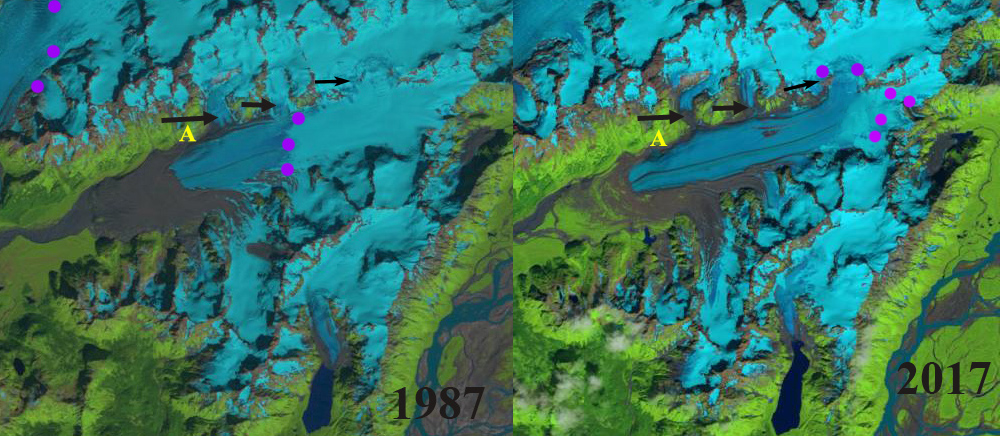
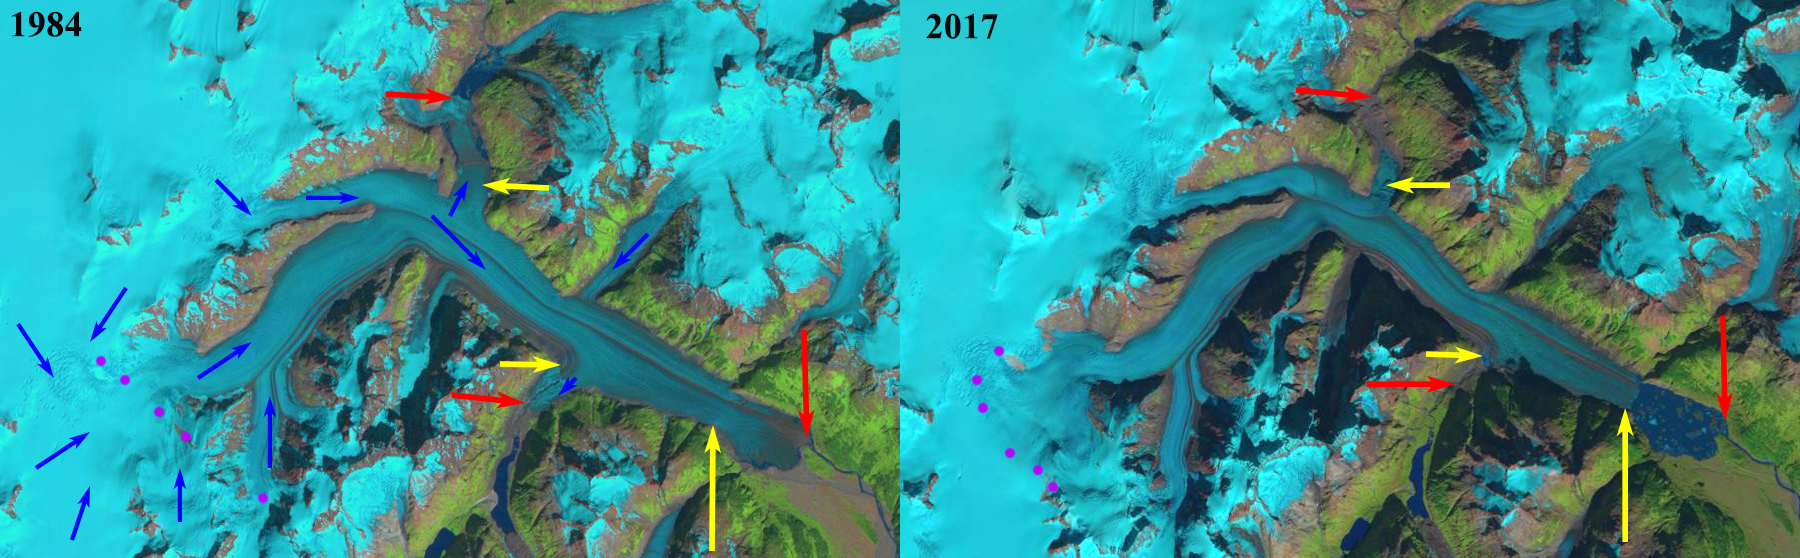
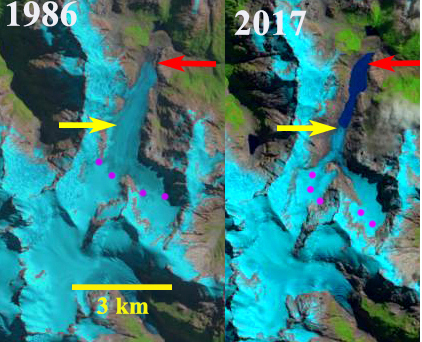
Sherman Glacier, Alaska in Landsat images from 1987 and 2017. Black arrows indicate tributaries on north side. Purple dots indicate the snowline. Point A indicates a depression formed from lateral recession. Also notice how the debris cover has with glacier flow been shifted downglacier.
Sherman Glacier is in the Chugach Mountains of southern Alaska and is famous for the large landslide triggered by the magnitude 9.0 Good Friday earthquake in 1964 that spread across a substantial portion of the glacier below 450 m. This debris insulated the ablation zone of the glacier from melting leading to a glacier advance. The landslide average 1.6 m in thickness and covered 8.25 km2 (McSaveney, 1978). Marangunic (1972) notes the glacier was retreating 25 m/year and thinning by 2 m/year prior to the landslide. By 1966 he notes the glacier had begun to advance. This advance continued up to 2009 (Reznichenko et al (2010). Here we utilize Landsat imagery to indicate the changes from 1987 to 2017 on Sherman Glacier.
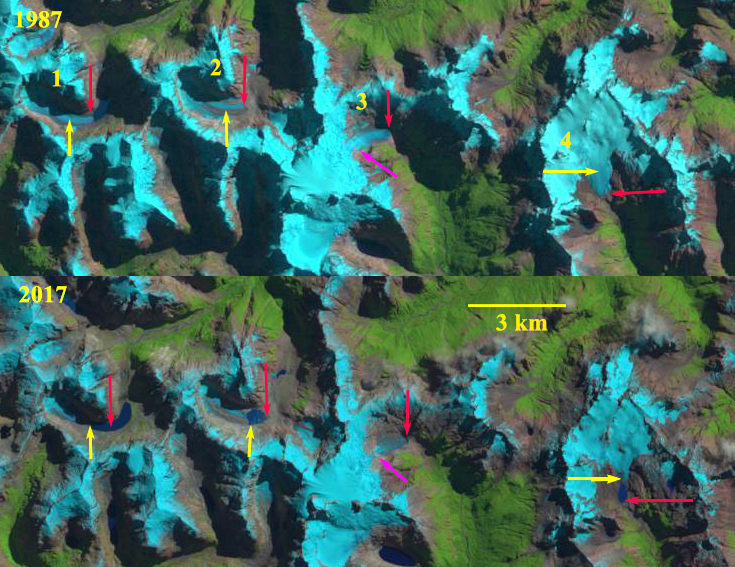
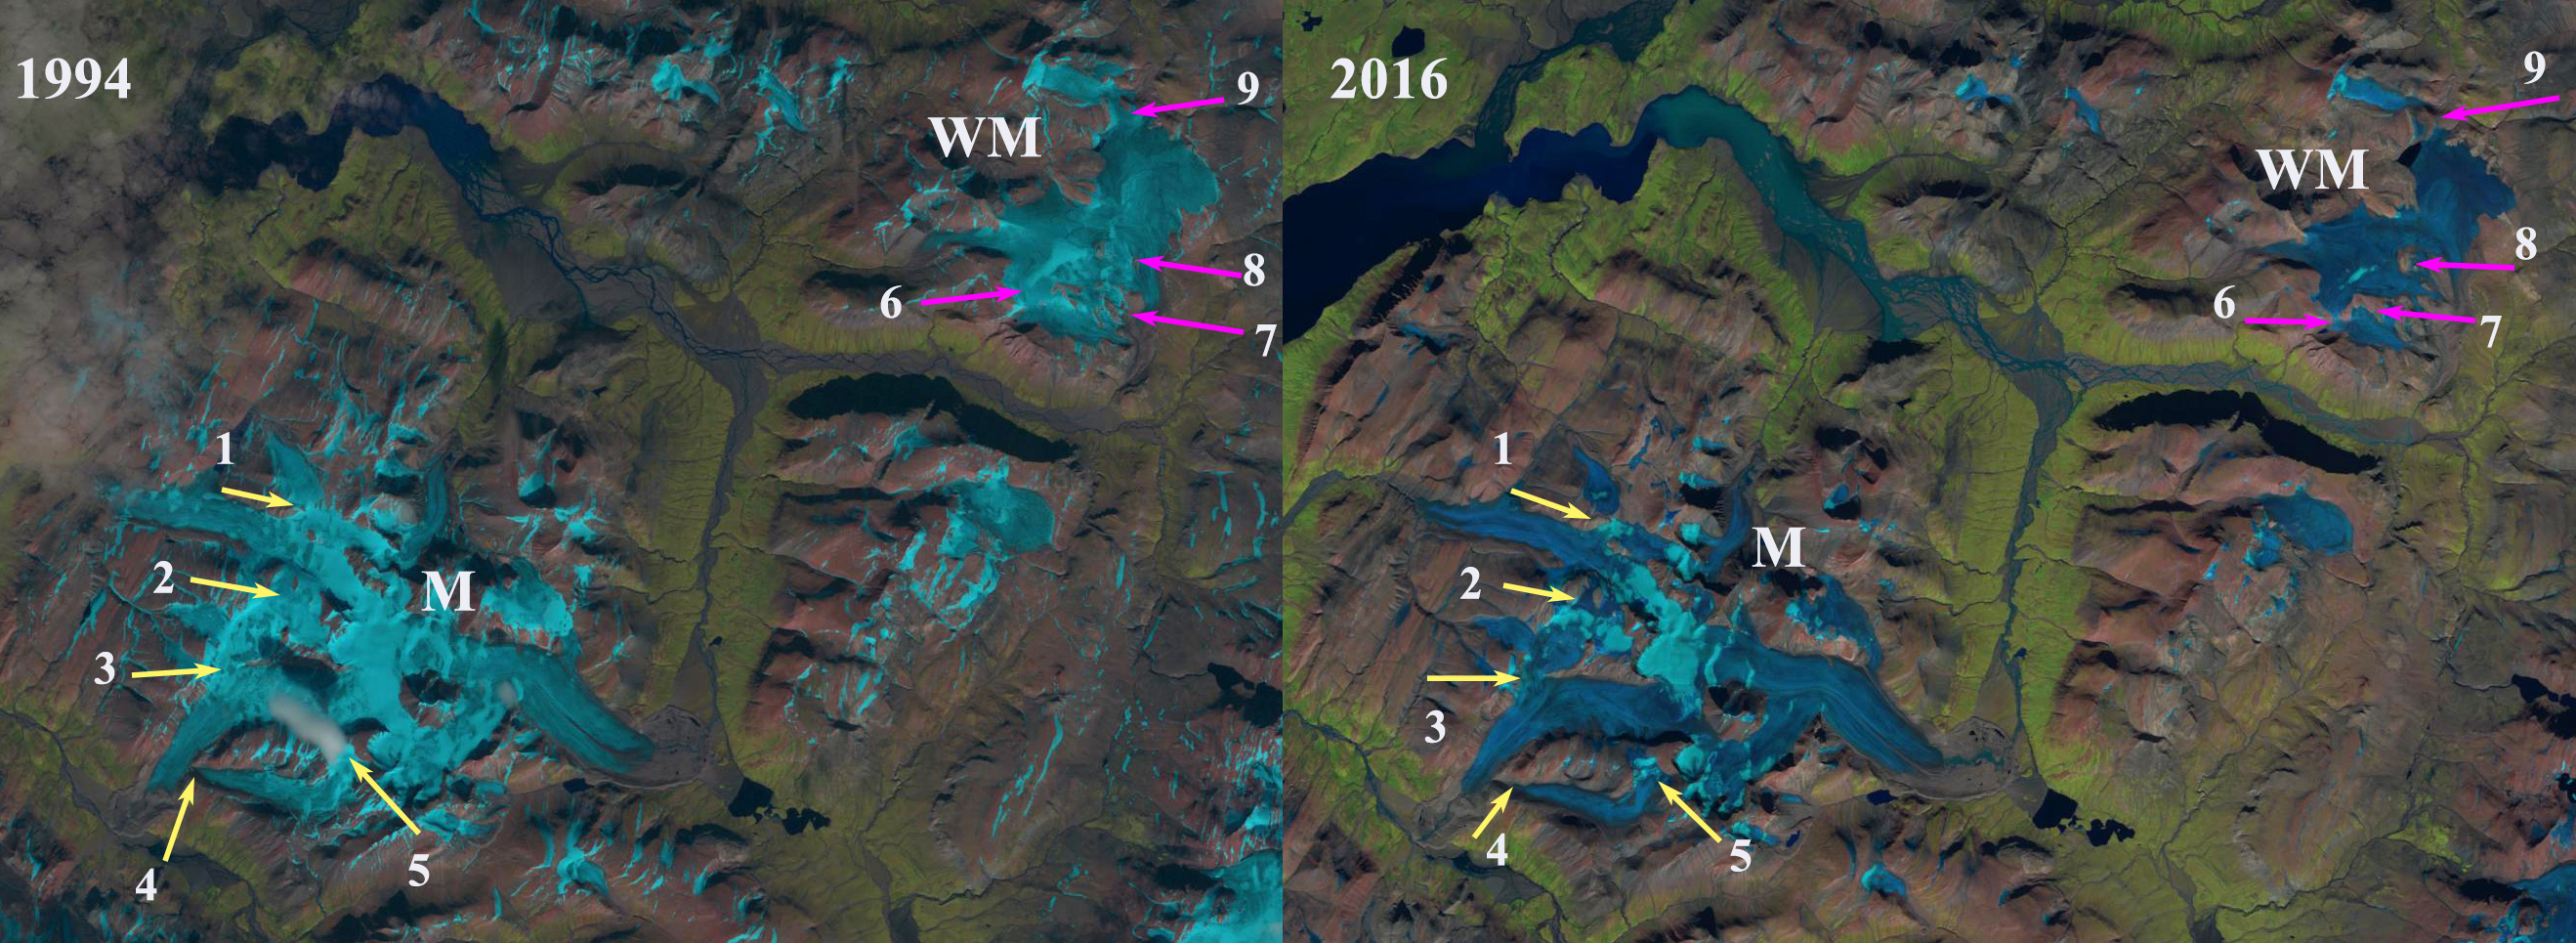
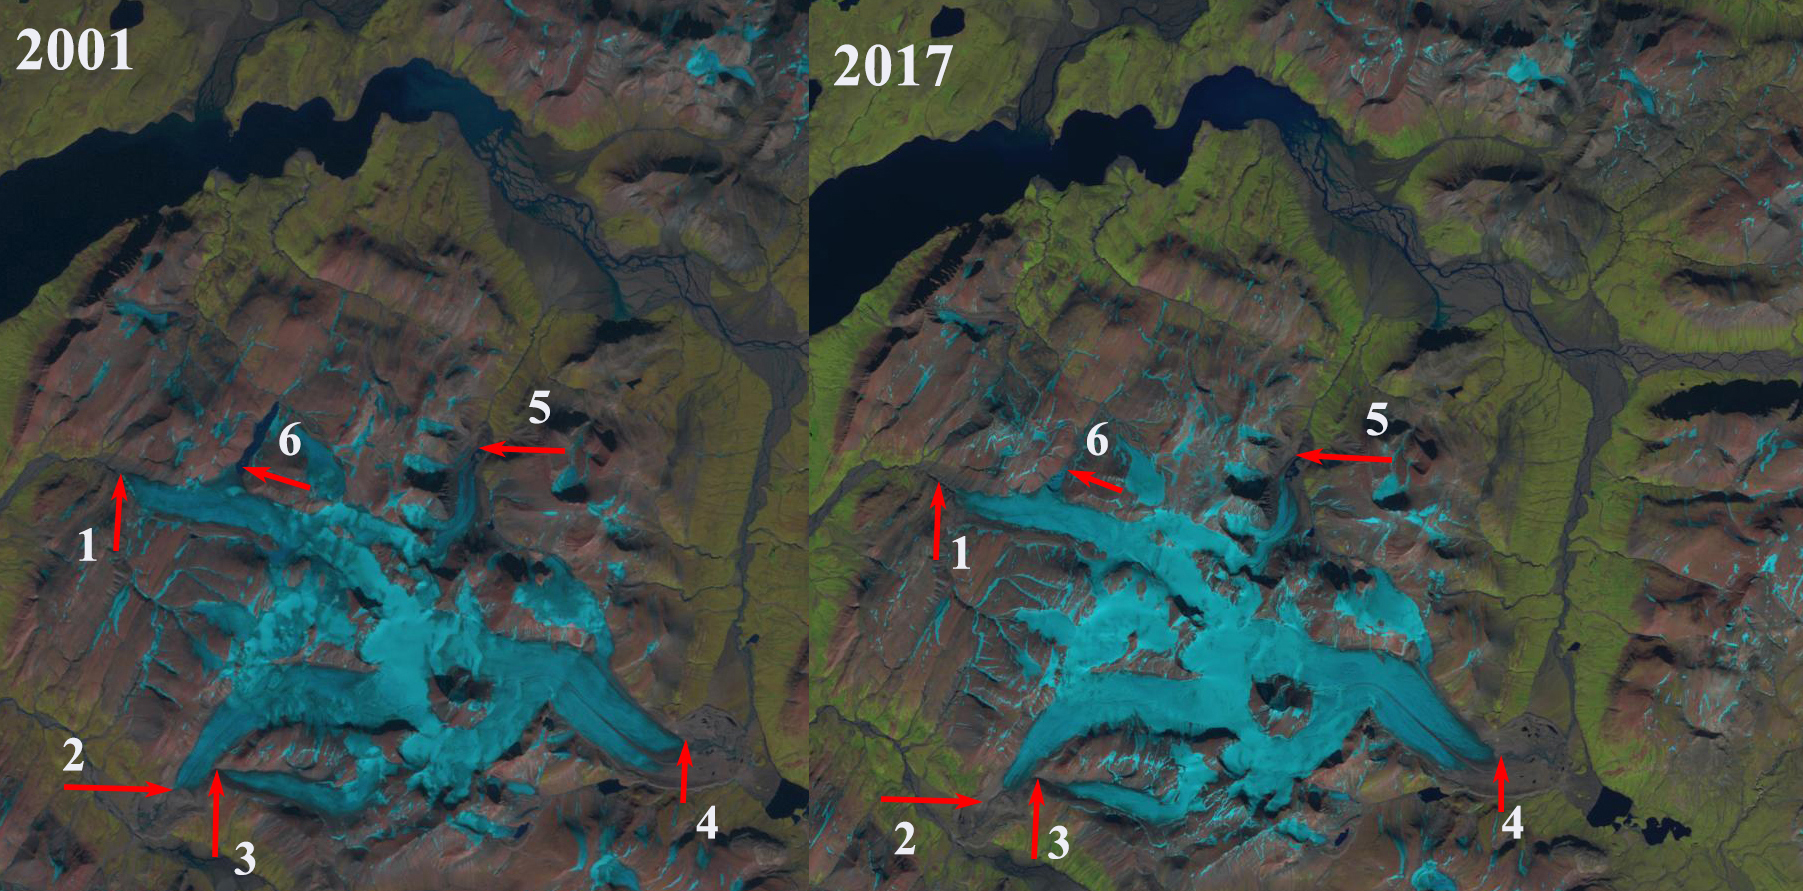
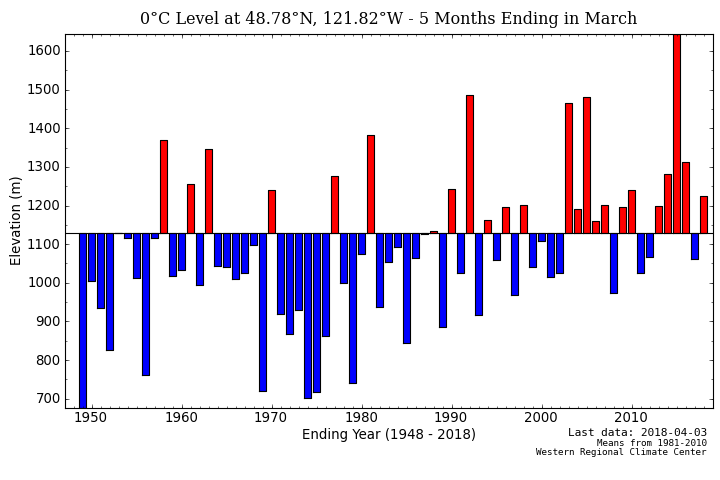
The terminus of Sherman Glacier remains buried by a portion of the landslide debris and its position change at present is hard to discern, upglacier the changes are striking. In 1987 their are three tributaries entering the glacier from the north. The snowline is at 450 m. The glacier at Point A extends the the valley wall. In 1999 the three north side tributaries are still connected and the glacier extends to the valley wall at Point A. The snowline is at 600 m. In 2015 the snowline is at 850 m with only 30% of the glacier in the accumulation zone. At Point A a circular depression has formed as the glacier has receded from the valley wall. In 2016 the snolwine is again at 850 m. The lowest tributary on the north side has detached from the main glacier. The middle tributary has lost most of its connection. The highest tributary is now connected across just half of its former width with a bedrock rib extending across the other half. In 2017 the snowline is at 725 m with a month left in the melt season. This sequence of years of high snowlines is indicative of what is causing the detachment of tributaries. The glacier is thinning significantly up to at least 800 m in elevation. This represents a mass loss across most of the glacier, which is leading to retreat of tributaries and marginal retreat in much of the ablation zone. The lateral recesssion at Point A since 1987 is 250 m. This volume loss belies the minor recent terminus retreat of the debris buried terminus. This glacier due to the landslide has not retreated as much as its neighboring glaciers such as Valdez Glacier.

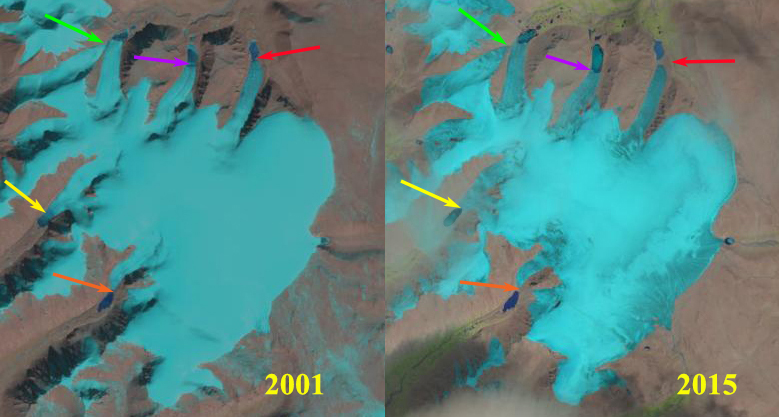
Sherman Glacier, Alaska in Landsat images from 1999, 2015 and 2016. Black arrows indicate tributaries on north side. Purple dots indicate the snowline. Point A indicates a depression formed from lateral recession.
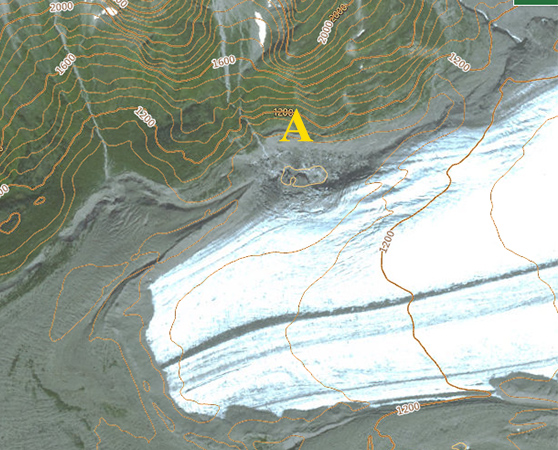
Sherman Glacier in the National Map viewer, indicating depression below Point A and lateral recession.

Sherman Glacier tributary detachment, 275 m of retreat from main glacier in the National Map Viewer image from several years ago.

Figure 12 from (Reznichenko et al (2010) The rock avalanche caused by the 1964 Great Alaska Earthquake covered part of the ablation zone of Sherman Glacier. (a) The rock-avalanche cover after its emplacement in 1967. (b) The rock avalanche reached the terminus of the glacier in 2008 (pictures from Mauri McSaveney).


