

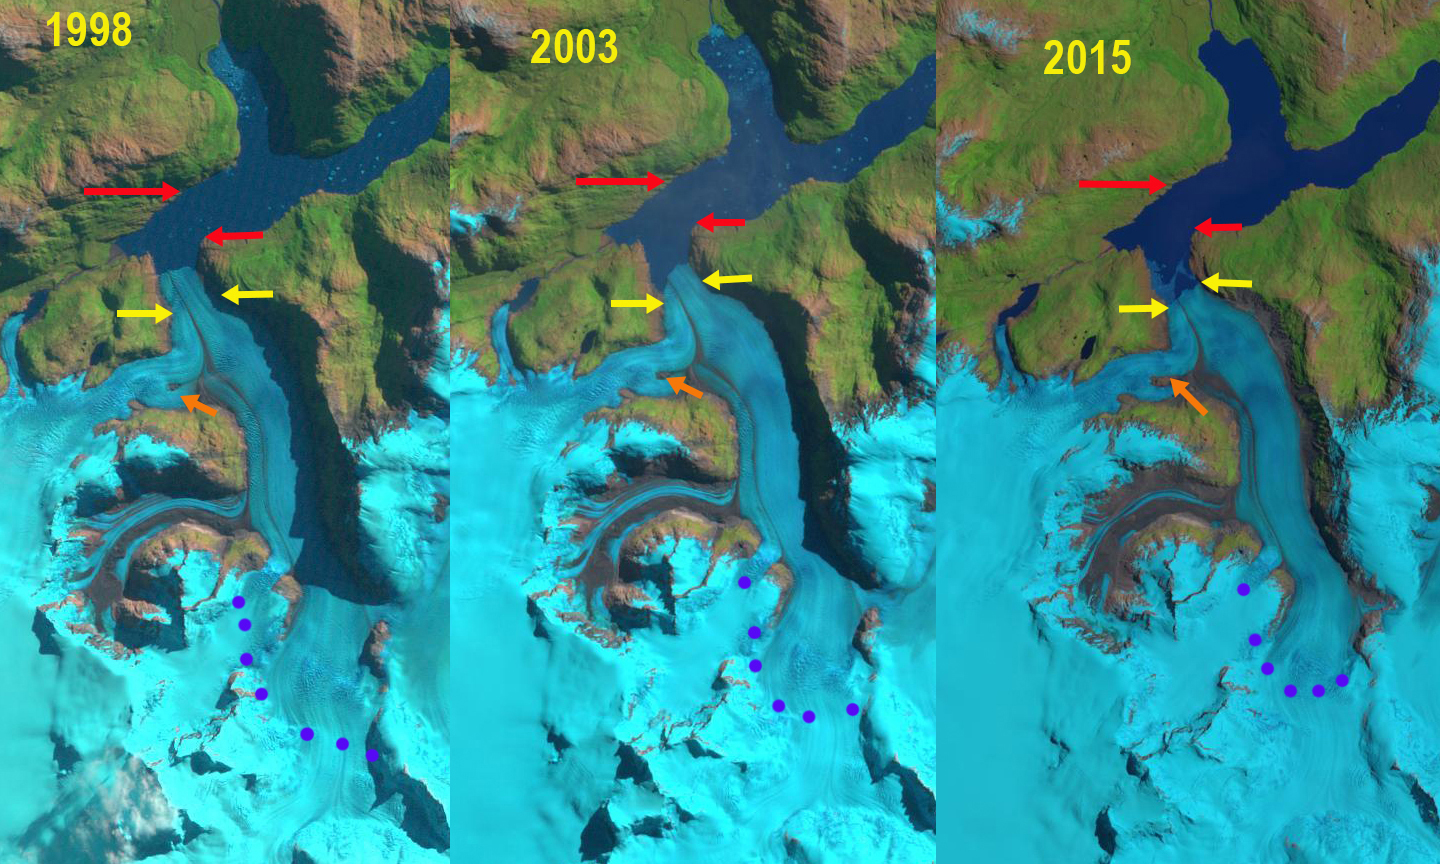
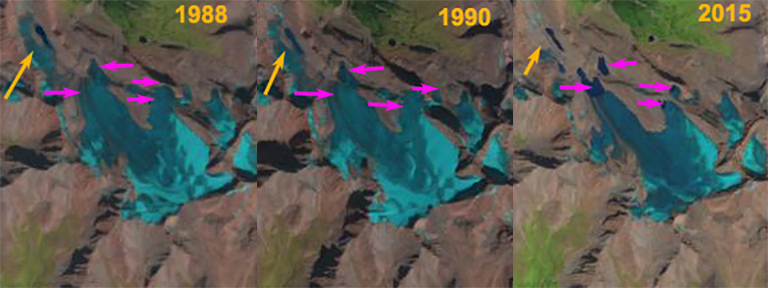
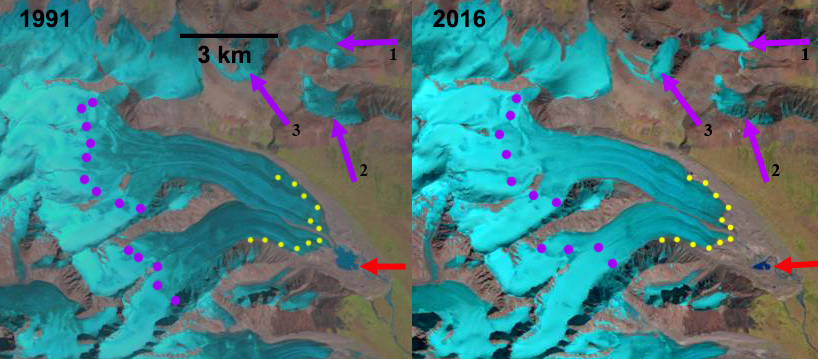
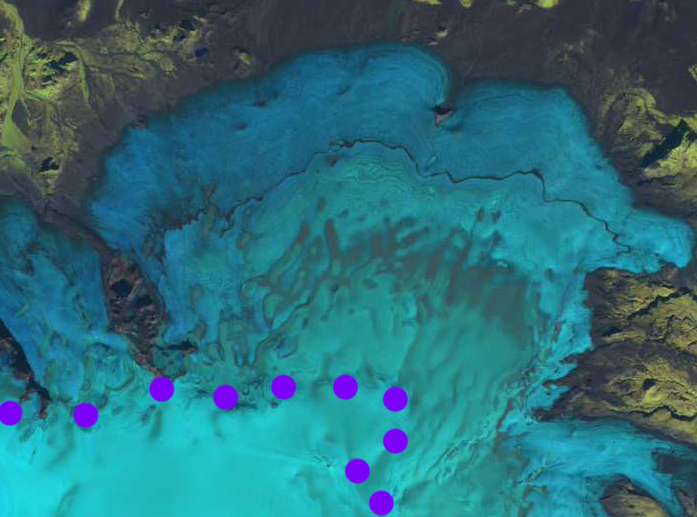
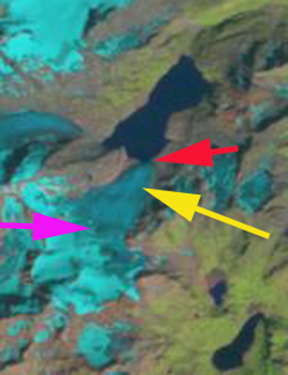
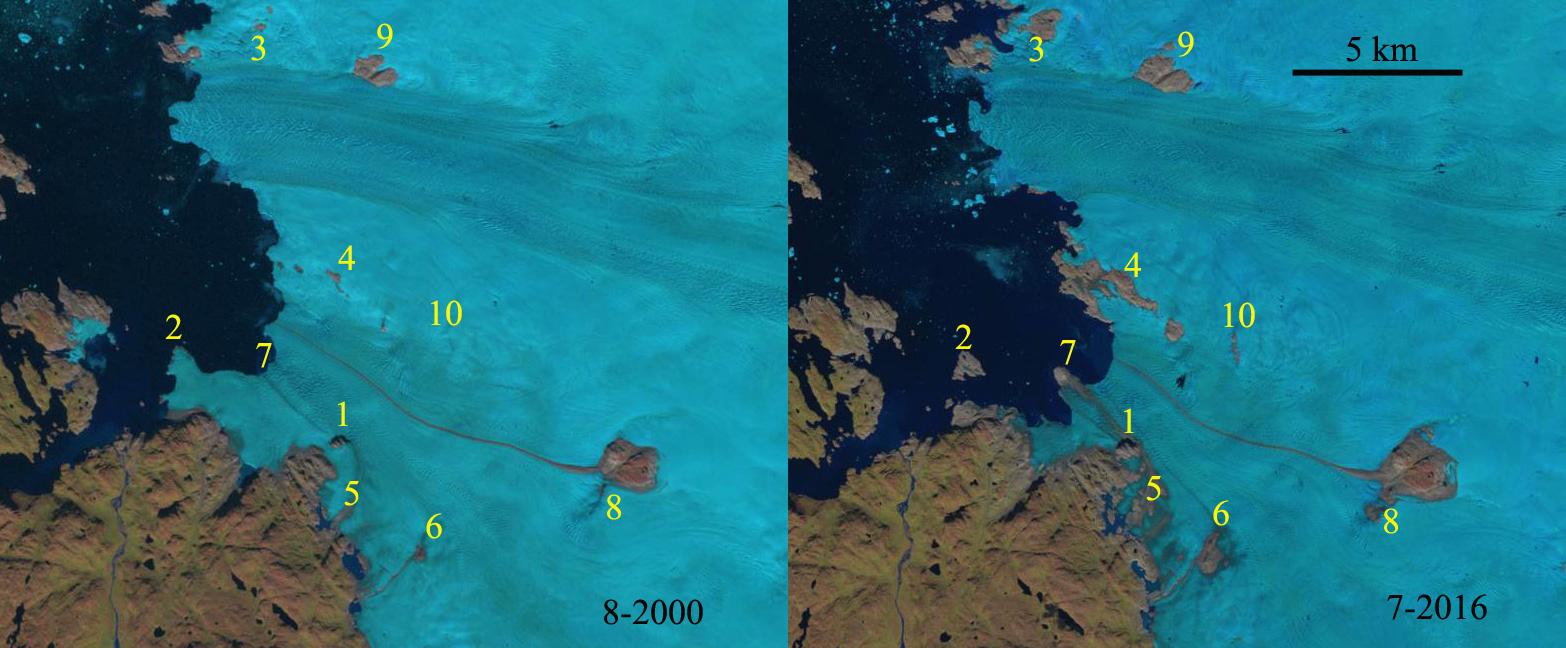
Lucia Glacier retreat from 1987 to 2016 in Landsat images. Red arrows mark 1987 terminus, yellow arrows 2016 terminus, orange arrow an emerging bedrock area, pink arrow a tributary with increased debris cover and purple dots the snowline.
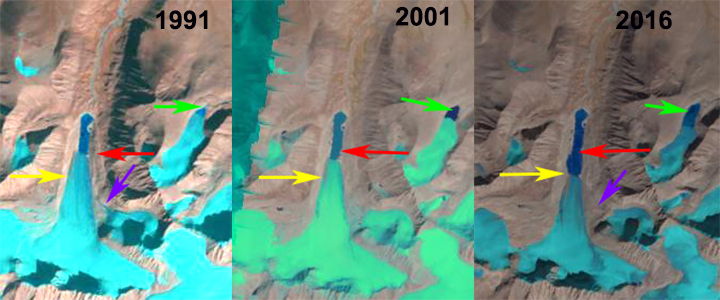
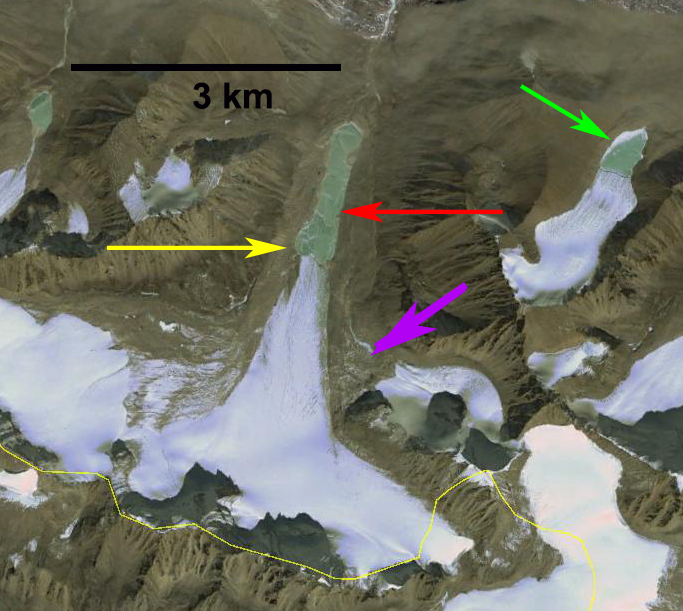
Lucia Glacier terminates in Lago Berguez at the northern margin of the Southern Patagonia Icefield. The lake drains into the Rio Pascua. Willis et al (2012) observed that between February 2000 and March 2012 the Southern Patagonia Icefield rapidly lost volume and that thinning extends even to high elevations. Mouginot and Rignot (2014) illustrate that velocity peaks at 1 km/year and reamins above 500 m/year from the terminus to the accumulation zone on Lucia Glacier. The overall retreat has been driven by increasing calving rates from the 1975-2000 to the 2000-10 period (Schaefer et al, 2015). The pattern of retreat is consistent between these glaciers and the region as noted by Davies and Glasser (2012). They note Lucia Glacier terminus retreat rate from 1870 to 2011 was highest from 1986-2001. Glasser et al (2016) observed both an increase in glacier proximal lakes and in debris cover on glaciers with glacier retreat from 1987-2015. In this case the glacier is now terminating in an expanding proglacial lake, and except for one western tributary that has had increased significant debris cover, the glacier has limited debris cover.
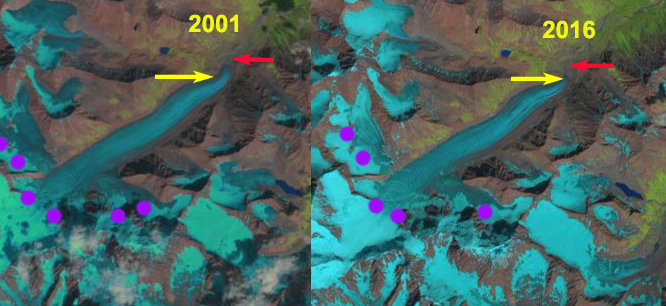
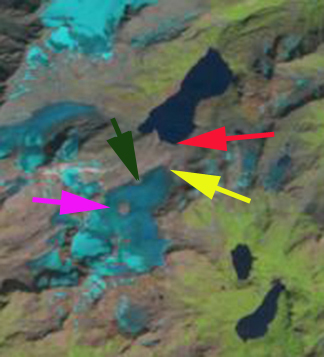
In 1987 the glacier terminated in a north south front in the lake, at red arrows. The snowline was at 1050 m. The western tributary at the pink arrow had 25% debris cover, while the orange arrow indicates a location covered by ice. By 1998 the glacier has retreated into a new arm of Lake Berguez and has an east west front. The snowline is at 1275 m. The western tributary now has 55% debris cover. In 2003 the snowline is at 1250 m and the orange arrow indicates and emerged bedrock area forming a new lateral moraine. By 2016 the glacier has retreated 3600 m on the west side and 1700 m on the east side. The mean frontal retreat is ~2700 m in the 30 year period, 90 m/year The snowline is at 1150 m in 2015 and 1300 m in 2016. The western tributary is now 80% debris covered. The terminus itself in 2003 was 1.3 km wide. In 2016 the calving front is 1.1 km wide. Upglacier of the current terminus the calving front will expand to 2 km in width with a ~1.5 km retreat. This indicates the glacier is at a narrow point now that minimizes calving and that continued retreat will soon lead to an increase in calving. The retreat has exposed steep unstable slopes particularly on the east side of the glacier note below and NASA image. The retreat is greater than neighboring Gabriel Quiroz Glacier and less than Bernardo Glacier.
Lucia Glacier retreat from 1987 to 2016 in Landsat images. Red arrows mark 1987 terminus, yellow arrows 2016 terminus, orange arrow an emerging bedrock area, and purple dots the snowline.

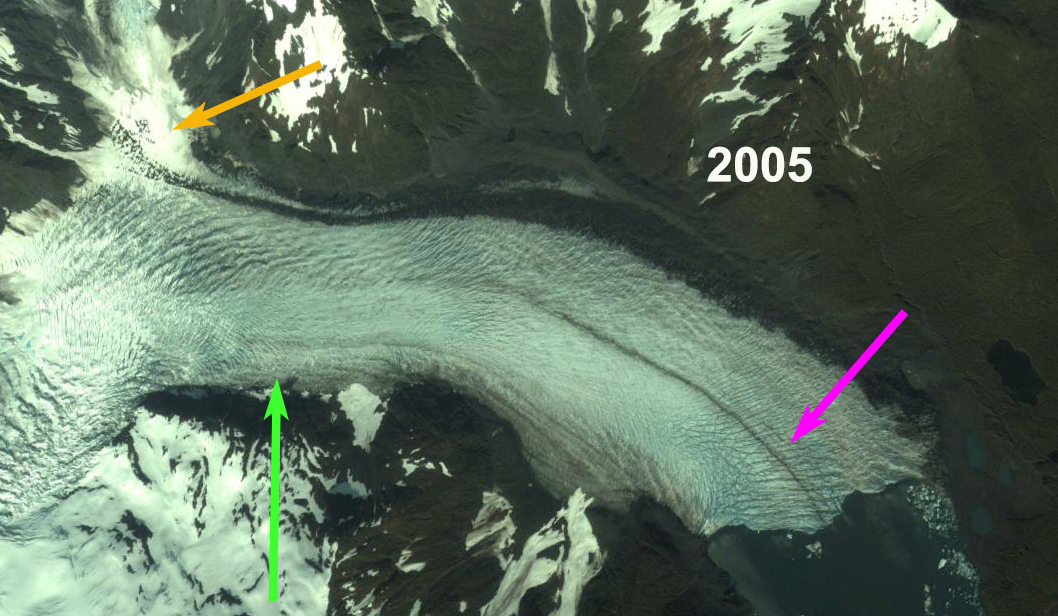
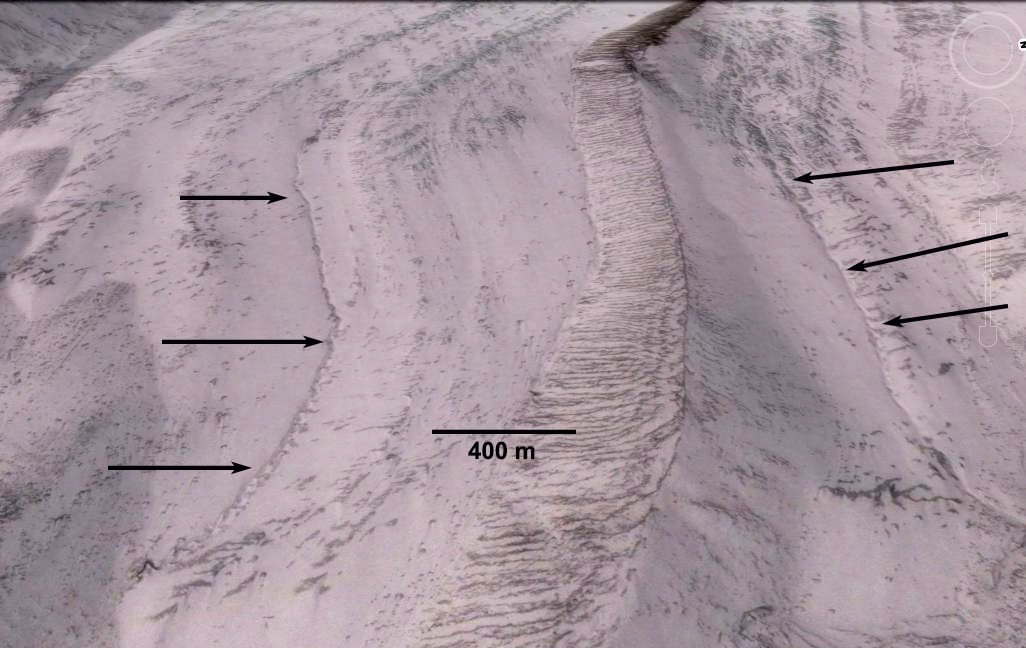
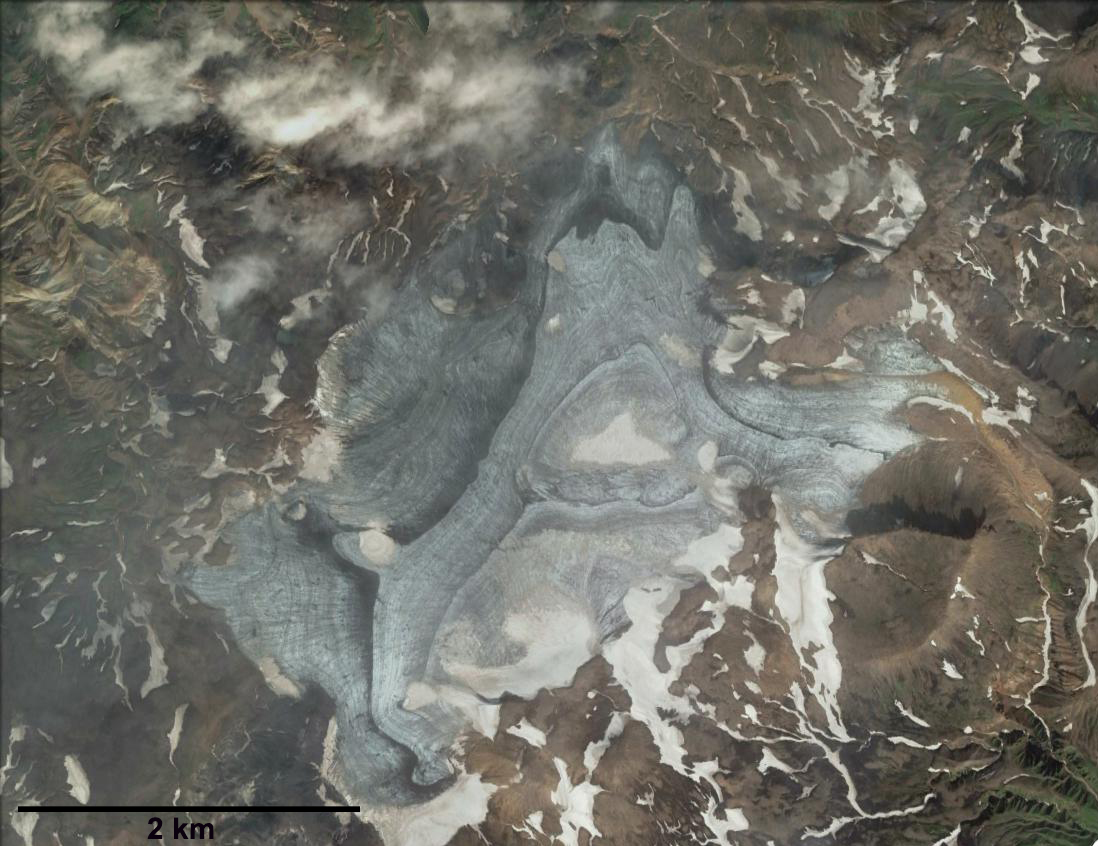
Google Earth image indicating the front of Lucia Glacier (yellow dots) and slopes destabilized by glacier retreat and thinning, pink arrows.


