Tyndall Glacier in Sentinel images from March 11, 2023 and April 12, 2023 indicating the calving event and three icebergs generated.
Tyndall Glacier is a large outlet glacier of the Southern Patagonia Icefield (SPI). This glacier has an area of over 300 km². The main glacier terminus is in Lago Geikie, which began to form around 1940, and the east terminus previously terminated in Lago Tyndall. Laboratorie de Glaciologie reports on both the retreat of this glacier and the Lago Geikie water depth. Extendingaross the middle half of the lake from the 2003 terminus location most of the way to the southern margin of the lake is a basin that is over 200 m deep.Weidemann et al (2018) indicate a -2.5 m/year mass balance loss for the glacier from 2000-2014, much of the loss resulting from frontal ablation, that has driven the continued thinning and retreat. This thinning has exposed dinosaur fossilson the east margin 12 km upglacier of the terminus (NASA EO, 2022).

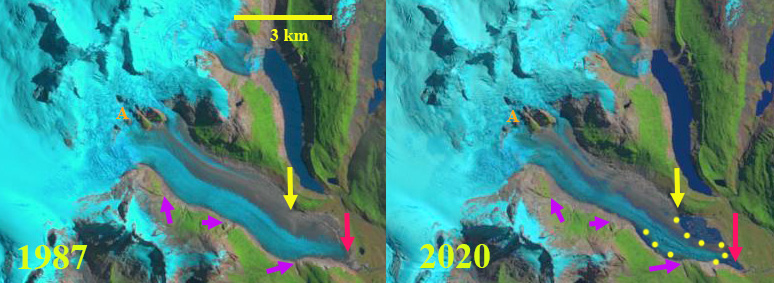
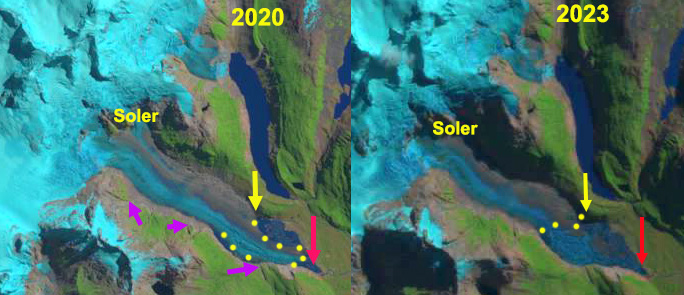
Tyndall Glacier change from 1986 to 2023 in Landsat images indicating the retreat and lake expansion from 12 km² to 21 km². Red dots the 1986 termins, yellow dots the 2023 terminus locaiton.
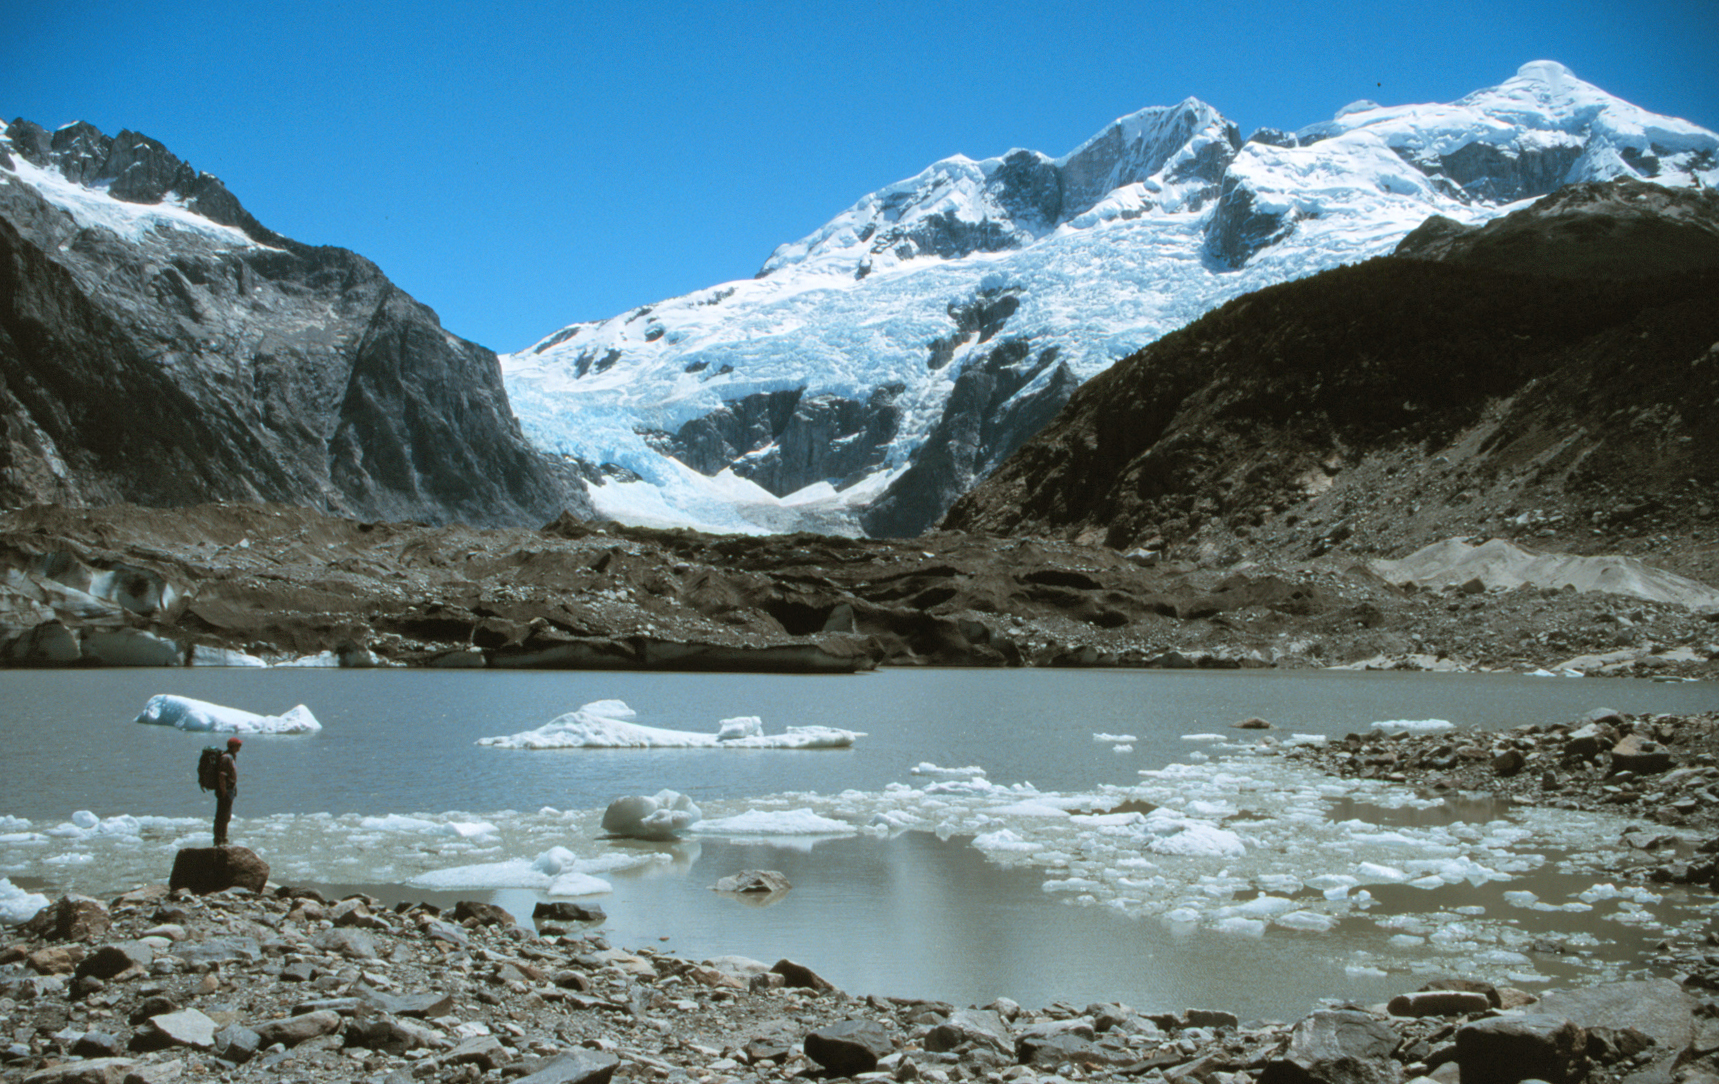
The glacier experienced a significant calving event and associated recession in April 2023, with a 1.5 km² recession from March 11-April 12, 2023. This has increased the area of Lago Geikie to 21 km². In 1986 the area of the lake was 12 km² and the glacier was in contact with Lago Tyndall. Recession had expanded the lake to 17 km² by 2003, and 18 km² by 2010 when the glacier separated from Lago Tyndall. In 2003 a similar calving event took place as the glacier lost much of its protruding central tongue, see iceberg below. From 2013 to 2022 terminus retreat was limited though thinning continued. In late March or Early April of 2023 first the central terminus tongue broke off as seen on April 5. A significant rift is evident that then led to a larger calving event prior to April 12. Is this the largest calving event in the last two decades for this glacier? There is a surface steepening within a 1/2 km of the current terminus indicating a reduction in lake depth. Sakakibara and Sugiyama, (2014)report a decelaration of this glacier from 1986-2011 and a retreat rate of ~100 m/year during this interval. The calving event is similar to the breakup of the terminus tongue I noted at Soler Glacier this year. This is a more active front experiencing a calving retreat similar to that of Glacier O’Higgins.

Tyndall Glacier change from 2003 to 2008 in Landsat images indicating the retreat and lake expansion from 17 km² to 18 km².

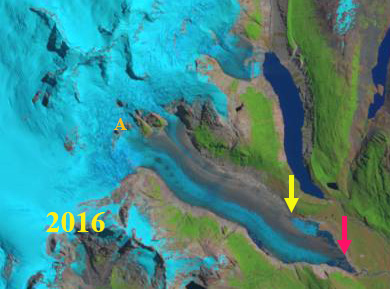
Tyndall Glacier change from 2013 to 2022 in Landsat images indicating the limited retreat and lake expansion.

Tyndall Glacier on April5, 2023 in Sentinel imagery indicating rift and iceberg.