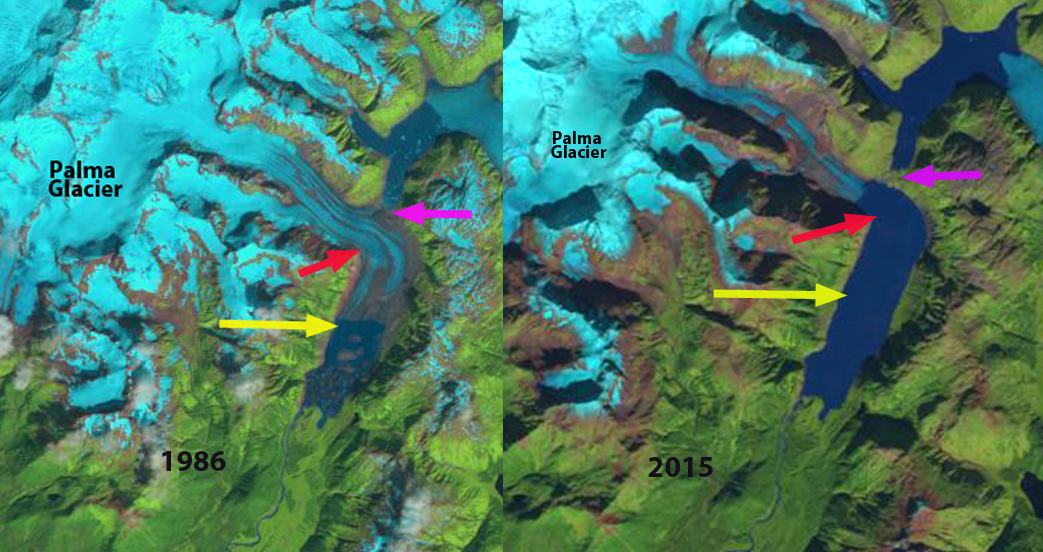
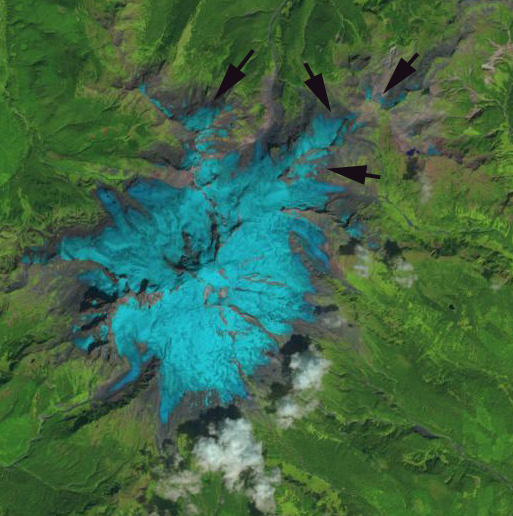
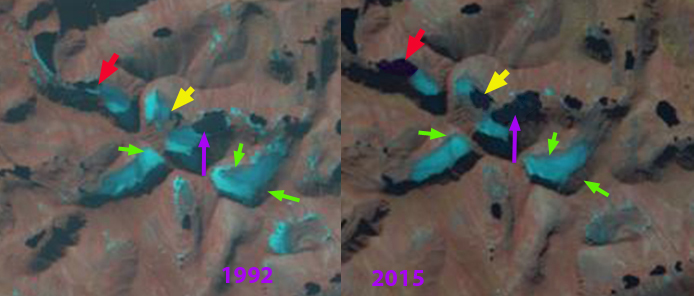
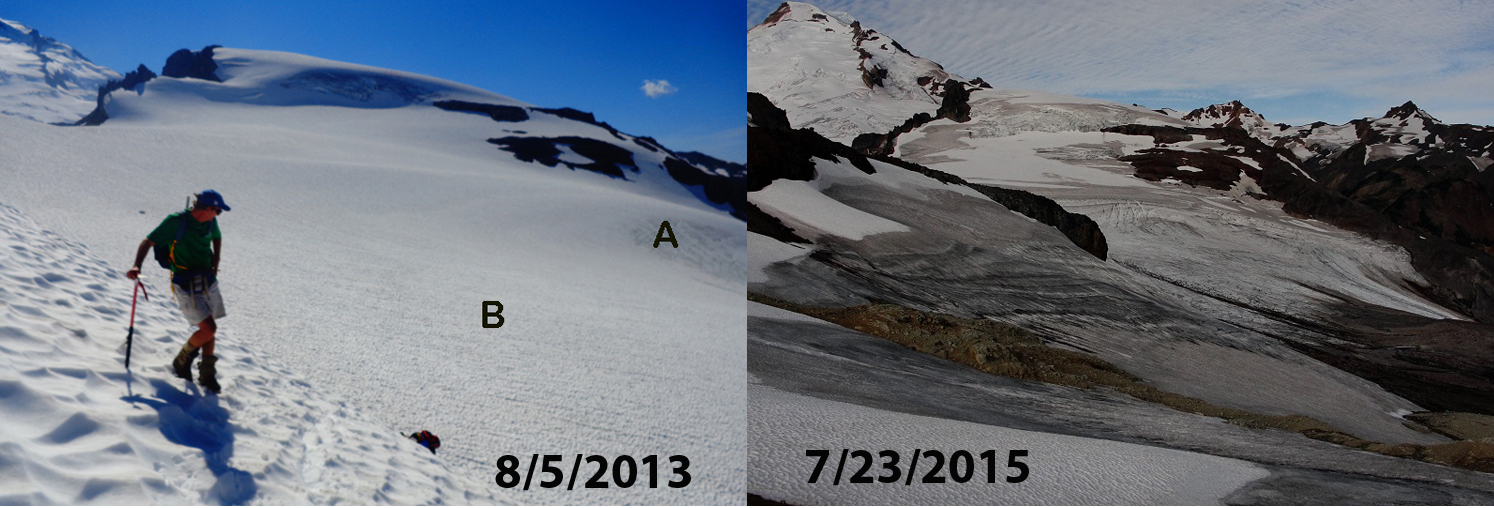
Landsat comparison of terminus area of Fingers Glacier 1986 and 2015
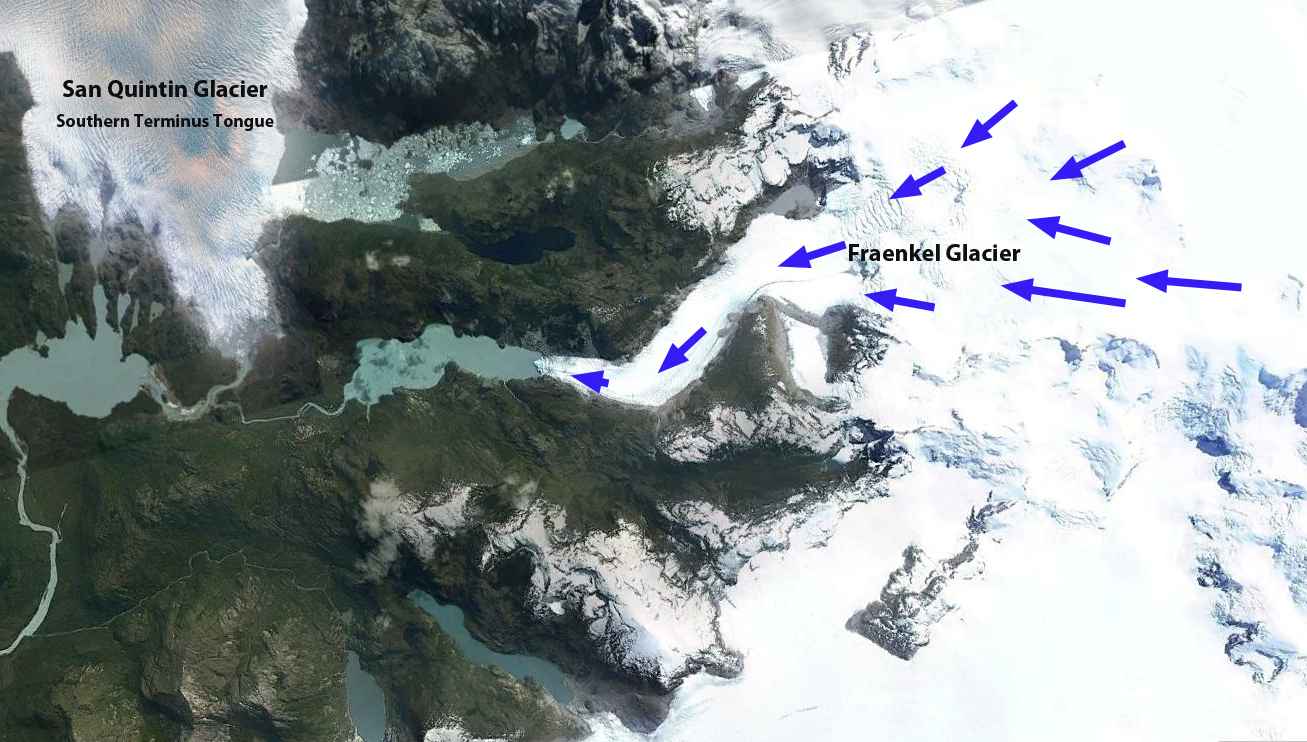
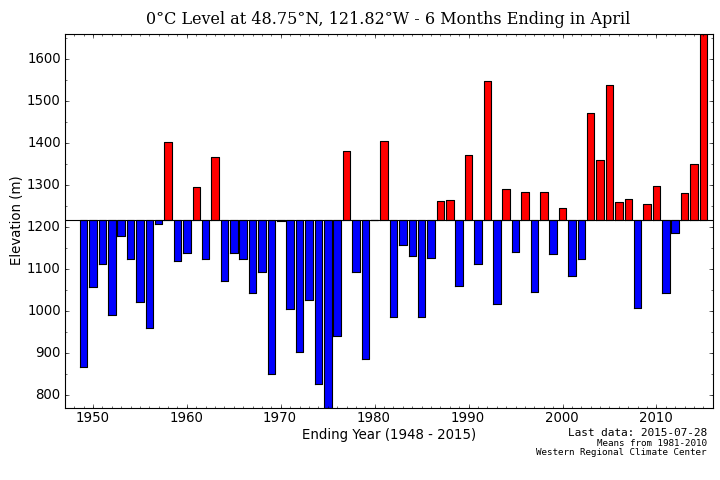
Fingers Glacier flows from the southern end of the Fairweather Range to the coastal plain, where is expands into a segmented piedmont lobe. The southernmost finger is heavily debris covered. In the Mount Fairweather B-4 quadrangle USGS map based on 1951 aerial photographs the glacier has four prominent fingers each eroding its own basin. Here we examine Landsat imagery to illustrate the changes in this glacier from 1951 to 2015. From 1950-1980 glacier’s just to the north In Lituya Bay were advancing. The La Perouse Glacier its immediate neighbor to the north was stable. Palma Glacier directly to the southeast has retreated throughout the 1950-2015 period. Larsen et al (2015) identify that from 1994-2013 this region of Alaska is a significant source of glacier volume loss and hence contributor to sea level rise. The loss of 75 gigatons per year from glaciers in southern Alaska was determined in this study to be largely from surface melt not from calving losses. The mass balance of both Taku and Lemon Creek Glacier of the Juneau Icefield have had a notable decline in mean mass balance from 1986-2015 versus the 1951-28985 period (Pelto et al, 2013). The nearby Brady Glacier also experience a higher snowline (Pelto et al, 2013b) which led to volume losses quantified by Larsen et al (2015).

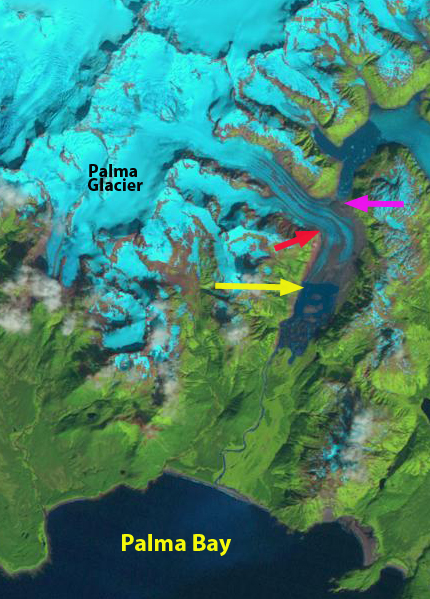
USGS map based on 1951 images
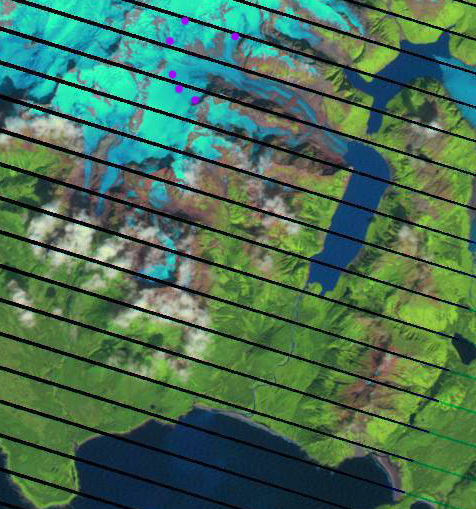
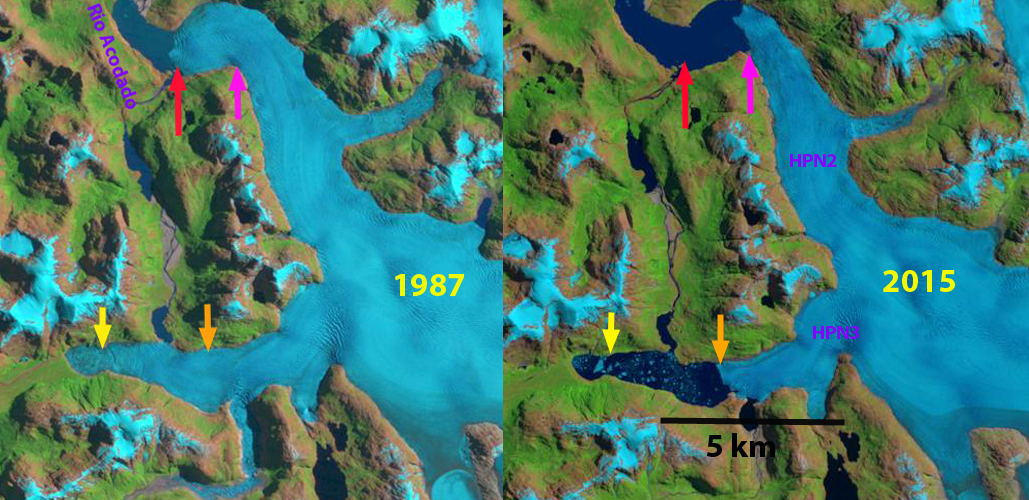
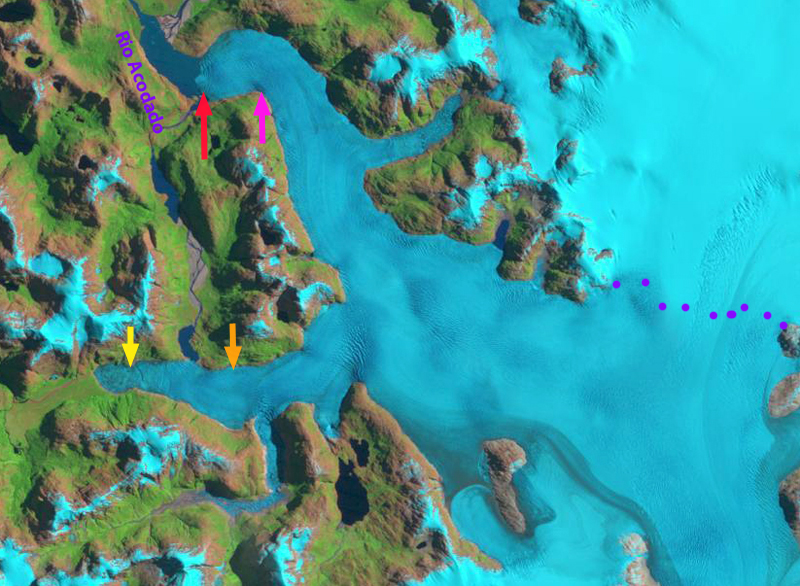
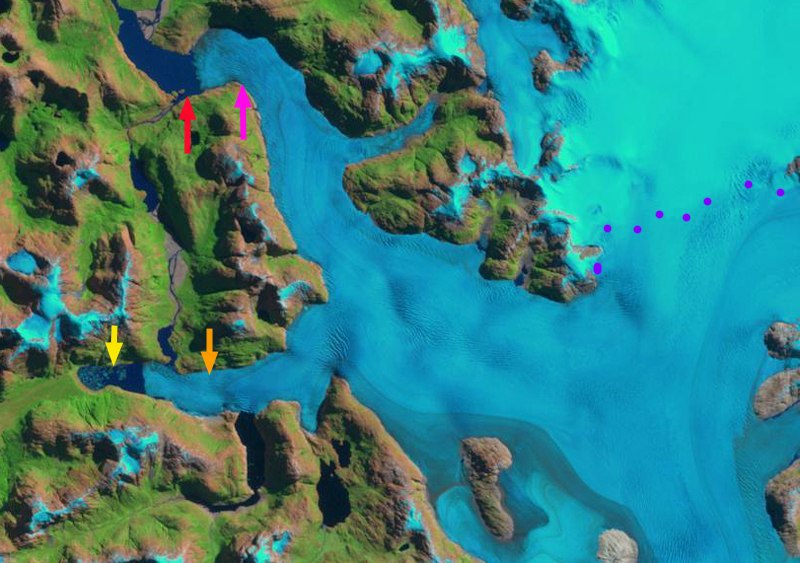
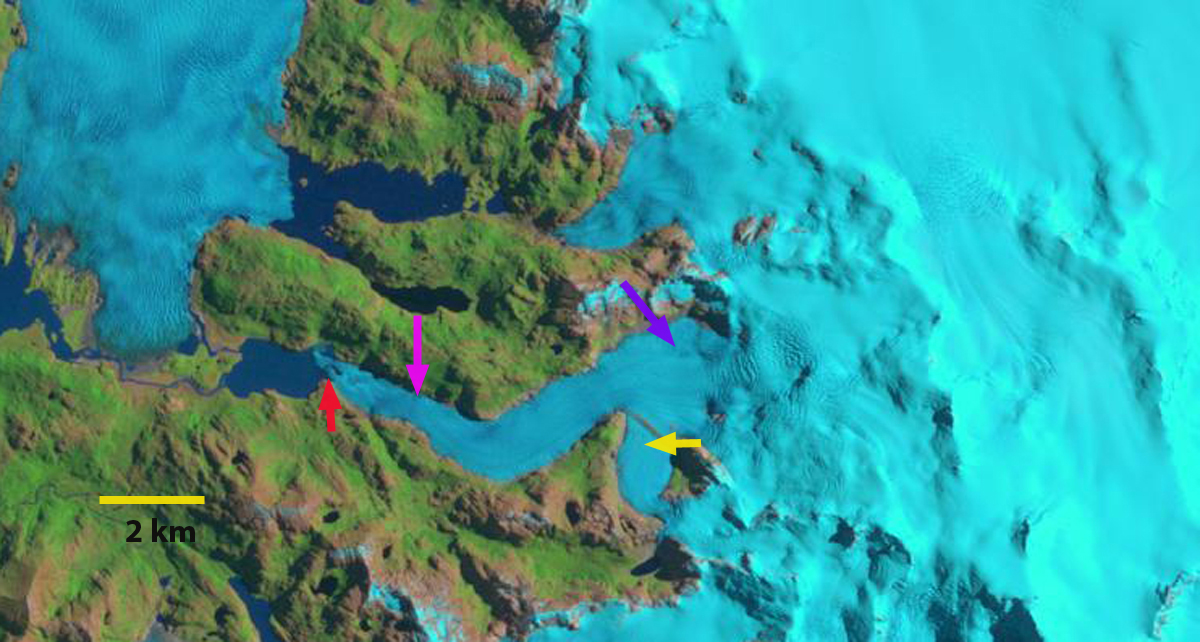
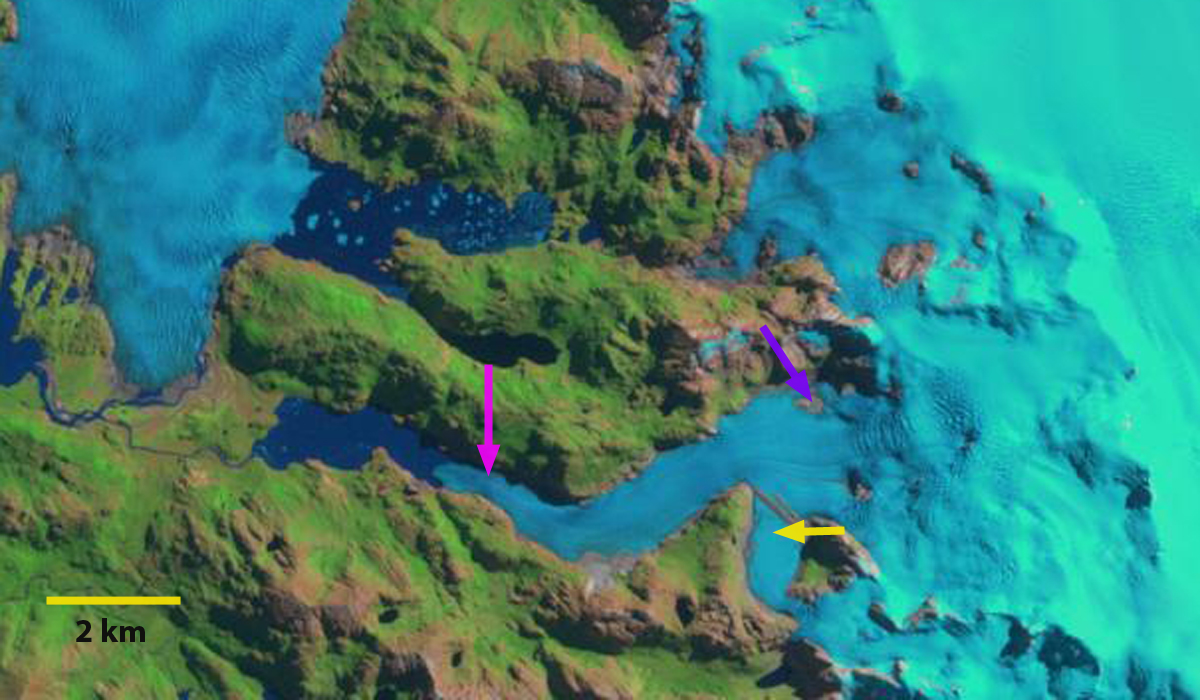
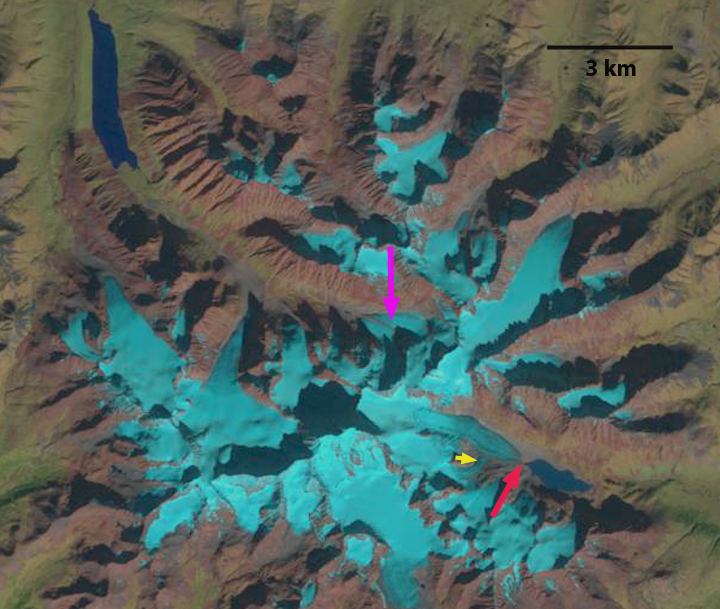
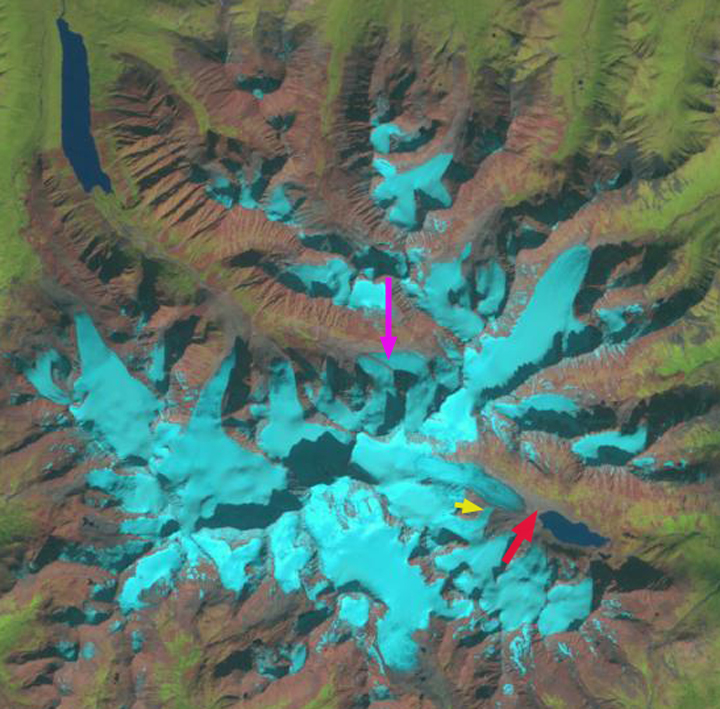
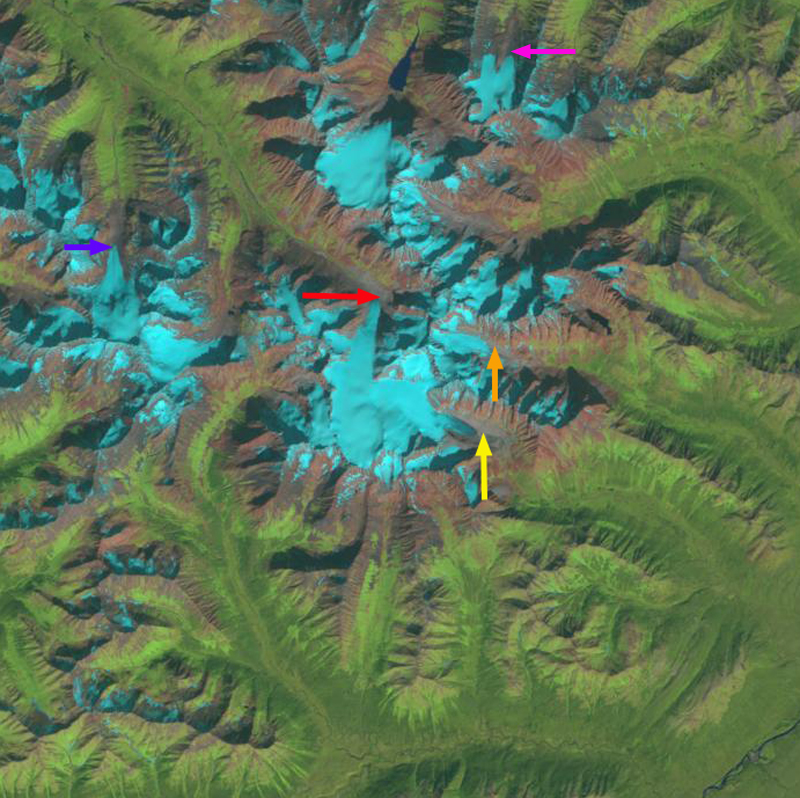
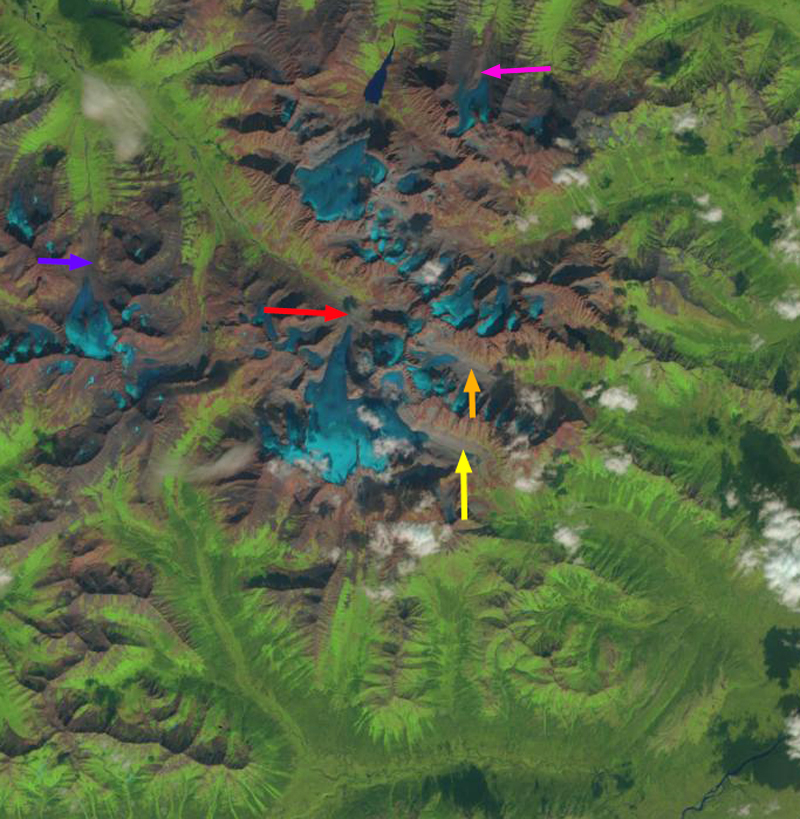
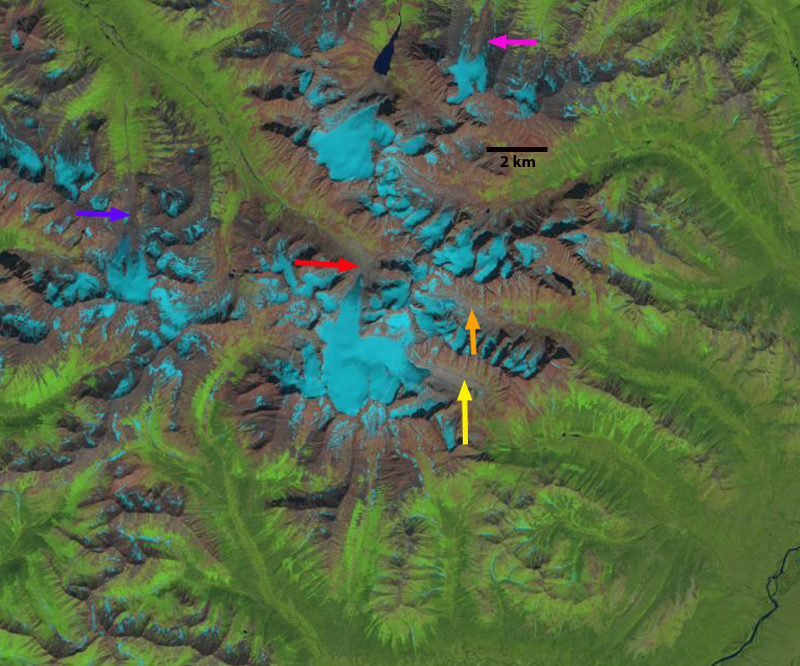
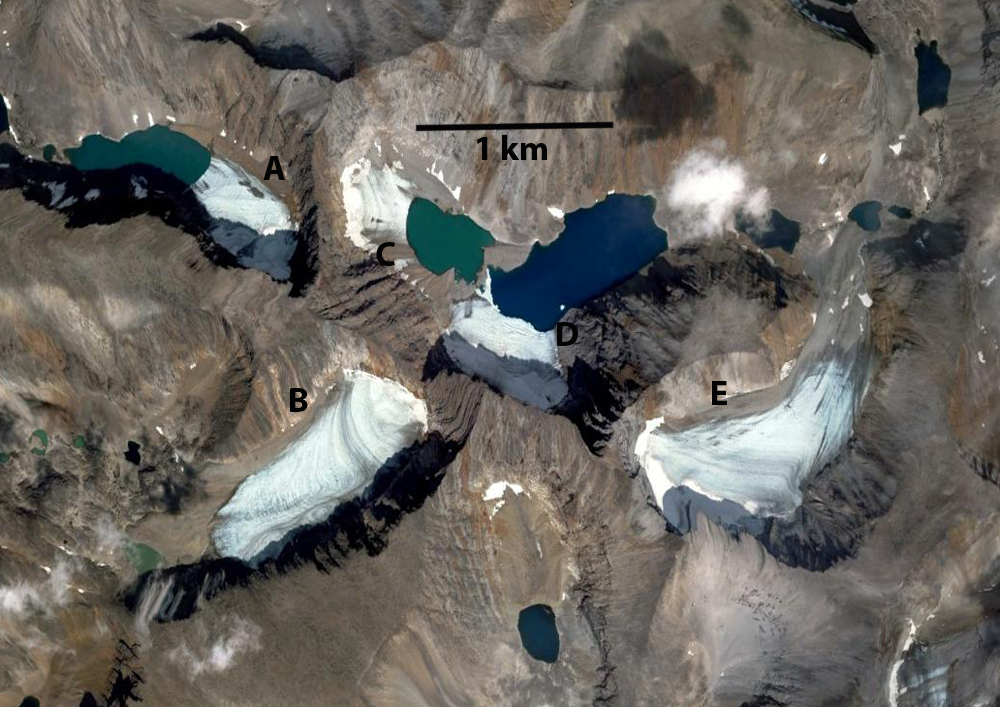
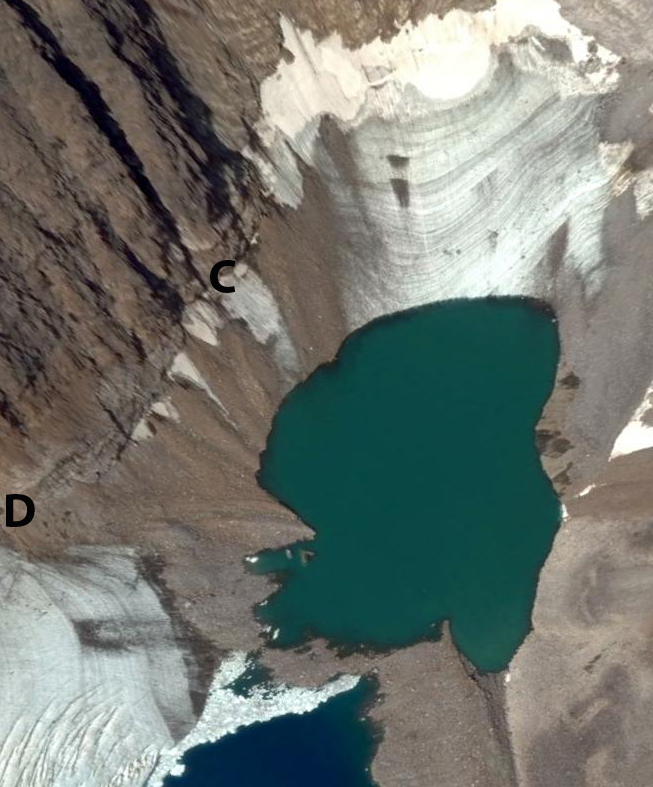
By 1986 the glacier still had four fingers with retreat from the 1951 position yellow arrow to the 1986 position red arrows. Retreat was 900 m for the first finger, 400 m for the second finger, 300 meters for the third and 400 meters for the fourth southernmost finger. A new lake had developed at the second finger, well lake expansion occurred at the first and third finger. By 1999 a lake is beginning to form at the fourth finger. In 2015 the first finger has retreated 600 meters in 30 years. The second finger has disappeared after a 700 m retreat from 1986-2015.. The third finger has lost half of its length to the expanding lake, a retreat of 600 m in 30 years. The fourth finger which is the most debris covered, leading to slower thinning, has retreated 600 meters since 1986, with a lake at the terminus that is continuing to expand.

1986 Landsat Image

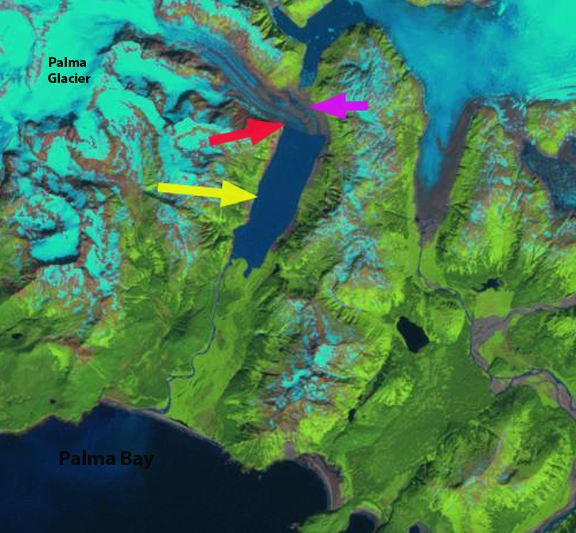
1999 Landsat Image

2015 Landsat Image

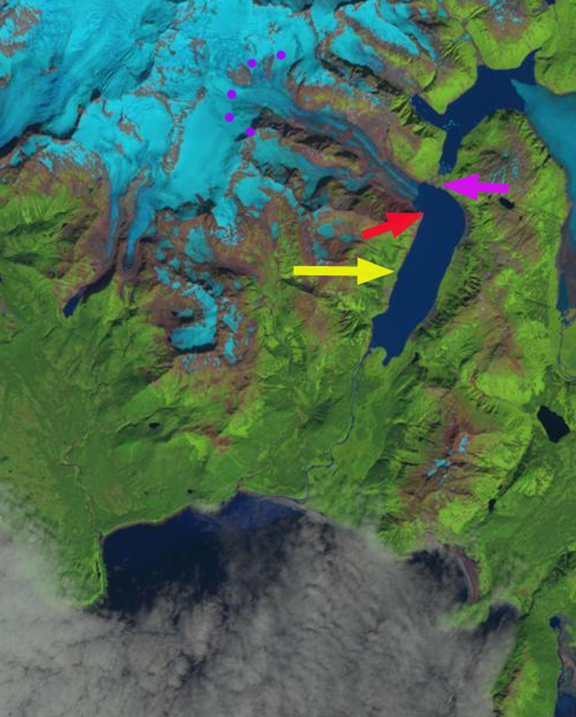
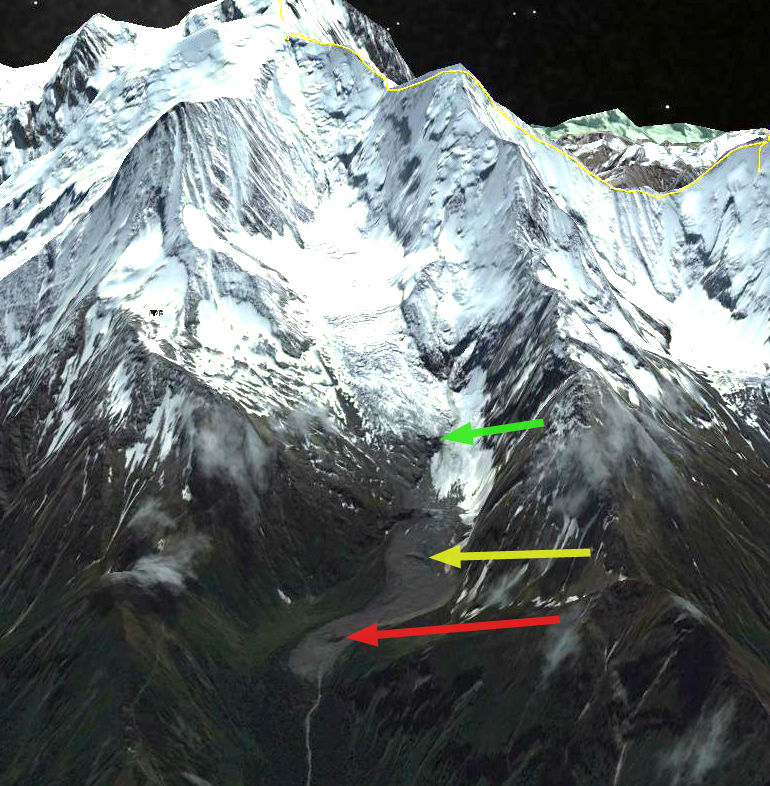
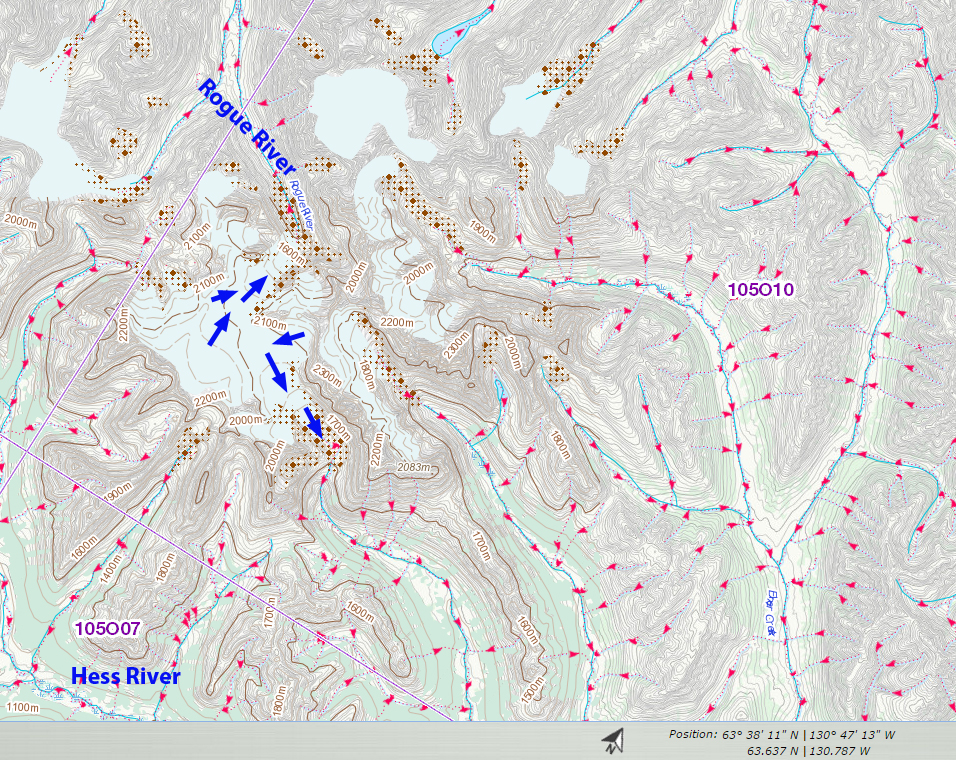
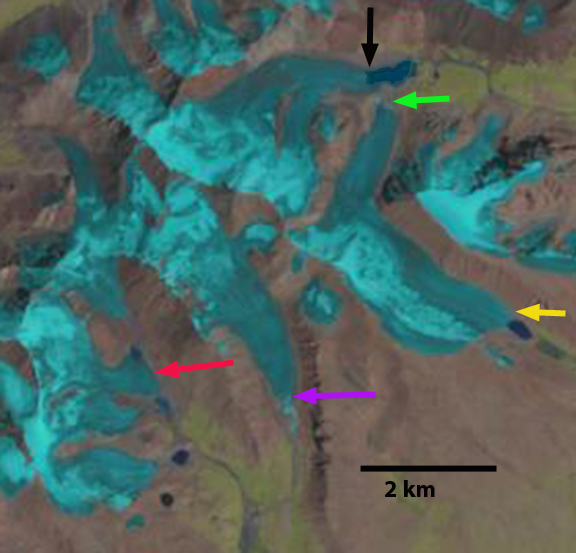
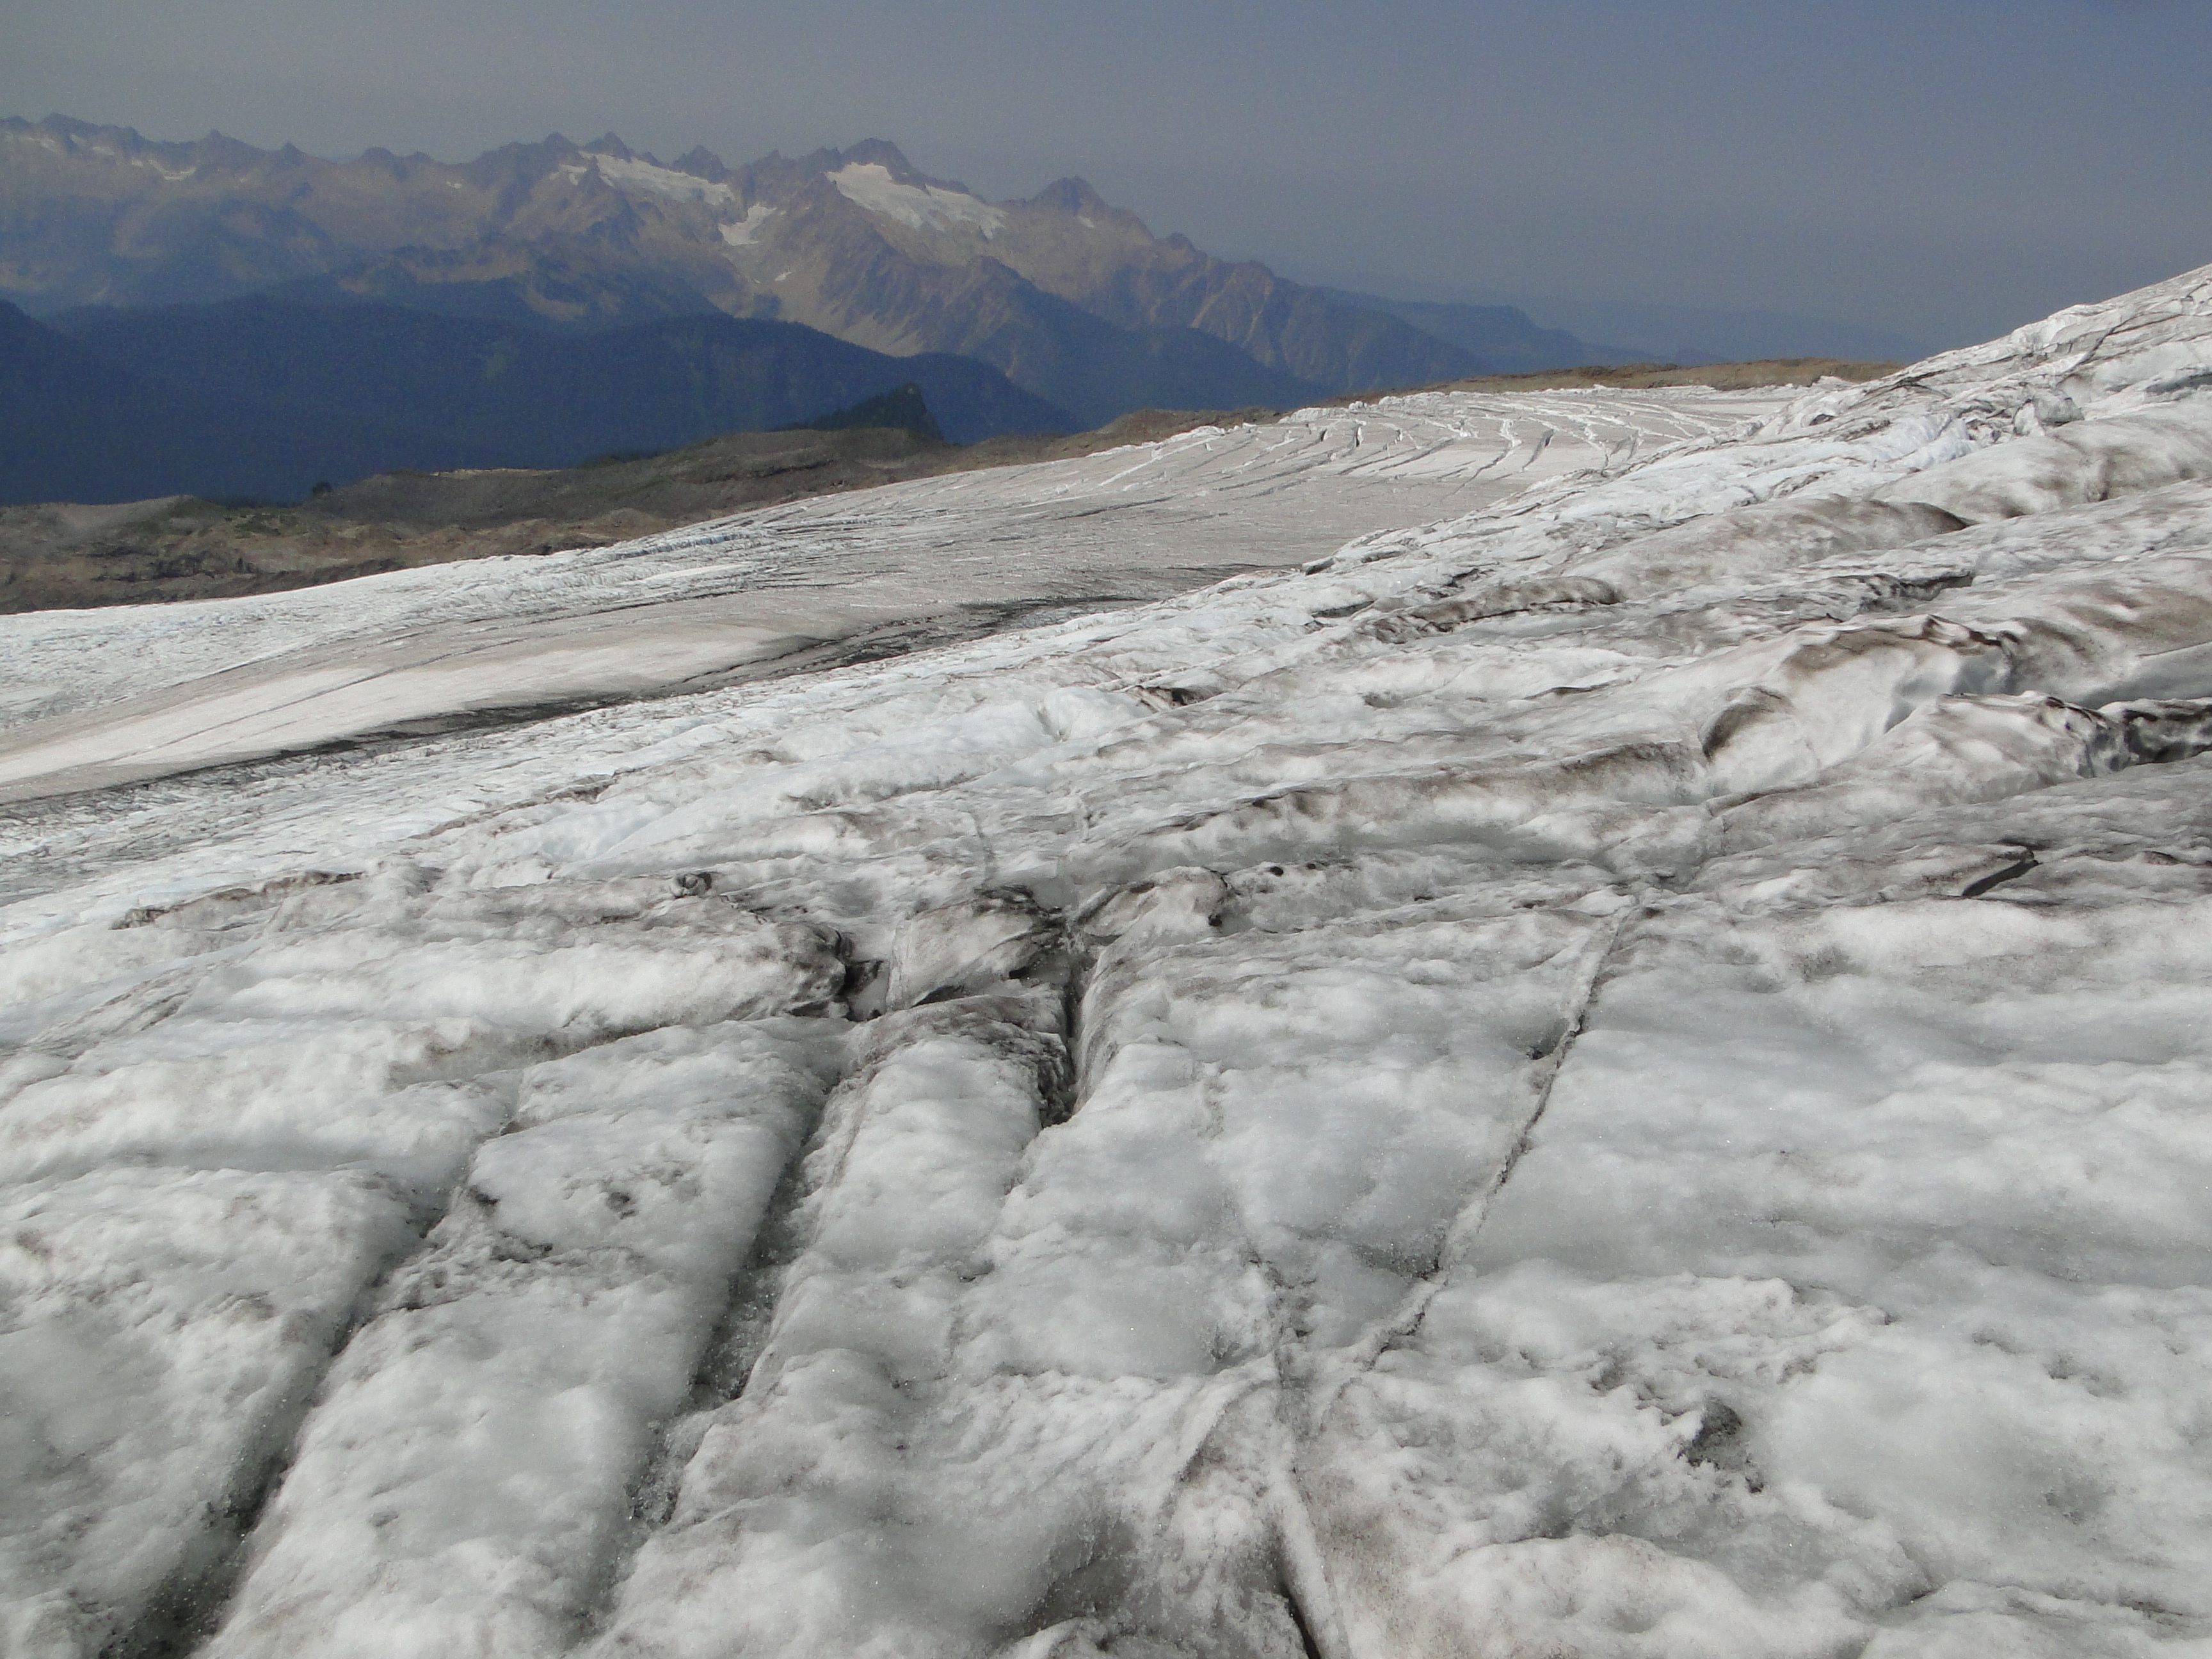
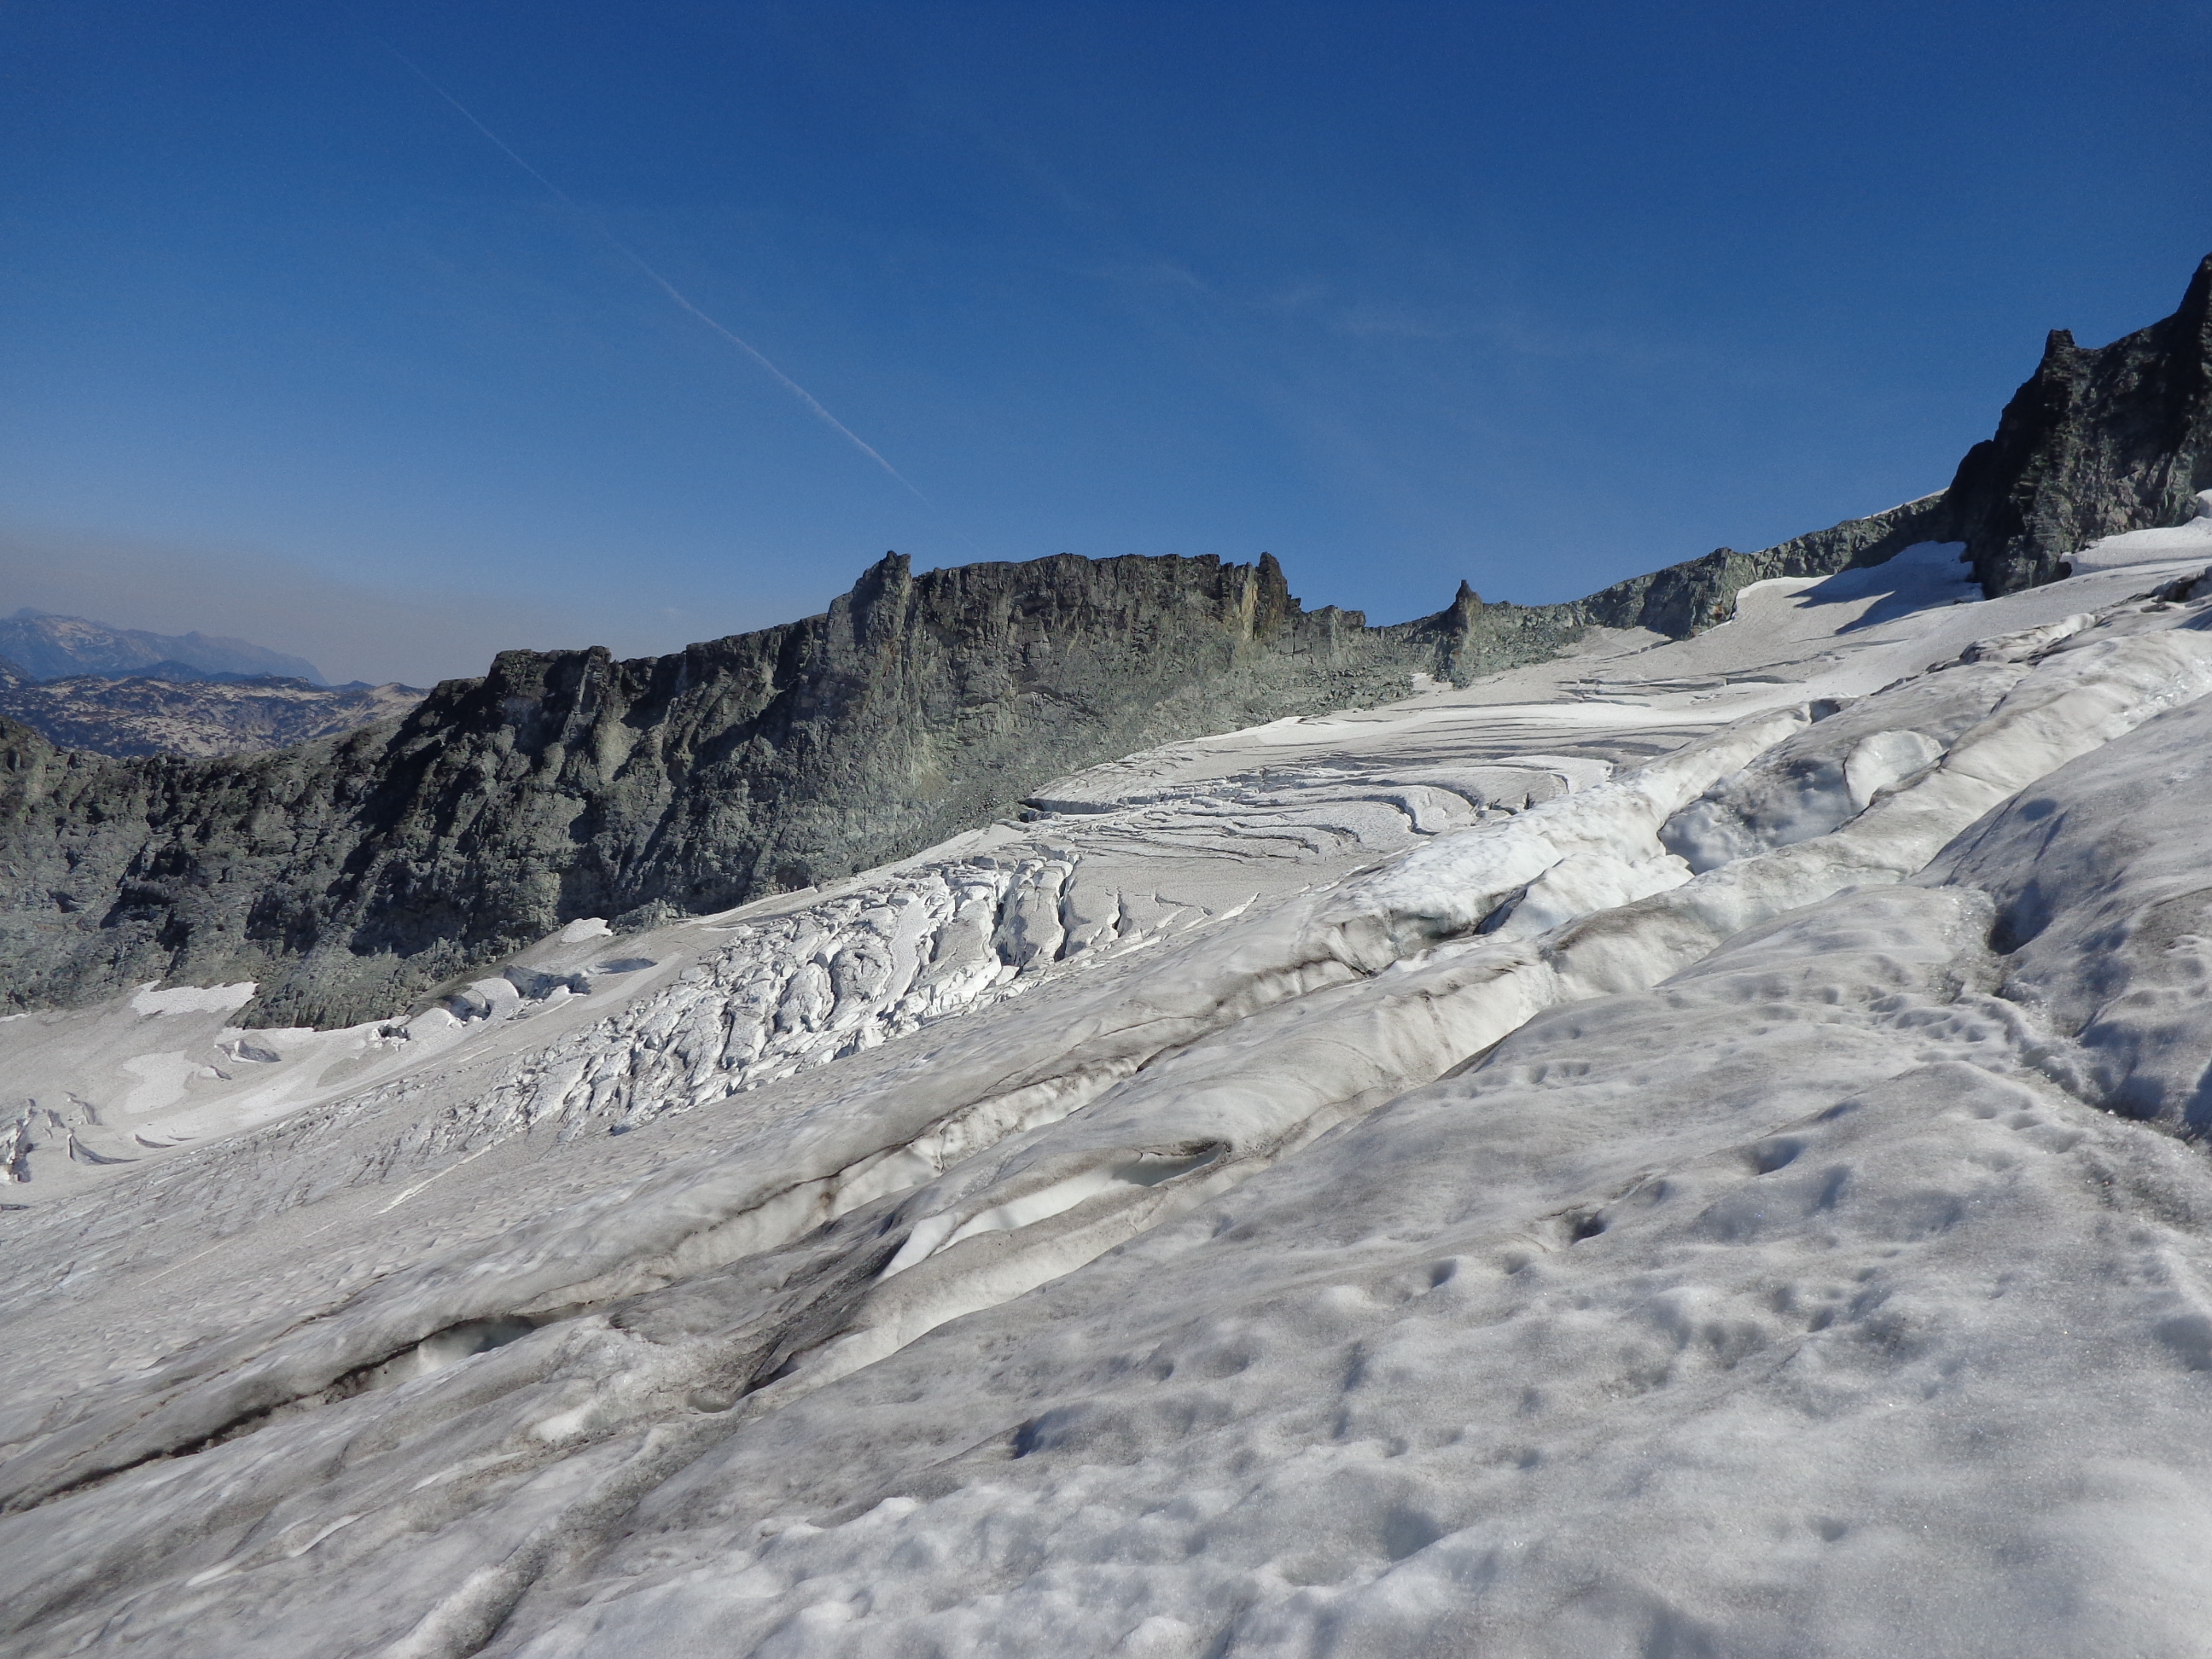
Google Earth Image indicating flowlines.