Suatisi Glacier Retreat, Mount Kazbek, Georgia

Suatisi compare

Comparison of Suatisi Vost (SV) and Suatisi Sredny (SS) in 1986 and 2015 Landsat images.  The red arrow is the 1986 terminus and the yellow arrows the 2015 terminus.  Point A and B are to areas of expanding bedrock amidst the glacier. 

Suatisi Vost and Suatisi Sredny Glacier are two glaciers on the south flank of Mount Kazbek in northern Georgia.  The region is prone to landslides and debris flows. On September 20, 2002 a collapse of a hanging glacier from the slope of Mt Dzhimarai-Khokh onto the Kolka glacier triggered an avalanche of ice and debris that went over the Maili Glacier terminus then slid over 15 miles (NASA Earth Observatory, 2002). It buried small villages in the Russian Republic of North Ossetia, killing dozens of people. The glacier runoff from Suatisi Glacier supplies the Terek River, which has a hydropower project under construction.  The Dariali Hydroplant will have an installed capacity of 108 MW and is a run of river type plant near Stepantsminda, Georgia. This plant has suffered from two landslides in 2014 (Glacier Hub, 2014) that jeopardize its completion.

Shagadenova et al (2014) examined glaciers in the Caucasus mountains and found that from 1999/2001 and 2010/2012 total glacier area decreased by 4.7%. They also noted that recession rates of valley glacier termini increased between 1987– 2000 and 2001–2010, with the latter period featuring retreats averaging over 10 m/year.  A positive trend in summer temperatures forced glacier recession (Shagadenova et al 2014). Here we examine changes in Suatisi Glacier from 1986 to 2015 with Landsat imagery.

In 1986 Suatisi Vost western side terminates at the top of deep canyon, red arrow.  The eastern side of the terminus is on a flatter till plain.  The area around Point B is all glacier ice.  Suastisi Sredny terminates near the end of the valley it occupies in 1986.  In the 2001 image a large debris flow/landslide has covered the eastern margin of Suatisi Vost surrounding the area of Point B, black arrow in 2001 image below.  By 2010 the Google Earth image indicates significant retreat of Suatisi Vost and the debris flow below point B is a light gray color. The bedrock at Point B has expanded.   By 2015 Suatisi Vost terminus has retreated 350 m since 1986, what is just as evident is the loss in width of the terminus in the 1986-2015 side by side comparison. Suatisi Sredny has retreated 450 m.  The snowline is at an elevation of 3750-3800 m in 1986, 2010 and 2015. With the terminus at 3250 m and the highest elevation at 3950-4000 m, this is too high to sustain the glacier at its current size and retreat will continue. The debris cover has reached the terminus on the east side of the glacier by 2015. The changes are the same across the border in Russia, for example Lednik Midagrabin.

suatisi ge

2010 Google Earth image of Suatisi Vost and Suatisi Sredny.  

suatisi 2001

2001 Landsat image indicating the landslide covering surface of Suatisi Vost.

suatisi j2015

2015 Landsat image indicates Landslide deposit evolution, with movement downglacier and retreat, it is now close to the ice front on the east side of the margin.

Canadian Columbia Basin Glacier Spring 2016 Field Season (winter 2015-2016 Assessment)

Guest Post by Ben Pelto, PhD Candidate, UNBC Geography, pelto@unbc.ca

During the spring season we visited our four study glaciers (Figure 1), which form a transect of the Columbia Mountains from the Kokanee Glacier in the Selkirk Range to the south, to the Conrad (Purcells) and Nordic (Selkirks) in the center, to the Zillmer of the Premier Range in the north. This post will explore the snowpack of winter 2016 across the Columbia Basin of British Columbia. For a video of the work this spring see here.

1

Figure 1. Map of the Columbia watershed basin in Canada. Our four study glaciers are red stars, and other glaciers are teal, per the Randolph Glacier Inventory. Major rivers and lakes are blue.

Winter 2015-2016 Snowpack Summary: Early winter, September-December, 2015 brought a number of Pacific storms, in contrast to 2013 and 2014 which featured few storms and relatively dry conditions. By January 1st, snowpack across the province was near-normal, though a strong north-south gradient was observed, with above average snowpack in the south, average snowpack in central BC and well below average snowpack in the north (provincial snowpack was below normal Jan. 1st, 2015; BC River Forecast Centre). February was warm and wet, with daily temperatures 1 to 5˚C above normal. By the beginning of March, snowpack was below average over most of the province north of Prince George and Bella Coola and near or above average to the south.

Snow continued to accumulate in March, but primarily at higher elevations due to above average freezing level heights. The height of freezing levels determines whether precipitation falls as snow or rain at a given elevation. Figure 2 shows that median freezing level height is 600 m above sea level for February at the Conrad Glacier, yet this February featured an average freezing level of 1300 m. This means that on average, in the month of February, snow fell above 1300 m and rain below 1300 m (of course this is an average and any one storm may be different).  Most glaciers in the Columbia Mountains are located above 2000 m elevation, and in the winter of 2014-2015, freezing levels were often near or above the height of many of the peaks in the Columbia Mountains (3000 m), allowing for rain on snow events. Such events were reportedly rare in 2015-2016 winter until April/May, despite the fact that freezing level heights were record high for December-April (Figure 3).

2

Figure 2. Estimated freezing level height (elevation of 0˚C) for the Conrad Glacier from June 2015-May 2016. Note that February-April 2016 were at or above the 95th percentile, meaning that there is less than a 5% chance that the freezing level heights will be that high given the data from 1948-2016 from which the median height is derived. Freezing levels are estimated from NCEP/NCAR Global Reanalysis data determined every six hours from 1948-present (North American Freezing Level Tracker).

3

Figure 3. Estimated mean freezing level height (elevation of 0˚C) for December-April from 1948-present for the Conrad Glacier (North American Freezing Level Tracker). Note that 2016 is the year of record. Freezing levels are estimated from NCEP/NCAR Global Reanalysis data determined every six hours from 1948-present.

Warm temperatures experienced in February continued through March and April across the province. By April 1st, provincial snowpack was near-normal at 91% of average (Figure 4). The north-south gradient in snowpack grew, with the southern half of the province at or above average, and the northern half below average. Typically, May 1st marks the peak of snow accumulation, and the melt season ensues. In 2015, the melt season began in mid-April, 1-3 weeks early. The 2016 melt season began earlier still, coming in late March/early April, 4-6 weeks early. Figure 5 shows that for the East Creek snow pillow near the Conrad Glacier, snowpack peaked in late March at around 120% of normal. Early maximum snow depth occurred due to a combination of dry, warm conditions. Typically, small precipitation events continue to add snow to alpine environments through April, and by swapping precipitation for dry, warm conditions, the snowpack began to decline in earnest in late March/early April.

4

Figure 4. British Columbia Snow Survey Map for April 1st, 2016 (BC River Forecast Centre). Note that snowpack is roughly average in the south and 50-75% of average to the north.

5

Figure 5. Automated snow pillow data showing snow water equivalent (SWE, amount of water obtained if all the snow were to be melted per unit area) for East Creek, near the Conrad Glacier at 2004 m elevation. Note that peak SWE was 4-6 weeks early, but was around 120% of normal at the time, followed by rapid melting (BC River Forecast Centre).

By May 15th, provincial snowpack was 39% of normal (Figure 6), a rapid decline from near average mid-winter snowpack. The north-south gradient also largely disappeared, though the three basins doing the best were the North and South Thompson, and the Upper Columbia at 70-86% of normal. Interestingly the Upper Columbia contains three of our four study glaciers. The May 15th provincial average of 39% is a new record low (measured since 1980, BC River Forecast Centre). May 15th snowpack is more typical of mid-June, indicating that snow melt is about four weeks ahead of normal. Most rivers are past the spring freshet, and discharge has begun to recede. The early freshet will put pressure on summer low flows across the province in snow-melt dominated rivers.

6

Figure 6. British Columbia Snow Survey Map for May 15th, 2016 (BC River Forecast Centre). Note that snowpack that was roughly average in the south as of April 1st is now well below average, and 50-75% of average to the north.

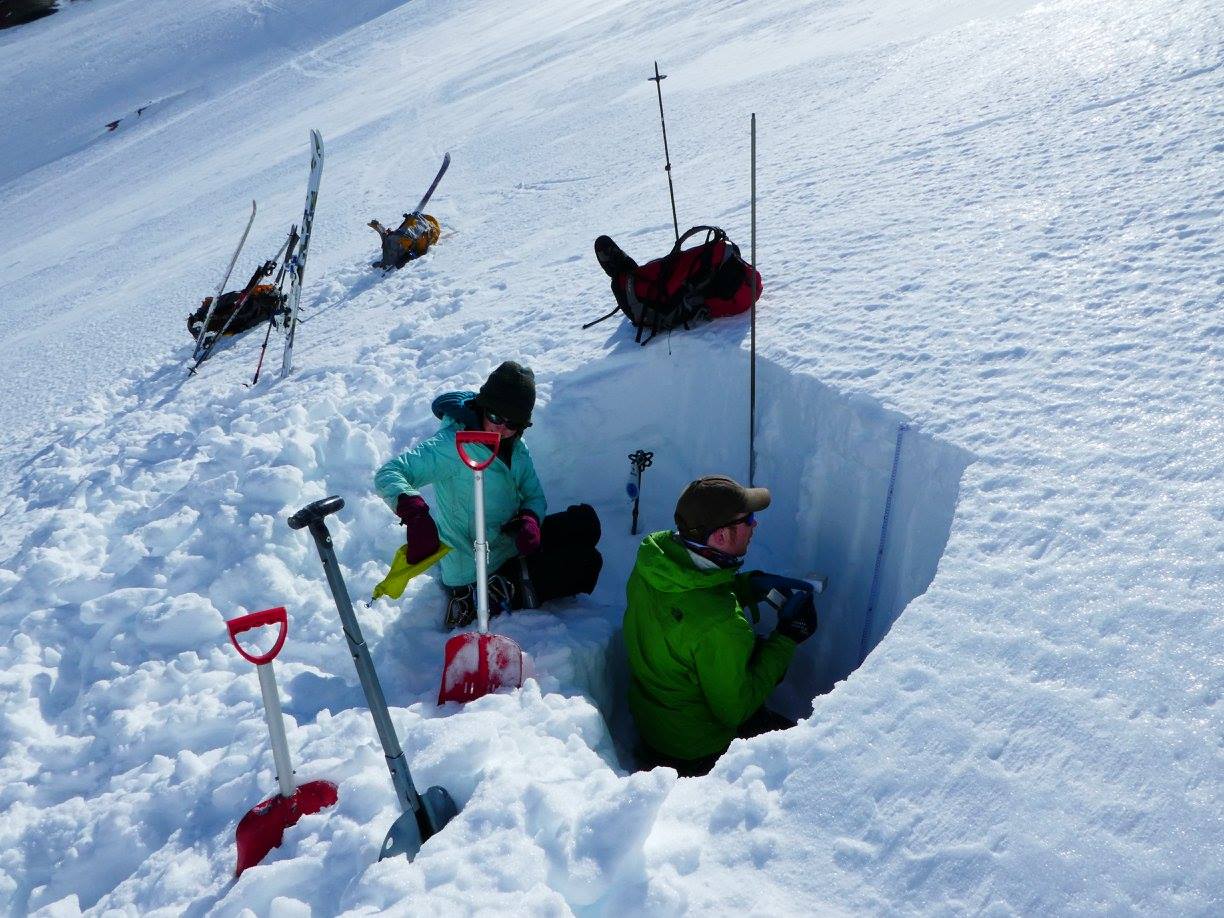
Field Work Overview—What we do: The primary goal of the spring field season is to determine how much snow fell over the winter on the four study glaciers. To do so, we take snow depth measurements using a heavy-duty avalanche probe. Snow depth is valuable information, but snow water equivalent (SWE; if you melted the snow in a given location, this would be the depth of water left behind per unit area) is the key to understanding how much water the snow contains. As you can imagine, a meter of powdery snow may contain only 10 cm of water, whereas a meter of wet snow may contain 30 cm of water. To measure density, we either take a snow core (think a tube of snow…like an ice core, except snow instead) and cut samples to weigh, or we dig a snow pit and then take samples from a wall in the snow pit. By combining measurements of density and depth, we are able to calculate SWE over the entire glacier. A typical end of winter SWE for a Columbia Basin glacier would be around 2 meters water equivalent, which would be roughly 4.5 meters of snow. By knowing how much snow covers the glacier, we know how much mass the glacier gained during the winter. At the end of the summer, we visit the glaciers again, and we measure how much melt occurred. By combining the winter accumulation of snow, and summer melt of snow and ice, we can determine how much the glacier gained or lost during the year. Figure 7 is an illustration of the product of depth and density measurements, and displays the relationship of elevation and accumulation over the Conrad Glacier. To see what we do watch: https://www.youtube.com/watch?v=wWYJdQnRq5k

8

Figure 7. Winter balance gradient for the Conrad Glacier in millimeters water equivalent per meter of elevation. Snow depth increases with elevation linearly, except in topographically complex areas, and nearest the top of the glacier (3200 m). Most of the glacier area is between 2000-3000 m.

We also are flying LiDAR surveys of our study glaciers. LiDAR is a laser sensor mounted on the bottom of an aircraft. The LiDAR unit essentially shoots rapid laser pulses, each pulse hits the surface and returns to the sensor. The time it takes for the signal to travel to the surface and back tells us the distance from the plane to the ground. With this data, we can make a detailed 3-D map of the glacier surface. This map is accurate to 10-25 cm in the vertical, and 50 cm laterally. By collecting this data biannually (spring and fall) we can determine how much snow fell, or melt occurred by subtracting subsequent 3-D maps from one another (e.g. by subtracting a September map from an April map of the same year, we can determine how much melt happened between the two flights). This data offers the ability to be able to cover far larger areas than is feasible for fieldwork.

By comparing our field data with the LiDAR data, we can determine whether the LiDAR is capturing the reality on the ground, and if the field data is able to represent spatial variability in snow depth. Our LiDAR flights occur over a day or two, whereas our field data are collected over a month. In order to directly compare both, we conduct a GPS survey of the glacier surface along the center of the glacier. We then compare the difference in elevation between the survey and the LiDAR and thus can account for any melt or accumulation that occurred in the intervening days or weeks.

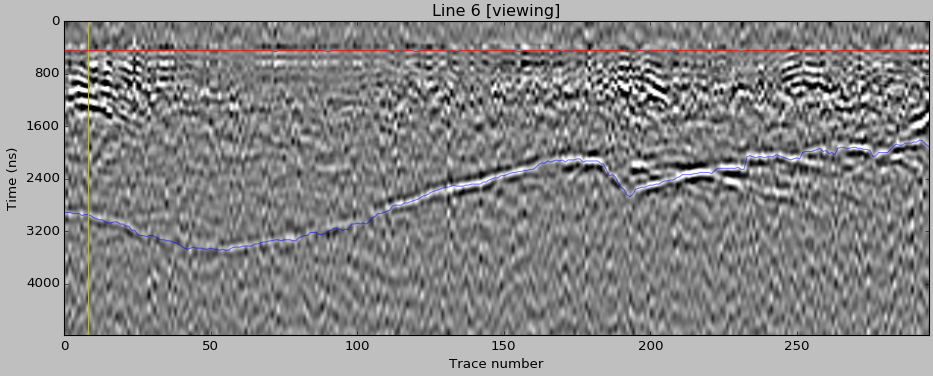
This spring we also collected data using a Ground Penetrating Radar (GPR) which transmits high-frequency radio waves into the ice. When the radio waves encounter a buried object or a boundary between materials, then it is reflected back to the surface where a receiving antenna records the signal. In our case, the bedrock surface below the ice is the surface/boundary we are looking for. Once we pick out the bedrock surface from the data, then the signal and travel time are used to then determine the ice thickness (Figure 8). Ice thickness is important for determining how long a glacier will survive as well as putting current rates of ice loss in perspective. We still have a lot of data to collect and process, but it seems that smaller glaciers like the Nordic and Zillmer (~5 km2) are 50-90 m thick in general, larger glaciers like the Conrad (16 km2) average 100-200 m thick.

7

Figure 8. Ground Penetrating Radar data from the Conrad Glacier. The blue line marks the bedrock surface and the red line marks the airwave, which defines the glacier surface. Between the lines is glacier ice. The longer the signal travel time, the deeper the ice. For this line, the deepest point is 220 m ice depth, and the shallowest 115 m.

Field Season Stats:

  • Snow Depth Measurements: 161 discrete locations, 600+ individual measurements
  • Snow Pits and Cores (Density): 15
    • The combination of snow depth and density allow for calculation of SWE
  • Ground Penetrating Radar (GPR) Distance (Ice thickness, Figure 3): Roughly 75 km
    • GPR data allows for the calculation of ice thickness and ice volume
  • Distance Skied: 200+ km
  • Field Team Members: 8; UNBC, CBT, UBC, ACMG.
  • Glaciers with both field and LiDAR data: 4/4
  • GPS Surveys (to corroborate field/LiDAR data comparison): 4
  • Days on a Glacier: 18

Season Summary: Our data indicate that winter mass balance featured a north-south trend, with the Kokanee Glacier in the south equaling last year’s mass balance, the central region was 85% of 2015 (Conrad and Nordic), and the Zillmer in the north was around 80%. The 4-6 week head start on melt season led to higher snow density in 2016 than observed in 2015. This summer melt season will determine whether the record/near record negative mass balance seen across the region in 2015 will be rivaled or exceeded in 2016. The hot, early spring has primed the region to again break records.

Chutanjima Glacier Retreat & High Snowline, Tibet, China 1991-2015

mugunong glacier tibet compare

A comparison of three Tibet glaciers in 1988, 1991 and 2015 Landsat images. Red arrows are the 1988 terminus position, yellow arrow the 2015 terminus location and purple dots the snowline in late October 2015.  U=unnamed, CH=Chutanjima Glacier and MO=Mogunong Glacier: which did not retreat significantly and lacks a red arrow.

A recent European Space Agency Sentinel-2A image of southern Tibet, China and Sikkim illustrated three very similar glaciers extending north from the Himalayan divide on the China-India Border. We examine these three glacier in this post. The three glaciers all drain into the Pumqu River basin, which becomes the Arun River. The largest is unnamed the two easternmost are Chutanjima and Mogunong Glacier.The glaciers all have similar top elevations of 6100 -6200 m and terminus elevations of 5260-5280 m.  All three are summer accumulation type glaciers with most of the snow accumulating during the summer monsoon, though this is also the dominant melt period on the lower glacier.  Wang et al (2015) examined moraine dammed glacier lakes in Tibet and those that posed a hazard, none of the three here were identified as hazardous.  The number of glacier lakes in the Pumqu Basin has increased from 199 to 254 since the 1970’s with less than 10% deemed dangerous, but that still leaves a substantial and growing number (Che et al, 2014). Here we compare Landsat images from 1988, 1992  and 2015 to identify their response to climate change.   The second Chinese Glacier inventory (Wei et al. 2014) indicated a 21% loss in glacier area in this region from 1970 to 2009.The pattern of retreat and lake expansion is quite common as is evidenced by other area glaciers, such as Gelhaipuco, Thong Wuk, Baillang Glacier and Longbashaba Glacier.

In the 1988 image all three glaciers terminate at the southern end of a proglacial lake with seasonal lake ice cover, red arrows.  In 1991 the lakes are ice free and have some icebergs in them.  By 2015 the retreat has been 500 m for the easternmost glacier, 400 m for Chutanjima Glacier and 100 m at most for Mogunong Glacier. Each glacier has remained extensively crevassed to the terminus indicating they remain vigorous.  The retreat is greatest for the two ending in expanding lakes.  Mogunong Glacier appears to be near the upper limit of the lake, and is not calving, which likely led to less retreat. An icefall is apparent 700 m from the front of Mogunong Glacier.  The width of the glacier below this point has diminished considerably from 1988 to 2015, though retreat has been minor, indicating a negative mass balance.  There is an icefall 1 km from the icefront of Chutanjima, indicating the maximum length the lake would reach.

The Sentinel image indicates an important characteristic and trend in the region.  This is an early February image and the snowline is quite high on the glacier in the midst of winter.  The snowline is at 5850-5900 m nearly the same elevation as in late October of 2015 seen above. This illustrates the lack of winter accumulation that occurs on these summer accumulation glaciers.  It also indicates a trend toward ablation processes remaining active, though limited from November-February.  The lack of snowcover on the lower glaciers as the melt season begins hastens ablation zone thinning, mass balance loss and retreat.

mugunong glacier 2016

Europenan Space Agency, Sentinel-2A image from 1 February 2016. Orange arrow indicates icefalls and purple dots the snowline.

mogunong ge
2014 Google Earth image of the region. Orange arrows indicate icefalls, note the crevassing extending to glacier front.

Brady Glacier, Alaska 2016 Early Melt Season & Lake Expansion

brady lake compare 2016

Comparison of Brady Glacier in 1986 and 2016 Landsat images.  The snowline is similar in May 2016 and August 1986. Lakes noted are: A=Abyss, B=Bearhole, D=Dixon, N=North Deception, O=Oscar, Sd=South Dixon, Sp=Spur, T=Trick.

Brady Glacier,  is a large Alaskan tidewater glacier, in the Glacier Bay region that is beginning a period of substantial retreat Pelto et al (2013). In 2016 the melt season has been intense for the Brady Glacier in Alaska. Pelto et al (2013) noted that the end of season observed transient snowline averaged 725 m from 2003-2011, well above the 600 m that represents the equilibrium snowline elevation. On May 20, 2016 the transient snowline (TSL) is at 500 m. Typically the TSL reaches 500 m in early July: 7/13/2004=530; 7/8/2005=550, 7/3/2006=500, 7/22/2007=520, 7/3/2009=500; 7/10/2013=500. The high early season snowline is indicative of an early opening and filling of the many proglacial lakes that secondary termini of the glacier end in. The lakes Trick, North Deception, Dixon, Bearhole, Spur, Oscar, and Abyss continue to evolve. In addition two new lakes have developed. The changes are evident in a comparsion of 1986 and 2016 Landsat images. The TSL on May 20/2016 is remarkably similar to the August 20, 1986 TSL.
base figure

2010 Landsat image of the glacier indicating the 1948 margin in Orange and the 2016 margin in yellow. Lakes noted are: A=Abyss, B=Bearhole, D=Dixon, N=North Deception, O=Oscar, S=Spur, T=Trick.

There is a consistent pattern in the change in position of the glacier margin at each of the lakes between 1948 and 2010. The rate of retreat of the glacier margin at all seven lakes accelerated later during this period; the mean retreat rate is 13 m/a from 1948 to 2004 and 42 m/a  from 2004 to 2010 (Pelto et al, 2013). Lake area and calving fronts were measured for each lake: Spur, Abyss, North Deception, Bearhole, Oscar, and East Trick based on the September 2010 imagery, with earlier measurements from Capps et al. (2010). Lake areas have increased as a result of glacier retreat, and can decrease due to declines in surface water levels as previously ice-dammed conduits form to drain the lake. Lake water levels have fallen in Abyss, Bearhole, Dixon, North Deception, Spur, and Trick since 1948 Capps et al (2010). Only Oscar Lake, the most recent to form, has maintained its surface level. Retreat of the glacier margin has been greatest at Bearhole, North Deception Lake, and Oscar Lake, which as a consequence have expanded substantially in area. Lake water level declines at Abyss, Spur, and Trick have offset the increase in area resulting from glacier retreat, leading to small changes in lake area. The seven lakes have changed dramatically in response to this acceleration in retreat.

Trick Lakes: In 1986 North and South Trick Lake are proglacial lakes in contact with the glacier. By 2016 the two lakes are no longer in contact with the glacier, water levels have fallen and a third lake East Trick Lake has formed. The more recently developed East Trick Lake is the current proglacial Trick Lake, a large glacier river exits this lake and parallels the glacier to the main Brady Glacier terminus, going beneath the glacier for only several hundred meters.

trick 2014

2014 Google Earth image of Trick Lakes, and the glacier river exiting to the main terminus, purple arrows.

North Deception Lake had a limited area in 1986 with no location more than 500 m long. By 2016 retreat has expanded the lake to a length over 2 km. The width of the glacier margin at North Deception Lake will not change in the short term, but the valley widens 2 km back from the current calving front, thus the lake may grow considerably in the future.

South Dixon Lake This new lake does not have an official name. It did not exist in 1986, 2004, 2007 or 2010. It is nearly circular today and 400 m in diameter.

Dixon Lake: It is likely that retreat toward the main valley of the Brady Glacier will lead to increased water depths at Dixon Lake, observations of depth of this lake do not exist. Retreat from 1986 to 2016 has been 600 m.

Bearhole LakeBearhole Lake is expanding up valley with glacier retreat, and there are no significant changes in the width of the valley that would suggest a significant increase in calving width could occur in the near future. Currently the lake is 75 m deep at the calving front and there has been a 1400 m retreat since 1986 Capps et. al. (2013).

Spur Lake:It is likely that retreat toward the main valley of the Brady Glacier will lead to increased water depths at Spur Lake. the depth has fallen as the surface level fell from 1986-2016 as the margin retreated 600 m, leaving a trimline evident in the 2016 imagery.

Oscar Lake has experienced rapid growth with the collapse of the terminus tongue. Depth measurements indicate much of the calving front which has increased by an order of magnitude since 1986 is over 100 m. The tongue as seen in 2014 Google Earth image will continue to collapse and water depth should increase as well. The central narrow tongue has retreated less than 200 m since 1986, but the majority of the glacier front has retreated more than 1 km since 1986.

oscar 2014

Google Earth image of Oscar Lake, illustrating the number of large icebergs of this ongoing terminus collapse.

Abyss Lake: Continued retreat will lead to calving width expansion> The retreat from 1986 to 2016 has been 400 m. The water depth has been above 150 m at the calving front for sometime and should remain high.

Glacier thinning and retreat near the lakes dammed by Brady Glacier have led to changes in the widths of calving fronts between. The combined increase in the width of the six secondary calving fronts is 34% from 1948 to 2004, and 15% from 2004 to 2010 (Pelto et al, 2013) With the inclusion of South Dixon Lake and continued expansion of Dixon and Oscar Lake the calving width has continued to increase up to 2016. Calving widths at Bearhole Lake, Spur Lake, and Trick Lake will not change appreciably. Spur Lake and Trick Lake parallel the margin of the glacier, and although this margin will likely continue to recede, the length of the depression filled by the two lakes probably will not change.

Water depth is an important factor affecting the calving rate of glaciers in lacustrine environments; velocity and calving rate increase with water depth by a factor of 3.6 (Skvarca et al., 2002). Capps et. al. (2013) determined the bathymetry and calving depths of five of the lakes at Brady Glacier. Water depths increase toward the calving fronts at Abyss Lake, Bearhole Lake, Oscar Lake, and Trick Lake; only at North Deception Lake does the water not currently become deeper towards the calving front; however it almost certainly will as the east margin moves into the main Brady Glacier valley. The observations suggest that mean calving depths of proglacial lakes, at least in the short term, will increase with continued retreat. Increases in calving width and depth will lead to increased calving at the secondary termini in the near future (Pelto et al, 2013).

Harris Glacier Retreat, Kenai Fjords, Alaska

harris compare

Landsat images of Harris Glacier from 1986 and 2015.  The red arrow indicates 1986 terminus location, yellow arrow the 2015 terminus position.  The orange arrow indicates a key eastern tributary and the pink arrow a smaller eastern tributary. 

Harris Glacier flows from the northwest corner of the Harding Icefield, Alaska and it drains into Skilak Lake.  The glaciers that drain east toward are in the Kenai Fjords National Park, which has a monitoring program.  Giffen et al (2014) observed the retreat of glaciers in the region. From 1950-2005 all 27 glaciers in the Kenai Icefield region examined  are retreating. Giffen et al (2014) observed that Harris Glacier (A Glacier) retreated 469 m from from 1986-2005.  Here we examine Landsat imagery from 1986-2015 to illustrate the retreat of this glacier and other upglacier changes. The glacier supplies meltwater to Skilak Lake which is a critical salmon habitat for the Kenai. Chinook Salmon spawn on a section of the Kenai River between Kenai Lake and Skilak Lake. With Skilak Lake being the resulting home for ninety percent of the salmon fry for the Kenai River, and with the most of any nursery in the Cook Inlet area. Escapements of chinook in the Kenai River exceed 50,000 annually in two runs (Heard et al 2007).

In 1986 the glacier extended to an elevation of 590 m, on the east side of the glacier there were two smaller tributaries reaching the glacier at the orange and pink arrow.  By 2015 the terminus had retreated 600 m from 1986.  The eastern tributary at the pink arrow had detached from the main glacier.  The tributary at the orange arrow still reaches the main glacier, but the blue ice extent after joining the glacier has diminished significantly. Below is a closeup of the terminus from 1996 and 2015 illustrating a 225 m retreat and associated thinning.  It is also interesting to note the prominent ash layer has shifted little.  This suggests the terminus area is relatively stagnant. There is no active crevassing in the lower 1 km suggesting retreat will be ongoing.   In 1989 the snowline is at 975 m whereas in 2014 the snowline is at 1125 m.  This higher snowline is too high to maintain the glacier. The snowline in 2015 was again above 1100 m, though it is lower in the mid-August image at 1050 m. The retreat of this glacier is less than neighboring glaciers such as Grewingk, Pederson and Bear Glacier that have calving termini.

harris snowline

Landsat images from 1989 and 2014, with the snowline indicated by purple dots. 

harris terminus

Terminus of Harris Glacier in Google Earth images from 1996 and 2015.  Margin with purple dot, purple arrow indicates 1996 terminus lcoation, with a 225 m retreat by 2015. Note the prominent ash layer

Tingmiarmit Glacier Retreat Separates Tributaries, South East Greenland

tingmiarmit compare

Tingmiarmit Glacier comparison in 1999 and 2015 Landsat images indicating the separation of tributaries at the terminus. The red arrows indicate the 1999 terminus and the yellow arrows the 2015 terminus location.  Point A is peninsula where the tributaries joined, and Point B is a nunatak just upglacier from the 2015 terminus.

Tingmiarmit Glacier (Timmiarmiit also) ends in the Tingmiarmit Kangertivat Fjord in southeast Greenland.  The glacier is just south of Heimdal Glacier and is noted by Rignot et al (2012) as having a velocity of 1.4 to 3 km/year. Moon et al (2012) note that most glaciers in SE Greenland experienced a significant velocity increase after 2000. In 1999 the glacier terminus was beyond the junction of two main tributaries, with little variation from 1994.  Here we examine 1999-2015 imagery to identify the separation and retreat. The retreat is similar to that of nearby Thrym Glacier, which also had a tributary separation and nearby Puisortoq.

In 1999 the glacier terminates 1 km beyond the junction of the two tributaries, indicated by red arrow on each image.  The fjord is 2.2 km wide at this point.  The terminus had not changed in 2001 Landsat imagery.  By 2010 terminus is now located at the junction of the two glaciers. which still share a single calving front, though the calving front is longer with northern and western facing section.  In 2015 retreat has led to complete separation of the western and northern tributary. The western tributary is the main glacier and has retreated 2.4 km and the northern tributary has retreated 2.2 km in the sixteen year period.  The retreat of the northern tributary has been slower since 2010.  The western tributary now terminates 1.5 km from former junction.The fjord is expanding in width, which suggests the current terminus is not at a stable location. The nunatak marked B is a potential point of stability but not likely as the main arm of the glacier goes south of this location and then the fjord continues to expand.  Moon and Joughin (2008) observed an ice sheet tidewater glacier retreat rate increase from 2000-2006, coinciding with an increase here. Howat and Eddy (2010) noted a mean change for this region of -107 m per year.  Tingmiarmit Glacier’s rate of retreat was slightly higher at 120 m/year for the 1999-2010 period and . Polar Portal continues to expand the number of glaciers with updated terminus positions from satellite imagery with 20 presently.

Mountain Photographer Jack Brauer  captured an excellent image of the terminus area in late August, particularly given it was out a commercial airliner window.  This image illustrates the steeper slopes and much smaller contribution of the tributaries to the right (east) of Point A and B.  The image also indicates that Point B is likely not a significant pinning point to stabilize the terminus. The map below from the Greenland Geological Data viewer indicates the change with the tributaries now disconnected.

Aerial Greenland 6

Image from Jack Brauer, looking northwest toward Tingmiarmit. 

tingmiarmiit map

Greenland Geological Data, from the Geological Survey of Denmark and Greenland. 

tingmiarmiit 2001

2001 Landsat image

tingmiarmiit 2010

2010 Landsat image, purple dots indicate ice front. 


Eagle Glacier, Alaska Retreat Losing a Wing

eagle glacier change

Above is a paired Landsat image from 1984 left and 2013 right indicating the 1100 m retreat during this period of Eagle Glacier.

My first visit to the Eagle Glacier was in 1982 with the, ongoing and important, Juneau Icefield Research Program, that summer I just skied on the glacier. In 1984 we put a test pit at 5000 feet near the crest of the Eagle Glacier to assess the snowpack depth. This was in late July and the snowpack depth both years was 4.3 meters, checking this depth in nearby crevasses yielded a range from 4-4.5 meters.In 1984 the snowline at the end of the summer melt season in early September was at 1050 meters.The equilibrium line altitude (ELA) which marks the boundary between the accumulation and the ablation zone each year. On Eagle Glacier to be in equilibrium the glacier needs to have an ELA of 1025 meters. In the image below the glacier is outlined in green, the snowpit location is indicated by a star and the snowline that is needed for the glacier to be in equilibrium at 1025 meters is indicated. The number of years where the ELA is well above 1050 meters dominate since 2002, all but two years see chart below, leading to mass loss, thinning and glacier retreat. This follows the pattern of Lemon Creek Glacier that is monitored directly for mass balance, which has lost 26 meters of thickness on average since 1953.The more rapid retreat follows the pattern of more negative balances experienced by the glaciers of the Juneau Icefield (Pelto et al. 2013). The high snowlines have left the western most tributary with no retained snowpack in 2013, 2014 and 2015, yellow arrow in the 2014 and 2015 Landsat image.  This will lead to the rapid downwasting of this tributary.

Eagle Glacier has experienced a significant and sustained retreat since 1948 when it terminated near the northern end of a small lake.  By 1982 when I first saw the glacier and when it was mapped again by the USGS the glacier had retreated to the north end of a second and new1 kilometer long lake. In the image below the red line is the 1948 terminus, magenta line the 1982 terminus, green line 2005 terminus and orange line the 2011 terminus. From 1984 to the 2005 image the glacier retreated 550 meters, 25 meters/year. From 2005-2015 retreat increased to 60 meters/year. Going back to the 1948 map the terminus in 2011 is located where the ice was 150-175 m thick in 1948. The high snowlines in 2014 and 2015 along with extended melt season continued the rapid retreat.  Total retreat from 1984-2015 is now 1200 m. The retreat hear is less rapid than on nearby Gilkey Glacier or Antler Glacier, but the upglacier downwasting is more severe than at Gilkey Glacier.

Snowline location and snowpit location in 1984

eagle ela
ELA of Eagle Glacier from Landsat images.

eagle wing compare

2014 and 2015 Landsat image indicating snowline on Eagle Glacier, purple dots. Yellow arrow indicates tributary that lacks any retained snowpack,

Terminus change map on 2005 Google Earth image.  Red line is 1948, magenta line is 1982, green line is 2005 and orange line is 2011. 

Bernardo Glacier, Patagonia, Chile Accelerated Retreat in Expanding Lake Complex

bernardo compare

Comparison of 1986 and 2015 Landsat image of Bernardo Glaciers three termini, north, main and south. Red arrows indicate 1986 terminus location and yellow arrows the 2016 terminus location.  Indicating the substantial retreat of each terminus and lake expansion for the north and main terminus, while the lake drained at the southern terminus. 

Bernardo Glacier is a difficult to reach outlet glacier on the west side of the Southern Patagonia Icefield (SPI).  It The glacier currently ends in an expanding proglacial lake system, with three primary termini.  Here we examine changes from 1986 to 2016 using Landsat images. Willis et a (2012) quantify a rapid volume loss of the SPI from 2000-2012 of 20 giga tons per year mainly from rapid retreat of outlet glaciers. They note a thinning rate of 3.4 meters per year during this period of the Bernardo Glacier region. Mouginot and Rignot (2014) illustrate that velocity remains high from the terminus to the accumulation zone on Bernardo Glacier.  They also indicate the accumulation zone does not extend as far east toward the crest of the SPI as previously mapped. Davies and Glasser (2012) indicate that over the last century the most rapid retreat was from 2000 to 2011.

In 1986 Bernardo the southern terminus of the glacier was nearly in contact with Tempano Glacier.  The main terminus primarily ended on an outwash plain with a small proglacial lake developing.  The northern terminus had retreated a short distance south from a peninsula.  By 1998 the northern terminus had retreated into a wider, deeper lake basin, filled with icebergs. The main terminus is still mainly grounded on an outwash plain.  A small lake has developed between Bernardo Glacier and Tempano Glacier to the south. By 2003 the northern terminus had retreated 2 km from 1986, the main terminus 1.5 km and the southern terminus 1.2 km.  By 2015 the lake between Tempano and Bernardo Glacier had drained.  The main terminus had retreated 1.5 km since 1986.  In 2016 the northern terminus had retreated 3.5 km since 1986, the main terminus 2.5 km and the southern terminus 2.75 km.  The largest change is the loss of the lake between Tempano and Bernardo Glacier which slow the retreat of the southern terminus. If this terminus retreat into the another lake basin that shared with the main and north terminus, this would likely destabilize the entire confluence region.  The nearly 1 km retreat in a single year from 2015 to 2016 of the main terminus indicates the instability that will lead to further calving enhanced retreat. The retreat of this glacier fits the overall pattern of the SPI outlet glaciers, for example Chico Glacier and Lago Onelli Glaciers

.bernardo 1998

1998 Landsat image.  Red arrows indicate 1986 terminus location and yellow arrows the 2016 terminus location.

bernardo 2003

2003 Landsat image.  Red arrows indicate 1986 terminus location and yellow arrows the 2016 terminus location.  Main terminus beginning to retreat from outwash plain. 

bernardo 2015

2015 Landsat image.  Red arrows indicate 1986 terminus location and yellow arrows the 2016 terminus location.  Note the considerable difference in main terminus versus one year later in 2016.

Frostisen Ice Cap Svalbard, Ongoing Defrosting 1990-2015

frostisen compare

Frostisen Ice Cap in 1990 and 2015 Landsat images.  Red arrow is the 1990 terminus location, yellow arrow the 2015 terminus location.  Purple arrows indicate thinning on the upper margin of the ice cap, and the letter A indicates an outcrop of rock emerging through the ice.

Frostisen is an ice cap in Dickson Land of Central Svalbard.  The World Glacier inventory of 1960 listed the area of the ice cap at 19 square kilometers, by 2007 the Randolph Glacier Inventory indicated the ice cap area at 13.4 square kilometers.  Malecki (2013) examined seven glaciers in this region and found an acceleration in losses from 1990-2011 compared to 1960-1990 due to an increase in summer temperature post-1990 which led to higher annual equilibrium line altitudes.  The seven glacier lost 39% of their volume from 1960-2009. Here we compare 1990 and 2015 Landsat images to indicate changes in the ice cap . Malecki (2013) also noted evidence of a rapid increase in thinning rates in the upper parts of the studied glaciers, linked to decreasing albedo in former accumulation zones.

In 1990 two outlet glaciers on the east side of the icefield, Skandalsbreen and Studentbreen, after dropping over a prominent sill at 475 m extended approximately 2 km downvalley.  At Point A there is no sign of bedrock. There are limited snowpatches 10% of the ice cap with three weeks left in the melt season. In 2015 the eastern outlet glaciers have a limited extent after descending the sill, Skandalsbreen has retreated 975 m and Studentbreen 1300 m since 1990.  At Point A bedrock has emerged, this is easier seen in the image below. This is an indication of thinning in the midst of what should be the accumulation zone.  In 2013 and 2015 and many other years the ice cap has lost all of its snowcover indicating it has no accumulation zone and cannot survive (Pelto, 2010). The purple arrows indicate thinning at the upper margin of the glacier near 650 m, this would not happen if this area was acting as an accumulation zone. Nuth et al (2013) noted a 7% loss in glacier area in the last 30 years in Svalbard. The tidewater glaciers of Svalbard get most of the attention, but Frostisen like other inland terminating glaciers such as Belopolskijbreen is losing volume rapidly. .

frostisen image

TopoSvalbard satellite view above and map view below of Frostisen Ice Cap.  The maximum elevation of 650 m has been below the regional snowline many recent years. 

frostisen map

North Fork Grand Plateau Glacier, Alaska-Spectacular 3 km Retreat 2013-15

south alsek glacier compare

North Fork Grand Plateau Glacier comparison in 2013 and 2015 Landsat images.  Illustrating the rapid retreat and lake expansion in just two years. Pink arrow is 1984 terminus, red arrow is the 2013 terminus and yellow arrow 2015 terminus. The orange dots are the 2013 terminus. 

The Alsek Glacier is a large glacier draining into Alsek Lake and the Alsek River in southeast Alaska  Its neighbor the Grand Plateau Glacier has one fork  flows north and joins the Alsek Glacier terminating in Alsek Lake. The USGS topographic map compiled from a 1958 aerial image indicates a piedmont lobe spread out into a proglacial lake that is less than 3 km wide, with a combined ice front of the Alsek Glacier and North Fork Grand Plateau Glacier.. There is a 10.5 km wide calving front in the lake.  By 1984 the glacier had separated into a northern and southern calving front on either side of an island and had a 13 km wide calving front.   Here we focus on the southern lobe, which is comprised of a lobe of  the Alsek Glacier and a the North Fork Grand Plateau Glacier that merges with Alsek Glacier.  From 1984 and 1999 the two lobes separated as the North Fork retreated 2.2 km.  From 1999 to 2013 the North Fork retreated 1.5 km up a newly forming southern arm of Alsek Lake.  The retreat over the 30 period of 3.7 kilometers averaged ~120 meters/year. Landsat imagery in 2013 and 2014 indicate extensive calving from the North Fork Grand Plateau Glacier.  From 2013 to 2015 the terminus has retreated 3.0 km, 1.5 km/year.  This is likely the fastest retreat rate in recent years of any Alaskan glacier. The calving front in Alsek Lake has been reduced to 5.4 km in three separate sections.

The retreat has been similar in timing to nearby Alsek River watershed glaciers Walker GlacierEast Novatak Glacier and North Alsek Glacier..  The rapid retreat is enhanced by calving in proglacial lakes, a common issue increasing area loss of Alaskan glaciers.  Yakutat Glacier is an example of rapid lake expansion. In the case of Yakutat Glacier unlike the Alsek or Grand Plateau Glacier the glacier lacks any high elevation accumulation zone and cannot survive without an accumulation zone (Trüssel et al 2015).  Grand Plateau Glacier and Alsek Glacier both have large accumulation areas above 2000 m, that are well above the snowline at all times.  The Alsek River is a destination for sockeye salmon fishing and river rafting, see Chilkat Guides or Colorado River and Trail Expeditions.  Continued expansion of lake area as glaciers retreat in the watershed, is changing the nature of the Alsek River.

alsek map

USGS Topographic map of region from 1958 aerial images indicating merging of Alsek Glacier and North Fork Grand Plateau Glacier. 

alsek 1984

1984 Landsat image indicating terminus locations. Pink arrow is 1984 terminus, red arrow is the 2013 terminus and yellow arrow 2015 terminus.

alsek 1999

1999 Landsat image indicating terminus locations. Pink arrow is 1984 terminus, red arrow is the 2013 terminus and yellow arrow 2015 terminus.

alsek 2014

2014 Landsat image.  indicating terminus locations. Orange dots indicate the ice front. Pink arrow is 1984 terminus, red arrow is the 2013 terminus and yellow arrow 2015 terminus.

Krayniy Glacier Retreat, Novaya Zemlya

kraniy

Krayniy Glacier (Ky) comparison in 1990 and 2015 Landsat images.  Red arrow is 1990 terminus and yellow arrow is the 2015 terminus.  Purple arrows indicate upglacier thinning and green arrow a location of a glacier dammed lake.

Krayniy Glacier is an outlet glacier that drains the northern side of the Novaya Zemlya Ice Cap into the Barents Sea. This outlet glacier is just southwest of Tasija Glacier (T) and like that glacier has retreated over 1.2 km since 1988. Krayniy Glacier has been retreating like all tidewater glaciers in northern Novaya Zemlya (LEGOS, 2006). The terminus of the glacier has a pinning point on an island at present. Carr et al (2014) identified an average retreat rate of 52 meters/year for tidewater glaciers on Novaya Zemlya from 1992 to 2010 and 5 meters/year for land terminating glaciers. The increased retreat rate coincides with the depletion of ice cover in the Barents Sea region and a warming of the ocean. Both would lead to increased calving due to more frontal ablation and notch development similar to at Svalbard (Petlicki et al. 2015).  The spring of 2016 features an ice free west coast of Novaya Zemlya leading to enhanced calving front melting.

In 1990 the glacier had an east west terminus across the head of the fjord.  There was a substantial glacier dammed lake impounded by the glacier (green arrow), and there was a narrow connection with Tasija Glacier.  The glacier dammed lake persisted in Landsat images in 1999, 2000, 2003 and 2006.  In 2013 the proglacial lake had drained.  In 2014 and 2015 the lake has not reformed, an indication of glacier thinning at the outlet location. This thinning is evident at both purple arrows,where the connection with the Tasija Glacier has been severed and a substantial nunatak has emerged amidst the glacier. From 1990 to 2015 the glacier has retreated more on the eastern margin with 1250 of retreat opening up the embayment.  Retreat at the island in the glacier center has been 500 m since 1990. The western section of the glacier has retreated little. The eastern embayment will continue to drive retreat and glacier thinning that will reduce contact with the island pinning the eastern half of the glacier.  The thinning is evident at the purple arrows. The glacier will likely retreat from this island in a fashion similar to Tasija and Chernysheva, which will lead to increased rate of retreat of the entire ice front.

kraniy lake

1988, 2006 and 2014 Landsat images indicating the continued presence of glacier dammed lake from 1988-2006 and continued absence from 2014 and 2015.arctic.seaice4262016

Sea ice image from Cryosphere Today

Pacific Northwest Glaciers: Widespread early Melt Season Arrival

[ngg_images source=”galleries” container_ids=”43″ display_type=”photocrati-nextgen_basic_imagebrowser” ajax_pagination=”1″ template=”/nas/wp/www/sites/blogsorg/wp-content/plugins/nextgen-gallery/products/photocrati_nextgen/modules/ngglegacy/view/imagebrowser-caption.php” order_by=”sortorder” order_direction=”ASC” returns=”included” maximum_entity_count=”500″]


The 2016 melt season is off to an early start in Greenland, but this is not the only location.  This winter proved to be warm, but relatively wet across much of the Pacific Northwest.  A look at the average freezing level (determined by North American Freezing Level Tracker-Developed by John Abatzoglou and Kelly Redmond) from January 1 to April 20 indicates freezing levels well above average on Mount Baker North Cascades, Washington, Bugaboo Mountains British Columbia and Juneau Icefield Alaska.  Reports from the field in British Columbia, Alaska and Washington identify a peak snowpack in late March instead of early May at glacier elevations.

In British Columbia the University of Northern British Columbia field team is currently on Conrad Glacier in the Bugaboos, having just finished Kokanee Glacier. This is part of a five-year study led by Dr. Brian Menounos, UNBC Canada research chair in glacier change, funded by the Columbia Basin Trust. UNBC PhD student Ben Pelto heads the research team. They have found that despite snowpack observations for the region from the BC River Forecast Centre of slightly above average snowpack on April 1, the high winter freezing levels and very warm April conditions have left the Kokanee Glacier snowpack quite similar to the low 2015 snowpack, with close to 4.5 m of retained snowpack.  The snowmelt season was noted by the River Forecast Centre as starting several weeks early. The freezing level from January-April 20 was a record for the 1948-2016 period by over 100 m for the Bugaboo mountains.  The region based on the warm spring causing rapid snow melt at lower elevations is leading many, Including John Pomeroy, to expect high forest fire danger and low streamflow during the summer across the Western Canada. 

zillmer snowpit

Snowpit being excavated on Zillmer Glacier April 2016, Jill Pelto and Micah May. (Ben Pelto)

BenPelto-and-JillPelto-BCGlacierClimateProject-Kokanee-April2016-TomHammond

Jill Pelto and Ben Pelto measuring density of firn core on Kokanee Glacier. (Tom Hammond)

In Alaska  USGS-Glaciology has been completing GPR surveys of their benchmark glaciers in recent weeks.  On the Juneau Icefield Lemon Creek Glacier is a reference for the World Glacier Monitoring Service.  Mass balance records exist since 1953 for this glacier (Pelto et al, 2013). In April the glaciers are typically covered head to toe by snow.  The last four months indicate a freezing level of nearly 900 m a record for the 1948-2016 period of record. An April 19th Landsat image indicates the snowline on Herbert and Mendenhall Glacier at 600 m. This is below the terminus of Lemon Creek Glacier at 800 m.  Near the Juneau Icefield the Long Lake Snotel site at 260 m in elevation had its snowpack drop from 64 cm water equivalent to 38 cm water equivalent in the last month.

wolverine base camp

USGS Wolverine Glacier Base Camp last week with field work underway. 

juneau icefield april 2016

April 19 Landsat image of the southwest side of the Juneau Icefield.  Snowline indicated by Purple arrows. M=Mendenhall, H=Herbert, L=Lemon Creek and T=Taku Glacier.

For Mount Baker, Washington the freezing level from January-April 20 was not as high as the record from 2015, but still was 400 m above the long term mean.  Observations at the base of Easton Glacier, one of our key glaciers in the North Cascades, indicate that the snowpack has declined from a depth of 4.8 m to 3.4 m during the first three weeks of April. This is mainly due to compaction, versus snow water equivalent loss, but still represents the rapid densification that occurs as snowmelt begins in earnest.

easton 2016 snowpack april

April 2016 image from icefall on Easton Glacier at 2500 m above (Adam Dunn) and in August below same area (Jill Pelto). 

DSC07209