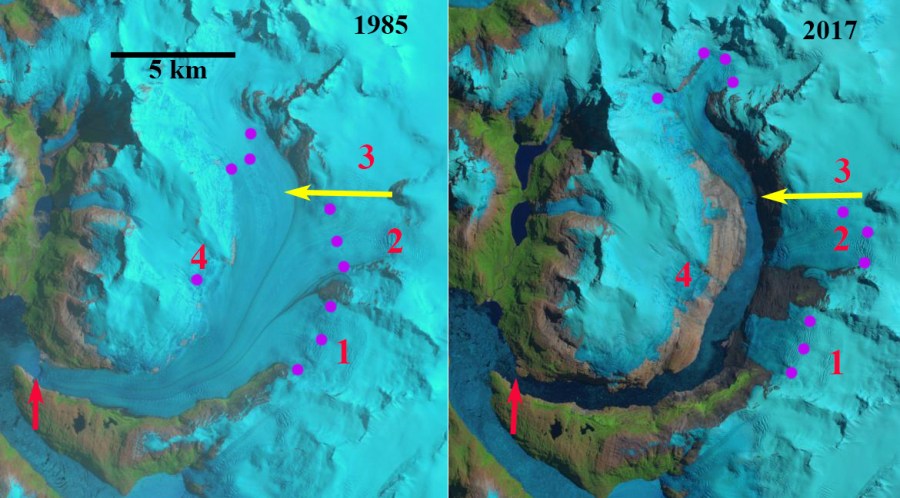
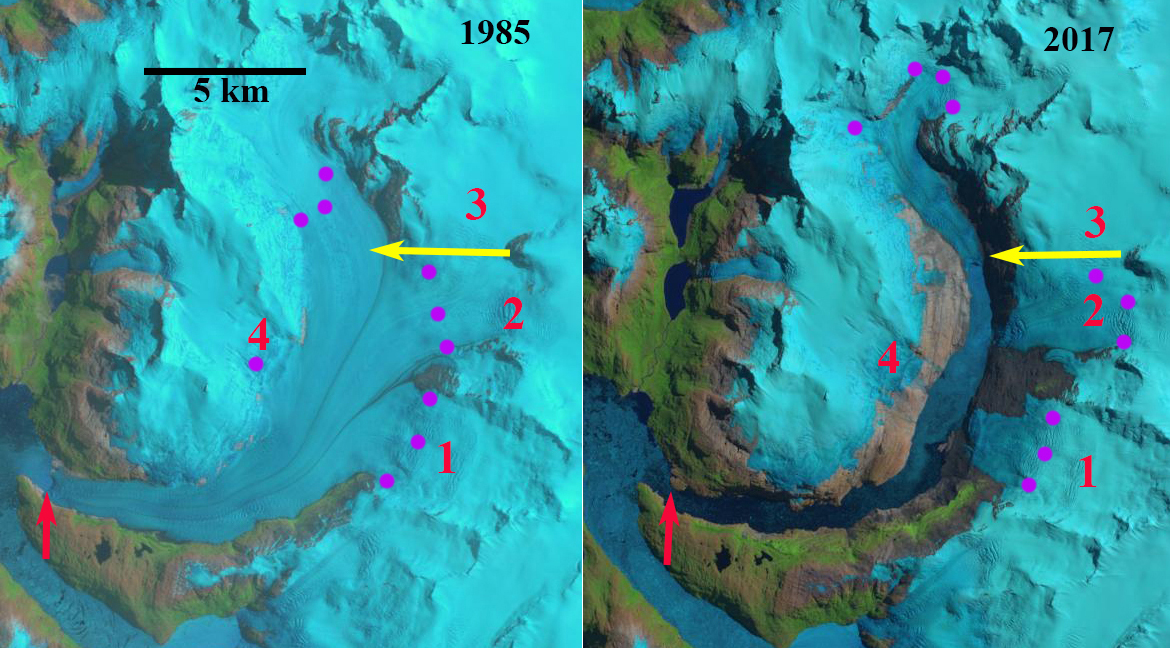
HPS-12 Glacier in 1985 and 2017 Landsat images. The red arrow indicates 1985 terminus, yellow arrows the 2017 terminus, purple dots the snowline and 1-4 are tributaries. By 2017 all tributaries have detached and the glacier has retreated 13 km.
HPS-12 is an unnamed glacier draining the west side of the Southern Patagonia Ice Cap (SPI). The glacier terminates in a fjord and is adjacent to Upsala Glacier to the east and Pio IX Glacier to the north. This developing fjord is also unnamed but feeds into Estero Falcon. Here we update the 2017 NASA Earth Observatory project I completed in 2017, that identified this as the fastest retreating glacier in Chile in the 1985-2017 period, using Landsat imagery from 1985-2025.
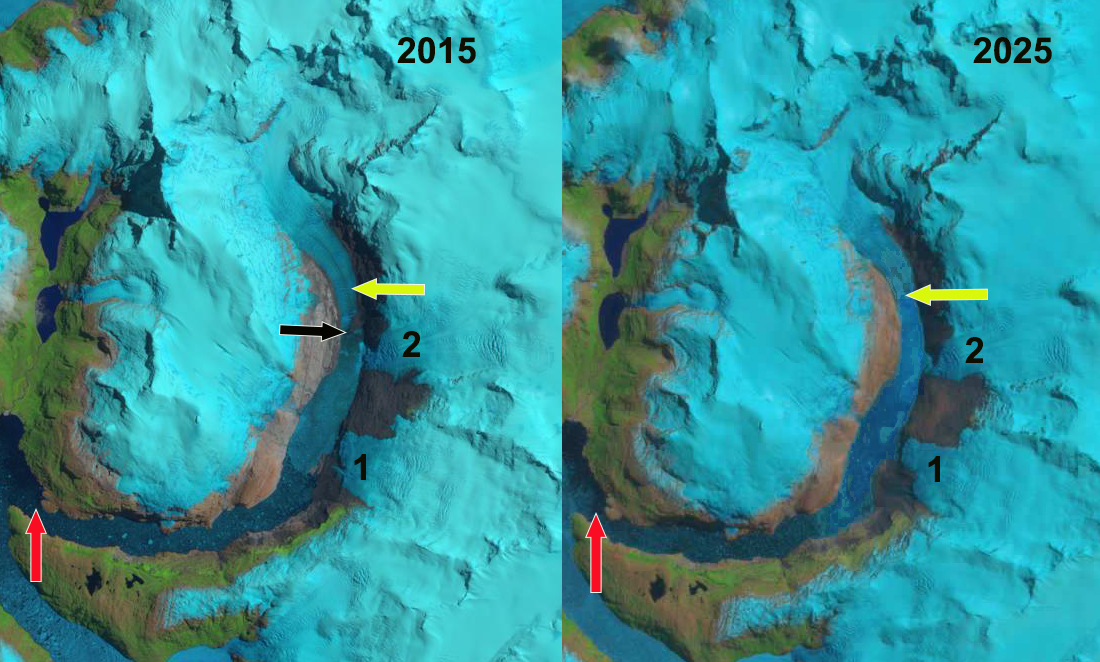
HPS-12 Glacier in 2015 and 2025 Landsat images. The red arrow indicates 1985 terminus, yellow arrows the 2025 terminus, black arrow the 2015 terminus. Former tributary 1 and 2 have declined in width .
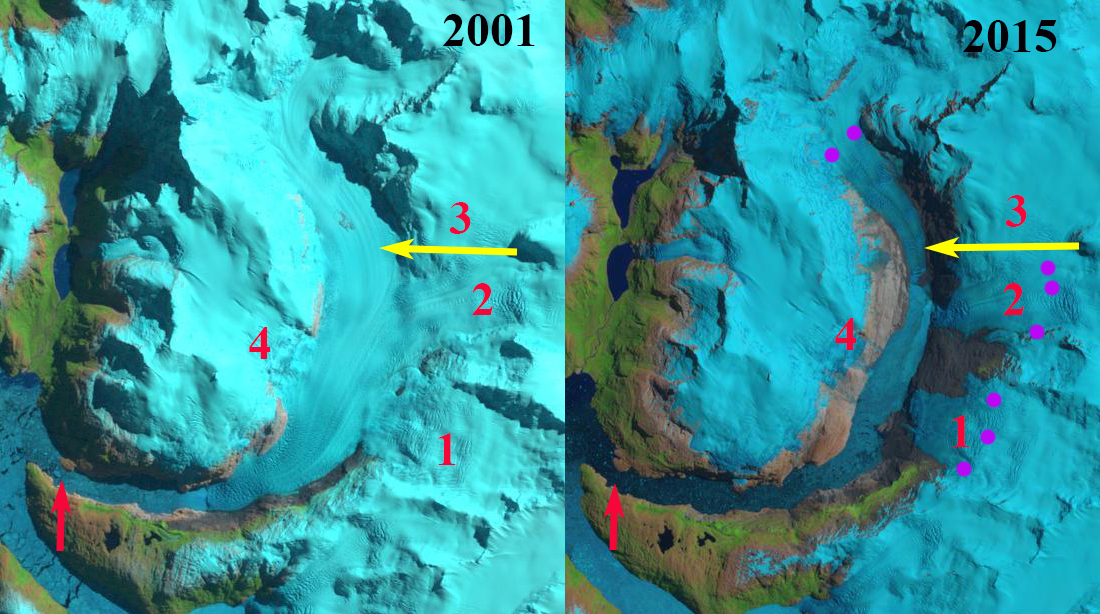
In 1985 the HPS-12 terminates 1.5 km from the junction of two fjords that are occupied by HPS-12 and HPS-13. These are separated by a peninsula. The glacier is fed by four tributaries labelled 1-4. The snowline in 1985 is at 900 m. In 2001 the four tributaries still join the main glacier, but the terminus has retreated 3.5 km. In 2015 glacier retreat has led to separation of tributary 1, 2 and 4 from the main glacier, tributary 3 only feeds tributary 2 and not the main glacier. The glacier retreat has continued to 2017, the current terminus is 800 m wide vesus 2800 m wide in 1985 . Total retreat from 1985 to 2017 was 13 km. By 2025 the glacier has retreated 14.75 km and has lost more than 50% of its total length. Tributary 1 and 2 continue to narrow from 2015 to 2025 illustrating that flow from the icefield accumulation zone is being reduced. This suggests less discharge into the terminus reach of HPS-12.
This glacier follows the pattern of retreat we have reported from Bernardo Glacier, O’Higgins Glacier, Tyndall Glacier and Upsala Glacier. The retreat is driven by the SPI have been experienced significant mass loss a. Malz et al (2018) noted a ~1 m/year mass loss from 2000-2016 with HPS-12 and Jorg Montt Glacier losing the most. Minowa et al (2021) found that 35% of all ablation of the Patagonia Icefields stemmed from frontal ablation.
HPS-12 Glacier in 2001 and 2015 Landsat images. The red arrow indicates 1985 terminus, yellow arrows the 2017 terminus, purple dots the snowline and 1-4 are tributaries. By 2015 tributaries 1, 2 and 4 have detached.
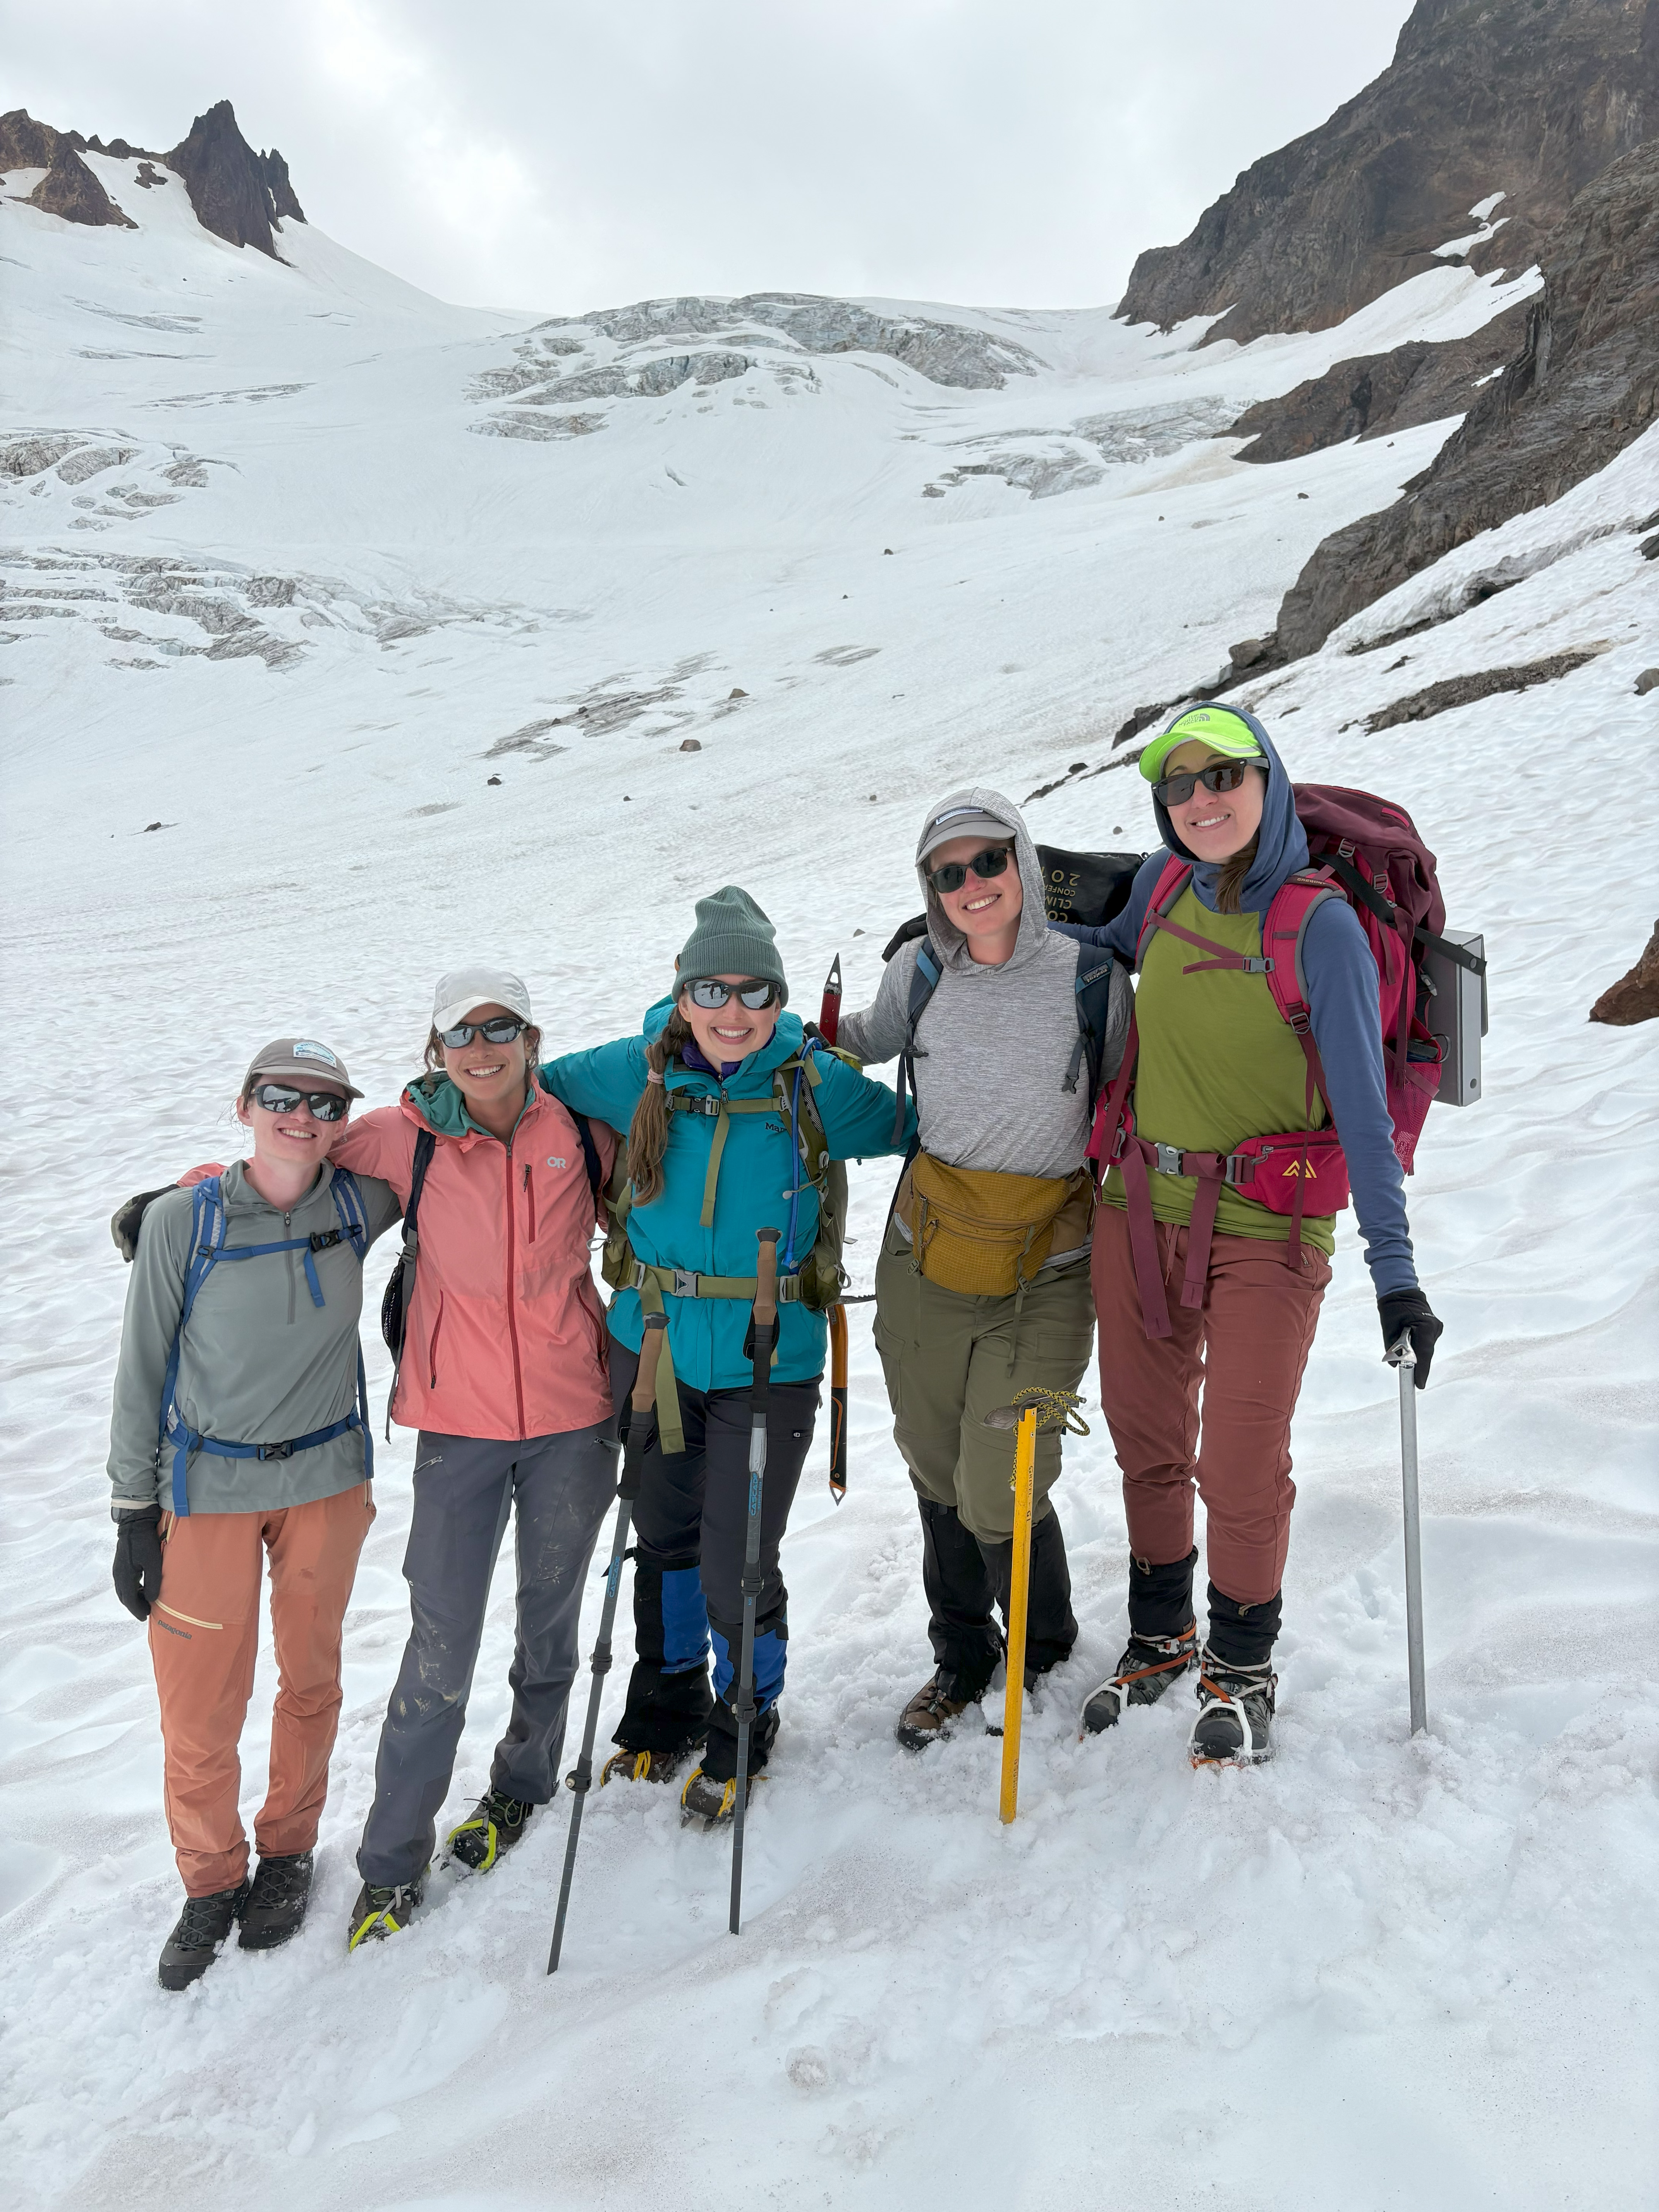
Core field team in 2025 Emmett Elsom, Mauri Pelto, Jill Pelto and Caitlin Quirk.
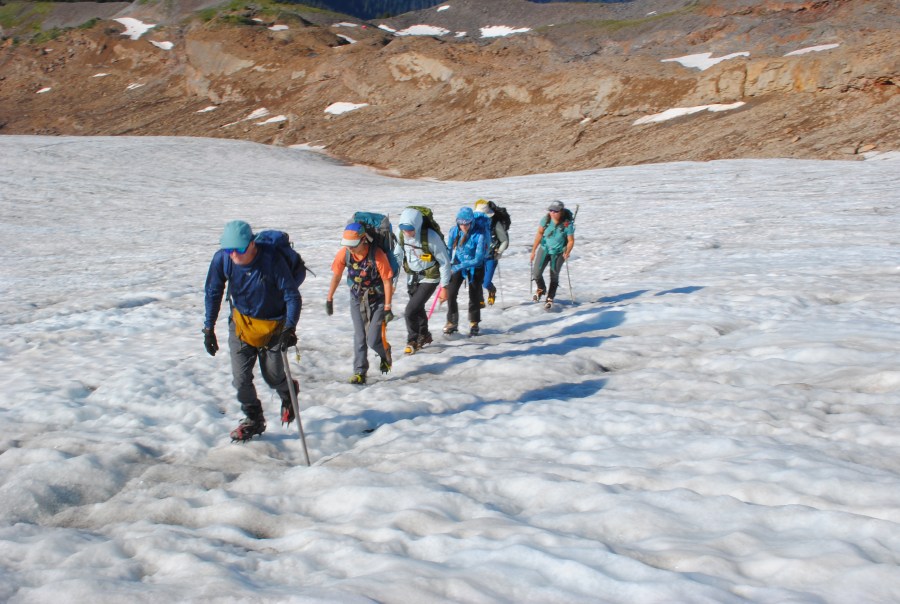
We hiked into North Cascade glacier to complete detailed observations for our 42nd consecutive year. These annual observations provide a detailed assessment of their response to climate change. For the third consecutive year North Cascade glacier on on average lost more than 2 m of glacier thickness. This cumulative loss of 7-8 m on most of the ranges glaciers that average 25-40 m in thickness represents 20% of their volume lost in just three years. On a few of the largest glaciers, such as those on Mount Baker that average 40-60 m in thickness the loss represents 12% of their volume lost.
The consequence is an acceleration of the collapse of the North Cascade glacier system. This landscape that has for long been shaped by ice is rapidly losing that glacier element. The rate of retreat for the glaciers we work on has accelerated so quickly that we are faced each year with changing terrain and new challenges. Beyond that, we are starting to really see the effect this retreat and the decrease in water has on the ecosystems both near the glaciers and further downstream. During the field season we love seeing the wildflowers, eating blueberries, and counting mountain goats. These are all parts of a habitat that is built around glaciers and snowpack. Seeing these shifts has been really difficult, but it helps to still return to these landscapes and continue to tell their stories through science and art. Below the story is told in images with captions by each of us who participated.
Two things that stood out during the 2025 field season were the strength of our collaborations, and the changing resources the glaciers are able to provide to the surrounding ecosystem. This visible change attracted the attention of KING5-Seattle NBC affiliate and CBS Morning News. At the bottom of this post the resulting footage is embedded. The film “Shaped By Ice” Jill and I worked on with Dan McComb has been a finalist in two recent film festivals, this footage also at bottom of this long read post.
Working on Rainbow Glacier from left-Katie Hovind, Caitlin Quirk, Claire Seaman, Jill Pelto and Margaret Kingston
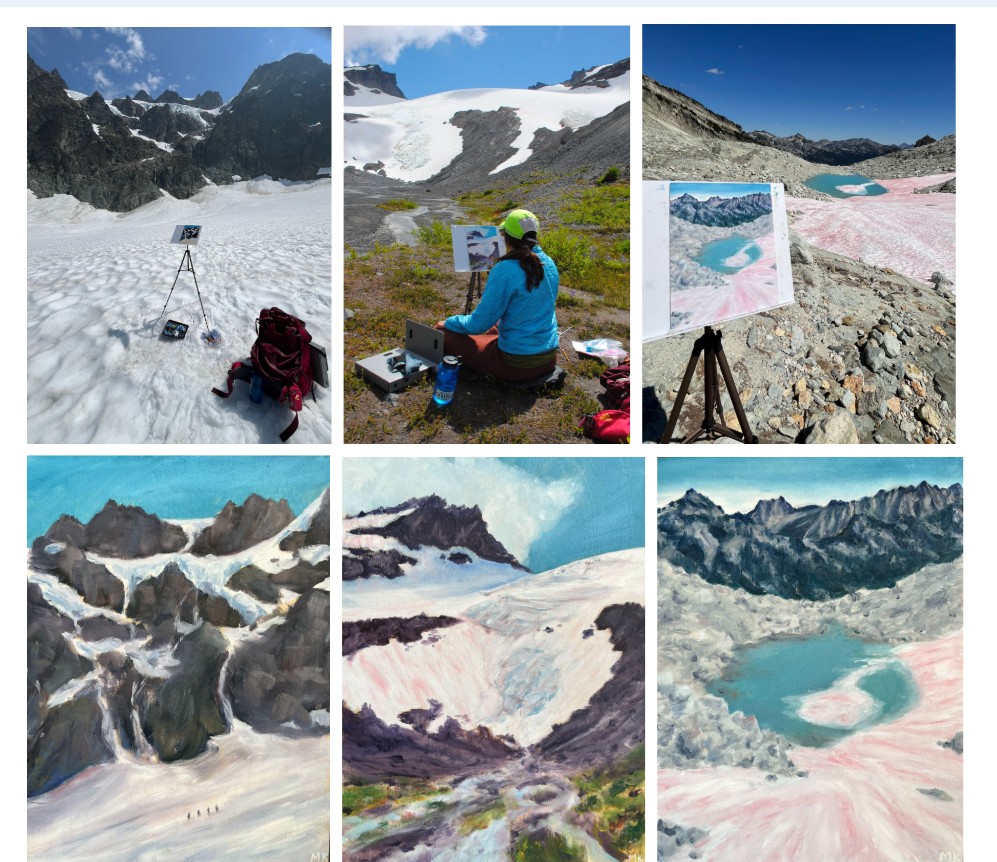
We worked with two oil painters, one watercolor painter, one printmaker, two news film crews, a team of botanists, and more. The result of all these collaborations has led to so many great stories being created and shared about our collective work. It also meant our core group of field assistants had to be flexible to a changing group and the sometimes difficult and imperfect logistics that accompany that. -Jill Pelto
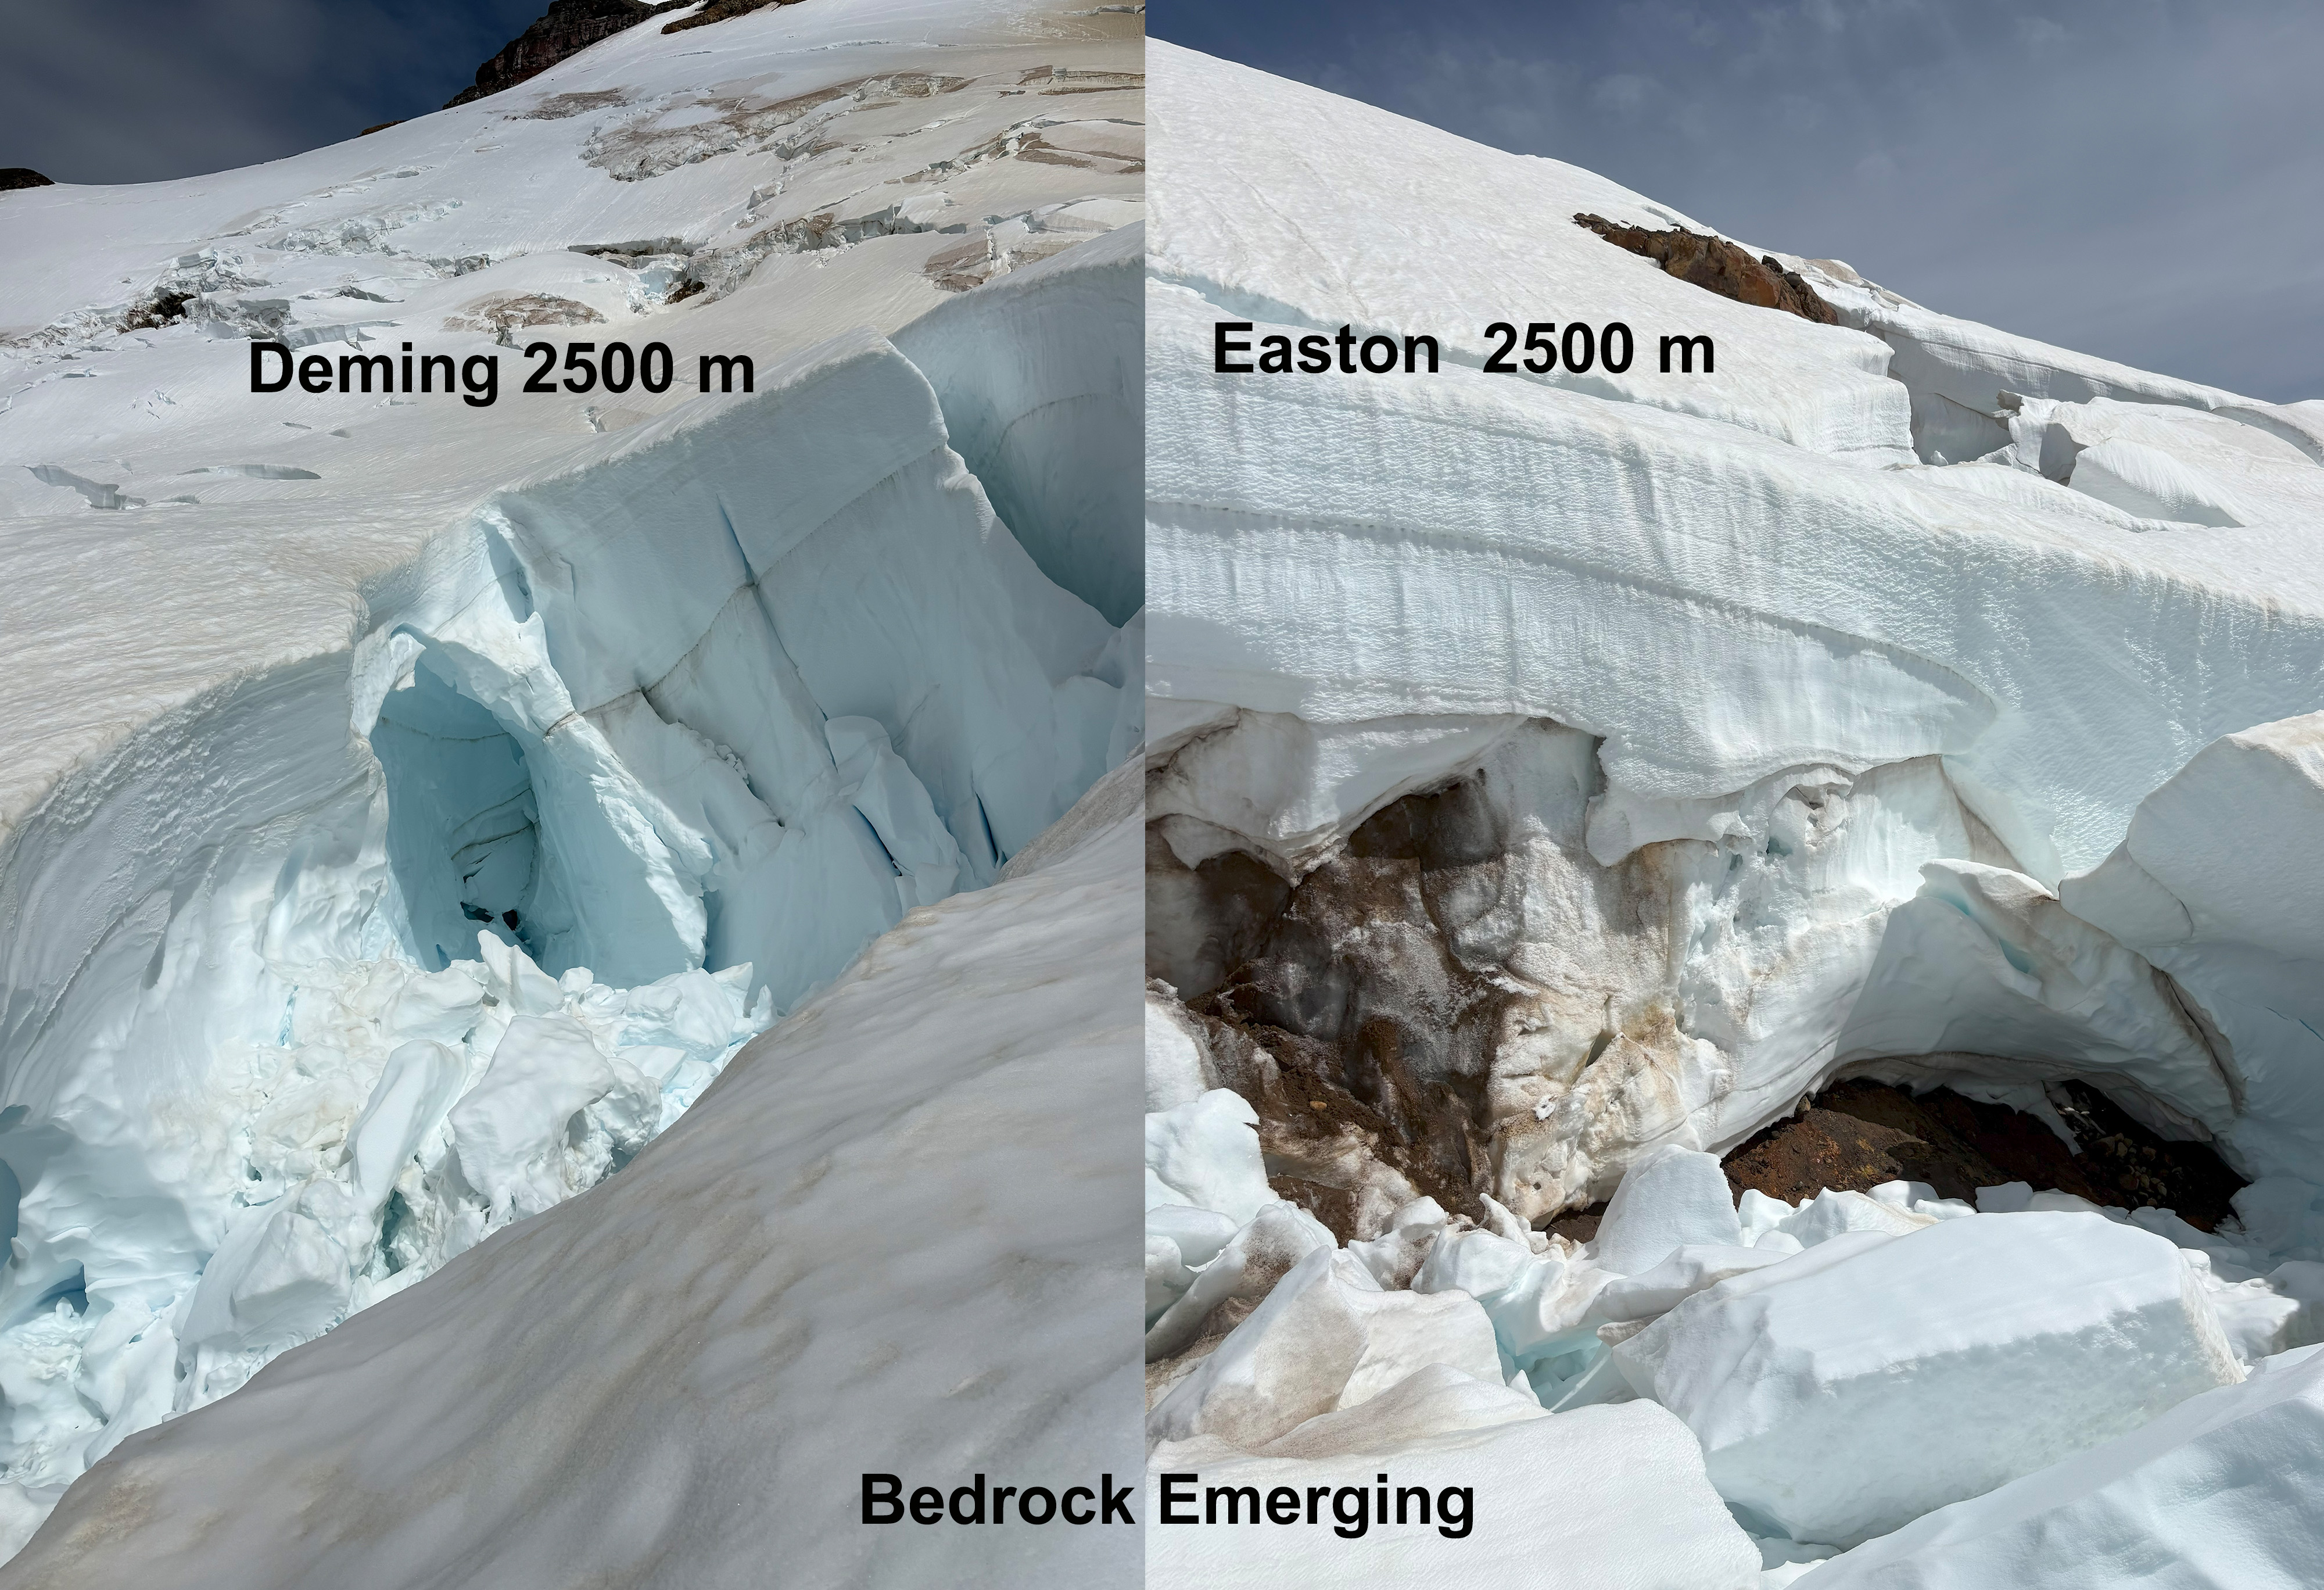
This photograph of an icefall at 2000 m (6700 ft) on the Easton glacier encompasses the wide range of emotions that I felt working on these glaciers this summer. The focal point of the picture is the wound inflicted upon the glacier by our changing climate. Bedrock and sediment creep through the gaping wound in the lowest icefall of the Easton, the opening visible for the first time in the project’s 42-year history. The place also holds a beauty, a sense of majesty that cannot be diminished by the tragic context of our work. The seracs at the top of the scene lean at impossible angles, destined to crash down onto the slope below, piercing the quiet of the snowy expanse in dramatic fashion. The dark annual layers in the glacier speak to the age of the ice, flowing down the flank of Mt. Baker over decades. The landscape has been a facet of my life for the past few years, as it falls upon the Easton Glacier route to the mountain’s summit. The icefall has always drawn me in as I pass, sparking a profound sense of wonder. It makes me deeply sad to see the beauty of such special places diminished, sad in a way that little else does. Over the past few years, I’ve come to like visiting these places to visiting an elderly loved one. While time may change them and even take them away from us, their beauty and meaning to me will hold true.-Emmett Elsom
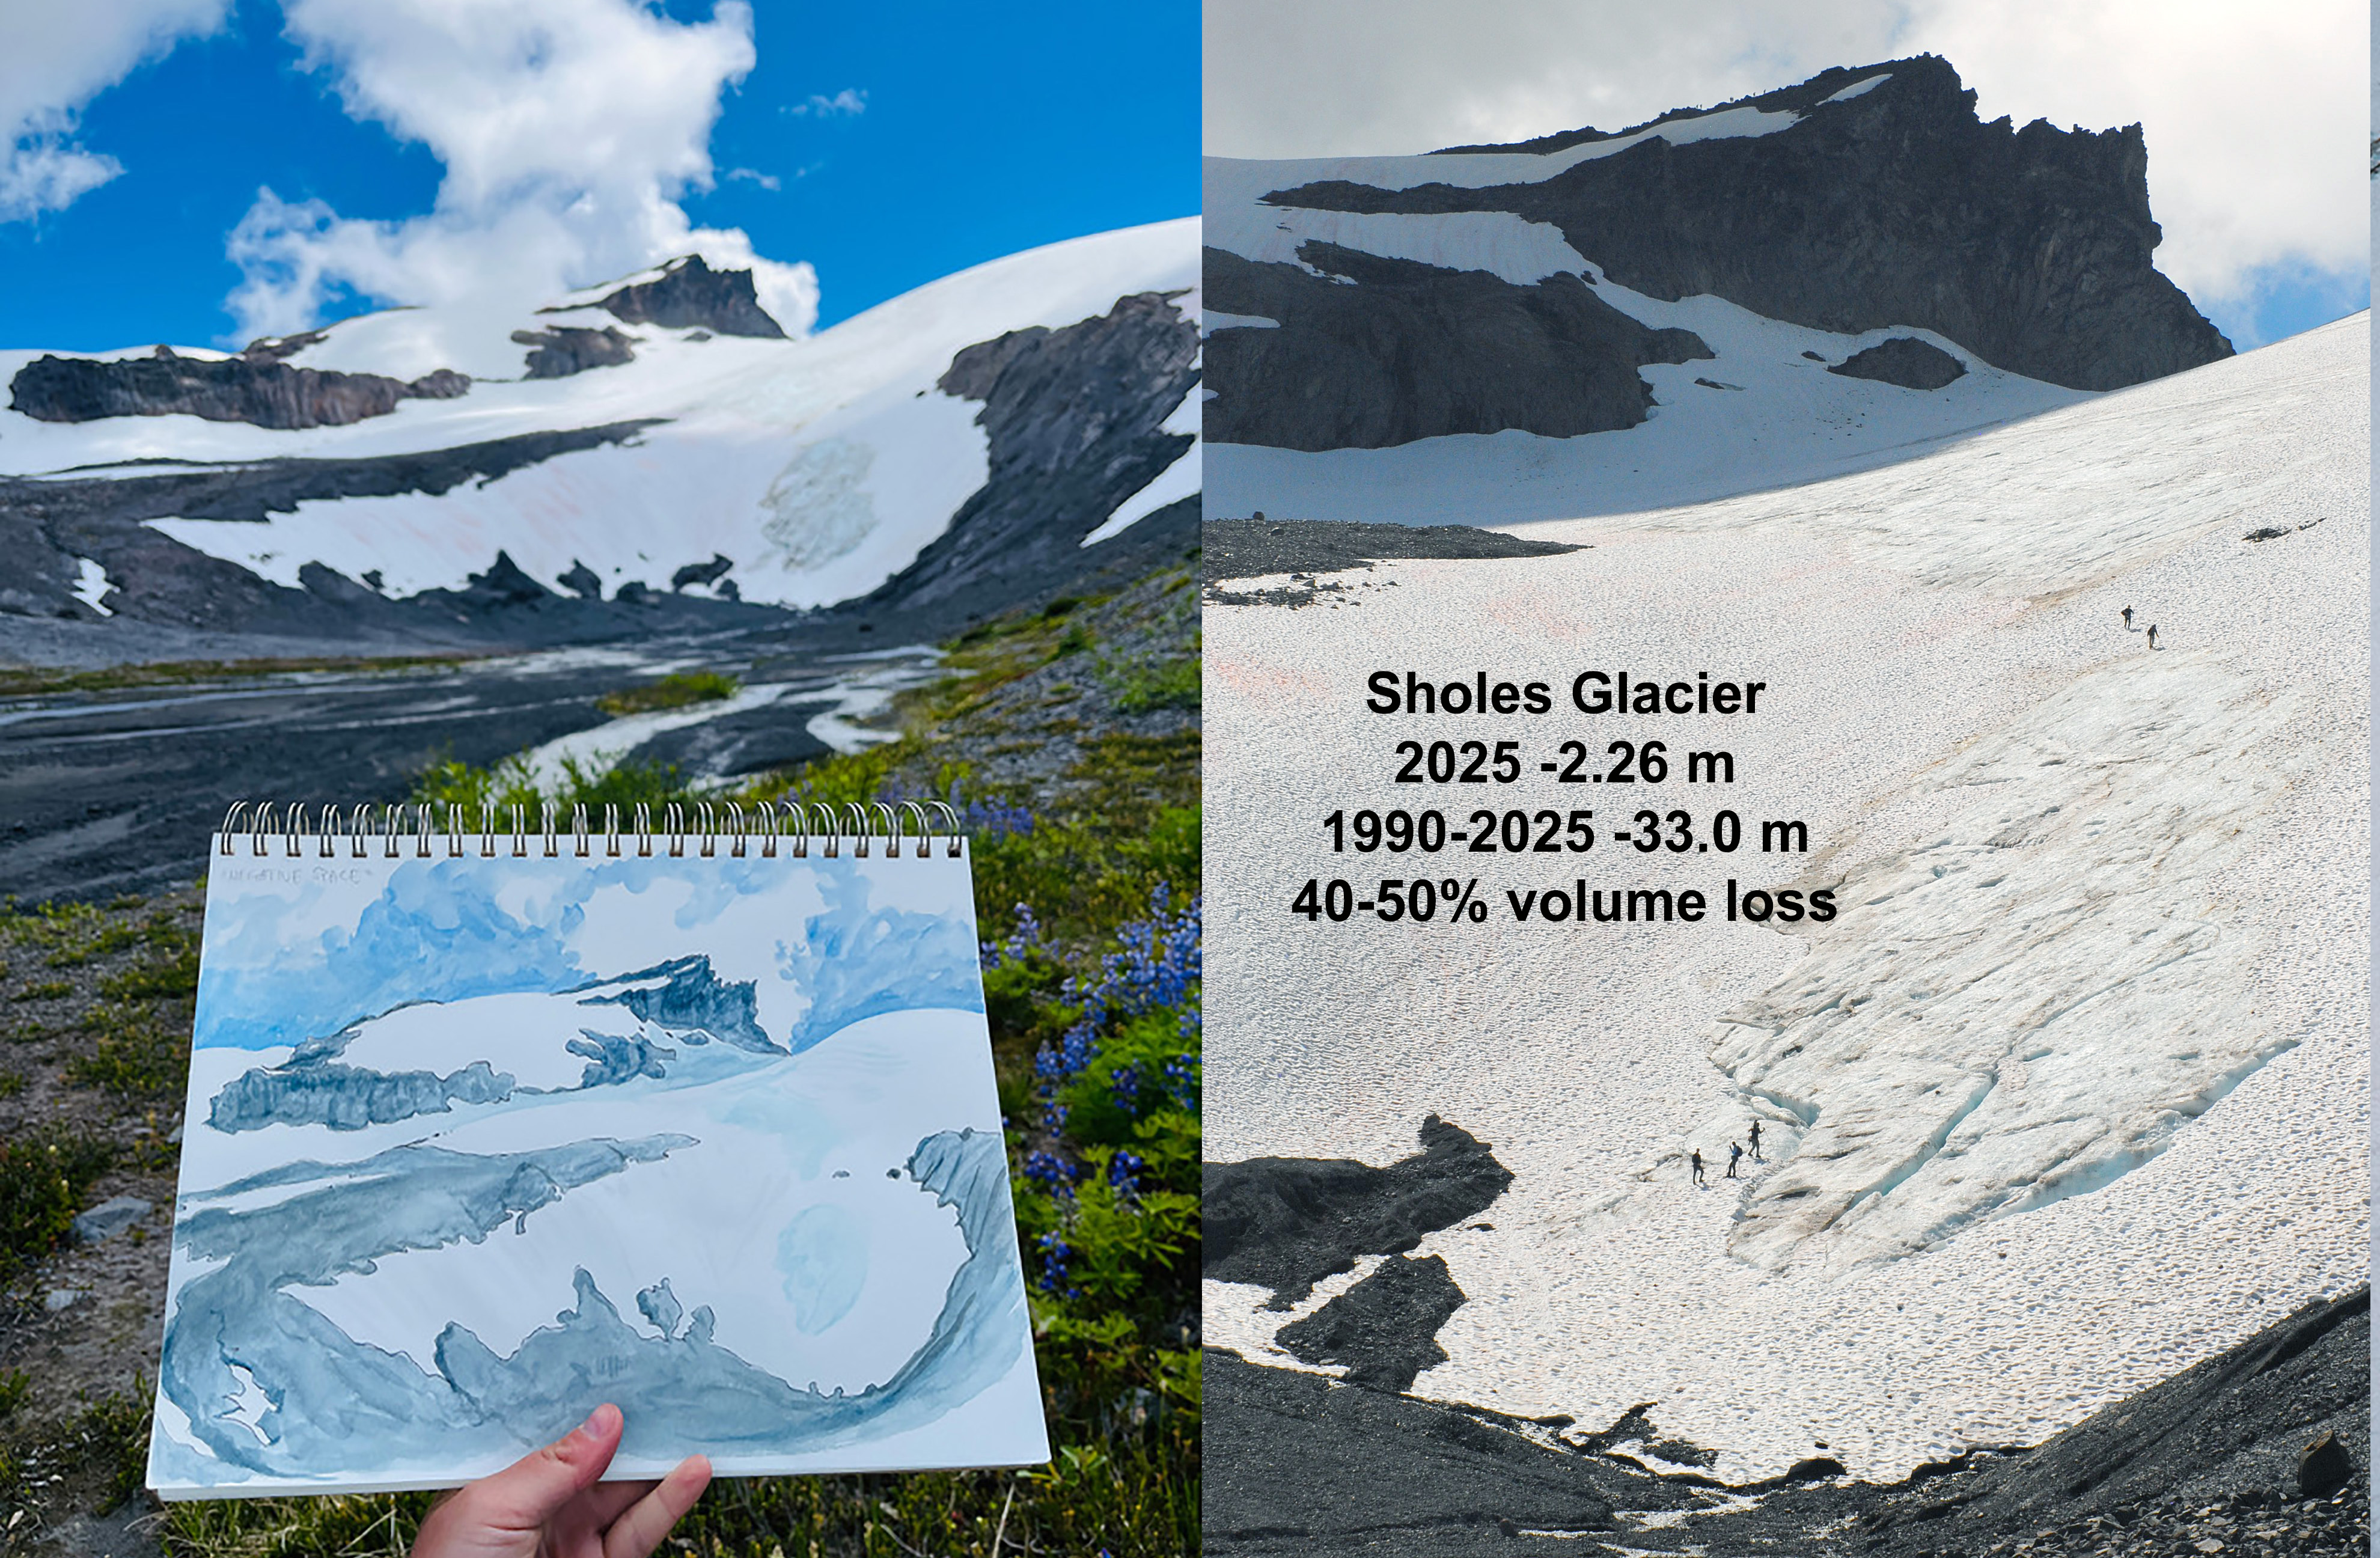
How does being present in a place shape our understanding? To the left is a view of Sholes Glacier, complete with my on-site rendition. I can’t express how lucky I feel to have had the chance to experience these places first hand. To interact with a place by attempting to capture its likeness — paying attention to the negative space not only between the white snowpack and black exposed rock, but in the empty, carved-out area that used to be filled with ice. Experiencing the texture of the glacier under your feet, the cool air drifting off the snow, the good tired feeling of your body after physically traversing top to bottom. This is what you don’t get from a photo. To know places such as these is to love them and see their role in the world, and want to protect them. But so many never get the chance to understand them this way.-Claire Seaman
This field season I focused on exploring the once-barren foreland a glacier leaves behind. Studying the plants growing in the wake of the Easton Glacier made me reflect on the way life responds to these major changes. This photo of a bright monkeyflower cluster in the streambed of the nearby Sholes Glacier exemplifies this resilience and optimism to me. The Sholes, in the background, drains a lifeblood that will feed the watershed downstream into the Nooksack, supporting people, fisheries, and a whole riparian ecosystem. The eventual loss of glacial ice feeding the river will be catastrophic, yet the scarred space left behind will blossom with vegetation. Witnessing firsthand how staggering the extent of glacial retreat is can be overwhelming, but that bright patch of flowers stands as encouragement. Alone in an altered landscape, those flowers will pave the way for more to follow. Change is nuanced, and as we watch it occur we can change, sharing stories of the beauty of this environment supported by ice, and adapting our lives and policies in a way that can be the difference which keeps glaciers flowing.-Katie Hovind
As a backcountry skier and oil painter focused on winter landscapes of the North Cascades, the idea of painting glaciers in the field was a dream come true! I knew what we would see and learn about the health of our glaciers from the scientists would be highly emotional, but the power of these environments disappearing in our lifetimes is something my words fail to communicate how devastating that feels. During the study on Rainbow glacier I caught on film the moment a serac collapsed, loudly crashing, crumbling from a newly melted out rock knob down the mountain splitting into smaller and smaller pieces. It looked sickly as it broke before our eyes. Another unique experience was going into a teal, translucent, otherworldly ice cave. I have started 2 paintings to capture this vanishing environment. My goal is to assist the project in translating the study’s findings through landscape paintings that communicate the beauty of these places with titles that call attention to the retreating glaciers in the North Cascades. We all have a responsibility as humans to make individual changes to combat climate change and vote like fresh water and air depends on it, because it does. -Margaret Kingston
The pace of glacier change struck me hard this summer. Never before have humans lived with such a deglaciated Cascades mountain range. Not the settlers, not the fur trappers, not the first people who have been here for 13,000 years or more. Cultures and ecosystems spawned from the retreating edge of the Cordilleran Ice sheet into the Puget Sound area. Alpine glaciers fed streams, rivers, salmon, all kinds of human projects in Washington State. Our societies are shaped by the ice and now we are experiencing glaciers disappear.
I write this at the end of the 2025 hydrological year, waiting for winter snow to shelter the land I love in a cool white blanket. The devastation of the alpine glaciers has surfaced so frequently in conversation these last couple months. Those who have seen the mountains are alarmed as beds of ice they once knew to be hundreds of feet thick look shallow and frail, ice pitches that were once climbed are now grey gullies of rock, and volcanoes which have always been white are unnervingly gray and shrouded in smoke. The realities of climate change in the Northwest are clear.
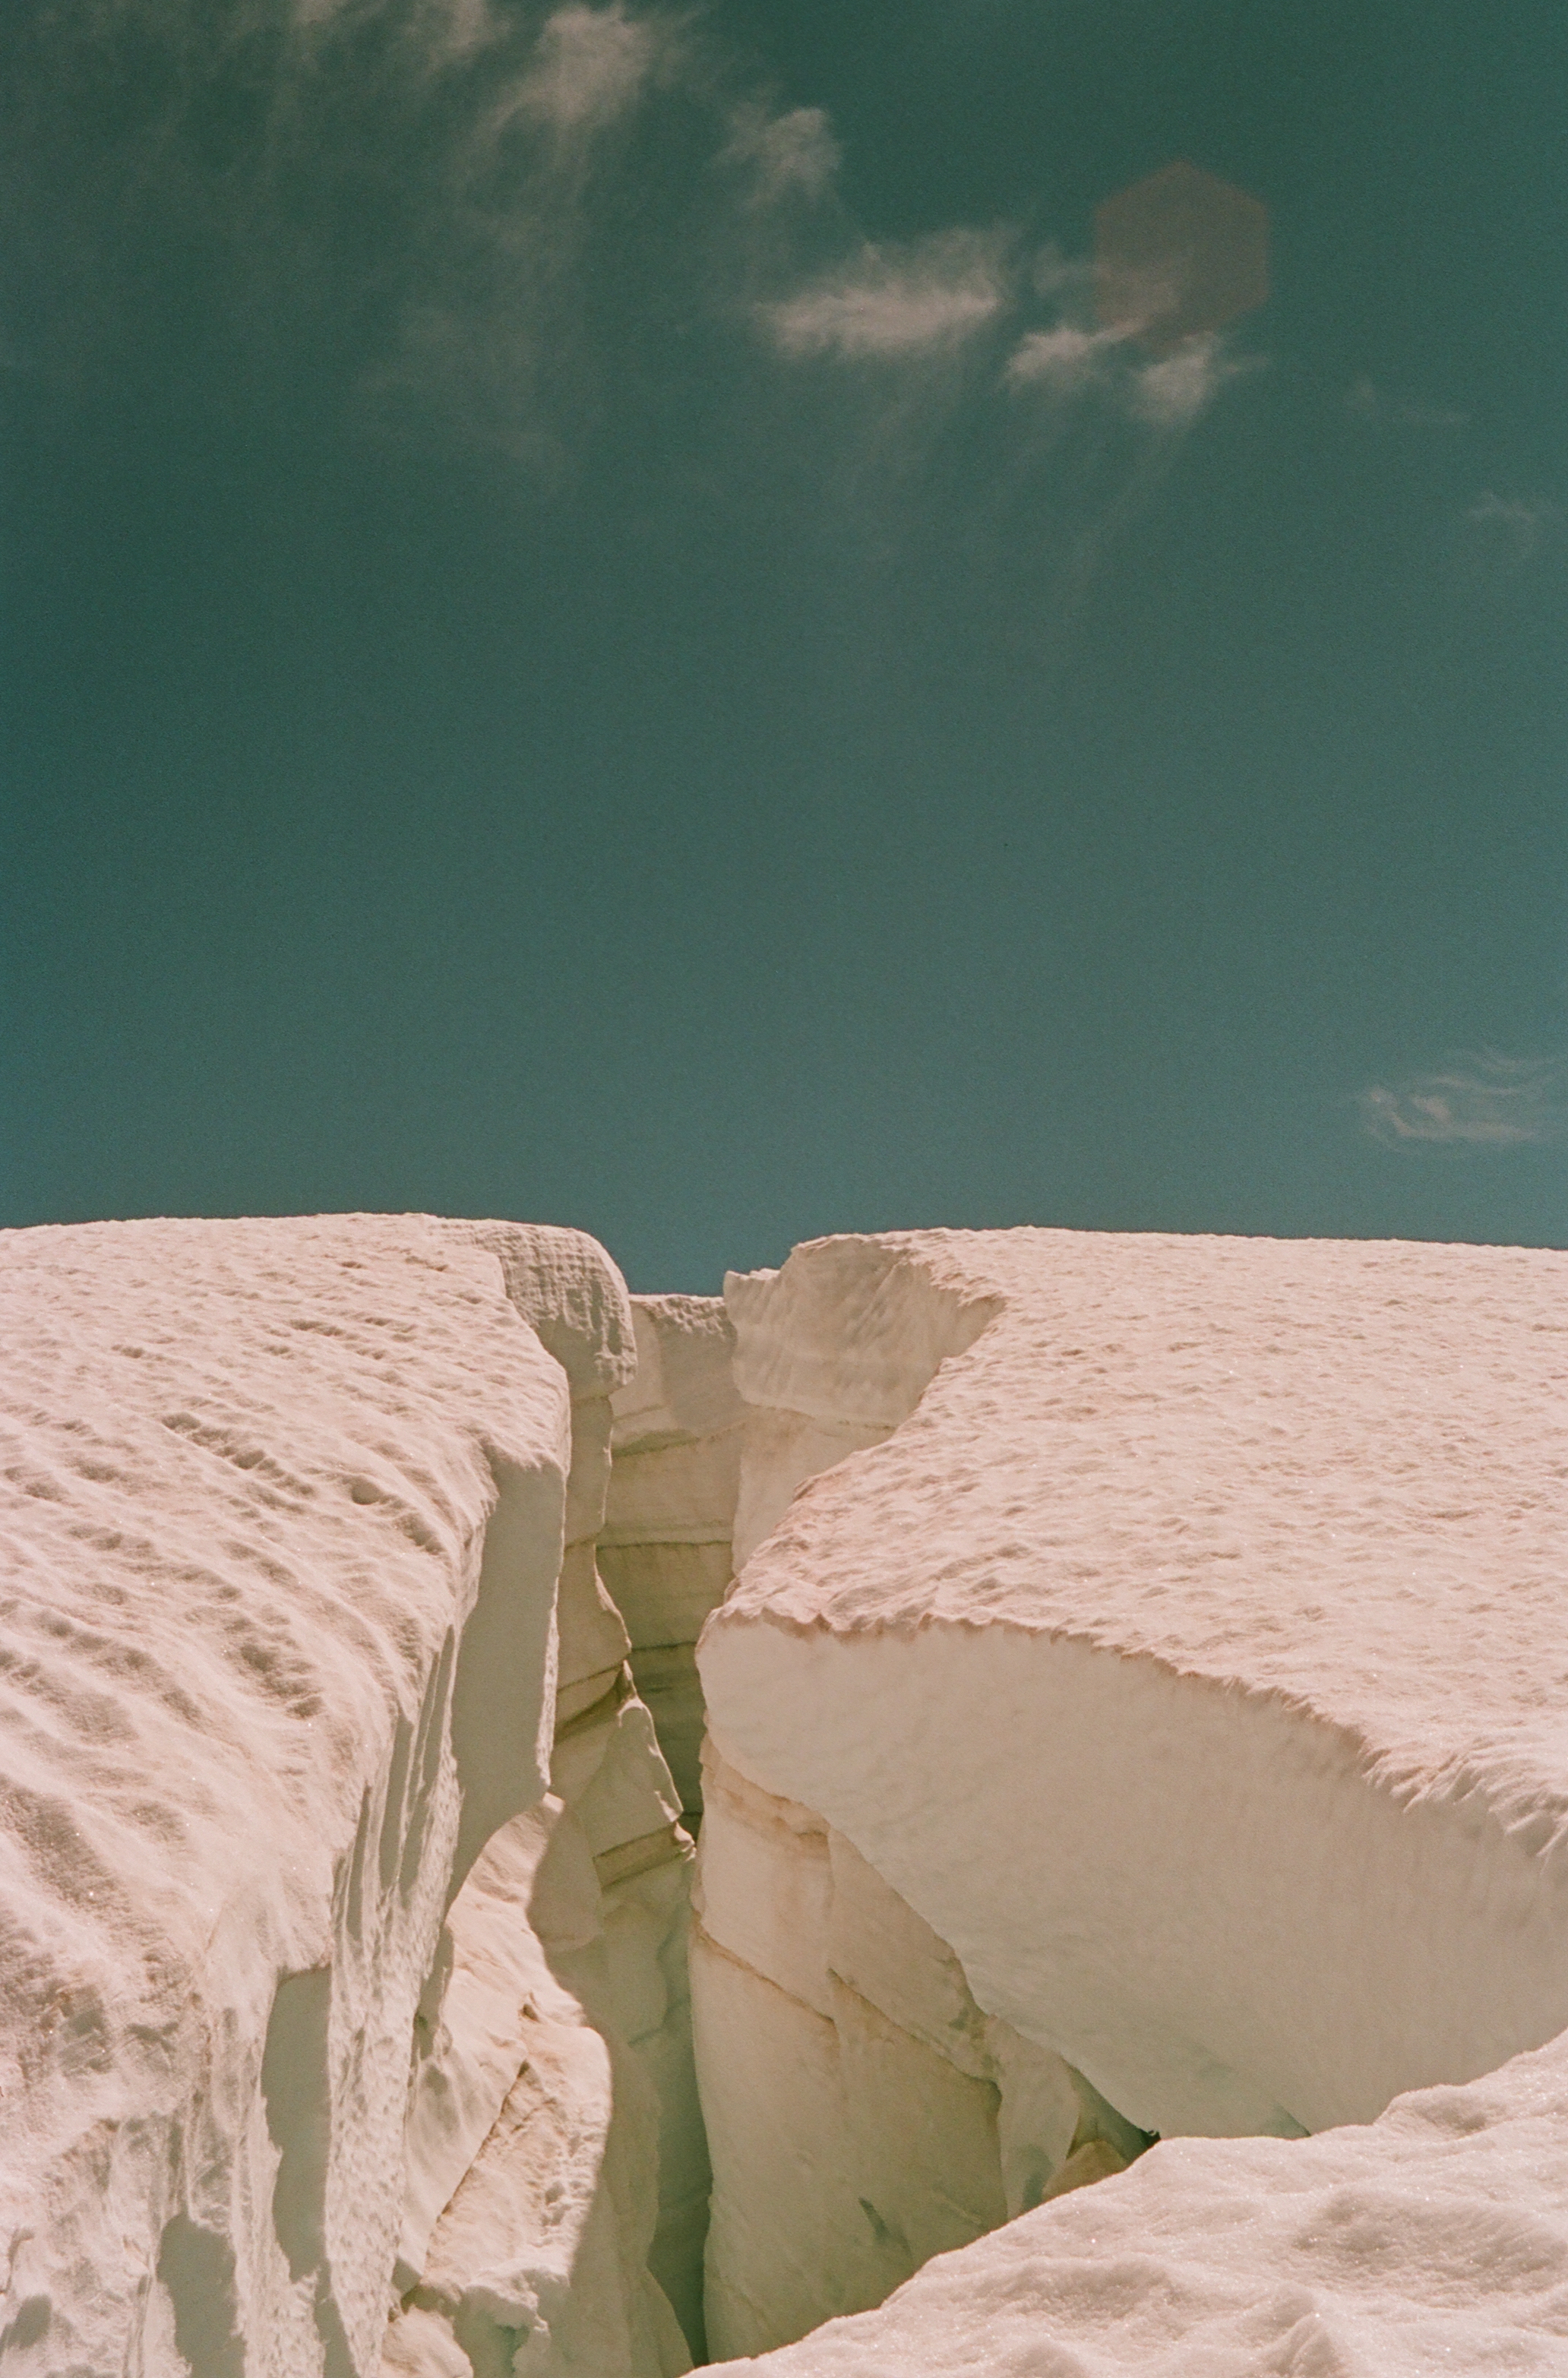
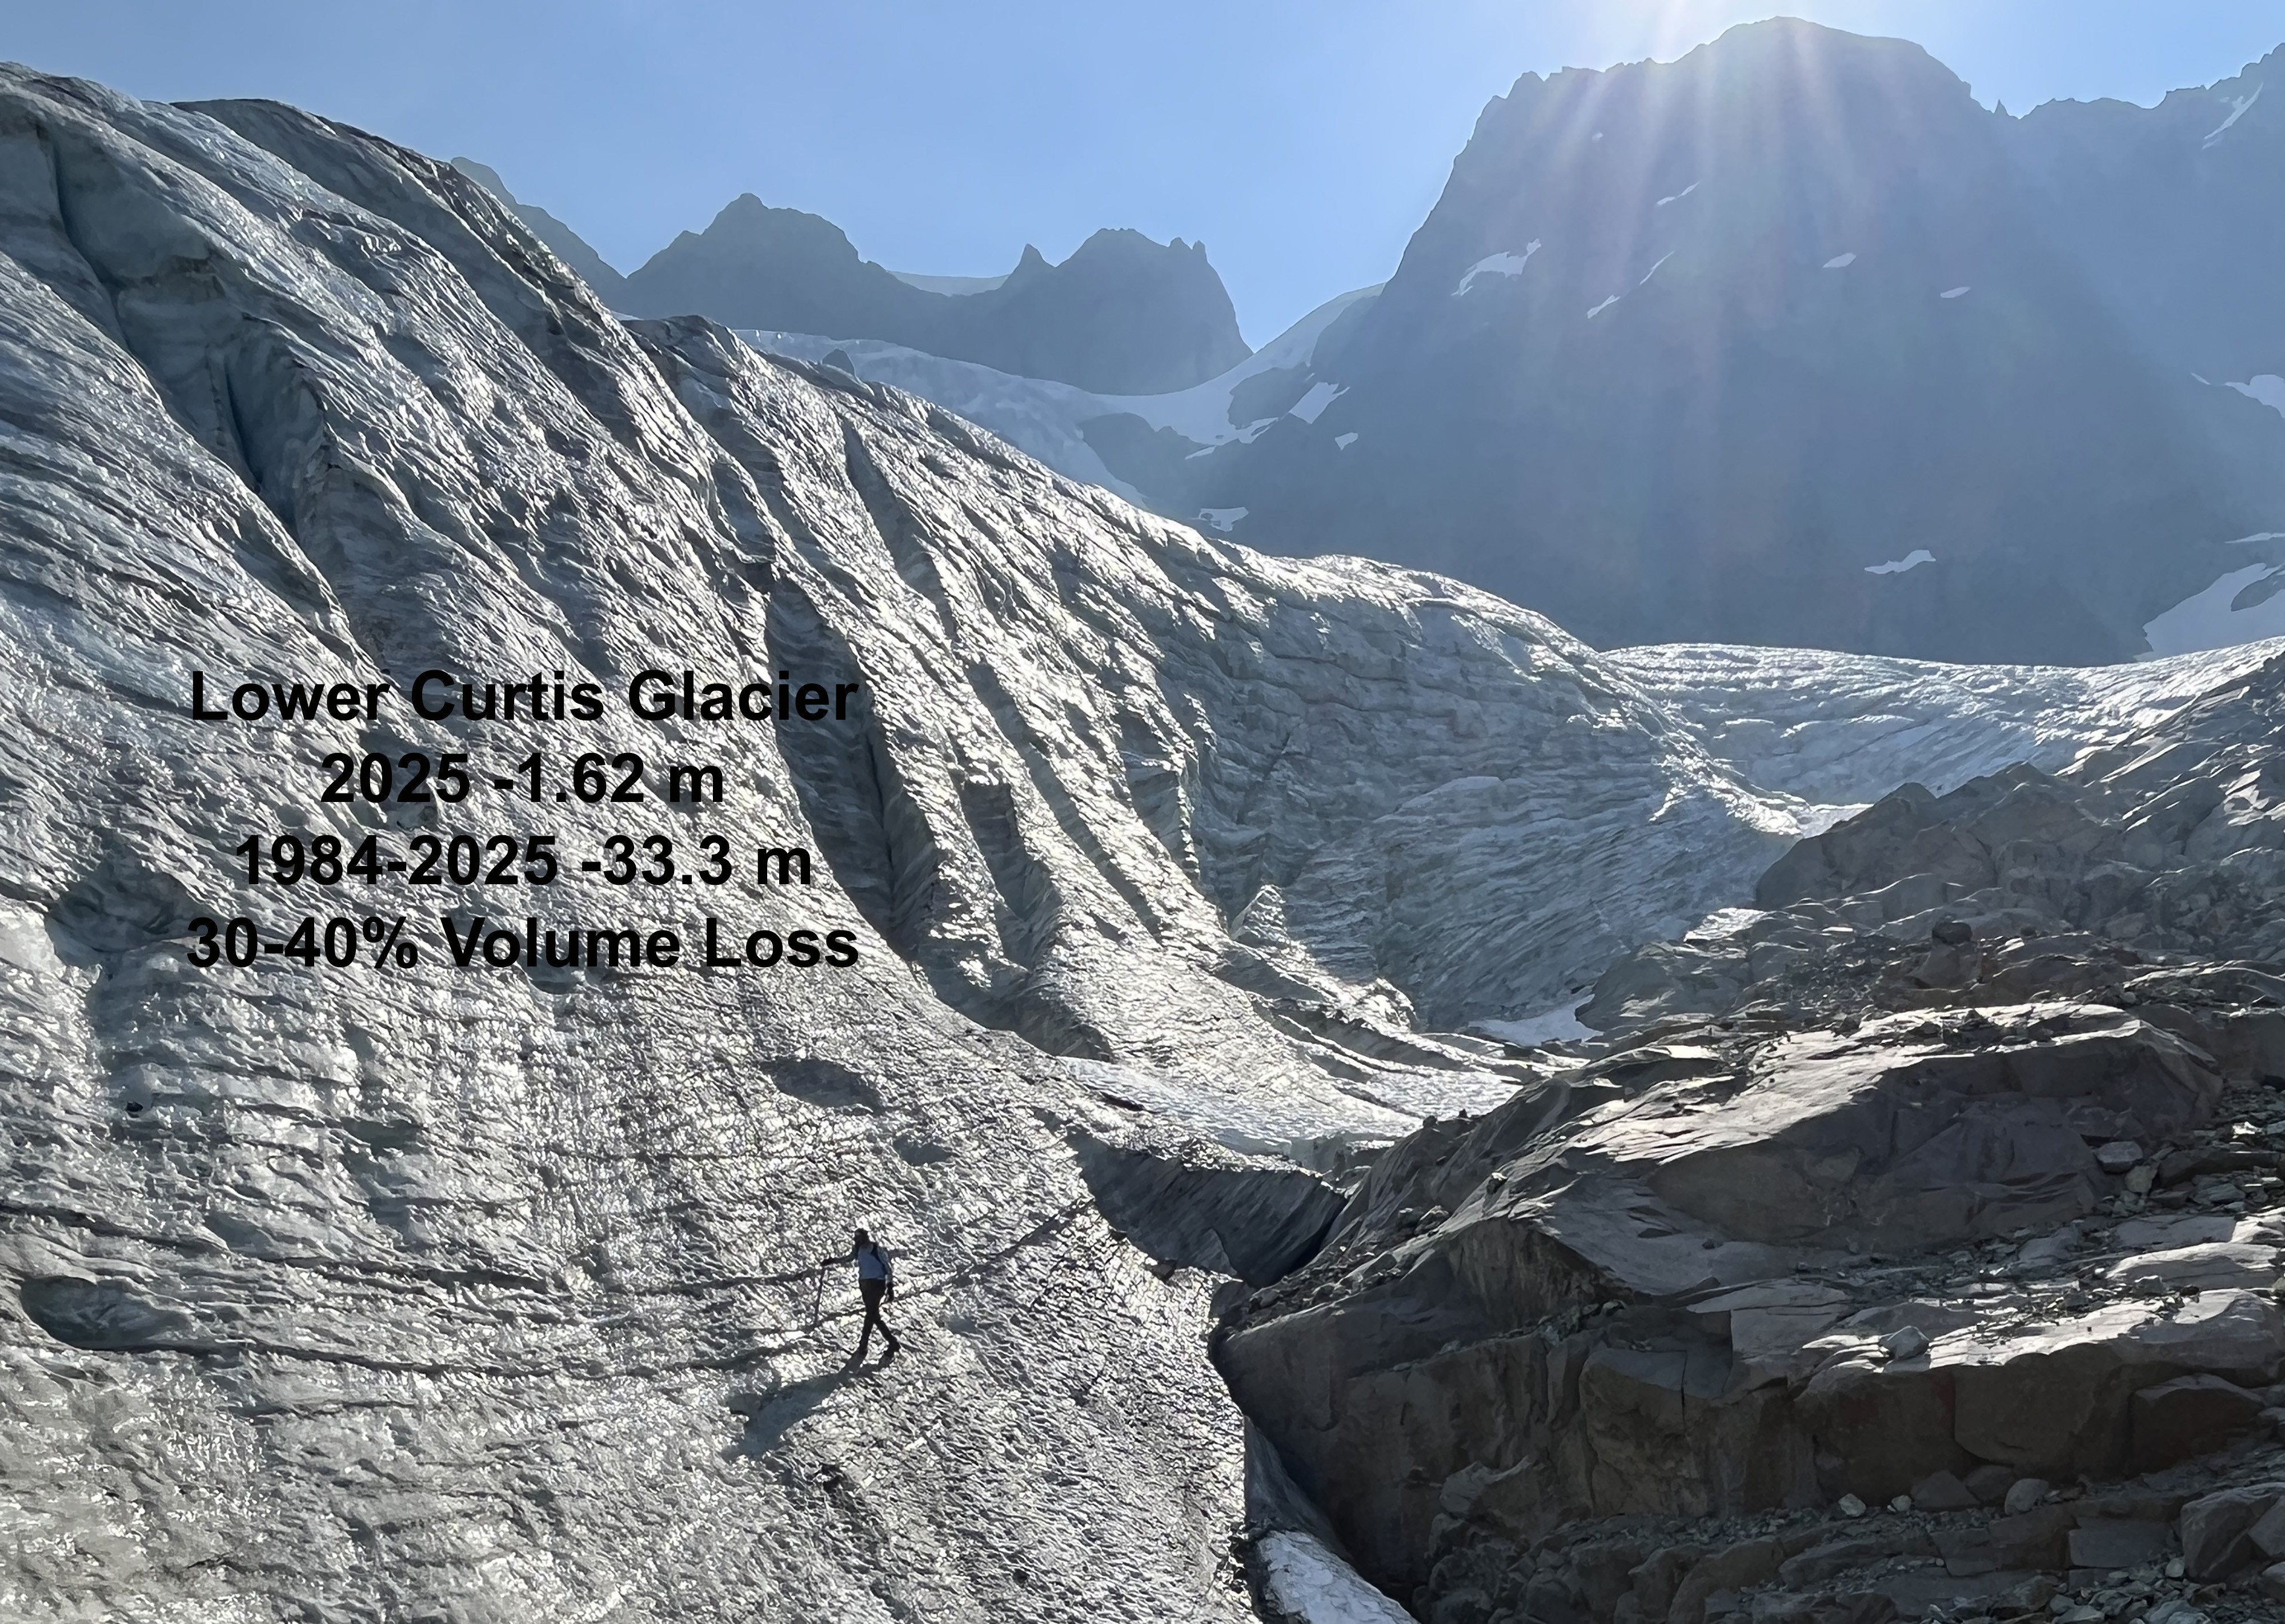
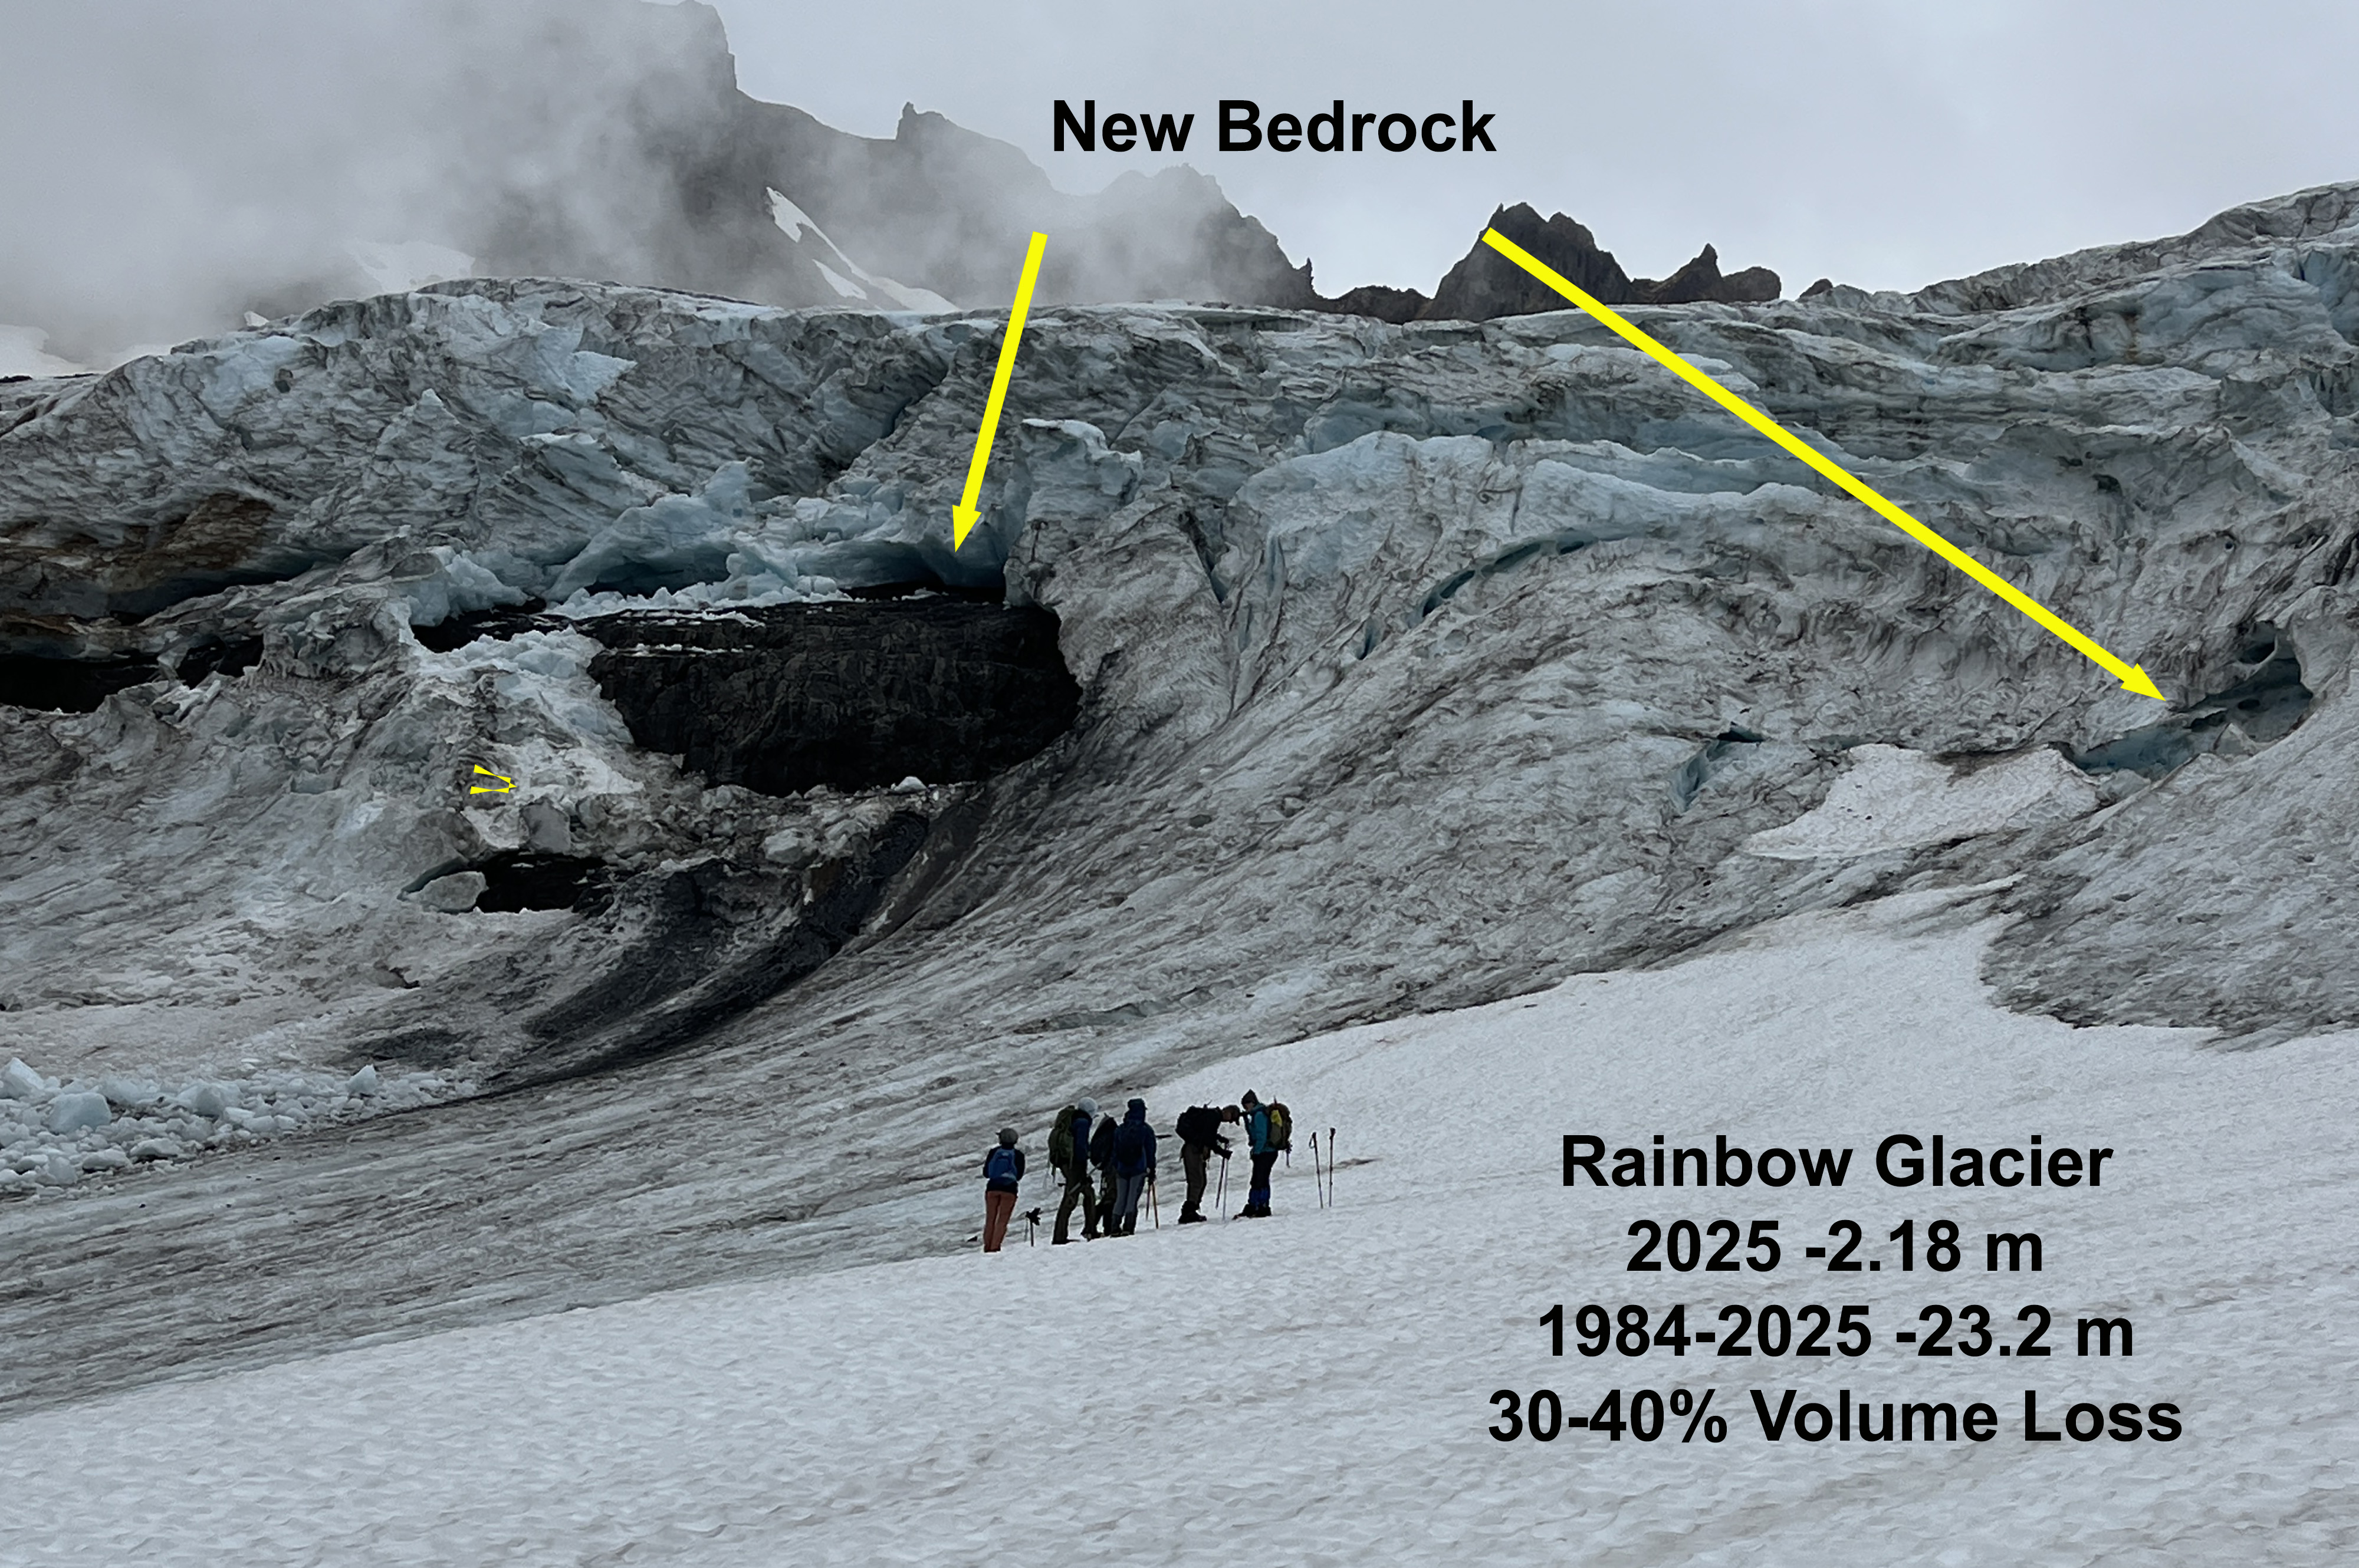
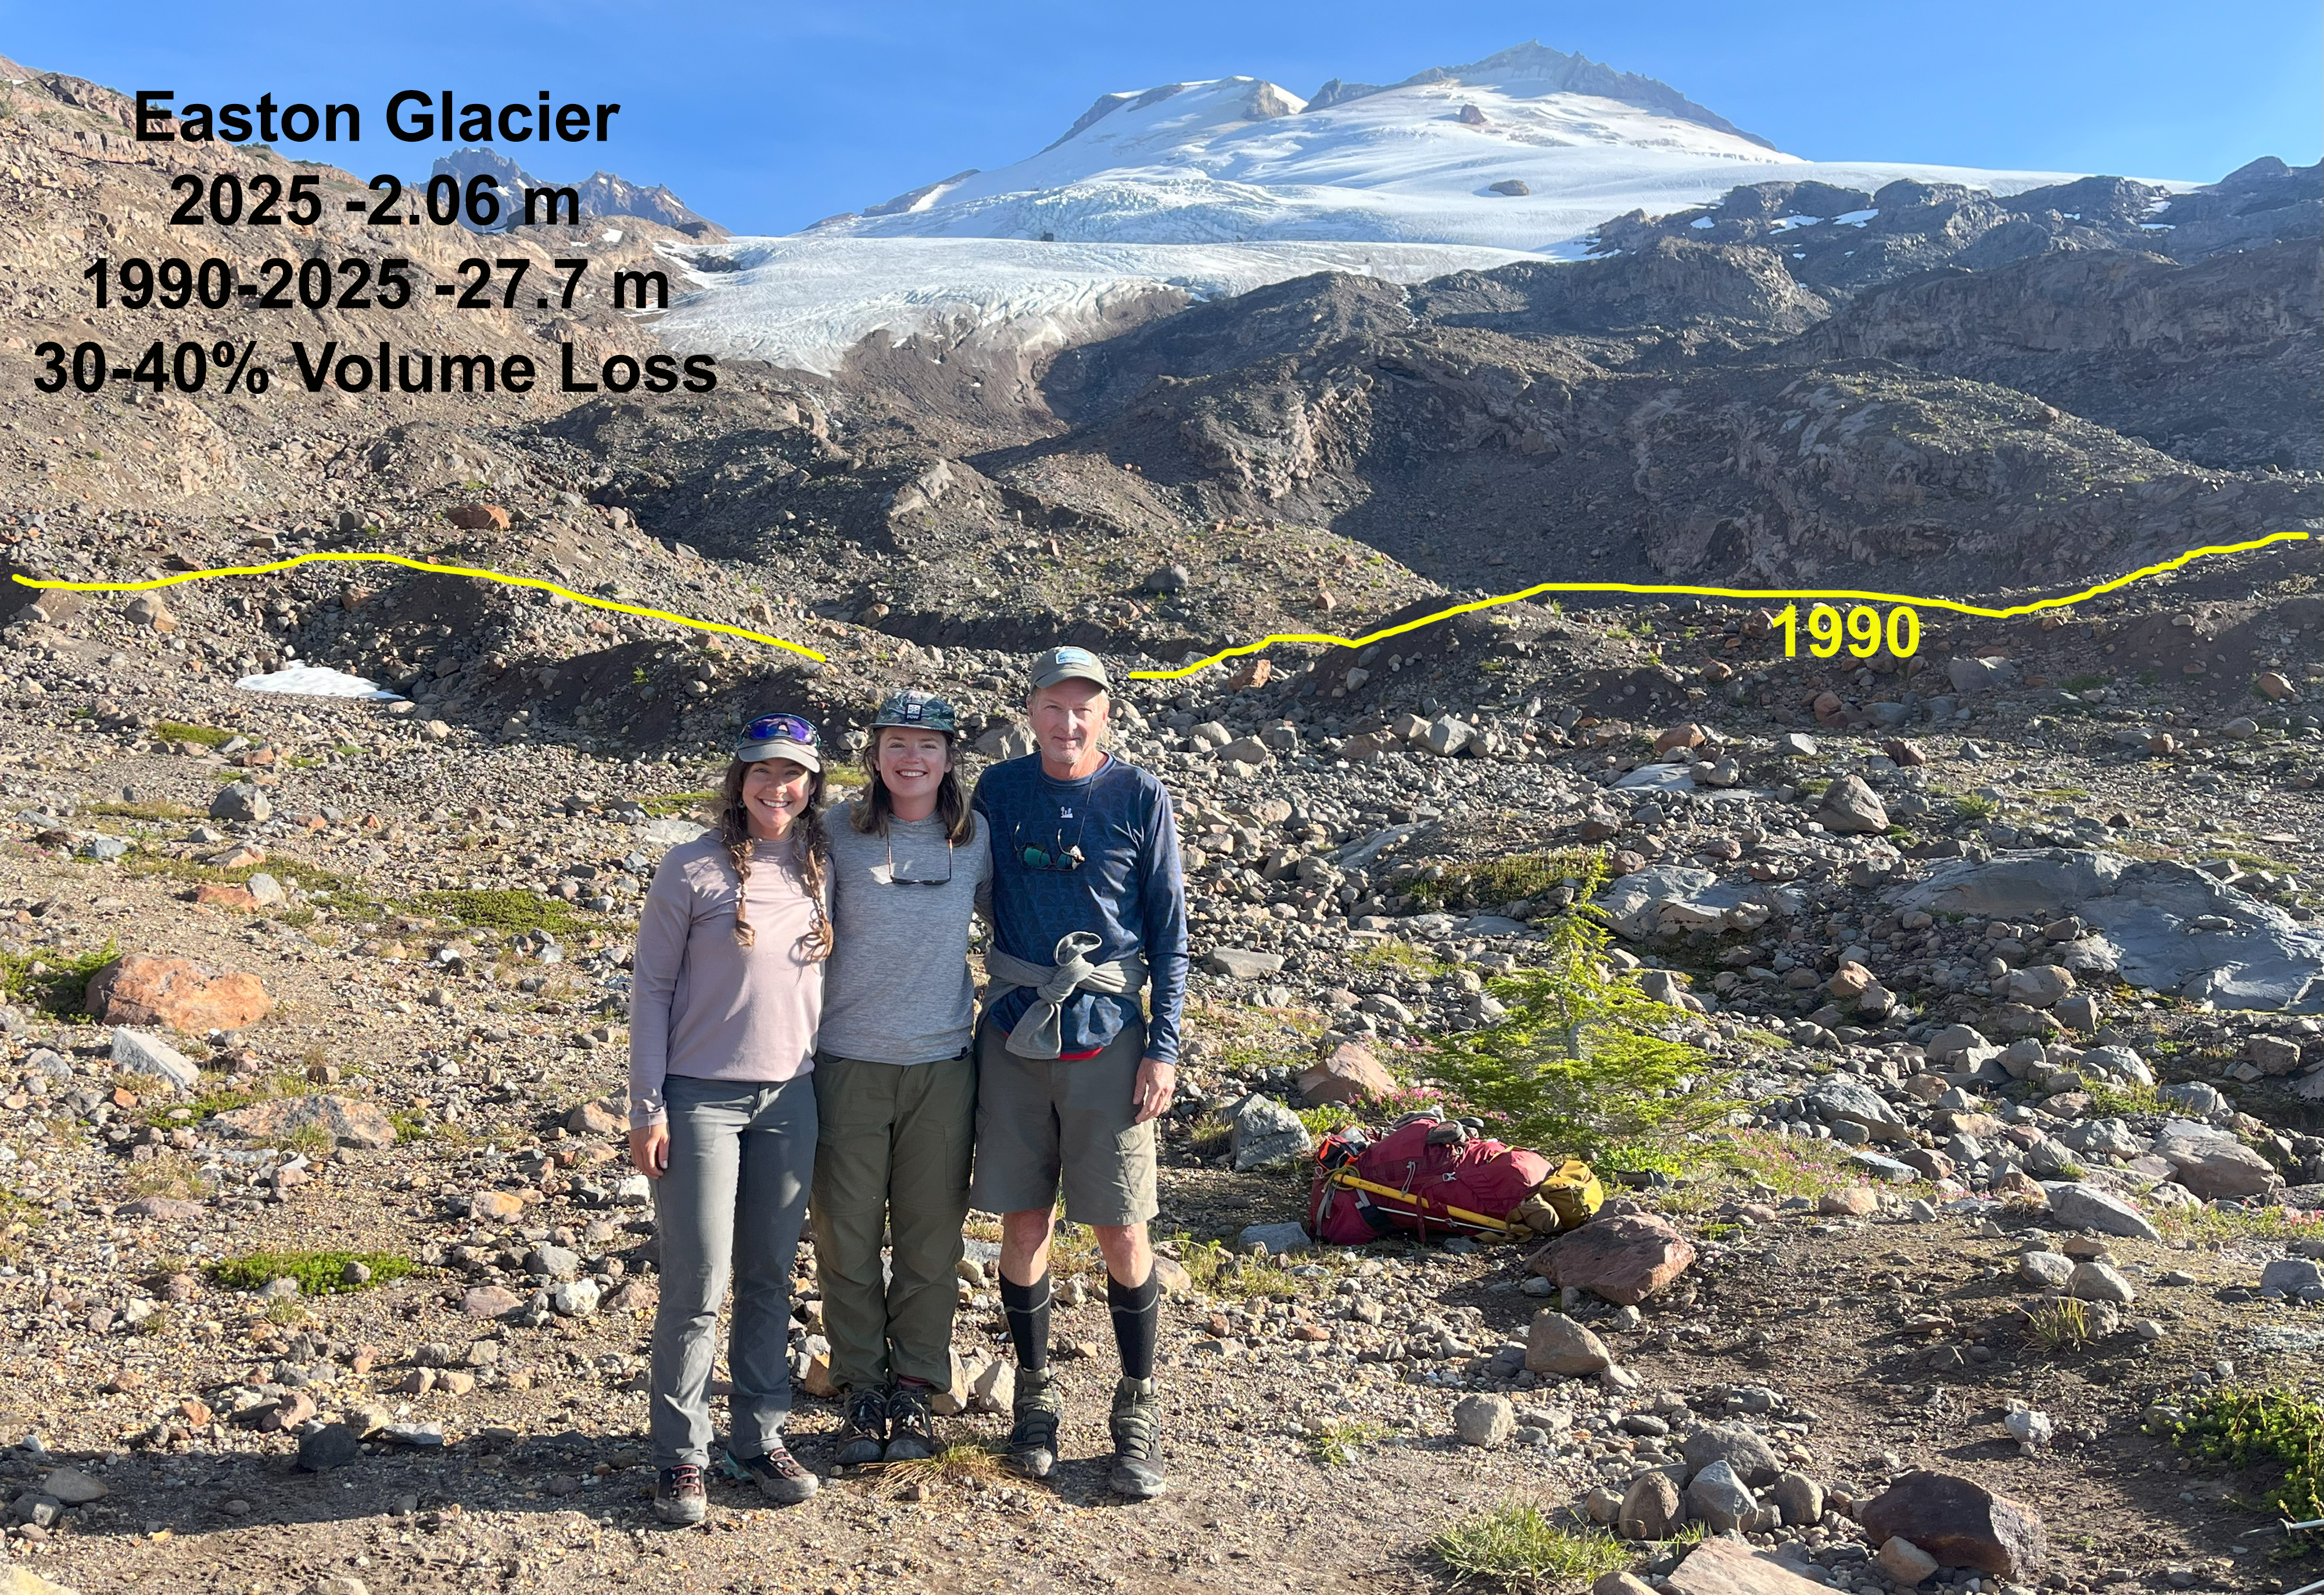
It is a painful time to care about the glaciers of the Cascades. Witnessing the erosion of something so much older and bigger and impactful than myself is staggering. There is much action to be done in this new terrain but for now, I come back to this: I sit in the dying glaciers warm light as the sun rises, summon the deepest snowfall in years and tell the glacier that we care, that we were grateful for all the help watering our food and feeding our oceans and making sure our salmon had somewhere to live. We are here because of you. -Cal WaichlerImage description: This image shows a crevasse on the Easton Glacier of Mount Baker. The saturation is distorted because I shot this photo on 35mm and pre-exposed the film to light and heat to parallel the material effects of global warming on our glacier systems. The Easton glacier is a source of water for Baker Lake, which provides recreation and hydropower to the region. When I see this photo, I think of the impacts of glacial melt to water, energy, cultural, and economic resources in Washington. -Caitlin QuirkColumbia Glacier is one of sixty global reference glaciers. This summer it lost 5% of its volume.Lower Curtis Glacier continues to rapidly thin at the top of the glacier as well as at the terminus. The glacier retained additional avalanche accumulation, leading to a less negative balance than other glaciers.Rainbow Glacier is one of the sixty global reference glaciers. This year new bedrock began to emerge and expand in several icefalls, leading to serac fall.Easton Glacier has retreated 700 m since 1990 and has a number of bedrock areas emerging in icefall up to 2500 m.Lynch Glacier east and west side are separating. The upper basin did retain some snow in 2025.Daniels Glacier lost all snowpack by the end of the summer and bedrock is quickly expanding amongst the glacier.
The trajectory for most North Cascade glaciers is one of fragmentation. This is illustrated by Foss Glacier on the east flank of Mount Hinman, that we began observing annually in 1984 but stopped measuring as it fragmented.Foss Glacier from the top was a 1 km long and nearly 600 m wide glacier. In Sept. 2025 Cal Waichler captured view from the top with the two main fragments now less than 50 m wide and 300 m long.-Mauri Pelto
Leah Pezzetti KING5 meterologist hiked in with us to Lower Curtis Glacier.
The CBS team hiked into Sholes Glacier with usspending the night, and we had three generations of Pelto’s.
Hofsjokull East is snow free on 8-17-2025 in this false color Sentinel image. This leads to ice melt, thinning and bedrock expansion at Point A-D.
Hofsjokull East, Iceland is a small ice cap east of Vatnajokull with a summit elevation of 1100 m. In the last decade the snow line has often been above the ice cap. The ice cap had an area or 4.97 km2 in 2003 declining to 2.51 km2 in 2023 (Iceland Glacier Viewer). In 2024 all 10 glaciers in Iceland had significant mass loss (Pelto, 2025).
In August 2020 the ice cap has lost nearly all of its snow cover, this occurred again in 2023 and 2024. The result in 2025 when the ice cap again lost all its snowcover, is significant glacier surface melt and thinning. This leads to expansion of bedrock. At Point A there has been rapid expansion of the bedrock knob. At Point B and C new bedrock has been exposed and rapidly expanded. At Point D a bedrock rib at the edge of the ice cap has spread into the ice cap.
The lack of snow cover indicates the ice cap no longer has an accumulation zone and cannot survive. In 2025 the ice cap area is 2.10 km2 . Ice cap area has declined by ~60 % in the last 22 years. The story here is similar to that at the larger Prándarjökull 10 km to the northeast. The summer of 2025 in Iceland was exceptional beginning with a May heatwave, followed by a July heatwave. The May heat wave led to high snow lines as summer began on Vatnajokull.
Hofsjokull East is nearly snow free on 8-14-2020 in this false color Sentinel image. Contrast the area of bedrock at Point A-Dto the 2023 and 2025 images.
Hofsjokull East is nearly snow free on 9-3-2023 in this false color Sentinel image. Point B and C now have evident bedrock areas.
Prándarjökull on August 20, 2025 has no retained snowpack-with weeks left in the melt season (Sentinel false color image)
Prándarjökull is an icecap northeast of Vatnajokull that has a summit elevation of 1215 m, and a margin between 875 and 925 m. In 2003 the ice cap had an area of 17.3 km2, declining to 12.8 km2 by 2023 (Iceland Glacier Viewer). In 2024 all 10 glaciers in Iceland had significant mass loss (Pelto, 2025)
In 2021 the ice cap lost at least 90% of its snow cover as noted in the Sentinel image from 8-24-2021. In 2023 The ice cap again lost nearly all of its snow cover.
Prándarjökull on August 31, 2023 has only 5-10% retained snowpack-with weeks left in the melt season (Sentinel false color image)
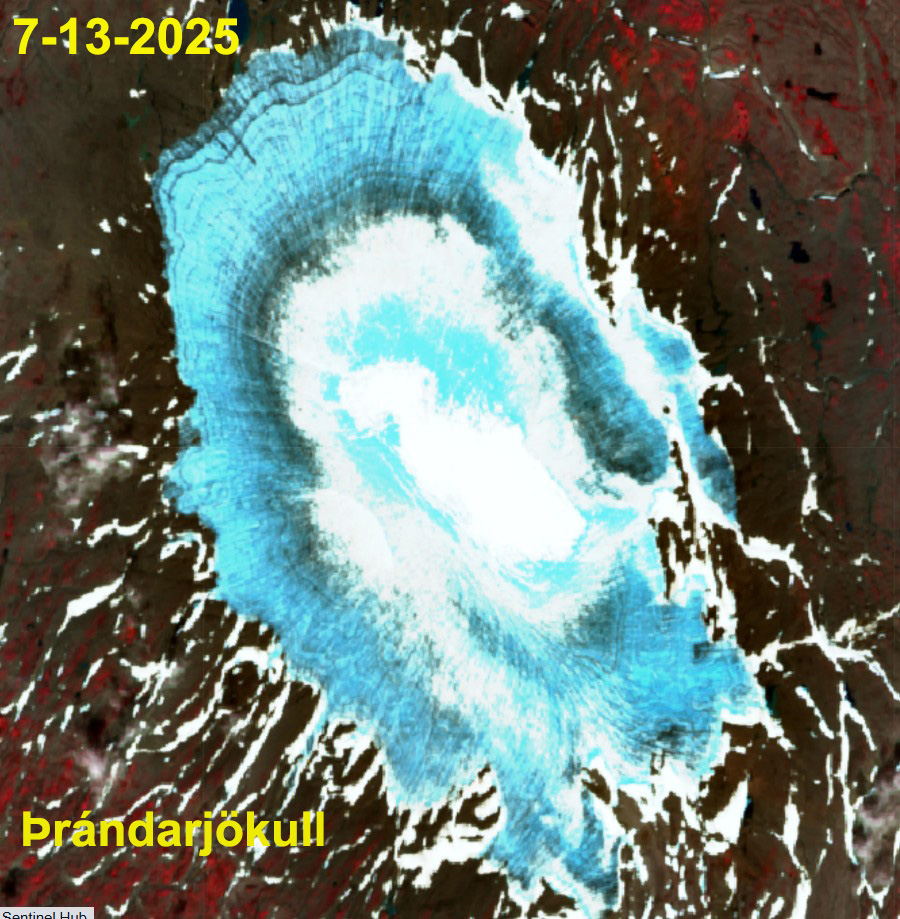
The spring and early summer of 2025 was one of record warmth for Iceland. This led to a rapid rise of the snowline to 900-1000 m on Vatnajokull. By mid-July 60% of the Prándarjökull was snow free. There is an area of water saturated snow-light blue amidst the snowpack.
Prándarjökull on July 13, 2025 the ice caphas 40% retained snow cover-with weeks left in the melt season (Sentinel false color image)
By August 20, 2025 the ice cap had no snow cover. The early exposure of ice in recent years is leading to the continued recession of the ice cap and the intrusion of bedrock areas into the ice cap at Point A and B. At Point C in 2021 recent firn is exposed, that has melted away by 2025. The area of the ice cap has declined to 11.5 km2. There is no recent retained firn-indicating that in the last five year no snow cover has persisted to the end of this summer. This indicates the lack of an accumulation zone, without which the glacier cannot survive.
Prándarjökull on August 31, 2023 has only 5-10% retained snowpack-with weeks left in the melt season (Sentinel false color image)
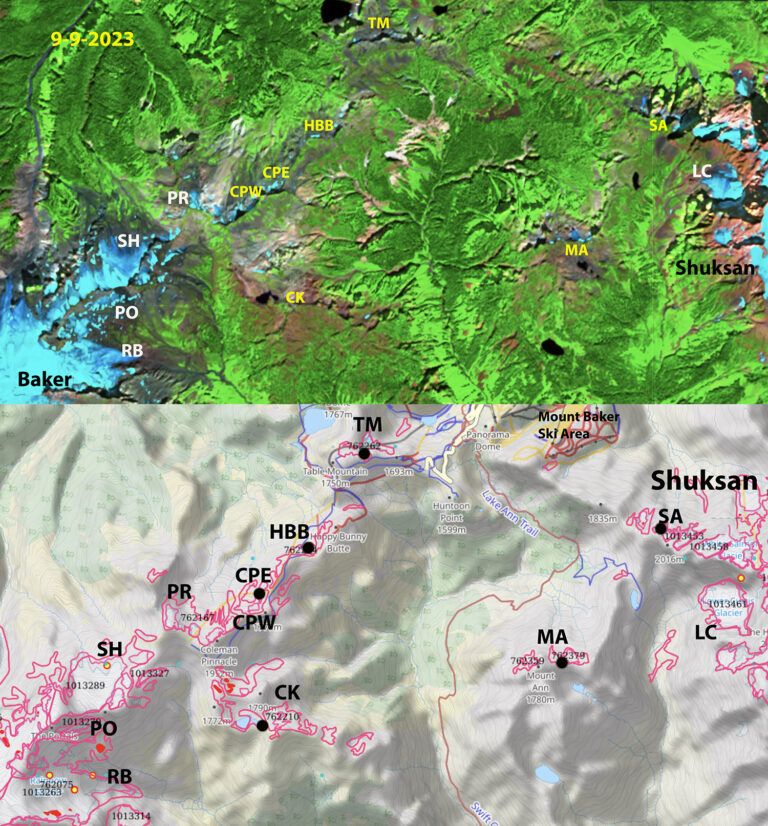
Glaciers on the ridge from Moutn Shuksan to Mount Baker that we observed to be active in mid 1980s, identified in GLIMS map below. Above Sentinel image from 9-9-2023. Glaciers that are no longer glaciers in yellow, seven of them including Mount Ann=MA, Shuksan Arm=SA, Coleman Pinnacle East/West=CPW/CPE, Camp Kiser=CK, Table Mountain=TM and HBB=Happy Bunny Butte. We still monitor each year Lower Curtis, Rainbow and Sholes.
The two most prominent mountains of the North Cascades Mount Shuksan and Mount Baker are connected by a ridge from Shuksan Arm to Ptarmigan Ridge. We visited 12 glaciers along and close to this ridge in the mid-1980s, to decide which to monitor annually. At that time each of these had active crevasses and significant area of glacier ice. We By the end of 2023 seven of the twelve glaciers are gone. We continue to monitor Lower Curtis, Rainbow and Sholes Glacier in detail. Portals and Ptarmigan Ridge Glacier which we visit every year, but do not assess in detail, will likely disappear in the next few years. Below is the evolving area and the date the glacier was lost, the area reported in the 1958/84 period and 2015 are from GLIMS and the 2023 area we determined from Sentinel imagery.
Glacier
GLIMS ID
Year Lost
1958/84 Area
2015 Area
2023 Area
Camp Kiser
G238275E48809N
1993
0.22
0.03
0
Happy Bunny Butte
G238277E48834N
2005
0.166
0
0
Table Mountain
G238295E48850N
2015
0.158
0
0.008
Coleman Pinnacle
G238269E48826N
2018
0.56
0.031
0.018
Mount Ann
G238341E48818N
2022
0.12
0.07
0.01
Shuksan Arm
G238362E48838N
2023
0.16
0.07
0.03
1963 image of Ptarmigan Ridge sent to me by Austin Post.
Ptarmigan Ridge glaciers in 1993-all small but still all nearly joined.
In 2024 the lack of glacier ice or perennial snow along Ptarmigan Ridge is evident.
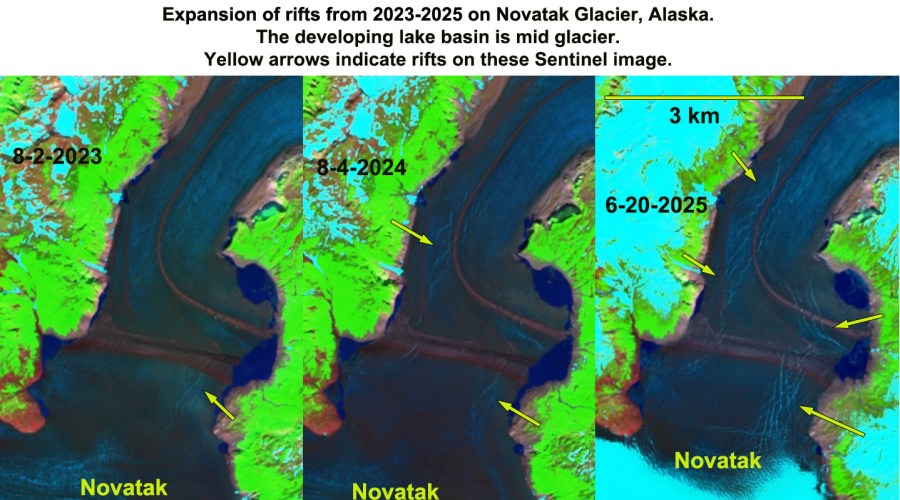
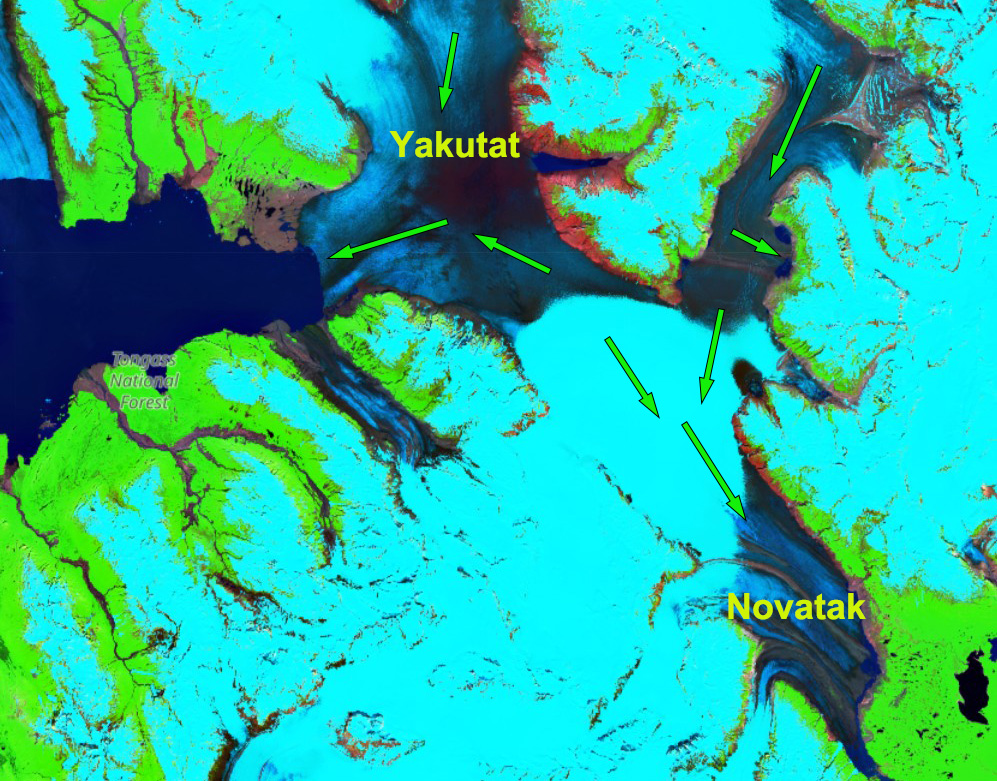
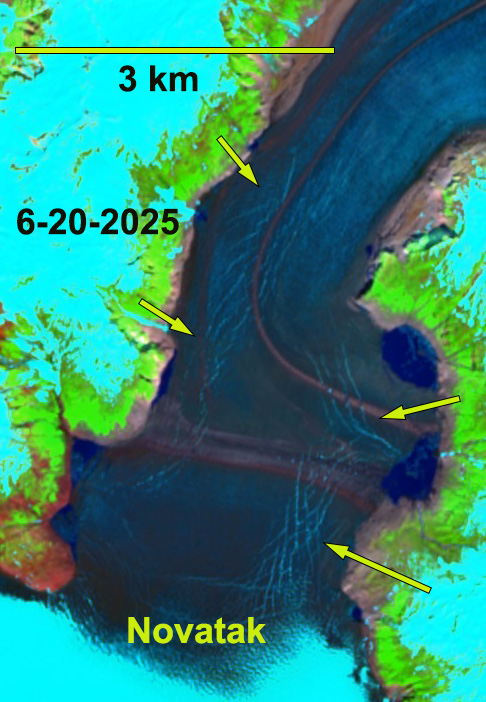
A network of extensive rifts have developed since 2023, yellow arrows. The fringing proglacial lake has not expanded. Rifting indicates uplift from partially floating glacier area.
Ice flow in the region around the developing lake, which is near the boundary with Yakutat Glacier in Sentinel Image from June 20, 2025
Novatak Glacier is between the Yakutat and East Novatak Glacier in southeast Alaska. The glacier retreated 1 km from 1987-2023 (NASA EO, 2015). The majority of the accumulation zone of these three glaciers is below 1000 m, which has made them particularly vulnerable to the warming climate. The result has been expansion of the proglacial lake, Harlequin Lake, at Yakutat Glacier from 1984 to 2024 from 50 km2 to 108 km2 (Pelto & NASA EO, 2024). There was no lake in 1908.
Novatak Glacier has been slow to form a substantial terminus lake unlike its neighbors, possibly because it lacks a sufficient basin. This has limited the retreat of this glacier as it thins. The developing rifts does show a large lake will form, with an area of 10-12 km2 . This will isolate the terminus from the main inflow to Novatak’s terminus, which will hasten a rapid meltdown. The rifts represent places where water level change causes flexure of the glacier, leading to their formation and expansion. They are not related to flow, but to uplift and down fall of ice where it is somewhat afloat. Rapid meltwater inflow to this basin will raise water level further stressing this region this summer. The degree of rifting indicates the ice is thin, but none are open enough to see water. This suggests breakup will not happen this summer. This type of rifting in 2010 and 2015 led to further breakups at Yakutat Glacier.
June 20, 2025 rifting of Novatak Glacier.The rifts represent places where water level change causes flexure of the glacier, leading to their formation and expansion. They are not related to flow, but to uplift and down fall.
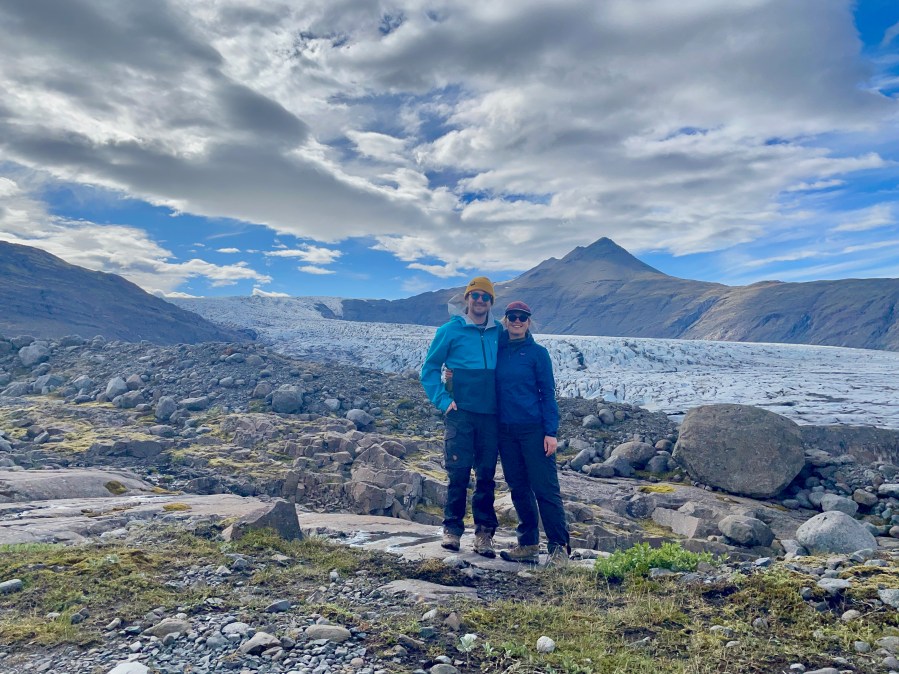
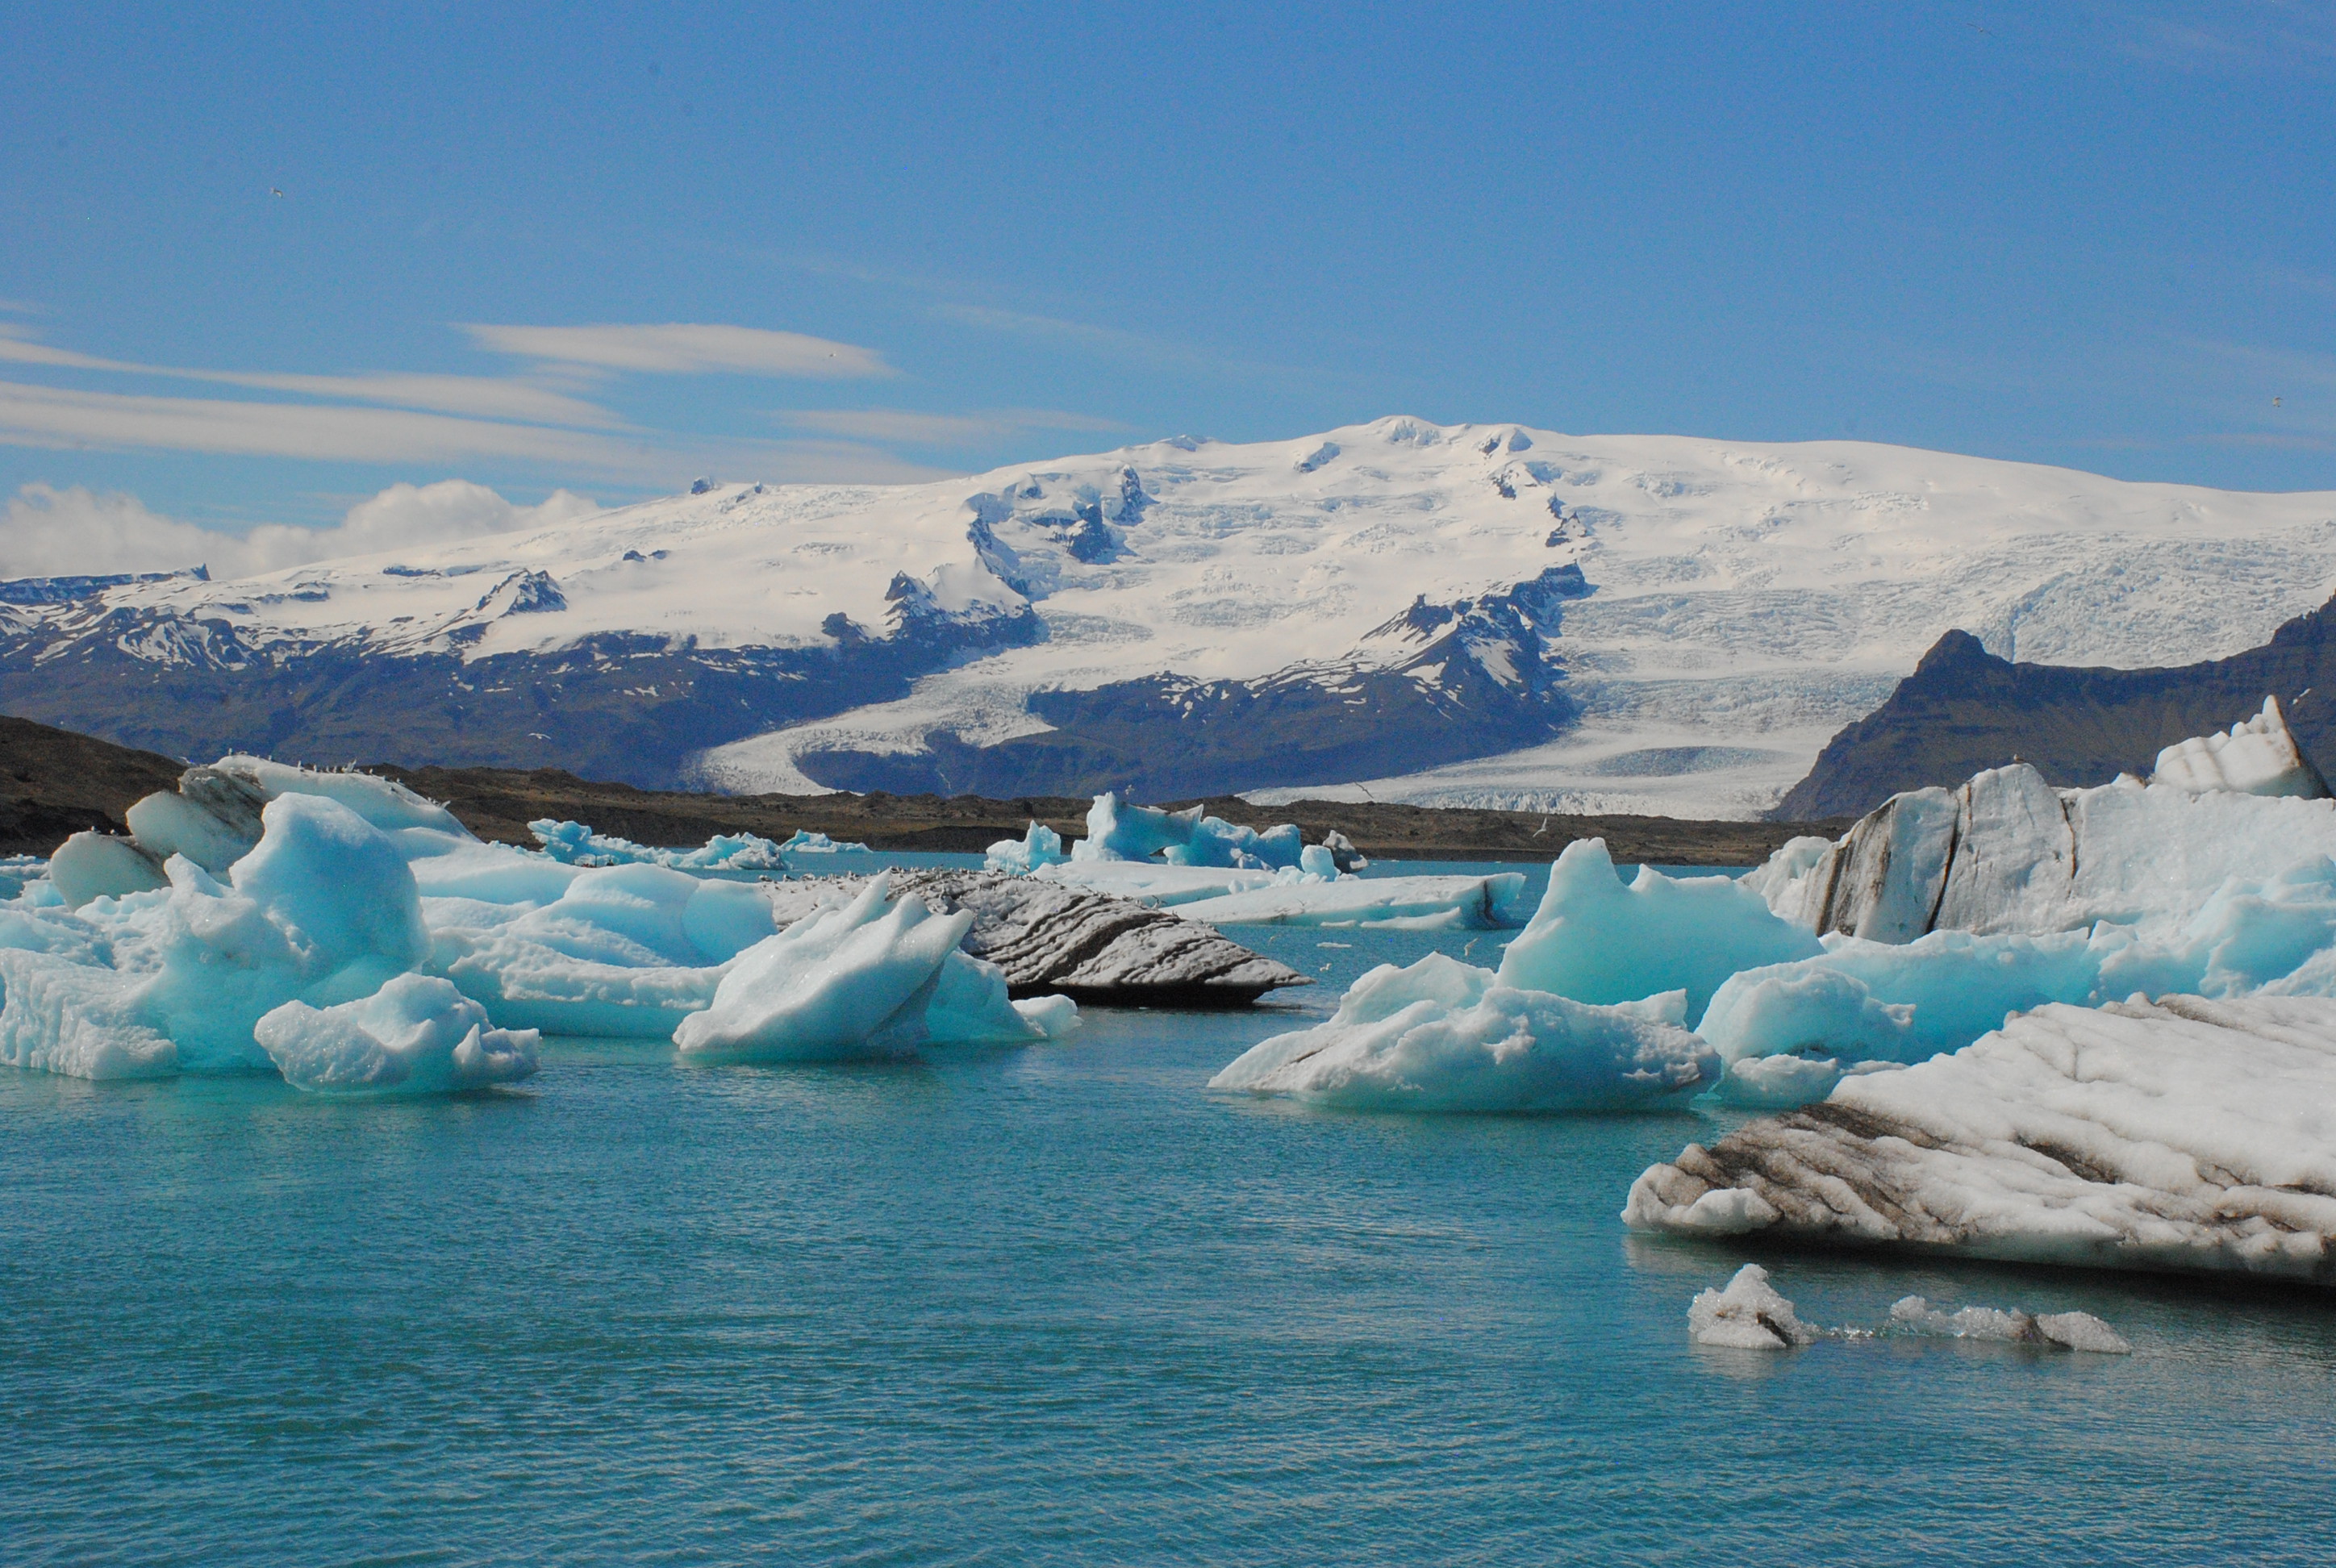
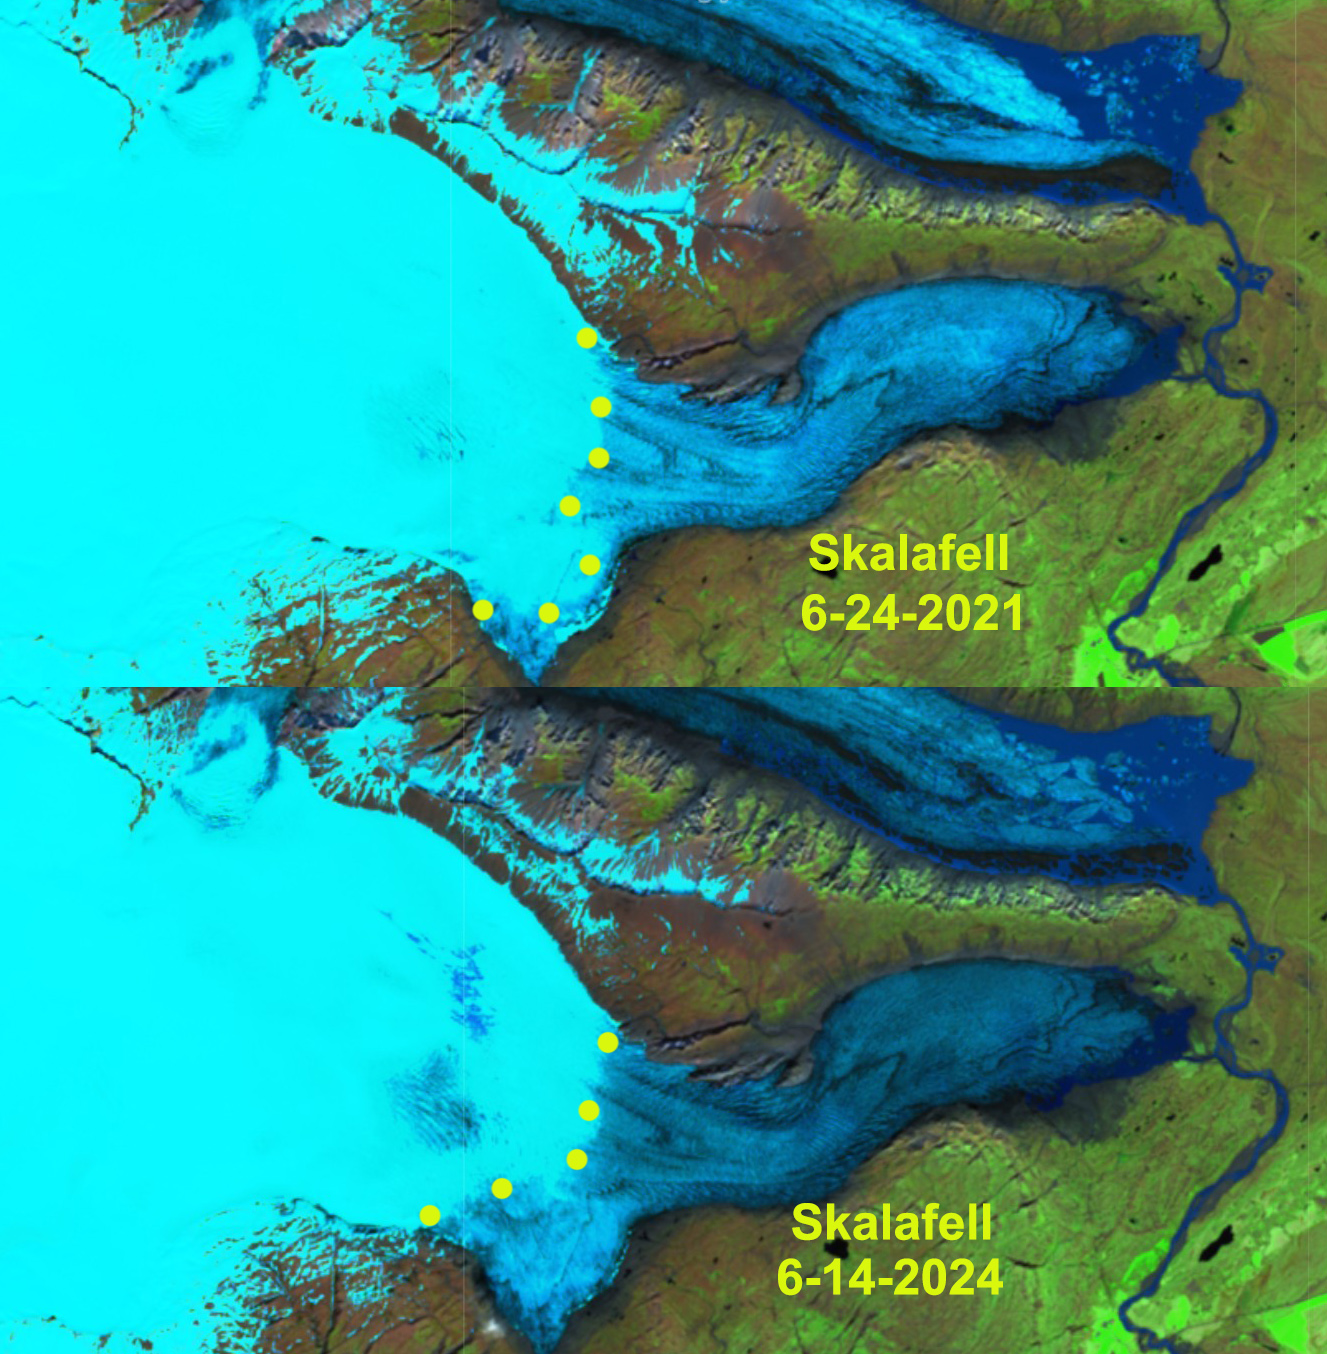
A view across Jokulsarlon Lagoon toward Fjalljökull and Hrutarjökull of the ÖræfajökullIce Capon May 25 above. Below, is Skalafellsjokull of Vatnajökull Ice cap on May 26 with Jill and Kevin Duffy in foreground next to lateral moraine (Jill Pelto). Öræfajökull is a connected to Vatnajökull.
Iceland experienced an unusually warm and sunny May, with record high temperatures averaging 10 C above average. This led to a rapid rise in the snow line to elevations more typical of late June than May on the ice caps in southern Iceland, here both Vatnajökull and its southern extension Öræfajökull. We use Sentinel images (Mauri Pelto annotated) and photographs from (Jill Pelto) to illustrate. The University of Maine Sea to Sky Experience explored Iceland in May, and Jill as the artist faculty for the program had a chance to see Iceland with blue sky days.Most days during my two weeks in Iceland were full sun with high temperatures from 10-15 C. The record heatwave reaching into the low 20 C range, rare even for summer here. The lower parts of outlet glaciers already were mostly bare ice, even though melt season should not really have begun yet. Locals were shocked by the weather, and most I heard from were not happy about it, even though it was “nice” out.
On May 20, 2025 the snow line on the southern part of the Öræfajökull Ice Cap averages 800 m, purple dots. SK=Skaftafells, SV=Svinafells, HR=Hrutarjokull, KV=Kviar, FJ=Fjalls, JL=Jokulsarlon Lagoon, H1=Southern Highway.
As May began conditions were typical with the snow line not far from the glacier terminus areas at 350-400 m, May 2 image of Skalafellsjökull. By May 20, the snow line had risen to 750-800 m, a rapid rise of ~400 m in three weeks, represents more than 50% of the rise that should occur by end of summer. By May 26, (Jill image) the snowline had risen further to 800 m+. This snow line elevation is above the typical elevation seen in latter June other years (see below). In 2024 all ten glaciers in Iceland had a negative mass balance (WGMS, 2025). The rapid melt in May 2025, indicates that 2025 will see similar widespread mass loss.
Hrutarjökull with snowline at 800 m on May 26, 2025.Skalafellsjökull on May 2 and 20, 2025 illustrating rapid snow line rise (yellow dots). Contrast that to the images from mid-late June in 2021 and 2024, below.
As April ends there is a sharp snowline ranging from 1200 m at Mount Baker to 1400 m at Cascade Pass. Above 1500 m the melt season is just getting started.
As the accumulation season comes to an end for North Cascade glaciers it is worth reviewing this winter and looking ahead with a forecast for glacier mass balance by the end of summer 2025. The winter of 2025 at NOAA’s Washington Cascade Mountain West Division 5 records indicate that this winter was below the declining trendline of total precipitation with a mean of 54.8 inches, down slightly from last year. Winter temperatures were again warm at 33.2o F but close to the expected rising trend line average.
The 1946 to 2025 winter (November-March) mean temperature and total precipitation for the Western Cascade Mountains-Division 5 weather stations.
The mean April 1 snow water equivalent (swe) at the six North Cascade Snotel sites with a consistent long term record was 0.72 m. This is below the declining trend line and 31% below the long term average for the 1946-2025 period. This is above the 2024 value, but in the lowest quintile. Mount Baker ski area has reported 585 inches of snowfall through April 21, which is ~30% percentile. April 1 swe is the key date for asssessment for winter snowpack water resources. For glaciers the accumulation season typically continues until the end or April or early May. This year snowpack depth at Mount Baker Ski Area (1280 m) increased from 148 inches on April 1 to 164 inches on April 9 and then declining to 119 inches by May 1 (80% of normal). A similar pattern was seen at Stevens Pass-Grace Lake station (1460 m) with snowpack depth on April 1 of 107 inches, increasing to 114 inches by April 9 and decreasing to 82 inches by May 1. These stations are several hundred meters below glacier elevations. At Lyman Lake Snotel (1800 m) snowpack SWE which most closely matches the glacier elevations was 40.1 inches rising to 42.5 inches by April 11 and declining to 35.9 inches by May 1, ~60% of normal. At the Middle Fork Nooksack site (1520 m) snowpack was 44.8 inches SWE on April 1, rising to 49 inches by April 11 and declining to 46 inches on May 1, 67% of normal . This illustrates that at glacier elevations snowpack would have also increased in mid-April, before a slow decline in the latter part of the month. There were a number of atmospheric rivers that drove a higher snowline than usual as May starts, but also led to a rapid increase in snowpack above the snowline.
The mean April 1 SWE from 1946-2025 at six long term SNOTEL stations: Stampede Pass, Fish Lake, Stevens Pass, Lyman Lake, Park Creek and Rainy Pass.
As the melt season begins, based on the above the winter snowpack on glaciers on May 1 are 70-80% of normal. Eric Gilbertson measured snowpack on the summit Colfax Peak at 17.3 ft (5.27 m) on April 18, 2025. This is a location that is to some extent wind scoured and would be less than the depth on the adjacent glacier, a normal year there is 8-9 m of snowpack at 2300-2800 m. On Eldorado Peak they found 25.3 feet on April 27, 2025. This is the depth expected for this location in a year with 75-80% of normal snowpack. It is a location that appears to balance enhanced deposition and scour. Weather conditions in the Pacific Northwest are forecast to have above average temperatures for the upcoming 90 day period. This combined with the below average snowpack on glaciers on May 1, will yield another year where ice thickness loss exceeds 1 m across the glaciers, as each of the last four years have. The average from 2014-2024 has been -1.41 m, which is a 1.5 thick slice of the glacier lost each year. The range expected this year is -1.2 m to -2.4 m. How much will depend on the specific weather and the frequency and intensity of heat waves.
Mean mass balance observed in the field annually by the North Cascade Glacier Climate Project.
March 21, 2025, the “World Day for Glaciers”, is part of the UN International Year for Glaciers’ Preservation.” Rapid and accelerating glacier loss this century led to this day. In 2023 and 2024 for the first time all 58-reporting Global Reference glaciers had a negative mass balance. Acceleration of glacier’s disappearing led to creation of an extinct glacier data layer in GLIMS global glacier inventory.
To preserve a glacier, we have to understand how a glacier is formed. Easton Glacier, Mount Baker is our sample location, we’ve monitored this Global Reference for four decades. Easton still has an accumulation zone and may survive current climate at a reduced size. We’ve observed 28 North Cascade glaciers disappear this century, including Ice Worm Glacier after visiting every year for 40 years, lost in 2023.
Recipe: Creating a North Cascade Glacier
Location with cold temperatures 7+months/year.
Substantial snowfall 10 m on slope of 10-30O.
Let stand 2-4 decades, with melting, refreezing and burial creating dense ice, until thickness exceeds 20 m and a volume over 500,000 m3.
Movement will commence and crevasses develop.
Snowmaking
Easton Glacier area is 2.5 km2 and is losing 1.5 m water equivalent thickness annually, this is 3.75 million m3 of water equivalent snow.
Largest snow making operation is Killington, VT, daily maximum capacity of 35,000 m3 of water converted to snow.
At max-capacity the 2000+ snow guns require 108 days to produce 3.75 million m3.
Address environmental laws and logistics of deployment and maintenance for water piping, snow gun placement and electricity in harsh environment of avalanches and crevasses.
Geotextile:
Cover 1.5 million m2 (60%) of Easton Glacier with geotextiles installed each summer and removed in winter.
Summer recreation would no longer viable.
The short-lived geotextiles cost ~$2 m2.
Anchoring and connecting on a crevassed glacier very difficult,
Renewables:
When I began in 1984 solar and wind power were not significant electricity sources.
Global Solar Photovoltaic energy production capacity rose from 4 GW in 2004 to 1600 GW in 2023.
Global Wind power capacity rose from 48 GW in 2004 to 1070 GW in 2023.
With 500 MW added in 2023 this is a preservative that can work in concert with power grid improvement.
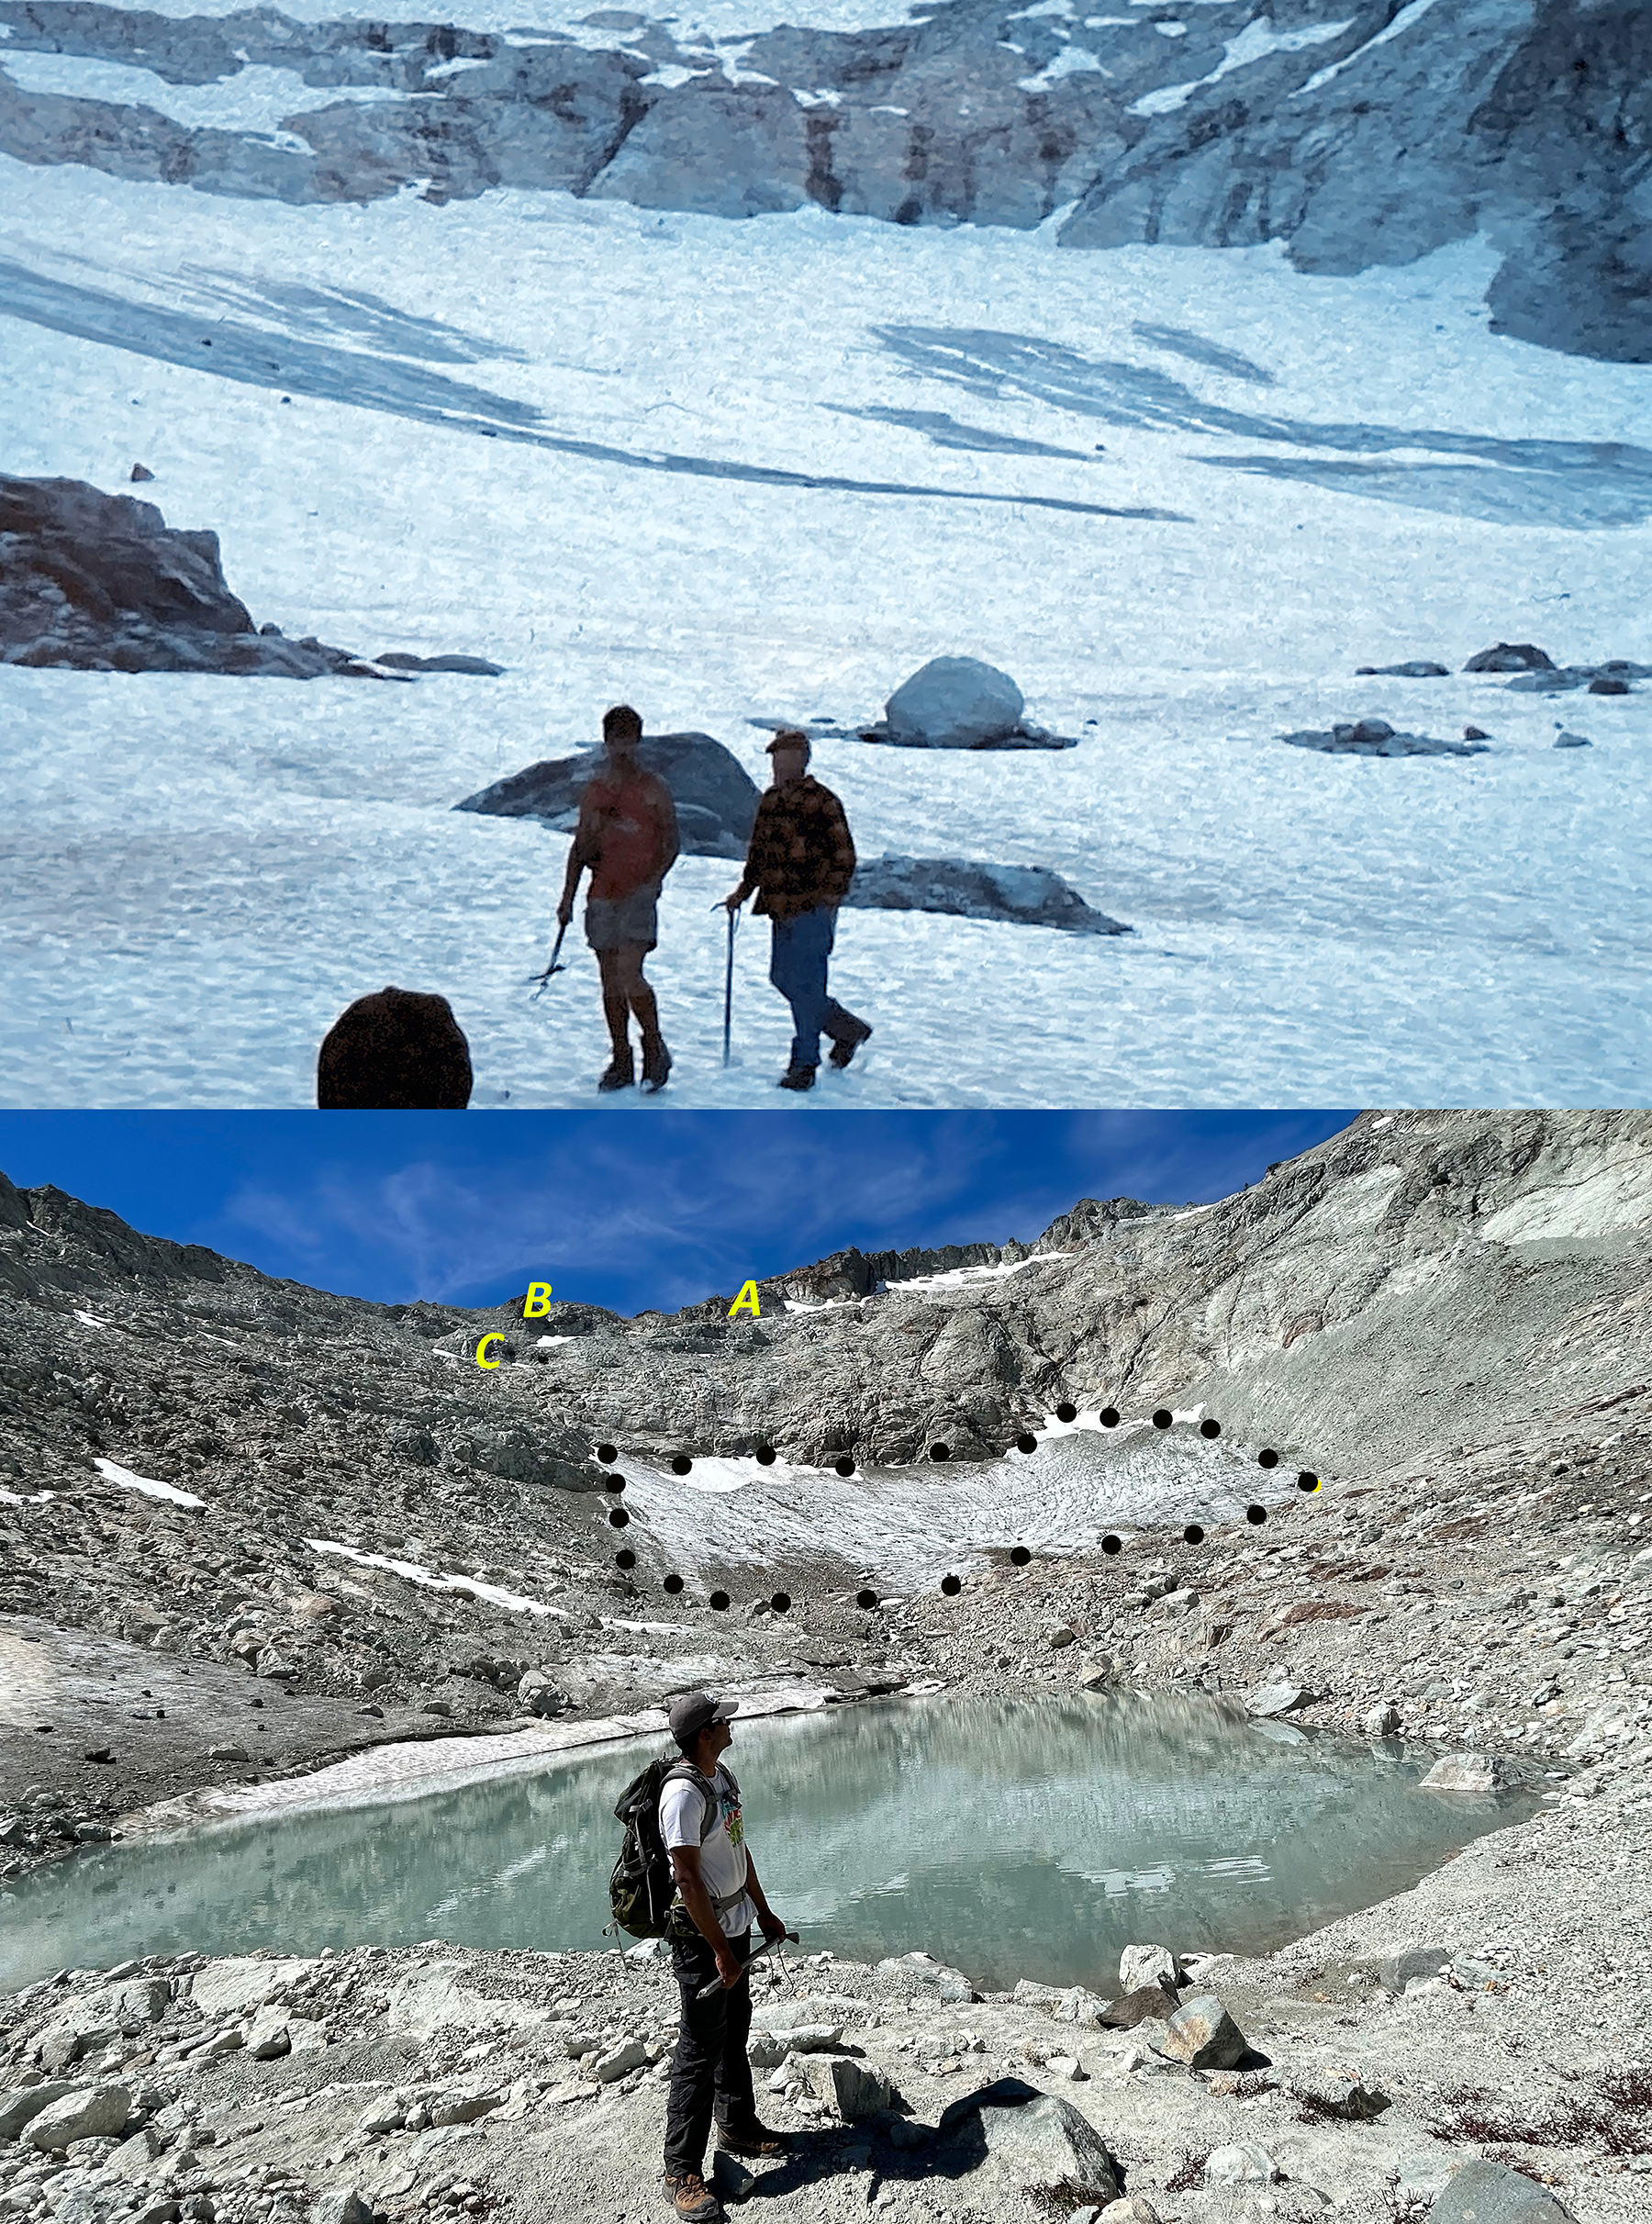
Ice Worm Glacier from the same location in 1986 and 2023, Bill Prater in 1986 image.
Ice Worm Glacier is an east-facing cirque glacier on the east flank of Mount Daniel, WA. Mount Daniel is on the crest of the North Cascade Range of Washington, the crest separates the dry east side that drains to the Columbia River and the wet west side that drains to Puget Sound. The glacier is at the headwaters of Hyas Creek, which drains into the Cle Elum River and the Cle Elum Reservoir. The Cle Elum Reservoir has a storage volume of 538,900,000 m3 and is primarily used for flood control in spring, and agricultural irrigation in summer. This reservoir is the largest in the Yakima River Basin and provides irrigation to 180,000 hectares of agricultural land. The glacier is located in the Alpine Lakes Wilderness area which prohibits the use of mechanized equipment. The Ice Worm Glacier cirque floor is at 1940 m and the headwall at 2050 m. There is a bench at 2150–2300 m that held a glacier/perennial icefield prior to 2015. The glacier is accessed by backpacking 8 km from the Cathedral Rock trailhead with the same base camp used each year at 1700 m on the bank of Hyas Creek. Detailed publication by Mauri and Jill Pelto at: Loss of Ice Worm Glacier, North Cascade Range, WA USA, 2025.
The glacier is fed by wind drift accumulation along the ridge that was just above the top of the glacier during the 1944-2000 period. Avalanching from the slopes below the East Peak of Mount Daniel and from the ridges extending along the north and south flank of the glacier have also been significant. The glacier is part of the Mount Daniel-Mount Hinman Glacier Complex just south of Highway 2 and sits astride the Cascade Divide. This complexcomprised of 9 glaciers covering 3.8 km2 in 1984. This was the biggest cocentration of glaciers between Mount Rainer and Glacier Peak. At the end of the summer 2023 melt season only three of these remain as glaciers, Daniels, Foss and Lynch Glacier. We began monitoring these glaciers along with Ice Worm Glacier in 1984.
Ice Worm Glacier Evolution
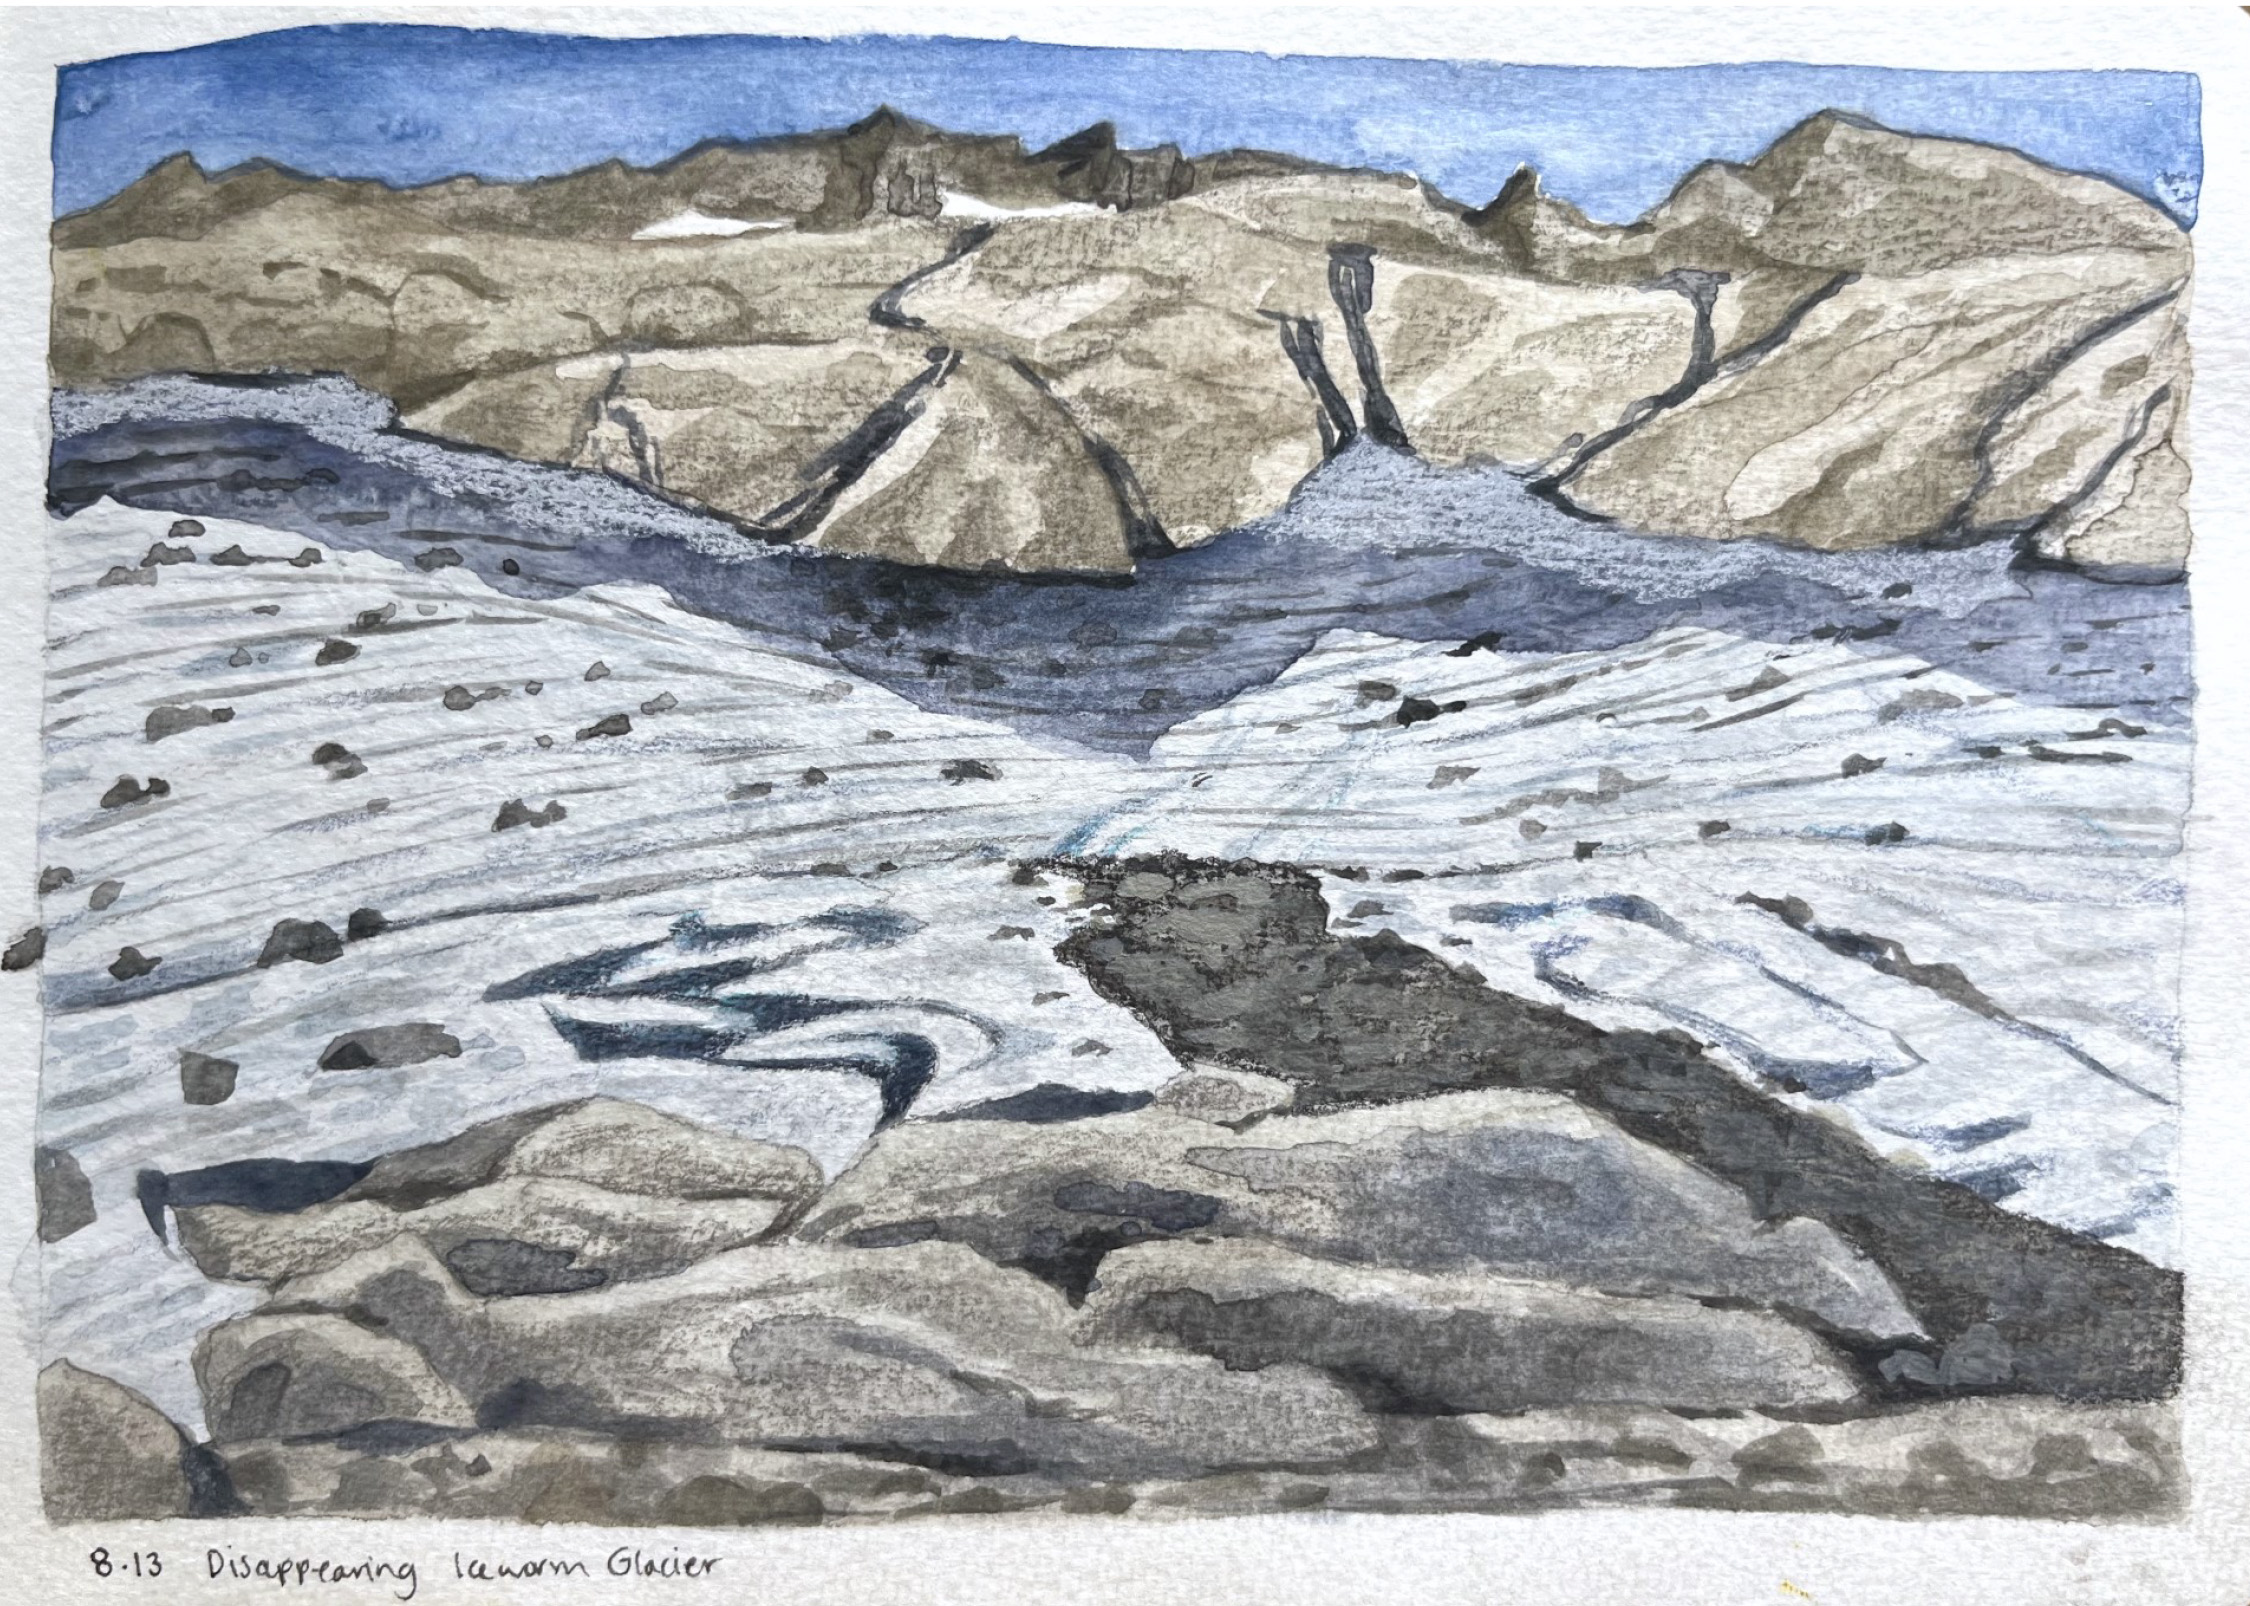
Ice Worm Glacier field sketch by Jill Pelto in 2023.
In 1986 William (Bill) Prater, who had made many first ascents in the area between 1944 and 1960, joined us in the field. Bill also had invented and patented (1973) the first snowshoe with a claw attached to its binding, the Sherpa Snowshoe. Comparing images from these early visits with the current margin of Ice Worm Glacier indicated that there had little change in this glacier from 1944-1986. The mapped area in 1958 was 0.19 km2 (GLIMS, 2023), in 1986 we mapped the area at 0.18 km2.
Each summer during the third week in August we measure the mass balance of this glacier. Because the glacier lacks crevasses we simply grid the glaciers with measurements made 50 m apart along transects running up the glacier and across the glacier along the margins. We also completed a longitudinal profile running up the glacier from a fixed location on the bedrock at the below and at the top of the glacier. The surface elevation was determined at the specific 50 m points to identify thinning of the glacier. During the first decade the glacier extended to within 10 m of the ridge on the south side of the glacier, allowing us to ski off of the ridge, see 1990 image below.
Glacier Area Change
View of the south ridge across Ice Worm Glacier in 1990 above and 2006 below, note recession of the top of the glacier from this ridge.
From 1984 to 1992, the glacier extended to within 15 m of the ridge on the south side of the basin. By 1995 this was no longer possible as the top of the glacier was retreating as fast as the bottom of the glacier. In 2006, the recession from this ridge was greater than the recession at the terminus. The glacier perimeter was surveyed in the low snow years of 2005 and 2015, identifying the glacier area to be 0.15 km2 and 0.110 km2, respectively. In 2015, the inventory for RGI noted an area of 0.106 km2. Annually, from 2021 to 2024, low snow cover allowed for mapping of the glacier perimeter during a rapid decline from 0.09 km2 to 0.03 km2. The area loss from 1986 to 2015 was 0.07 km2, which is less than the area loss from 2015 to 2023 of 0.08 km2. provides a photo comparison of the change from 1986 to 2023, with the people standing in the same location in each case. The observed area determined in the field from the GPS position locations closely matches the RGI inventory area in 2015 and the area derived from overlaying the points on Sentinel 2 imagery from August 2021 to 2024, which have a 10–30 m resolutionThis summer we observed a dozen holes that reached the bottom of the glacier 4-6 m below, indicating how thin the ice is. There is no movement, the size and thickness are too low to generate future movement, hence this is no longer a glacier. A glacier is a body of snow and ice that is moving, this requires a persistent thickness of 20-30 m, which is typically associated with snow/ice areas of ~50,000 m² or larger. As a glacier becomes thinner or smaller than this movement will not be sustained.
Table 1. The observed area of Ice Worm Glacier from field measurements. The area of Ice Worm Glacier from previous inventories and Sentinel 2 imagery.
Year
Field Mapped Area (m2)
Validating Aerial/Satellite Image Area (m2)
1958
190,000 (GLIMS)
1986
180,000 (±10,000)
Field Observation only
1992
170,000 (±10,000)
Field Observation only
2005
150,000 (±5000)
Field Observation only
2015
110,000 (±5000)
106,000 (RGI)
2021
88,000 (±2000)
90,000 (Sentinel)
2022
68,000 (±2000)
Field Observation only
2023
41,000 (±2000)
40,000 (Sentinel)
2024
32,000 (±2000)
30,000 (Sentinel)
We have measured discharge at a natrual weir below Ice Worm Glacier since 1986. Average August daily runoff has declined 60% by 2022.
Glacier Base Observations
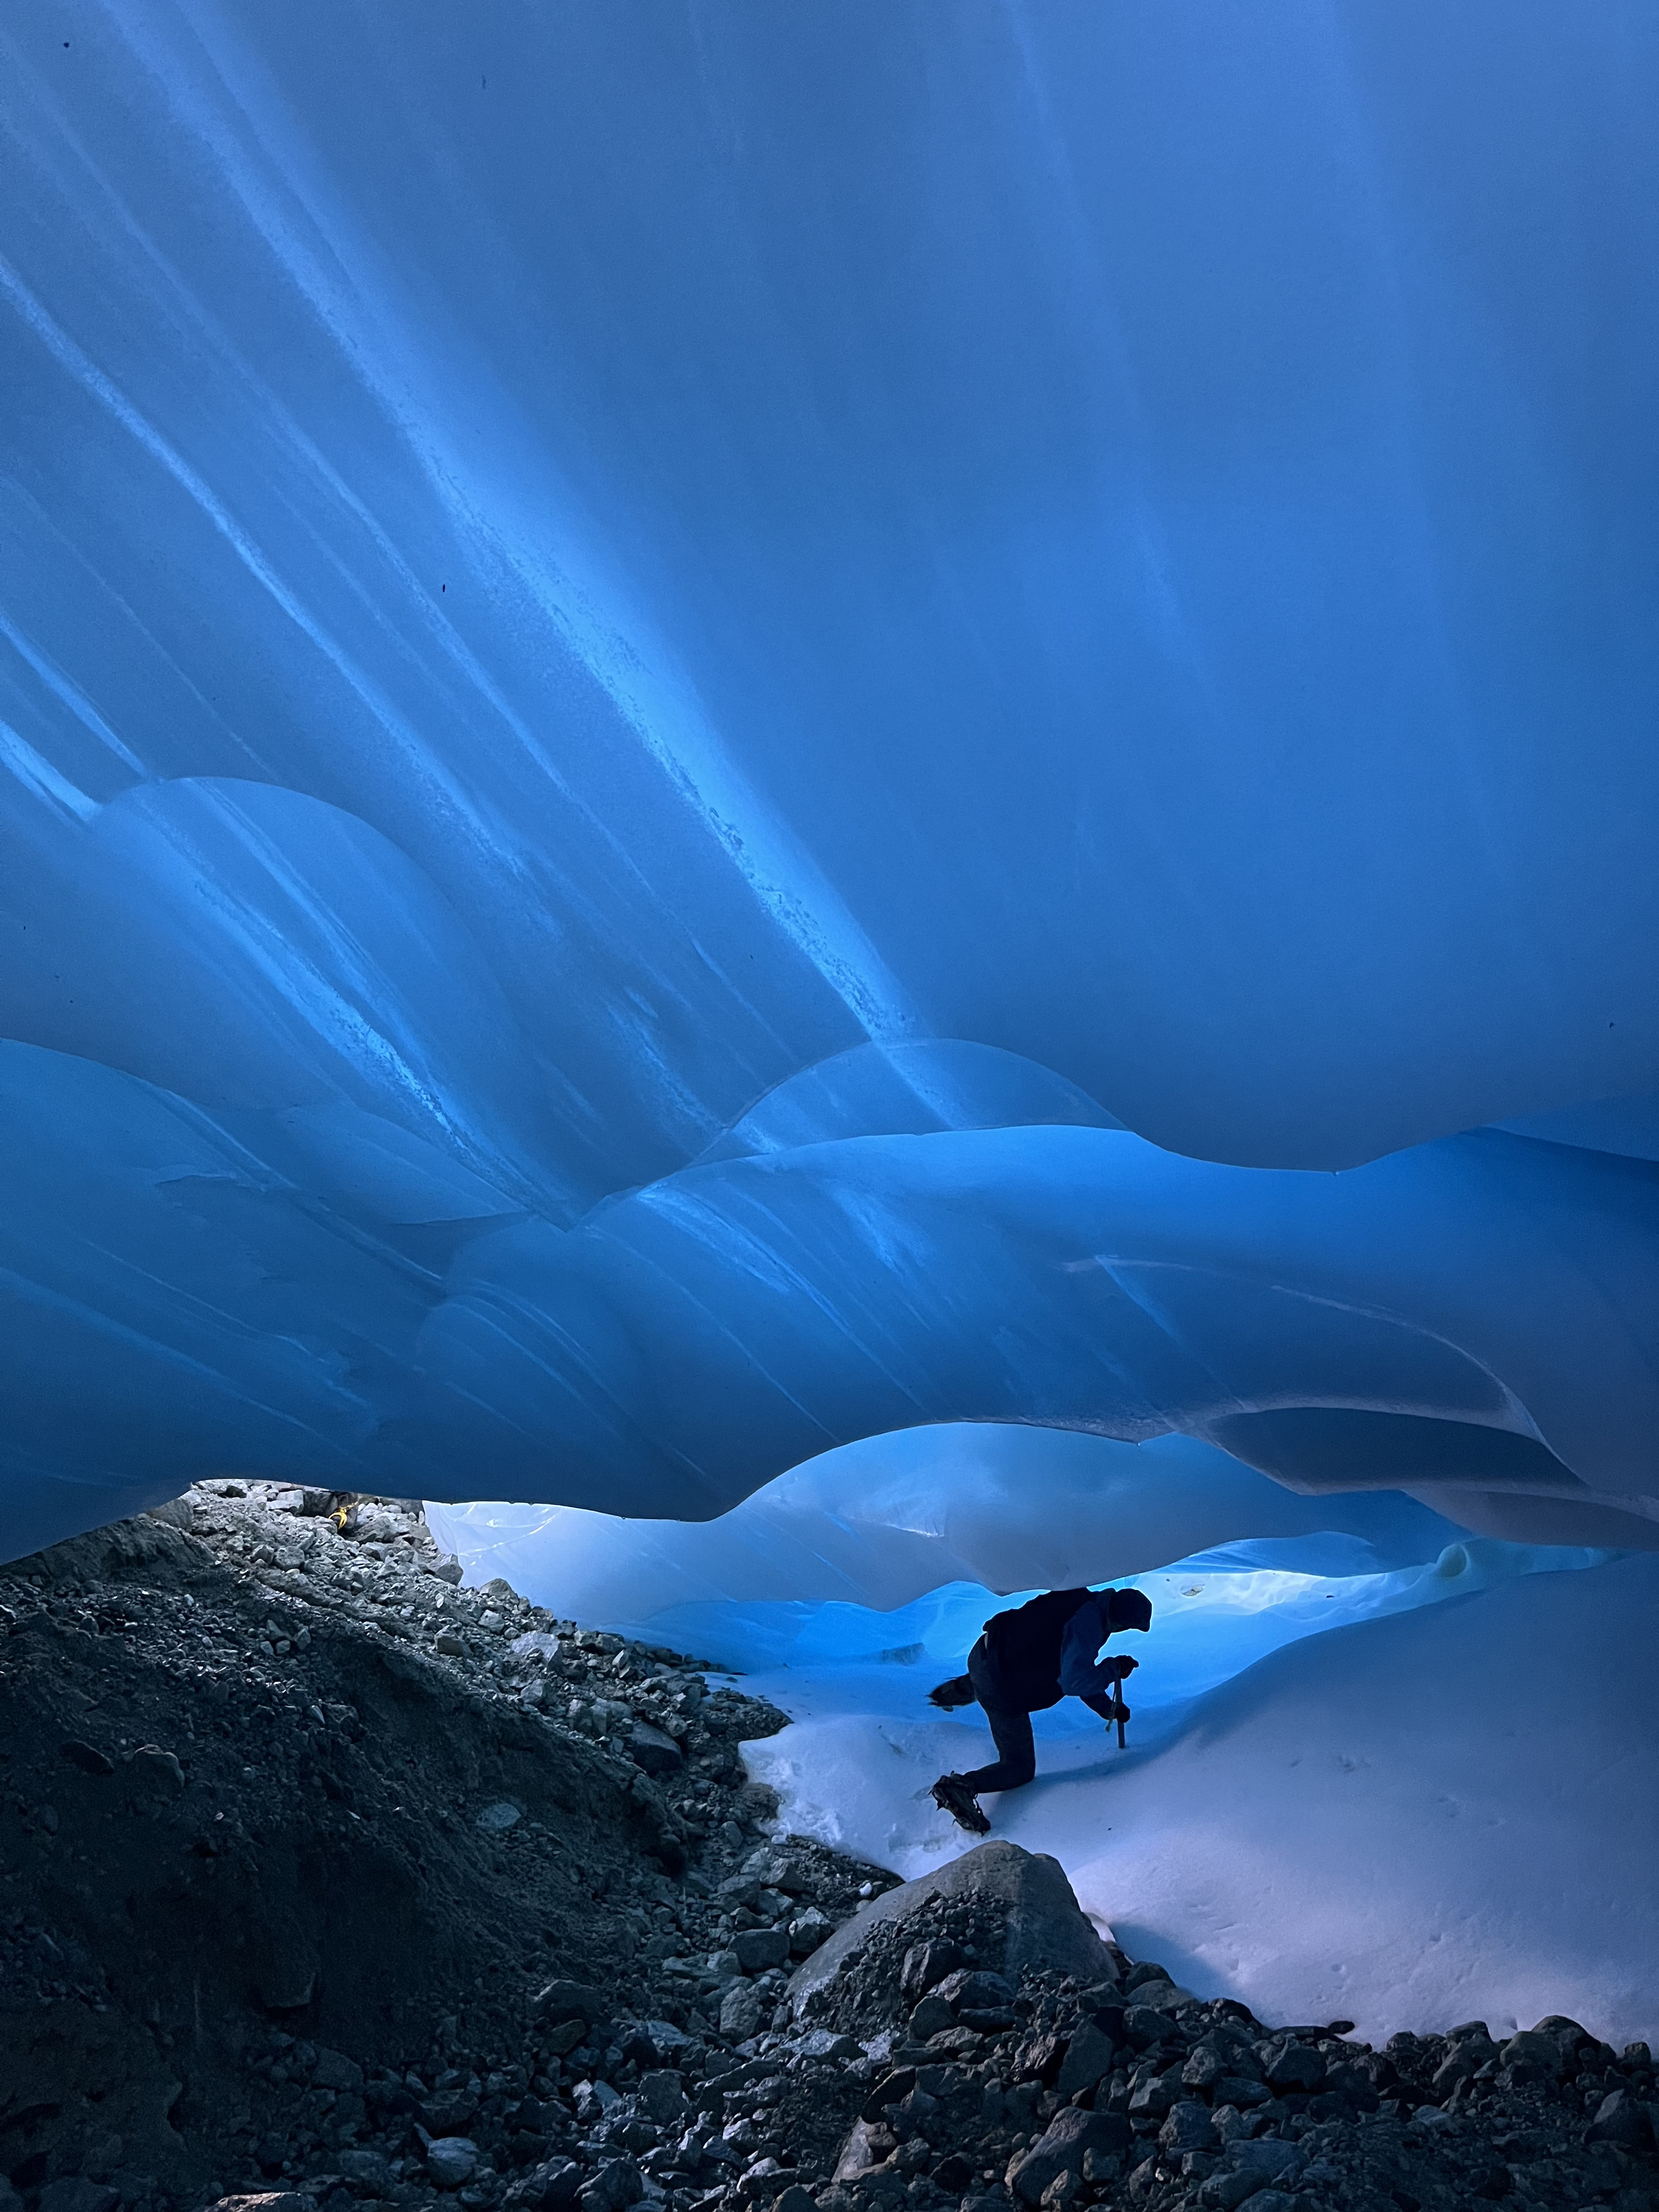
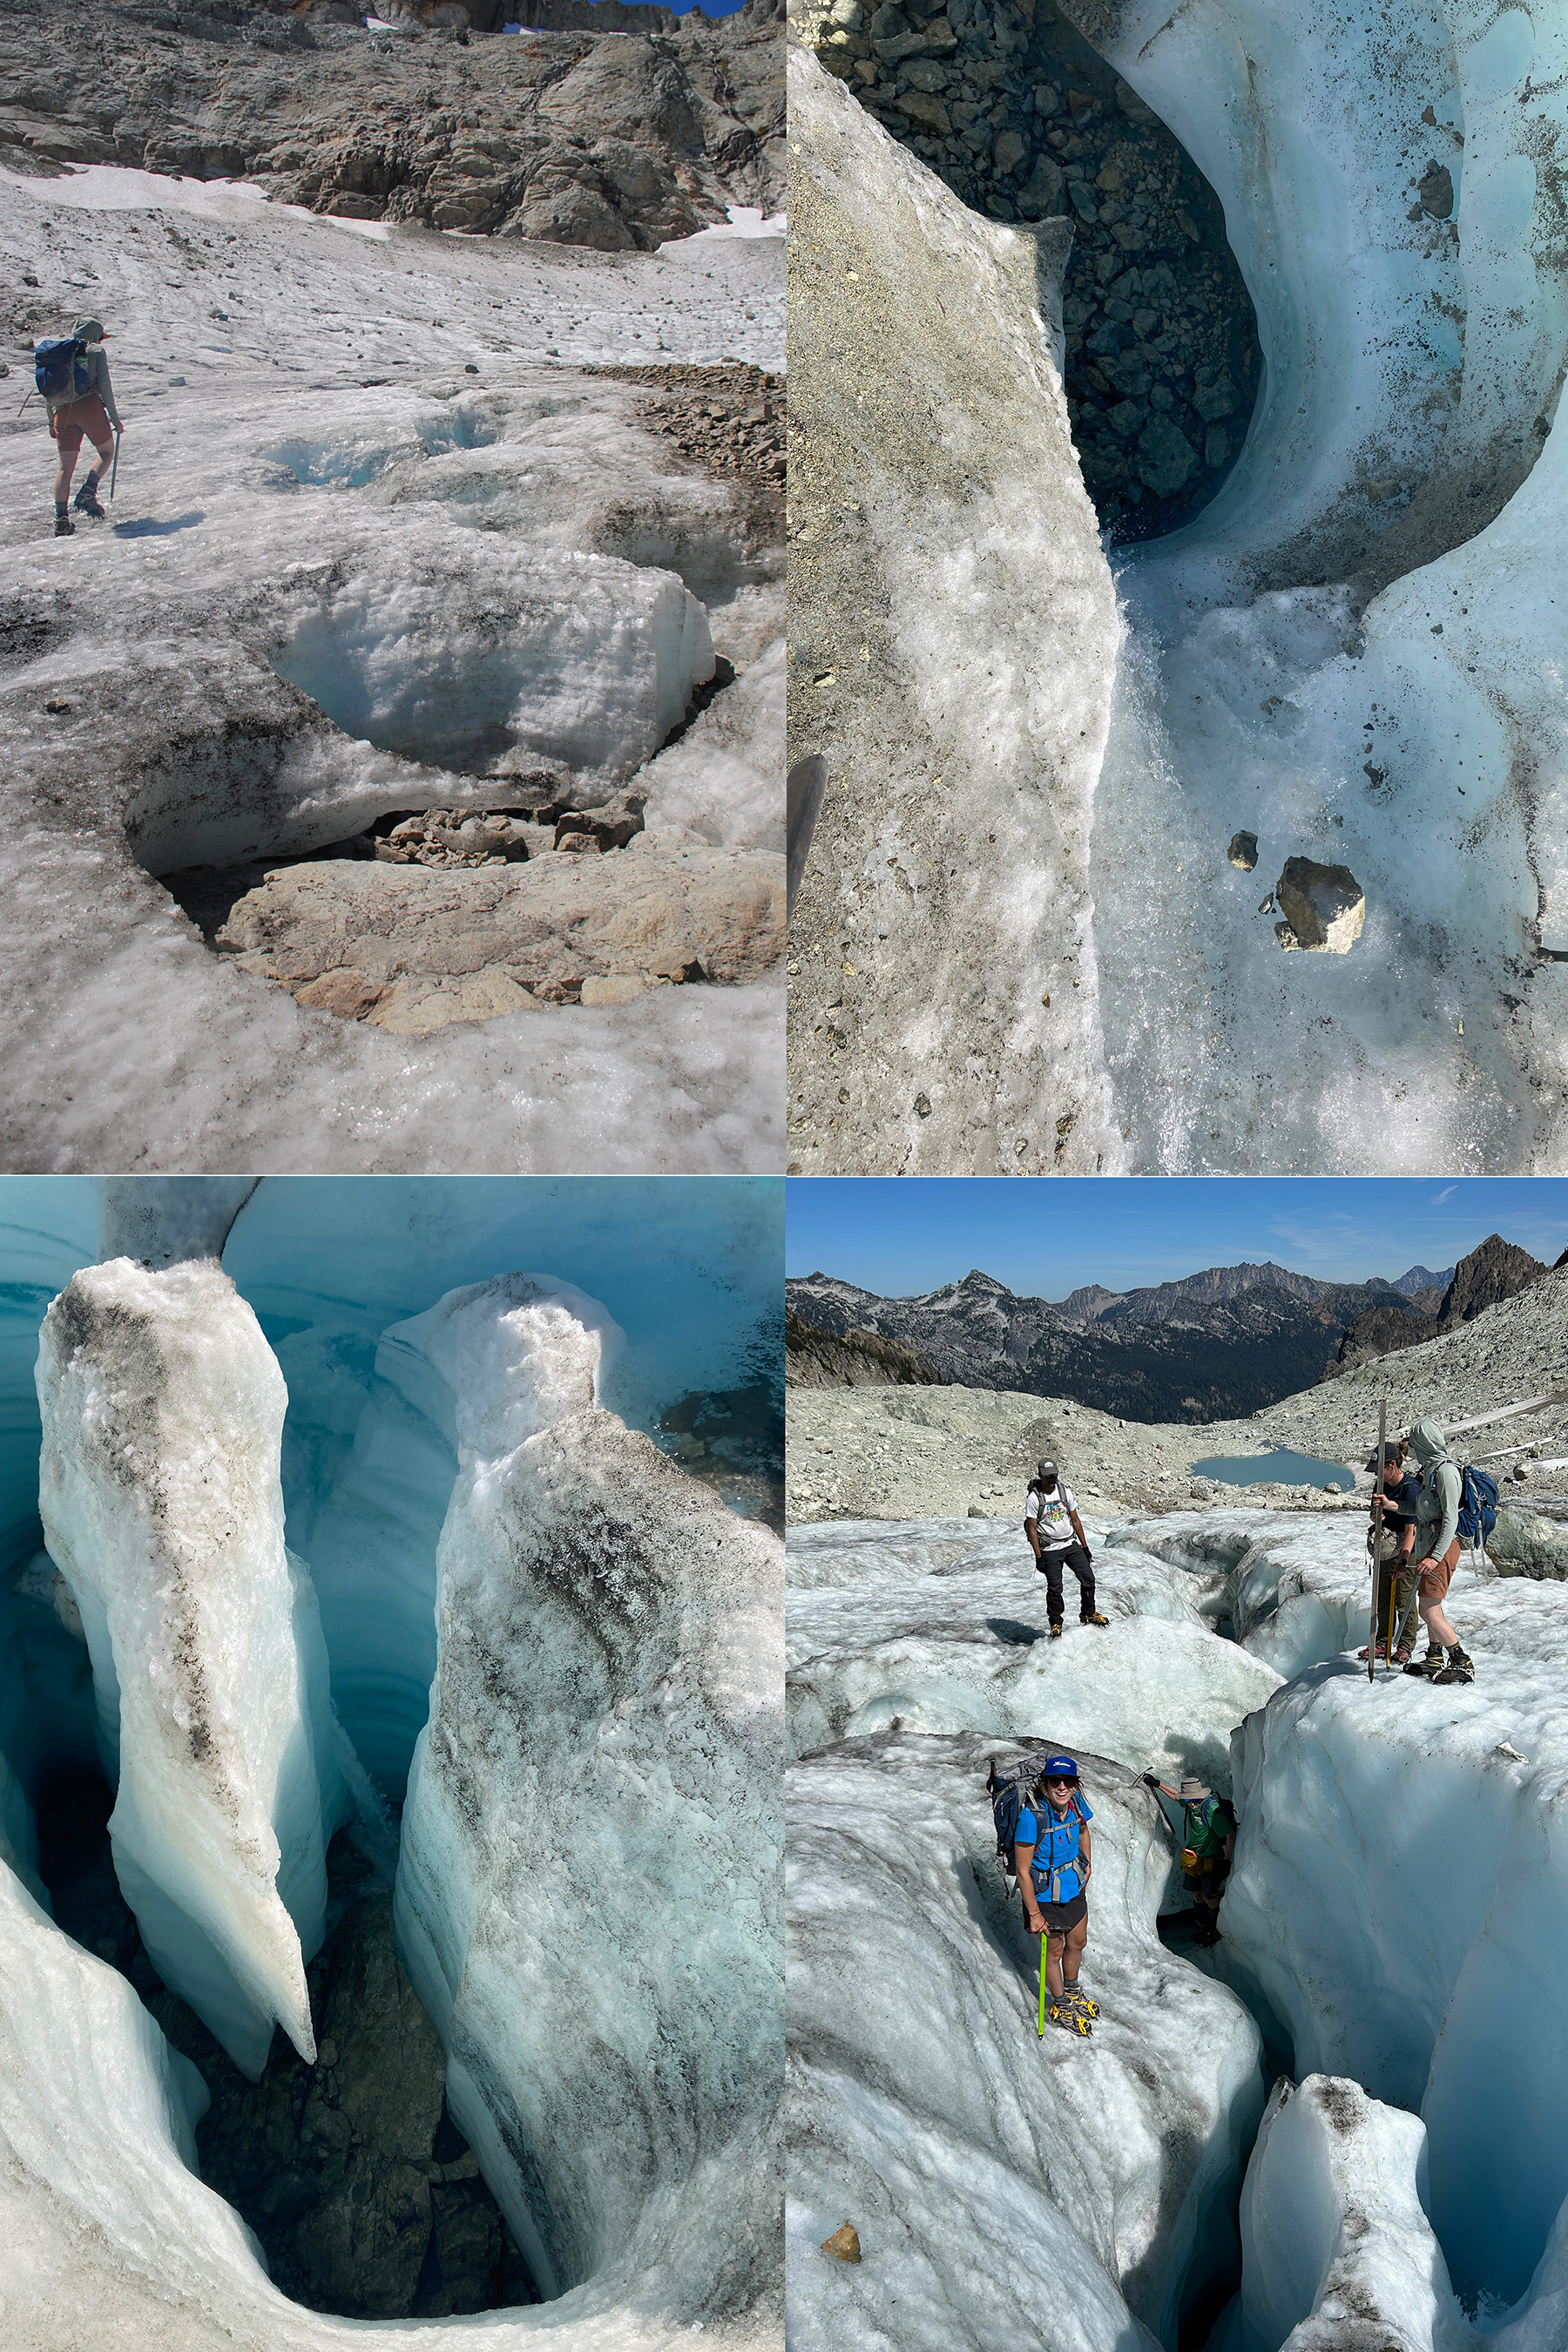
Ice Cave in 2024 that extended from top to the end of the glacier.
Beginning in 2015, we routinely assessed how deep each moulin, crevasse or supraglacial stream channel was on the glacier. One measure of a glacier no longer being a glacier is when crevasse features and stream channels consistently reach the bedrock below the glacier. In 2023, we examined 24 of these features and each reached bedrock at depths of 2–10 m. These features were distributed widely across the glacier. There are undoubtedly limited areas of thicker ice. In 2024, we explored an ice cave that extended 250 m from the top of the glacier to the end of the glacier. The cave roof was 1–4 m above bedrock, and the roof was consistently less than 2 m thick allowing light to penetrate from the glacier surface into the cave. An extensive ice cave transecting the entire glacier such as this cannot exist in a current glacier because ice movement would lead to ice cave closure.
Streams channel reaching bedrock at base of Ice Worm Glacier.
Each year in mid-August, stream discharge has been observed immediately below the 1986 terminus position of Ice Worm Glacier at 11 a.m., 2 p.m. and 5 p.m. during the field visit. This stream is also fed by perennial snowfields and, before 2015, a small glacier. These observations are insufficient to quantify daily runoff, but because of the consistent timing and methods, do allow for comparison. The glacier is located on the dry side of the range and has not experienced rainfall during any of our field observation periods, which would contribute to stream discharge. From 1985 to 2002, streamflow was observed on 36 days, with the average discharge being 0.12 m3 s−1. From 2021 to 2024, discharge was observed on 6 days with the average discharge being 0.03 m3 s−1. This roughly 75% decline in August runoff is similar to the 60% loss in runoff modeled for the loss of small glaciers in basins in the Alps and observed when the Lewis Glacier, North Cascade Range was lost. The change in summer streamflow in Hyas Creek near our base camp is apparent, as it had been a challenging stream crossing to keep your feet dry until 2013, and now is a simple step across. There has also been a marked increase in algae coating the substrate of the stream with the lower flow, clearer and warmer water, which is expected.
Climate Drivers
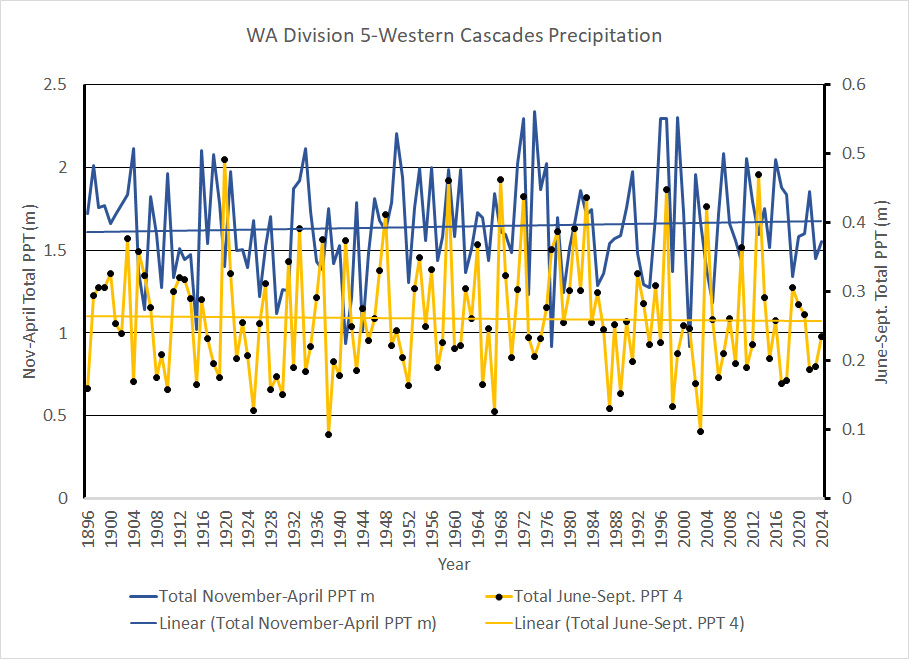
Trends in summer temperature at Western Cascade weather stations for the 1896 to 2024 period indicate that seven of the ten warmest melt seasons (June–September) have occurred since 2013. Melt season temperatures from 2014 to 2024 were 1.3 °C above the 1896 to 2022 mean. The long-term winter temperature trend from 1896 to 2024 has been 1.2 °C. From 2014 to 2024 winter temperatures were 0.9 °C above the long-term average, the warmest decadal period of the record.
During the 1896 to 2024 period from June to September, precipitation exhibited no significant trend. For the November–April (winter season) there was a 3% increase in precipitation from 1896 to 2024. From 2014 to 2024 winter precipitation averaged 1.68 m vs. the long-term average of 1.65 m. April 1 SWE from six long-term SNOTEL stations where April 1 SWE has a declining trend of 30% from 1946 to 2023, with a 10% decline since 1984. The April 1 SWE loss reflects increased melting of the snowpack or rain events during the winter season.This indicates that it is temperature rise that is driving the glacier mass balance loss, retreat and eventual disappearance of Ice Worm Glacier.
Washington State Division 5 -Cascade West-Temperature trends.Washington State Division 5 -Cascade West-Precipitation trends.
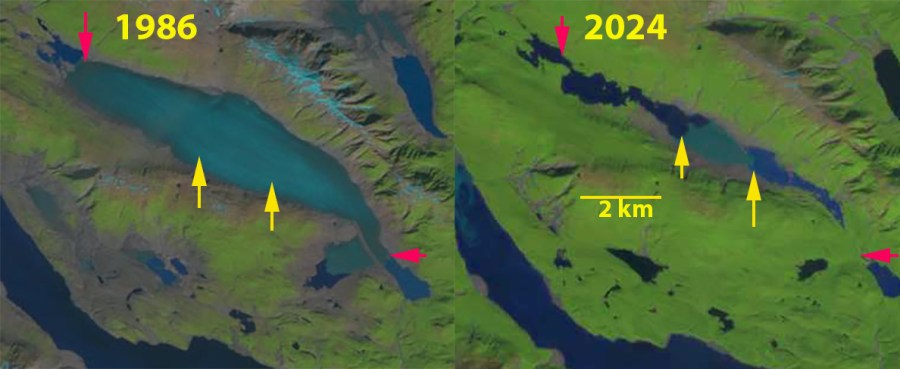
Burroughs Glacier in 1986 and 2024 Landsat images. The red arrow marks terminus in 1986 and yellow arrows the 2024 terminus. Yellow dots mark the outline of the glacier in 2022. Glacier area declined from 12.5 km² to 1.2 km² during this 38 year period.
Burroughs Glacier in Glacier Bay National Park, Alaska has been retreating since 1892 when it was part of the Muir Glacier complex. The glacier is named for naturalist John Burroughs, who accompanied John Muir to the areain 1899 on the Harriman Expedition. The glacier is unusual in that it has not had an accumulation zone this century, where snow persists through the year. Without an accumulation zone a glacier cannot survive (Pelto, 2010). Mickelson (1971) summarized the retreat of the glacier from 1892-1960. In 1892 the Burroughs ice plateau was assessed as a 10 km by 25 km ice cap. By 1960 it had thinned by as much as 750 m and its calving margin had retreated 27 km. In the 1960s crevasse extension were still active (Taylor, 1963). By the end of the 1970’s the glacier was essentially stagnant (Molnia, 2008). In 1982 I briefly visited the western terminus, which provided a still imposing slope, made more so by the rain and clouds lowering onto its surface, active crevasses were still evident indicating some movement. John Burroughs in writing the narrative of the Harriman Expedition noted about vanishing glaciers “It is dead or motionless, and is therefore free from crevasses. Its rim comes down to the gravel like a huge turtle shell and we stepped up on it without difficulty. (page 45)”.
Here we examine the glacier in Landsat imagery from 1986 to 2024to illustrate the retreat, the lack of snowcover and the thinning. In the 1948 map of Burroughs Glacier, the glacier is 12.1 km long, and much of the glacier is already stagnant, the glacier has both a north and south terminus, purple arrows.
Burroughs Glacier in 1948 USGS map. Purple arrow indicate terminus locations. Former Plateau Glacier (P).
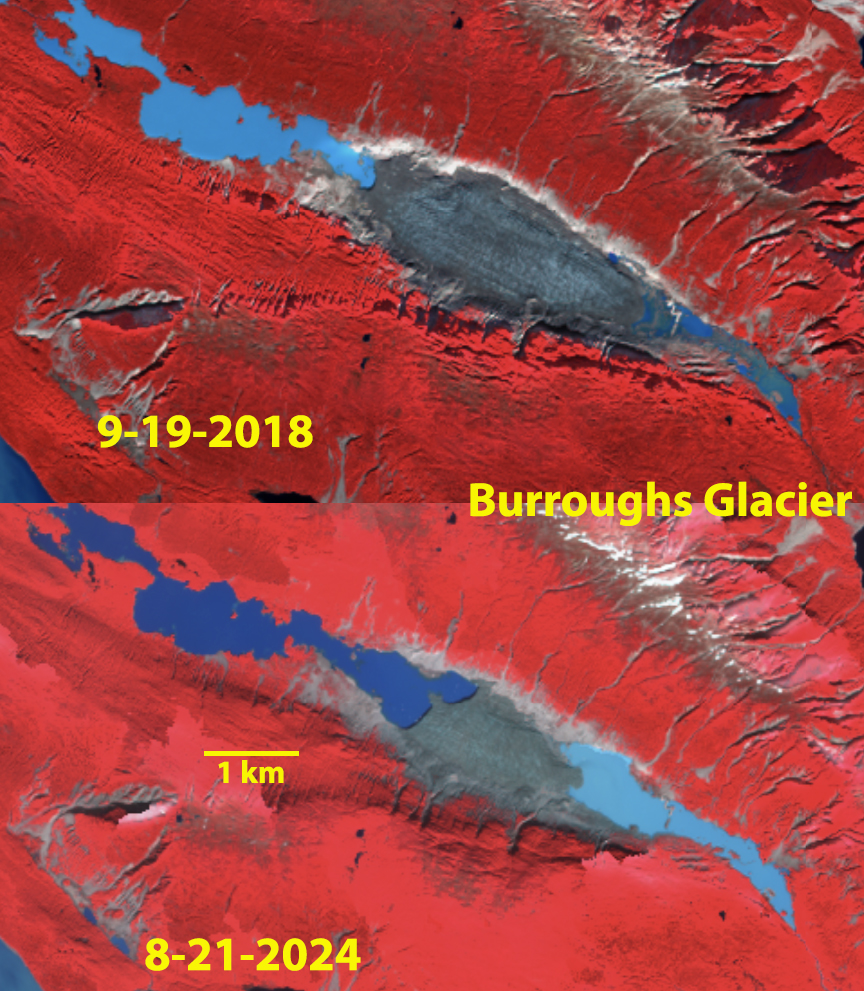
In 1948 Burroughs Glacier has an area of 22 km² and is 12.5 km long, with the crest of the glacier at 425 m. In 1986 Burroughs Glacier has an area of 12.5 km² and has no snowcover by mid-summer. The glacier terminates in proglacial lakes at both the north and south terminus and is 9 km long, purple arrows indicate 1948 terminus. In 2004 Burroughs Glacier again lacks any snowcover. The southern terminus has retreated 2.2 km from the lake, and the northern terminus has retreated into a second lake basin. The glacier is 6.3 km long, half of its length in 1948. In 2010 snowcover is lacking and retreat has continued shrinking the glacier to 5.4 km in length. The glacier was assessed with an area of 2.9 km² and a median elevation of 313 m (1025 feet) by GLIMS, in 2010. In 2013 the glacier lacks snowcover in this September Landsat image even though snow has returned to the surrounding mountains. This indicates how far below the snowline the glacier lies. Portions of a glacier are supposed to be the first locations that receive snowcover. The terminus has continued to retreat and the glacier was 4.6 km long in 2013. The northern terminus was retreating into a third basin of the proglacial lake. By 2018 the glacier area has been reduced to 2.7 km², then 1.5 km² in 2022 and 1.2 km² in 2024., 5.5% of its area remaining from 1948, 10% of its area from 1986 and 1% of the 1892 area. The length of the glacier in 2024 is 2.3 km, only 50% of the length just a decade ago, and ~20% of the 1948 length.
Thinning of this glacier from 1948-2016 is evident from a comparison of topographic maps. Thinning in remaining glacier are averages 225 m during this period, that is a rate of ~3.3 m/year. Larsen et al (2007) had found a thinning rate of ~3 m/year for the 1948-2000 period. Satellite imagery allows identification of glacier area, which declined at a linear rate from 2004-2024, correlation coefficient of 0.98. This his linear rate indicates the glacier will disappear in 2029 or 2030.
Burroughs Glacier has not been in equilibrium with climate the past century. Its retreat has been hastened by the rising snowline of the last decade note by Pelto et al (2013) on Brady Glacier. This glacier area has declined by 90% since 1986, with volume loss being even larger. Retreat usually increases as elevation declines and as the size of the remnant ice declines. There is no debris cover or persistent snowcover to slow the loss.
Overlay of 1948 (blue labeled contours) and 2014 elevation map (brown labeled contours) for Burroughs Glacier.
Burroughs Glacier area from Landsat and Sentinel images from 2004 to 2024. This is a strongly linear decrease, that projected beyond 2024 hits bottom in 2029 or 2030.
2004 Landsat image of Burroughs Glacier. The red arrow marks the west margin in 1986 and the yellow arrow the east margin.
2010 Landsat image of Burroughs Glacier. The red arrow marks the west margin in 1986 and the yellow arrow the east margin.
2013 Landsat image of Burroughs Glacier. The purple arrows mark the 1948 margin, red arrow the west margin in 1986 and the yellow arrow the east margin in 1986, pink arrows the 2013 margin.
2022 false color Sentinel image of Burroughs Glacier. The ice is dirty but not debris covered at this point, glacier area 1.5 km2.
2018 and 2024 false color Sentinel image of Burroughs Glacier. The ice is dirty but not debris covered. Area declined from 2.7 km2 to 1.2 km2
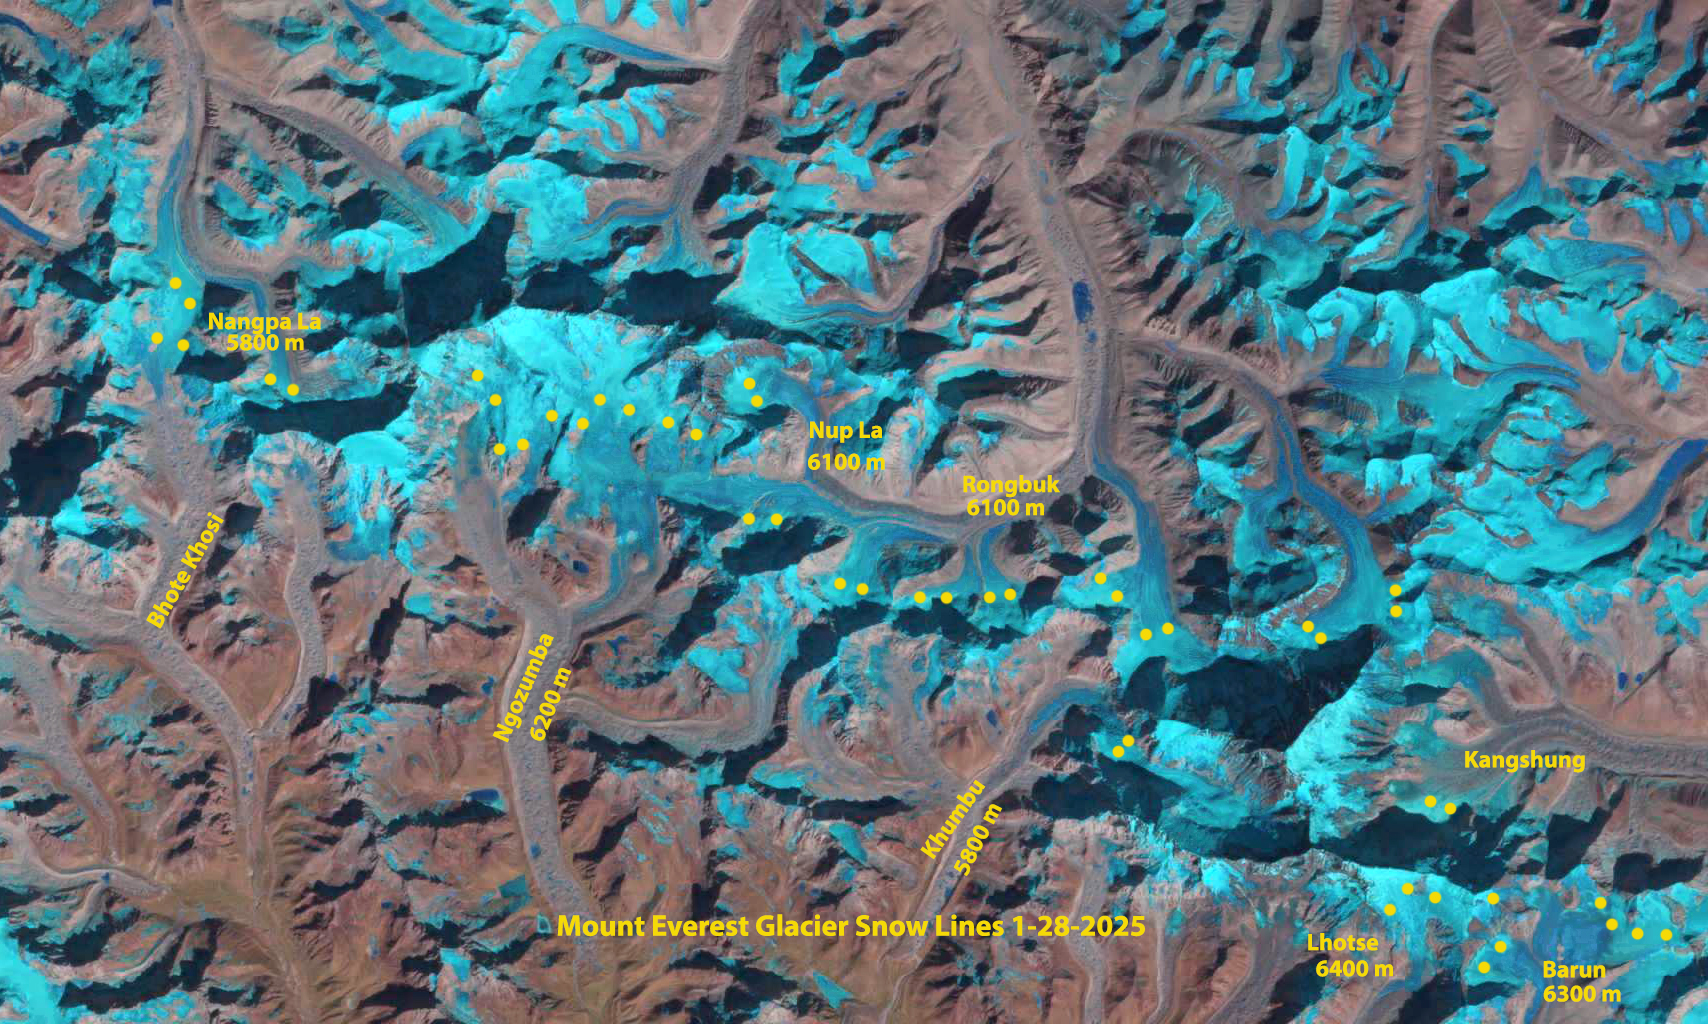
The snow line on Mount Everest Region glaciers on Jan. 28, 2025 indicated by yellow dots on the Landsat image. Note t Nup La-5900 m is snow free. The average snow line is 6100 m, 150 m higher than on Dec. 11, 2024.
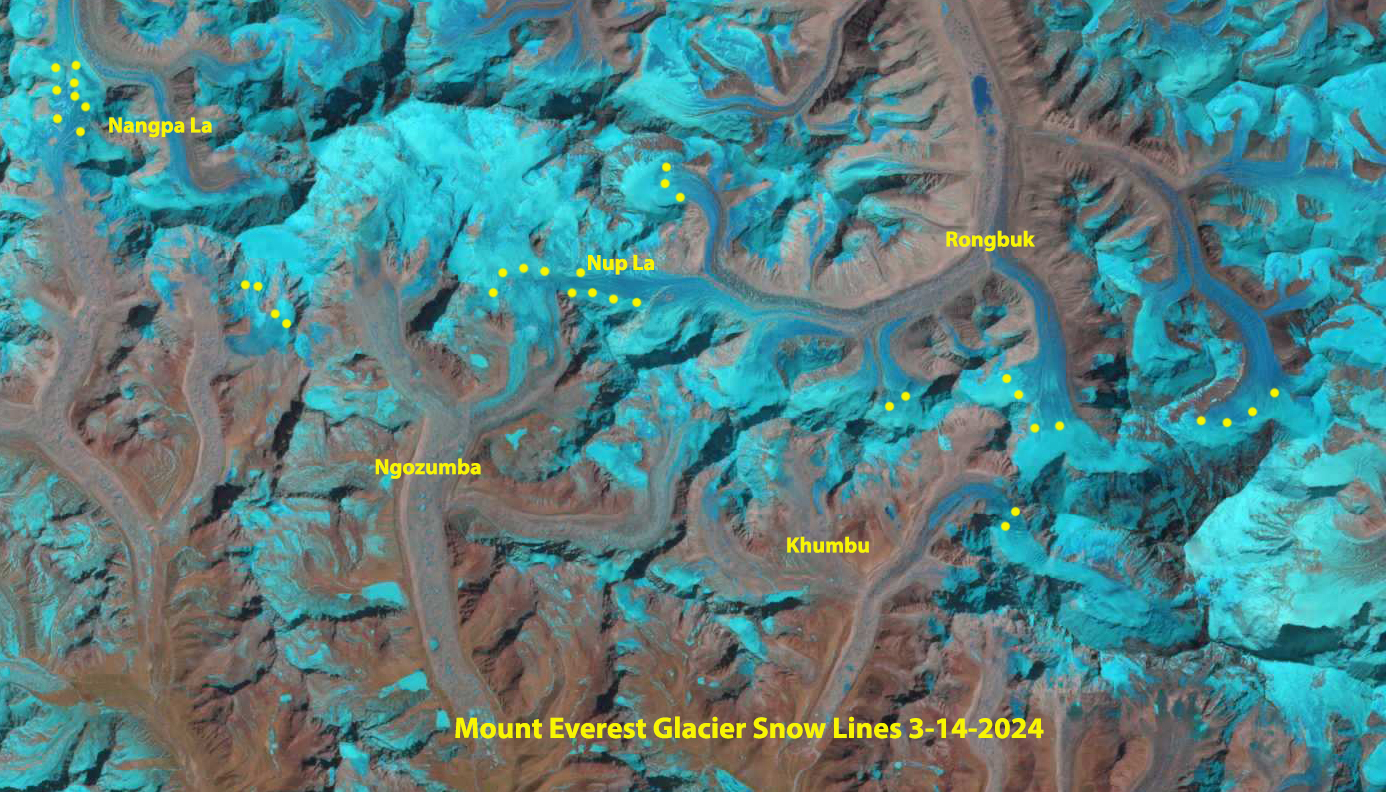
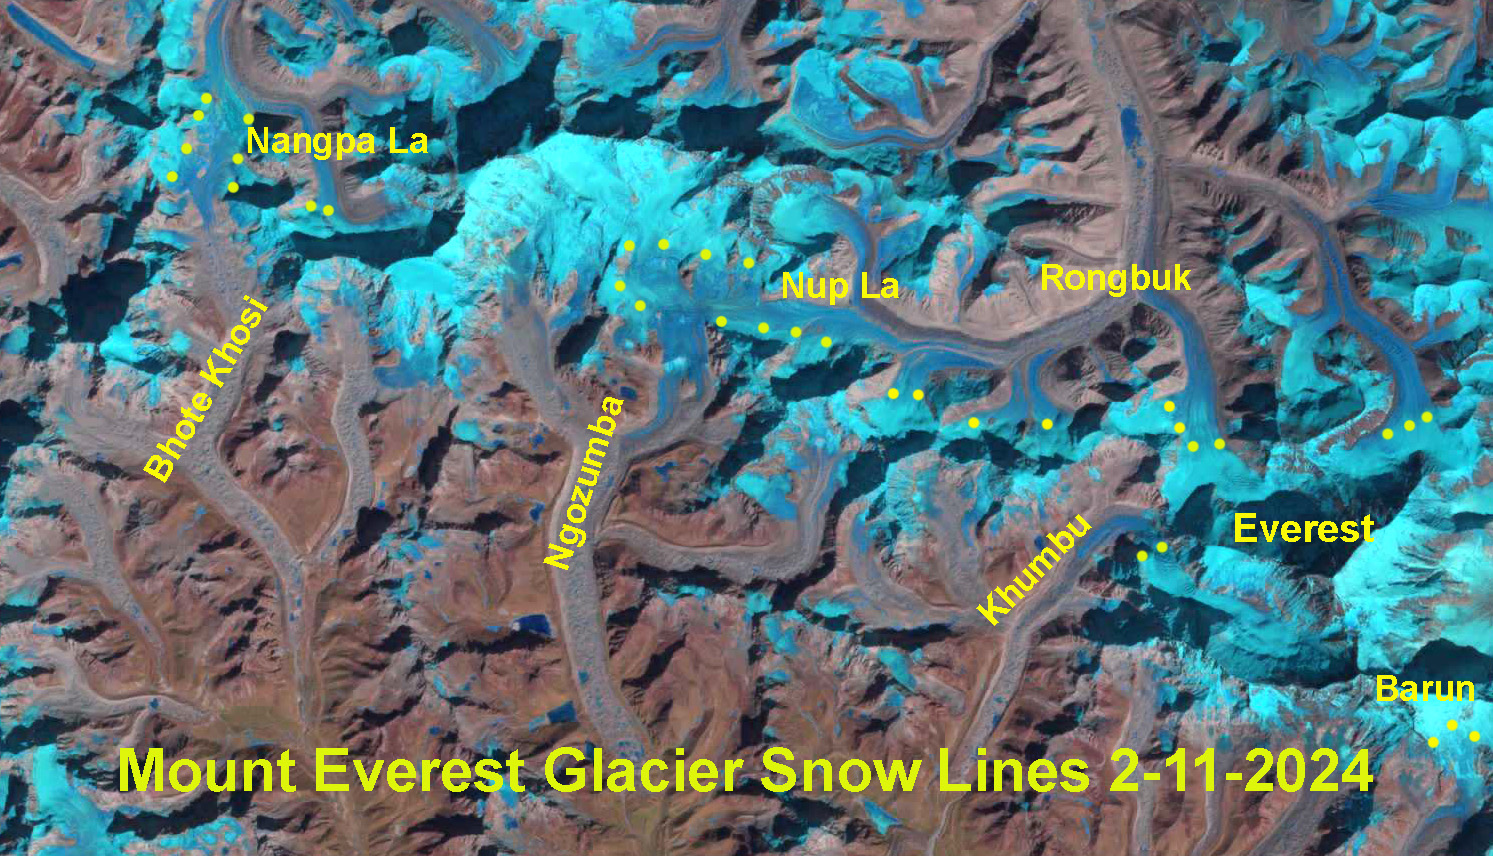
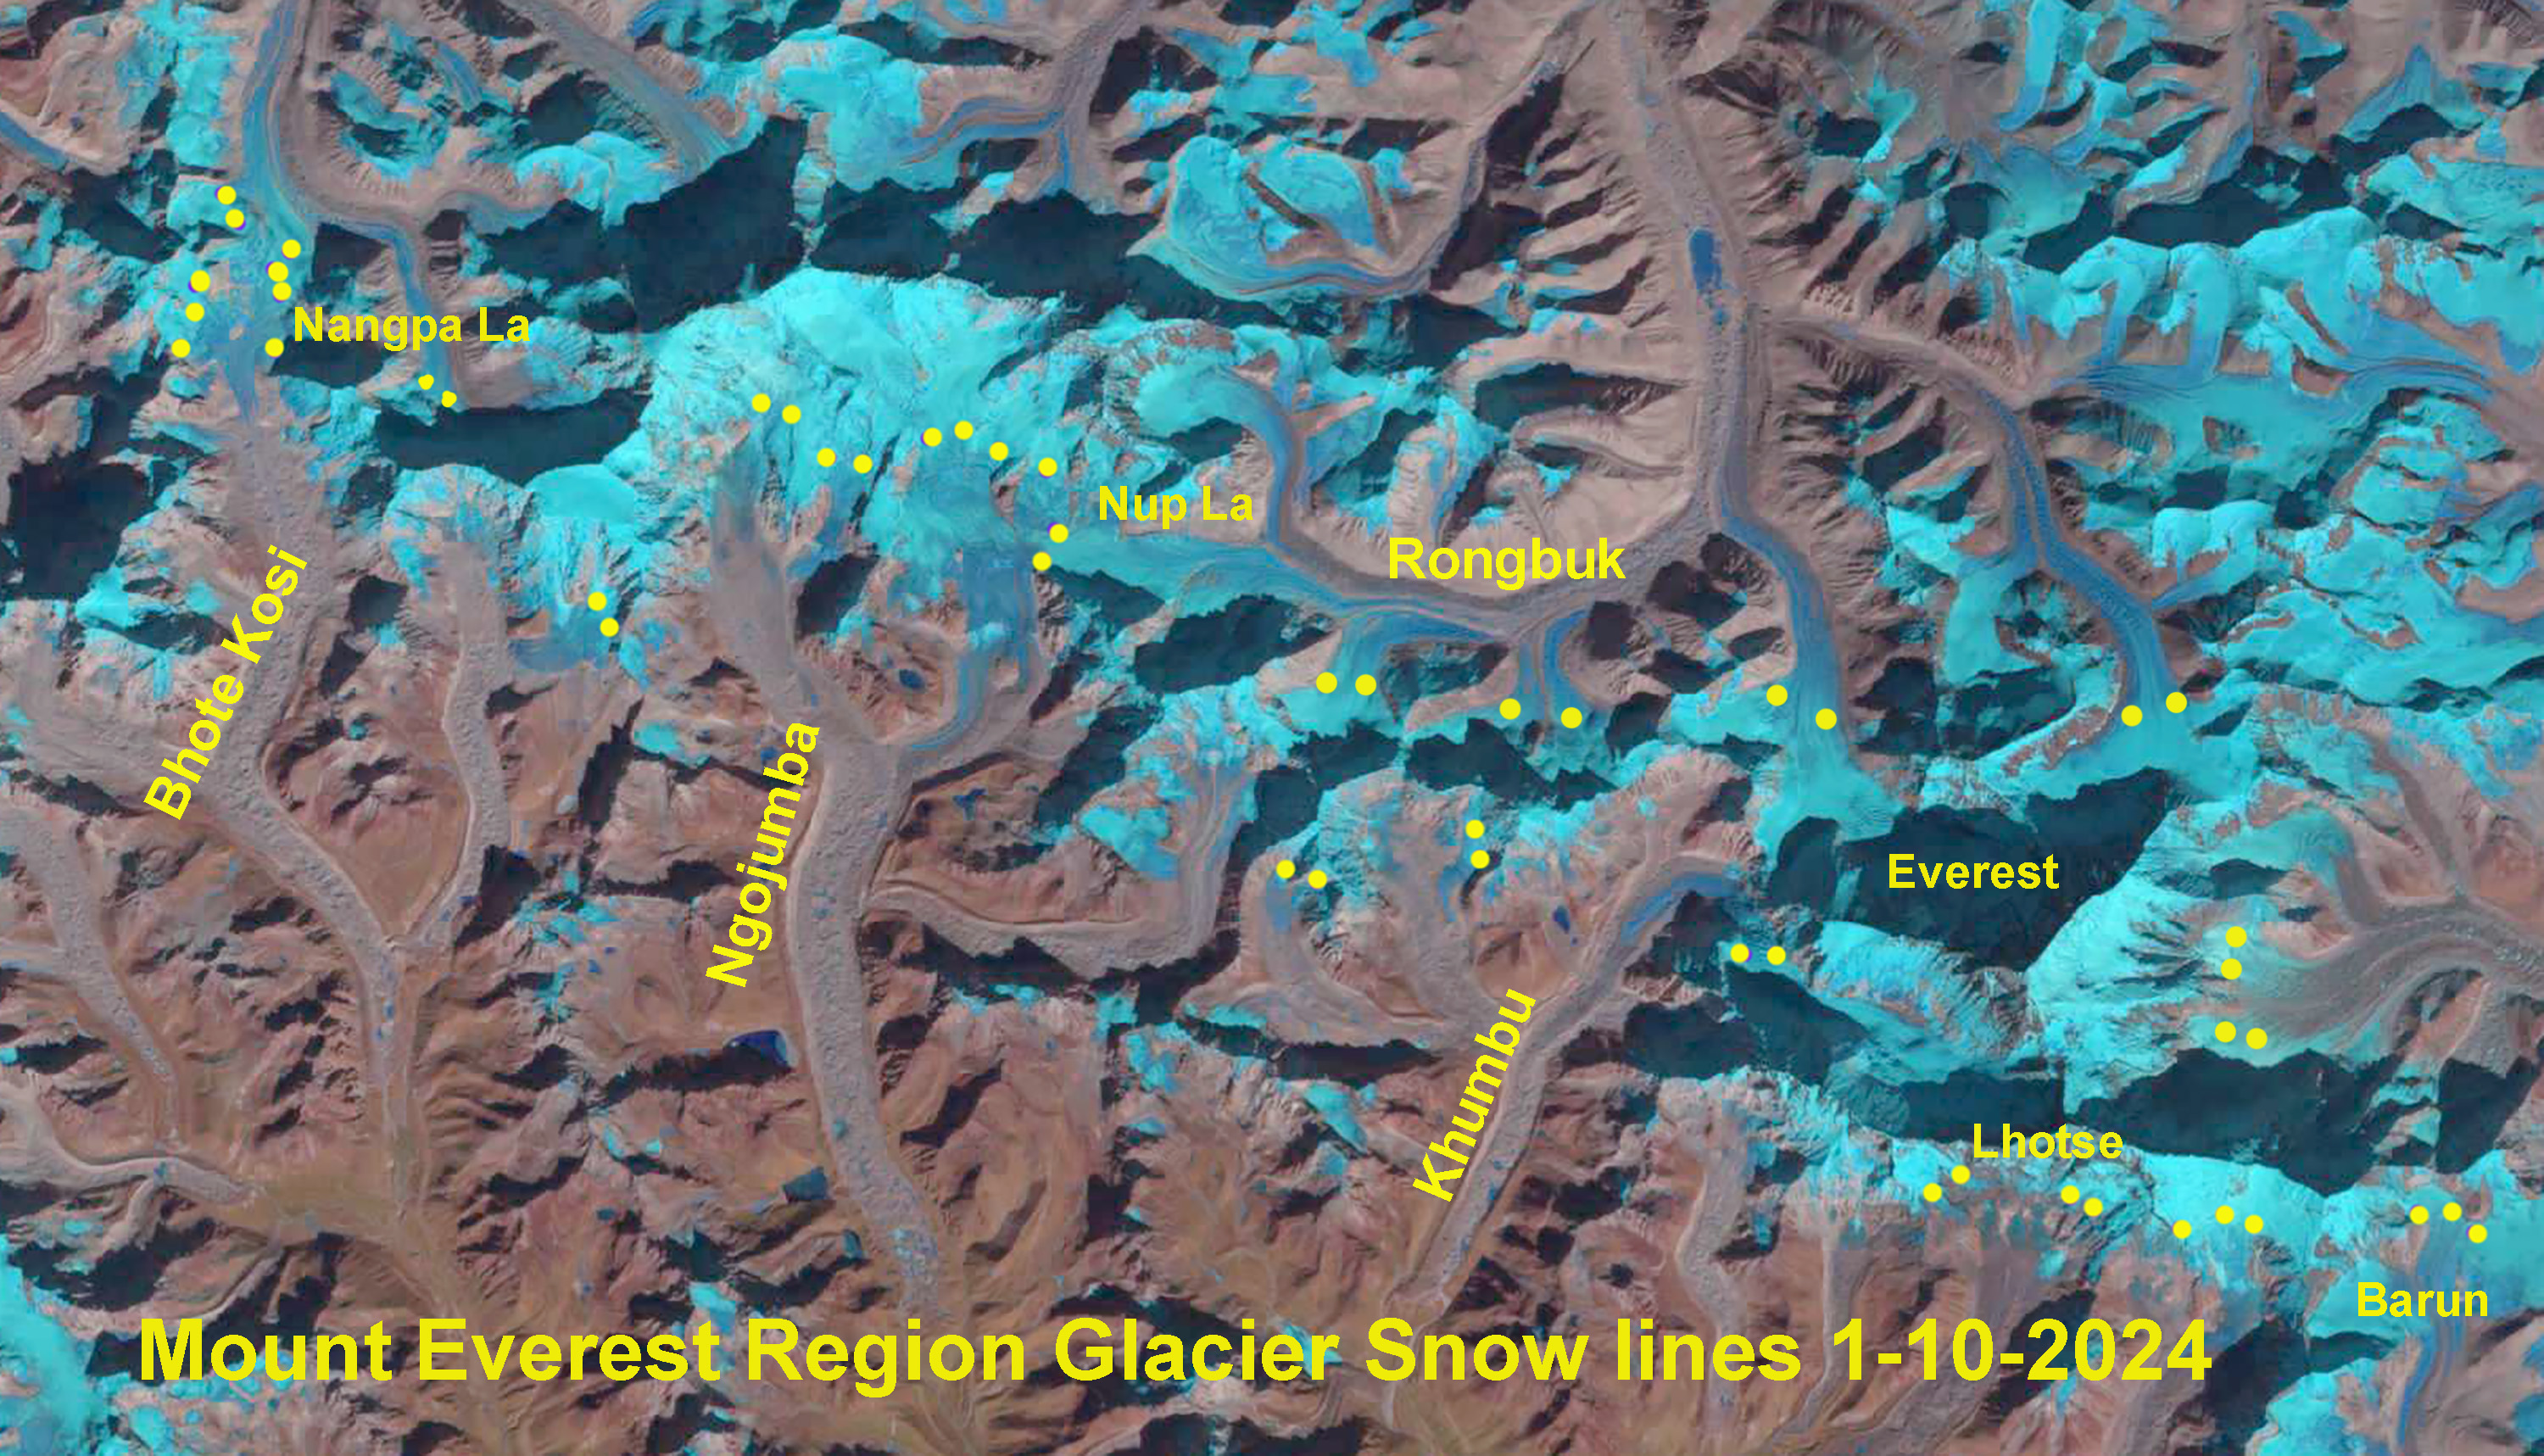
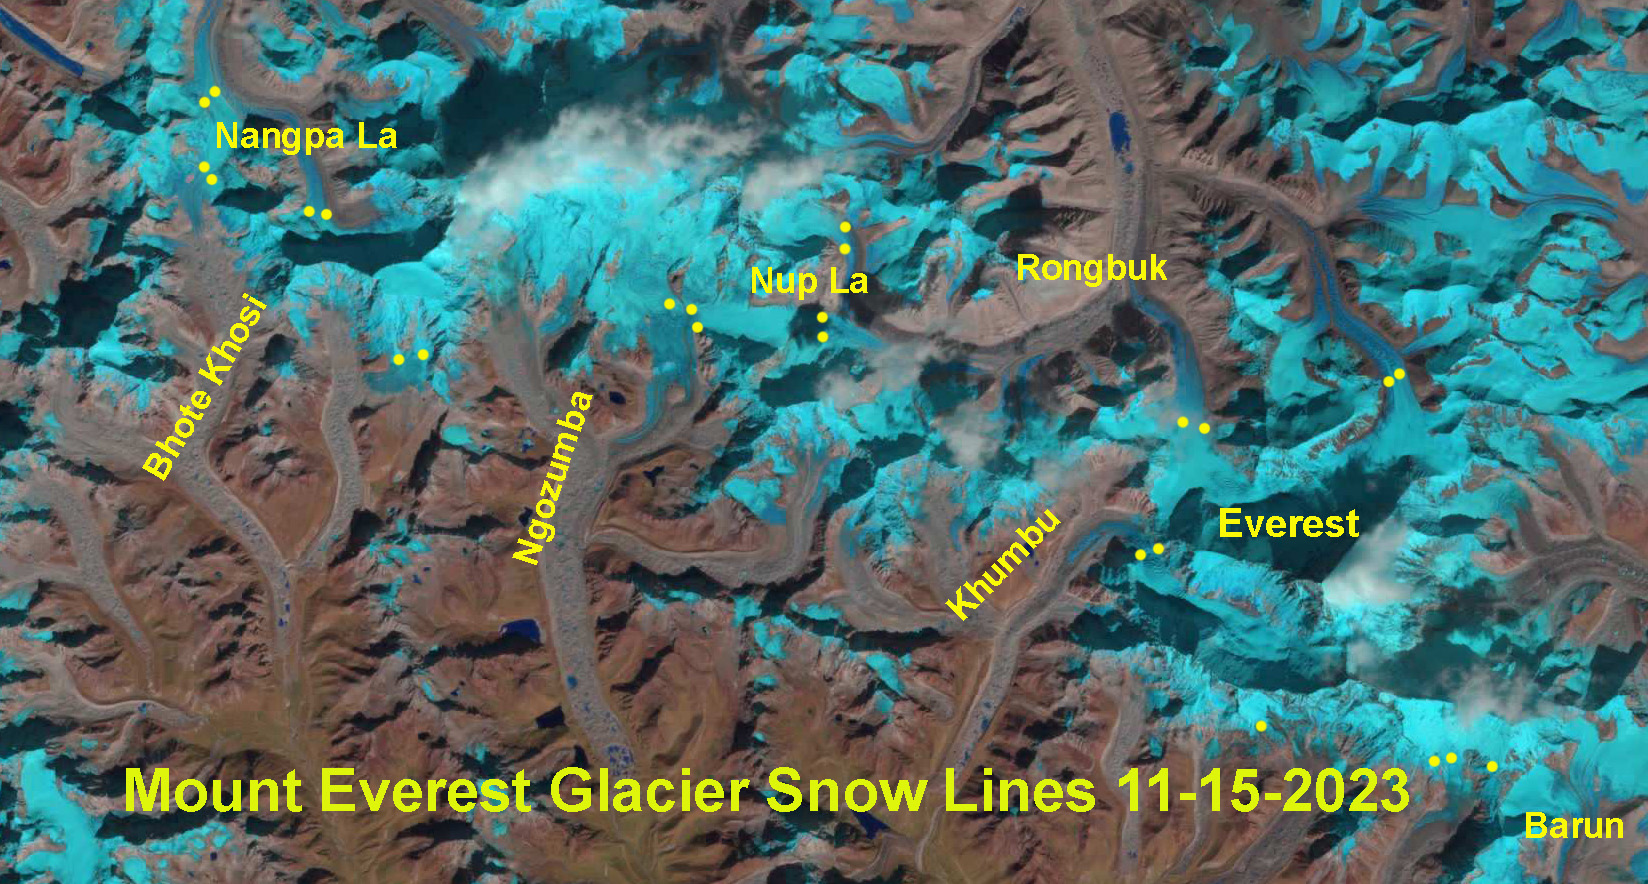
This is a update to a previous post examining persistent high snow lines through the winter on Mount Everest Region glaciers. Here we examine imagery from October 2023 through early January 2025 illustrating the rise in snow line through January in both 2024 and 2025. The persistent high snow line during winter indicate a lack of snow accumulation during the winter season. This is a dry season in the Himalayan region, yet typically an extensive snow cover develops, though not particularly deep. A combination of warmer and drier conditions have been more prevalent in recent winters including 2021, 2023, 2024 and 2025 (Kathmandu Post, 2025). These conditions are driving both reduced snow cover, higher elevation snow lines and increased forest fires (Nepali Times, 2025).
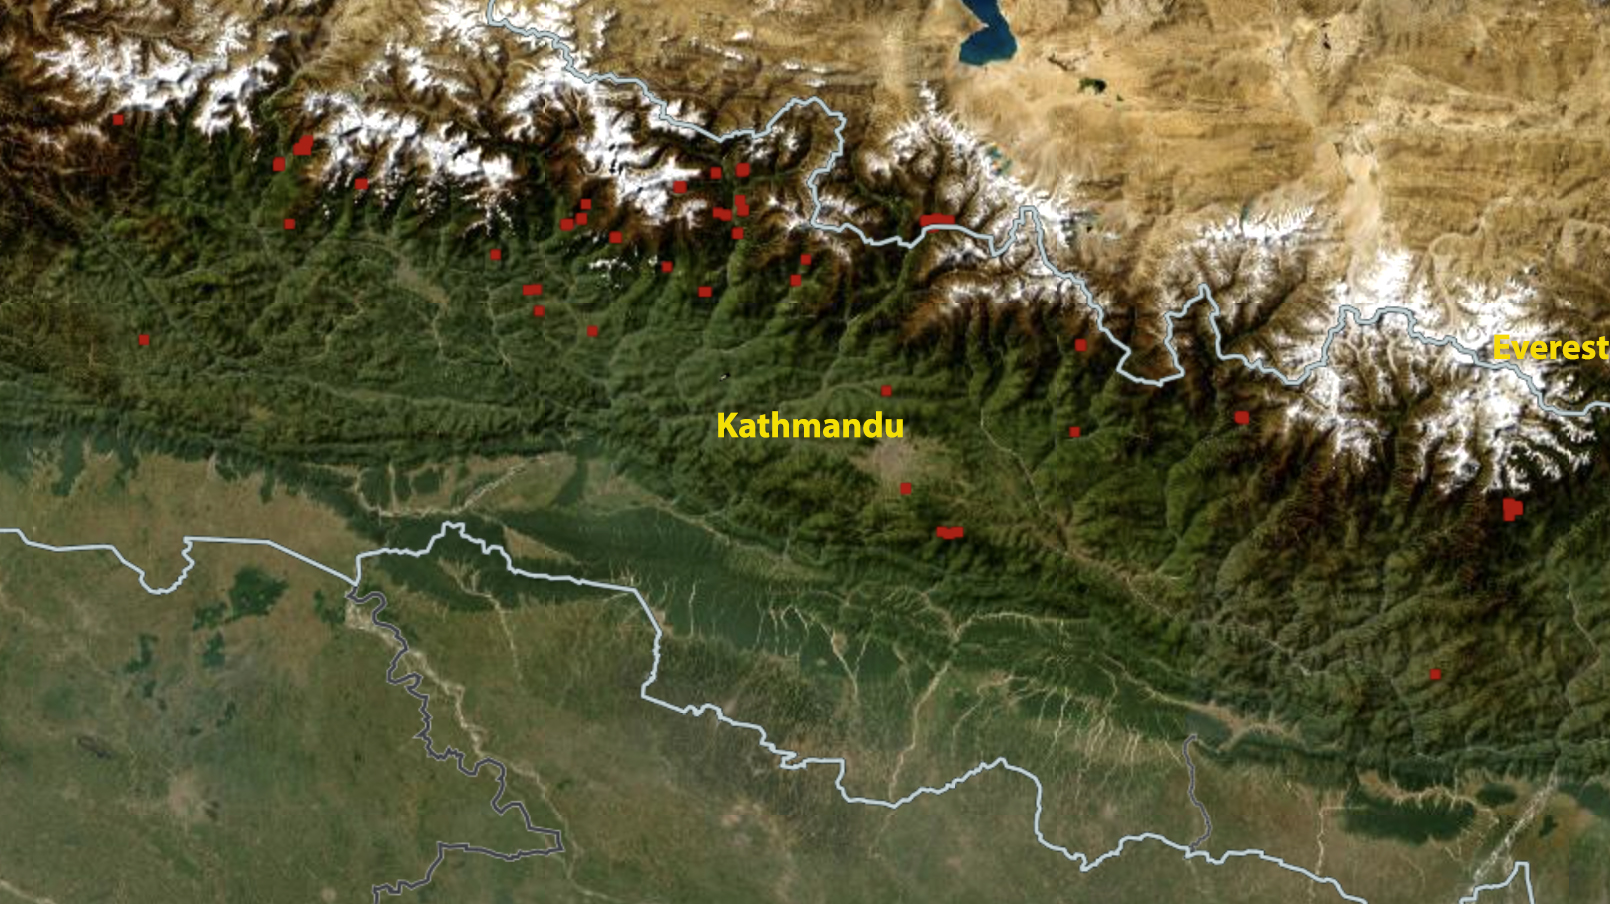
NASA FIRMS view of fire locations in Nepal on Jan. 23, 2025, each red dot is a fire, note most are at higher elevations including several near the Everest region.
There have been a few small snow events early in each winter, but the snow cover does not persist indicating that ablation has continued even above 6000 m on Mount Everest. Snow cover loss during winter at these altitudes is primarily the result of sublimation , with losses observed up to 2.5 mm per day (Tenzing et al 2023).
The 2024 winter season was different than the high snow lines in 2020/21 that resulted from extraordinary January heat wave, as there was not a noteworthy heat wave (Pelto et al 2021). Instead a lack of any significant precpipitation was critical with less than 25 mm of precipitation at Everest Base Camp from Jan.1-March 31, 2024 and above normal temperatures for significant periods. The high glacier snow lines persisted into the monsoon season of 2024. The post-monsoon season in 2024 was warm and wet, leading to above average snow line elevations in November 2024.
In December 2024, Nepal was 20-25% of normal with drier conditions in the east. This accompanied above average temperatures, though not as high as in December 2023, leading to extreme drought in several provinces including Koshi Province (Nepal DHM). January, 2025 has continued to be dry, with consistently warm conditions. This has enabled high glacier snow lines to persist and rise from early December into early February, 2025.
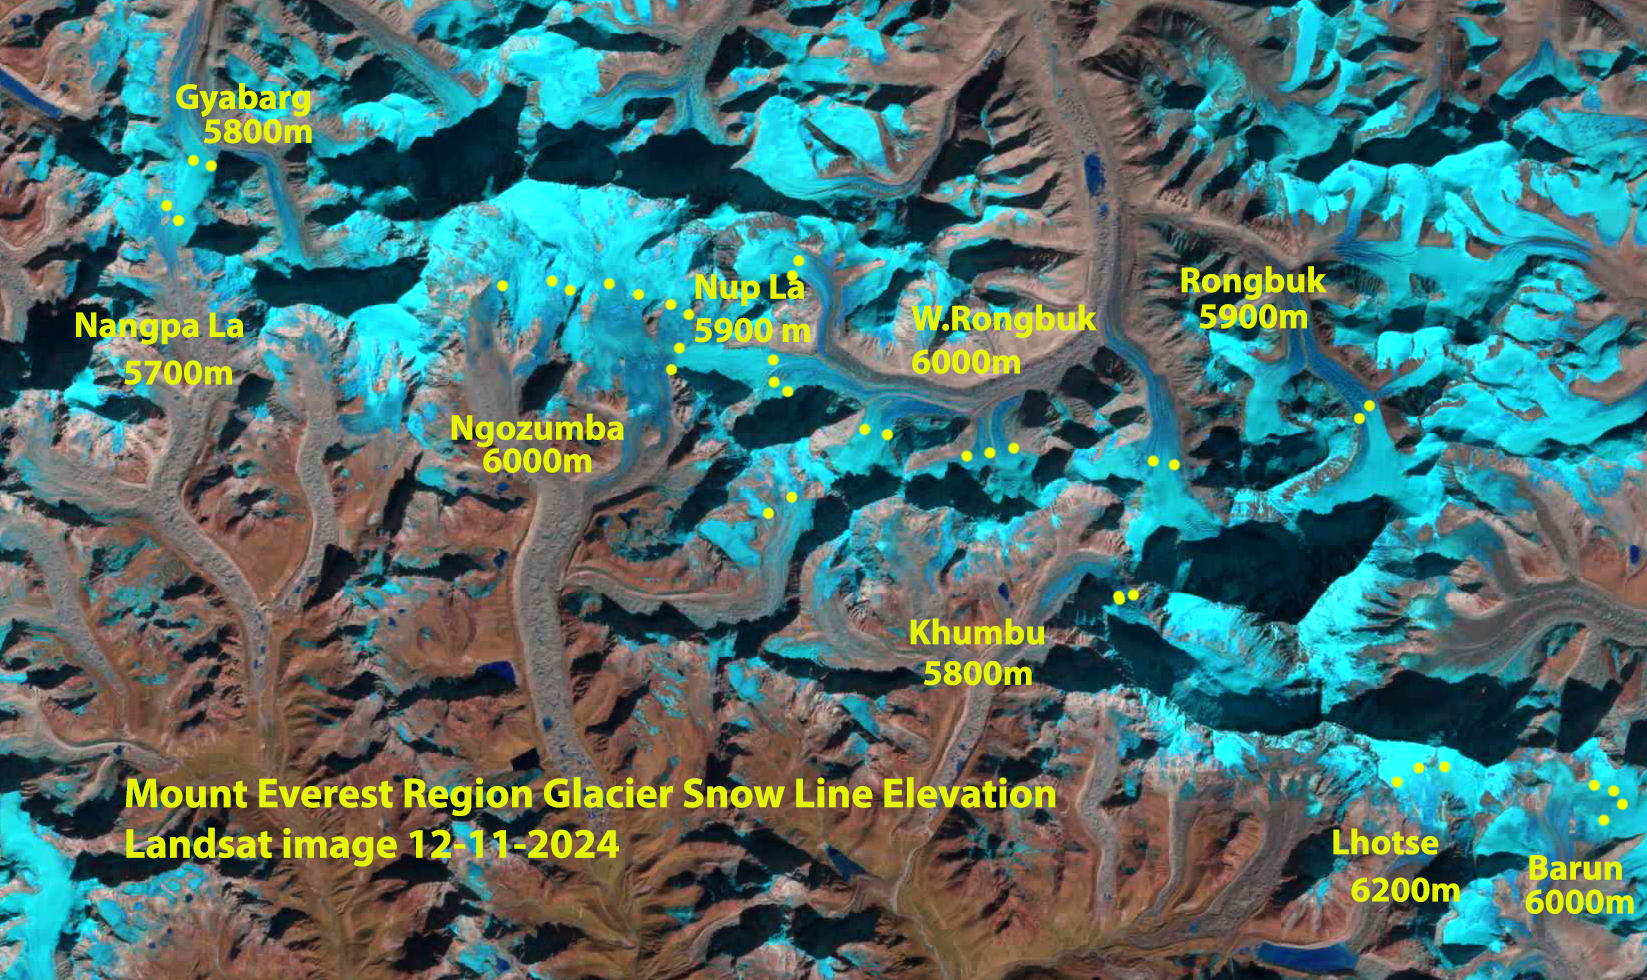
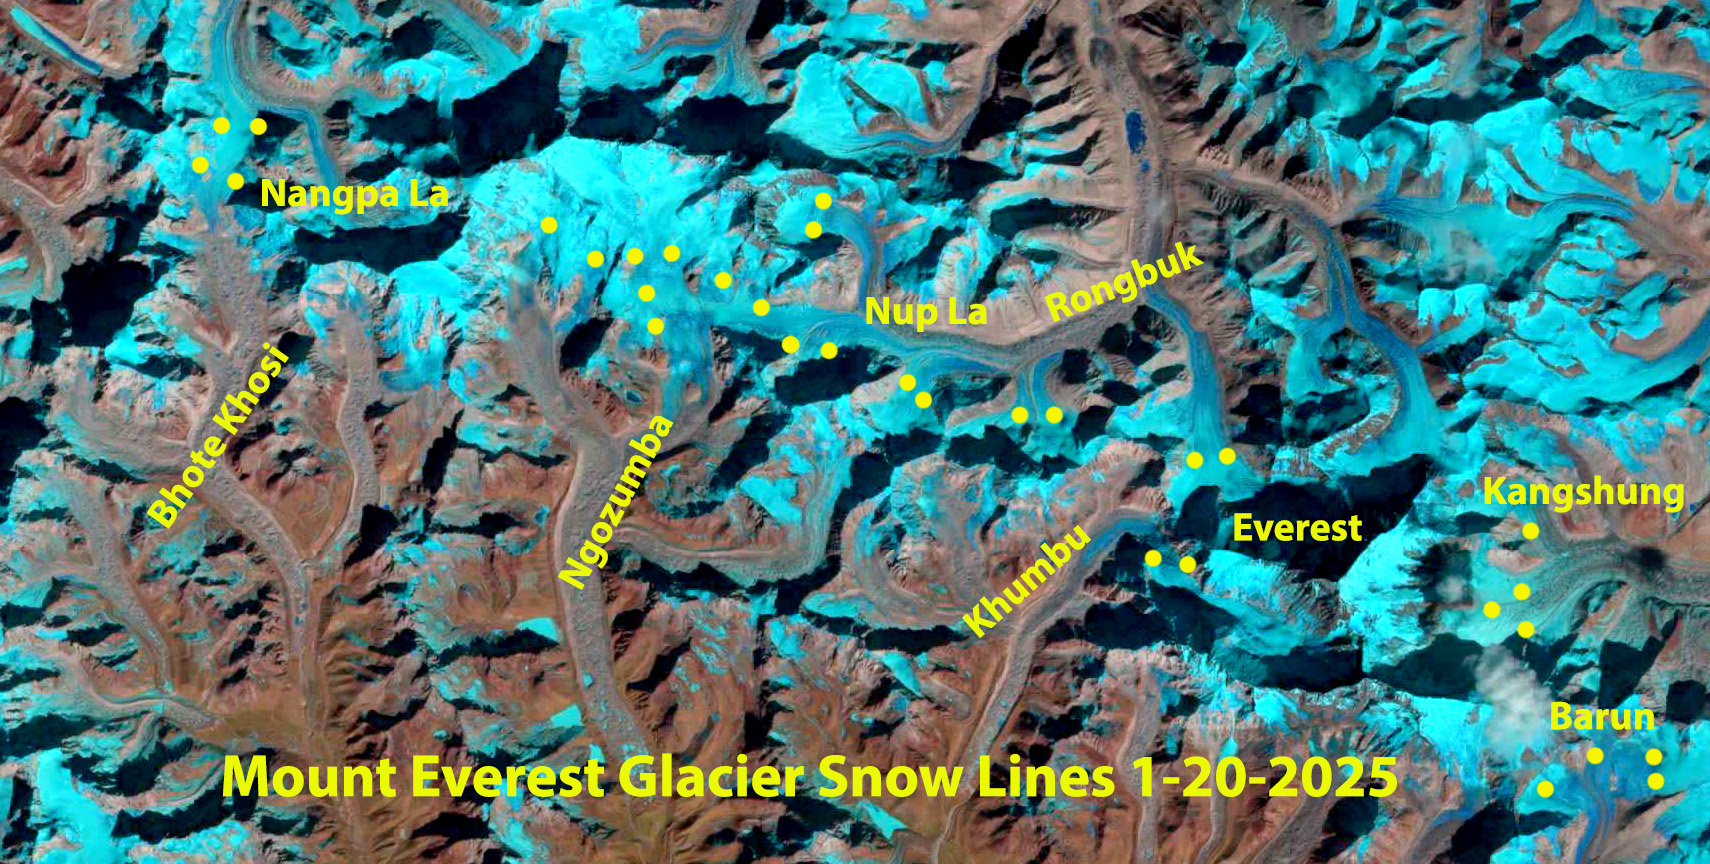
The snow line on Mount Everest Region glaciers on Dec. 11, 2024 indicated by yellow dots on the Landsat image. Note that Nangpa La and Nup La-two high passes (5800-5900 m) are snow covered. The average snow line is 5950 m.The snow line on Mount Everest Region glaciers on Jan. 20, 2025 indicated by yellow dots on the Landsat image. Note that Nangpa La and Nup La-two high passes (5800-5900 m) both have a narrow band of snow cover. The average snow line is 6050 m.The snow line on Mount Everest Region glaciers on May 1, 2024 indicated by yellow dots on the Landsat image. Note that Nangpa La and Nup La-two high passes (5800-5900 m) are both snow free. The average snow line is 6050 m.The snow line on Mount Everest Region glaciers on March 14, 2024 indicated by yellow dots on the Landsat image. Note that Nangpa La and Nup La-two high passes (5800-5900 m) are both snow free. The average snow line is 5950 m.
The snow line on Mount Everest Region glaciers on Feb. 11, 2024 indicated by yellow dots on the Landsat image. Note that Nangpa La and Nup La-two high passes (5800-5900 m) are both snow free. The average snow line is 6000 m.
The snow line on Mount Everest Region glaciers on Jan. 10, 2024 indicated by yellow dots on the Landsat image. Note that Nangpa La and Nup La-two high passes are both snow free. The average snow line is 6000 mThe snow line on Mount Everest Region glaciers on Nov. 15, 2023 indicated by yellow dots on the Landsat image. Note that Nangpa La and Nup La-two high passes are both snow covered. The average snow line is 5800 m.The snow line on Mount Everest Region glaciers on Oct. 30, 2023 indicated by yellow dots on the Landsat image. Note that Nangpa La and Nup La-two high passes are both snow covered. The average snow line is 5700 m.