Grand Pacific Glacier in 1984 and 1999 Landsat images. Red arrow indicates the front of the clean ice flow of the Grand Pacific that also marks its lateral boundary with Ferris Glacier. B and C indicate locations where tributary tongues have been retreating from the main glacier. M is the Margerie Glacier.
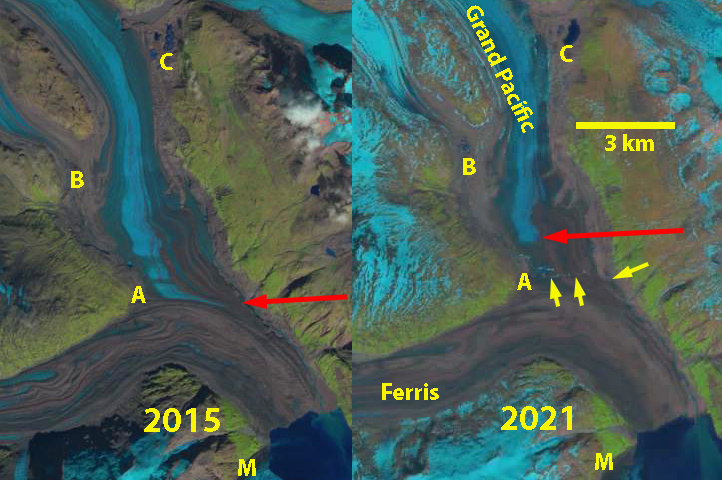
Grand Pacific Glacier in 2015 and 2021 Landsat images. Red arrow indicates the front of the clean ice flow of the Grand Pacific that also marks its lateral boundary with Ferris Glacier and the front of its active ice. Yellow arrow indicates outlet stream that is now beginning to separate the glaciers. B and C indicate locations where tributary tongues have been retreating from the main glacier. M is the Margerie Glacier.
The Grand Pacific joins with Ferris Glacier before ending at the head of Tarr Inlet in a ~1.9 km wide glacier front and 20-50 m high ice front. William Field observed the glacier advancing steadily from the 1930’s-1968 at 35 m/year , extending ~.0.5 km across the US/Canada boundary. This advance continued behind its protective shoaling moraine/outwash plain until it was 1.5-1.6 km across the national boundary and just meeting the Margerie Glacier. A slow recession of 200 m has occurred since, with the current terminus having a width of 1.8 km, most in shallow water or terminating on a tidal flat. The Grand Pacific Glacier has been thinning for more than 50 years, which is leading to the recession, though not nearly as significant at for Melbern Glacier which it shares a divide with. Clague and Evans (1993) noted a 7 km retreat of Melbern Glacier from 1970-1987, and a 5.25 km retreat from 1986-2013 (Pelto, 2011-2017). The mass loss of the Grand Pacific Glacier system is part of the 75 Gt annual loss of Alaskan glaciers that make this region the largest alpine glacier contributor to sea level rise from 1984-2013 (Larsen et al 2015).
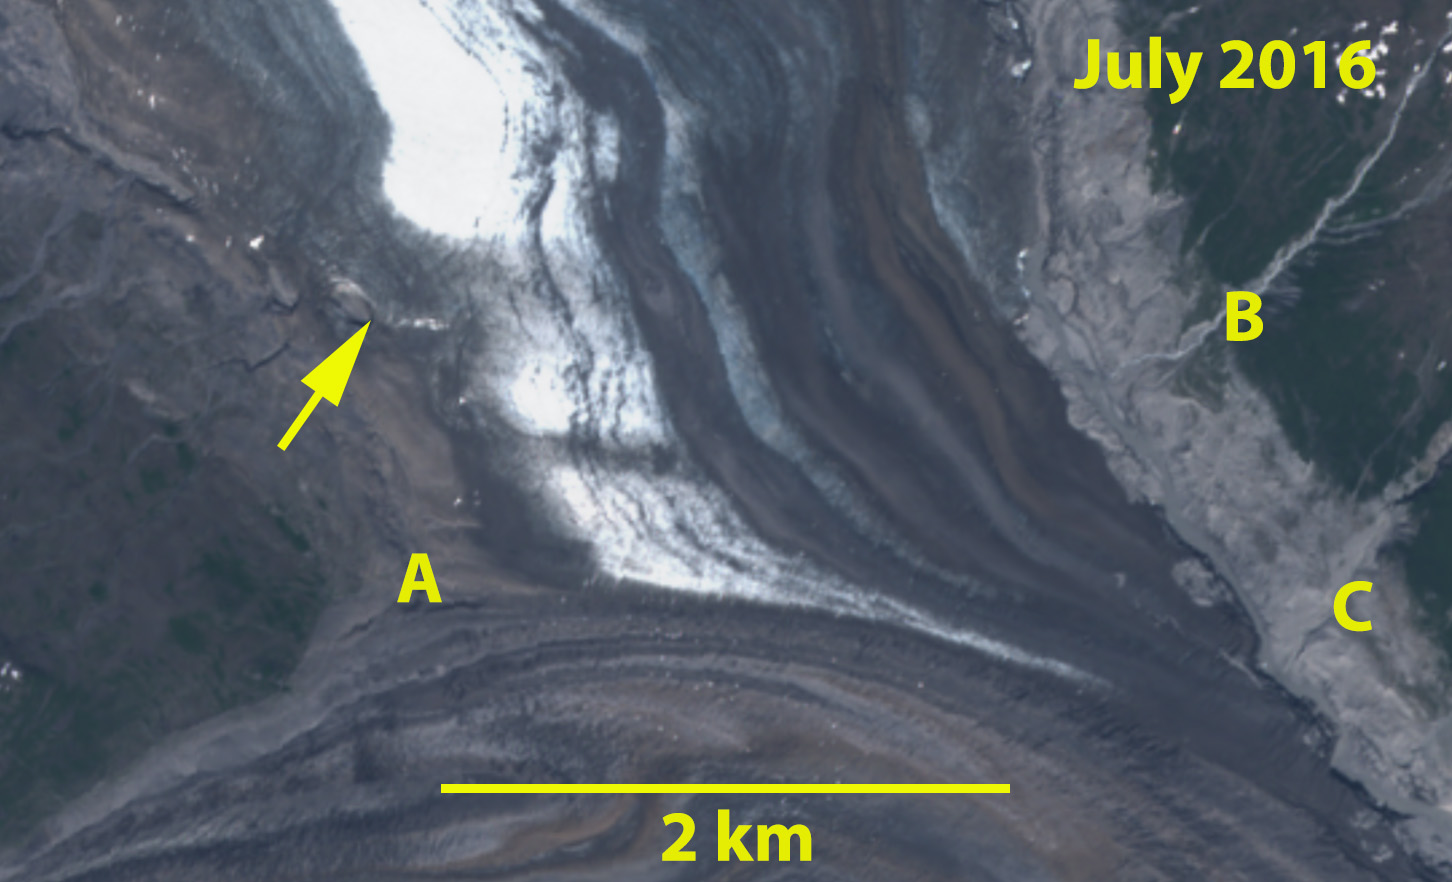
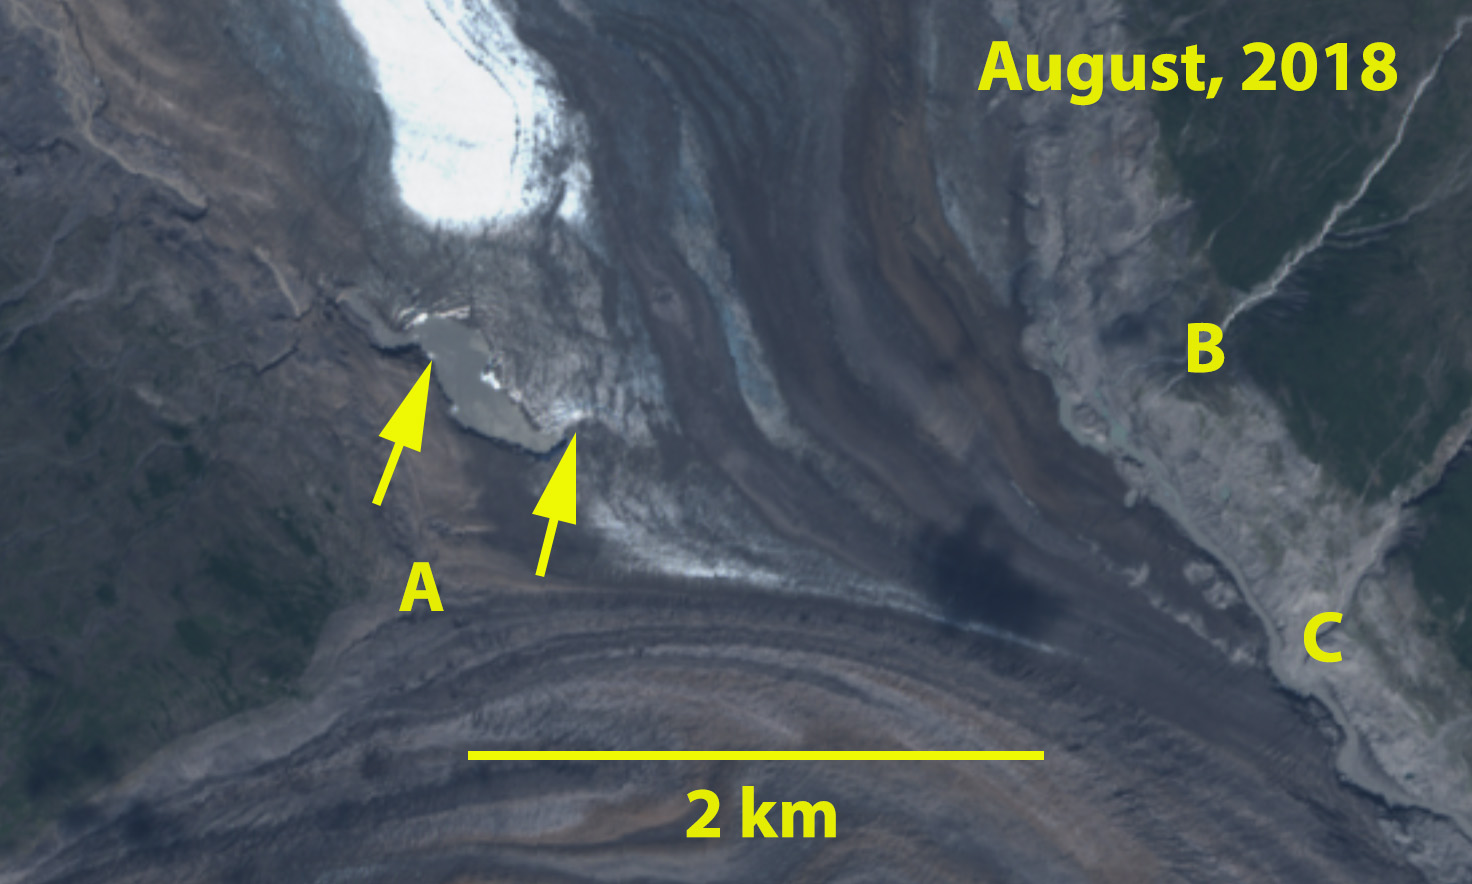
William Field reported that Grand Pacific Glacier comprised 80% of the joint glacier front with Ferris Glacier in 1941, declining to 40% in 1964. In 1984 Landsat imagery illustrates that the Grand Pacific is still supplying ice to the glacier front but only comprises 25% of the ice front. In 1999 this has diminished to 20% of the ice front, that is now entirely on an outwash plain above the tidal level. Tributary C has disconnected from Grand Pacific Glacier between 1984 and 1999, and tributary B has retreated substantially from the Grand Pacific. By 2015 the junction of the Ferris and Grand Pacific Glacier indicates all flow of the latter is diverted east along the Ferris margin and does not reach the ice front. There is a band of clean glacier ice that reaches the junction in 2015 and in the 2016 Sentinel image, but no longer reaches the eastern margin. In 2016 the glacier outlet stream along the west side of the Grand Pacific goes under the glacier to the east margin near the junction. By 2018 the surface exposed section of the stream extends ~700 m across the Grand Pacific Glacier before going beneath the glacier along the Ferris/Grand Pacific margin. In 2021 the glacier outlet stream cuts halfway across the glacier before going beneath and emerges prior to reaching the east margin, note yellow arrows below on the Sentinel image . The clean ice area no longer reaches the junction with the Ferris Glacier in 2021. The rapid expansion of the surficial outlet stream that is physically separating the two glacier will continue to cut across the entire width of the Grand Pacific Glacier. This glacier no longer has a connection to the Pacific Ocean, and no longer presents a grand front. The retreat is limited in distance compared to Grand Plateau or Fingers Glacier, but the separation is dramatic.
Sentinel 2 image of Grand Pacific Glacier in July 2016, yellow arrow indicates glacier outlet stream beginning to transect glacier.
Sentinel 2 image of Grand Pacific Glacier in August 2018, yellow arrow indicates glacier outlet stream expanding across glacier.
Sentinel 2 image of Grand Pacific Glacier in July 2016, yellow arrow indicates glacier outlet stream nearly transecting the entire width of the Grand Pacific Glacier front/margin with Ferris Glacier.
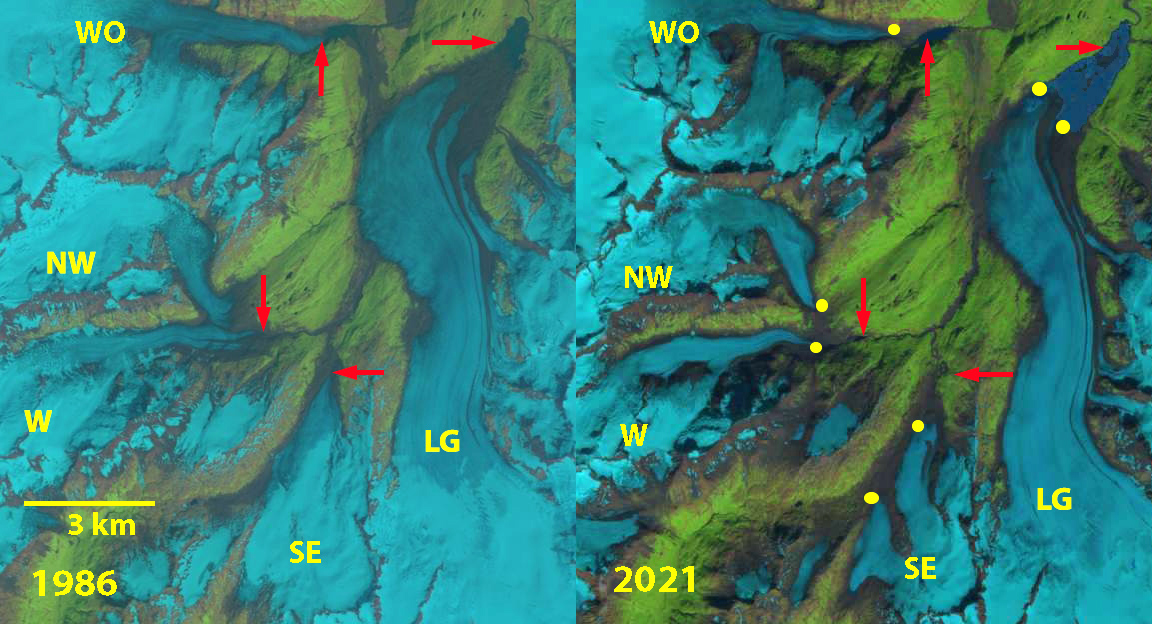
Glaciers in the Lake Fork Knik River watershed in 1986 and 2021 Landsat images. LG=Lake George Glacier and WO=Whiteout Glacier with the remainder unnamed, labelled here as W=West, NW=Northwest and SE=Southeast. Red arrows mark 1986 terminus locations and yellow dots the 2021 terminus locations.
At the headwaters of the Lake Fork of the Knik River are a series of glaciers undergoing retreat and separation. The headwaters is dominated by the Lake George Glacier, which had terminated in the large proglacial Lake George that periodically drained past/beneath Knik Glacier (Stone, 1963), after 1966 the lake no longer filled (Post and Mayo, 1971). A new smaller proglacial lake began to form due to the retreat of Lake George Glacier by. Here we examine the changes in this headwater glacier group from 1986-2021 with Landsat imagery. The proglacial lake at the terminus of Lake George Glacier is moraine dammed and has expanded from 1986-2021, this is representative of the expansion of moraine dammed lakes in Alaska with an 87% areal increase from 1984-2019 noted by Rick et al (2022).
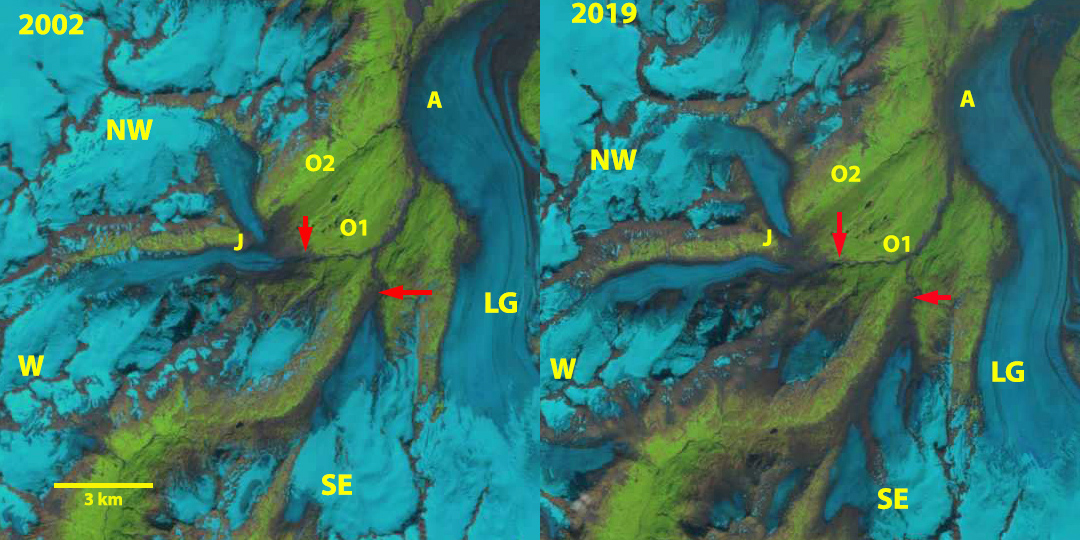
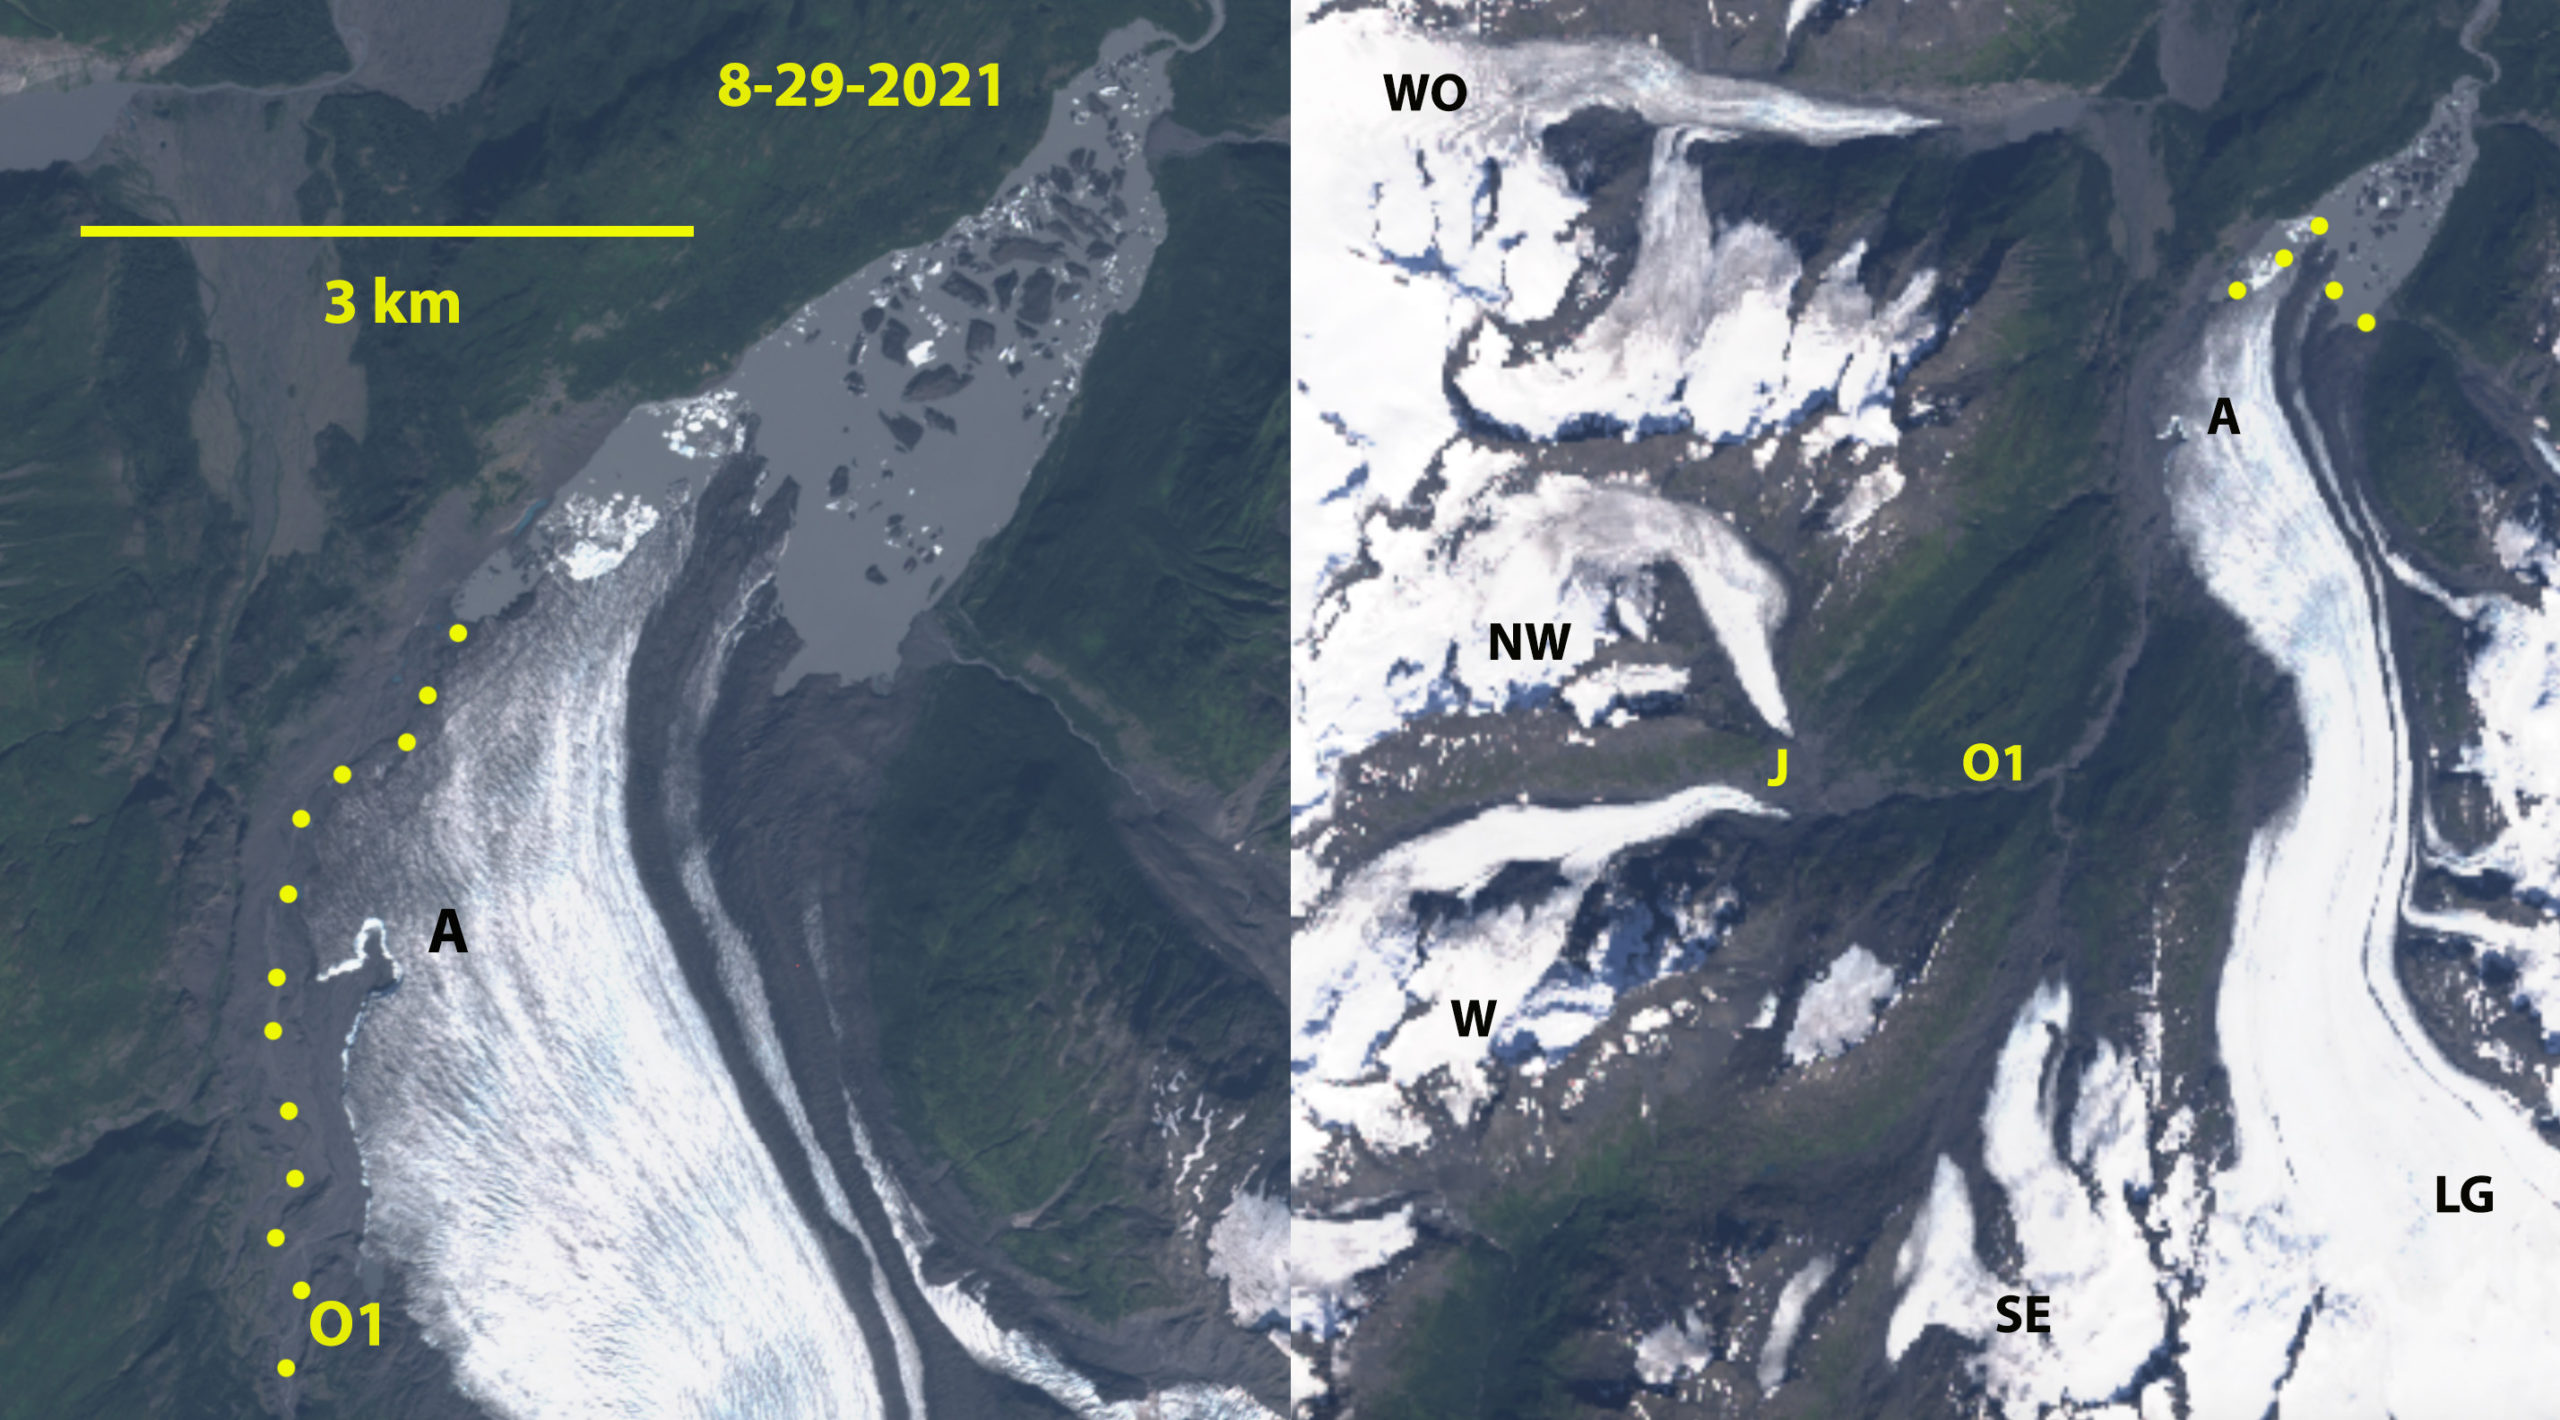
In 1986 Lake George Glacier terminated in a small proglacial lake with an area of 0.3k m2,. Whiteout Glacier terminated at 300 m, within 3 km of LG. West and Northwest Glacier had a joint terminus (Point J) at 600 m, with two outlet streams O1 and O2. Southeast Glacier had a single terminus at 500 m and had an area of 18.4 km2,. In 2002 the main change was the separation of West and Northwest Glacier. The snowline on LG was at 900 m in August 2002. By 2019 Southeast Glacier has two separate termini, with the ridge just north of SE dividing the glacier, with the snowline at 1100 m in August. The proglacial lake at the end of Lake George had an area of 4.0 km2,. By 2021 the proglacial lake had expanded to an area of 4.3 km2,, a 4.0 km2, increase since 1986. Terminus retreat has been 2100 m for Lake George Glacier 1100 m for Whiteout Glacier, 1250 m for West Glacier, 1000 m for Northwest Glacier and 1100 m for Southeast Glacier. Southeast Glacier now has an area of 12 km2, a 33% area loss since 1986, ~1% per year. In 2021 the Outlet Stream from W, NW, and SE glacier parallels the margin of Lake George Glacier, but no longer goes under or is in contact. A notch at Point A has developed, from a meltwater runoff channel. Icebergs occupy much of the lake in 2021 indicating there is still active development of the lake. The lake development and separation of glaciers is similar to that observed at Field Glacier, Sheridan Glacier and Excelsior Glacier.
Glaciers in the Lake Fork Knik River watershed in 2002 and 2019 Landsat images. LG=Lake George Glacier with the remainder unnamed, labelled here as W=West, NW=Northwest and SE=Southeast. O1 and O2 are the outlet streams of the W and NW Glacier in 1986, with O2 abandoned by 2002.
Glaciers in the Lake Fork Knik River watershed in August 29, 2021 Landsat image. LG=Lake George Glacier and WO=Whiteout Glacier, with the remainder unnamed, labelled here as W=West, NW=Northwest and SE=Southeast. O1 is the outlet streams of the W and NW Glacier, yellow dots at right indicate the course. Note the notch in Lake George glacier at Point A.
Landsat images of Sollipulli from 1986 and 2022. Point A-D are locations where the glacier spilled out of the caldera in 1986, but no longer does so in 2022.
Nevados de Sollipulli is a volcano, is in the central Andes of Chile near the border with Argentina in Parque Nacional Villarica, Chile. The 4 km wide summit caldera at ~2100 m is filled by a glacier. The volcano is dormant last producing lava flows 700 years ago and last erupting 2900 years ago (NASA, 2017). Reinthaler et al (2019) identified a 27% decline in glacier area from 1986-2015 on 59 volcanoes in the Andes. The study included Sollipulli where the area declined from 16.2 km2 in 1986, 20 12.5 km2 in 1999 and 11.1 km2 in 2015 (Reinthaler et al 2019). Here we examine Landsat imagery illustrating the recession from 1986-2022 and the loss of all snowcover for most of the summer of 2022. The summer of 2022 led to early summer loss of most/all the snowpack on Central Andes glaciers from 30-40 S. (Pelto, 2022)
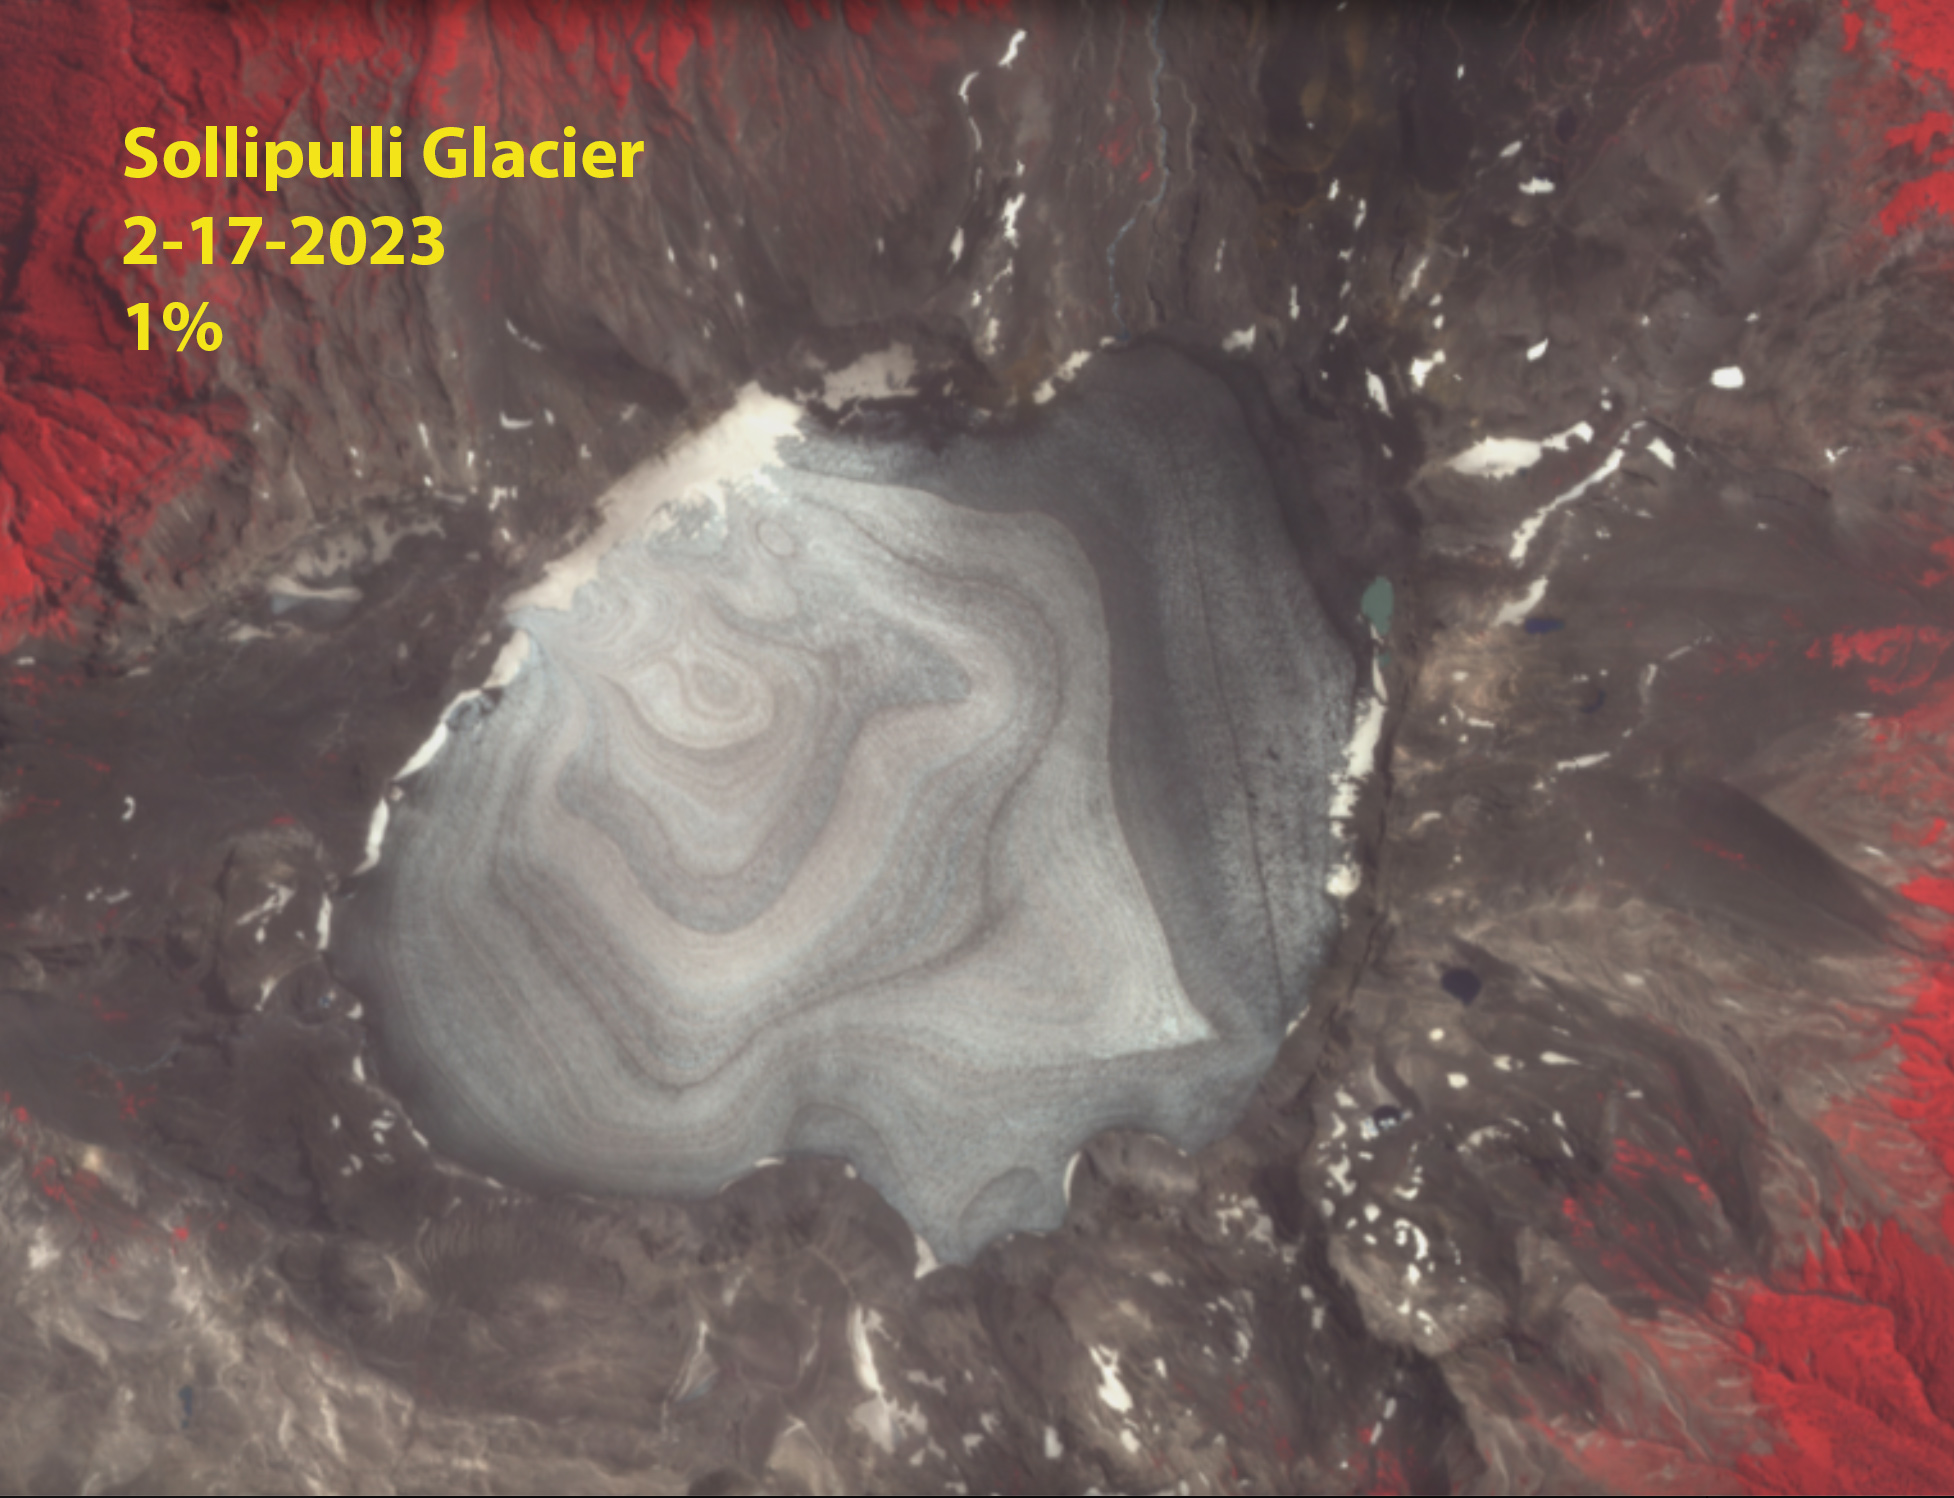
In 1986 a Landsat 5 image illustrates that the glacier not only fills but overflows the caldera at Points A-D, with Point A and B feeding significant glacier area. The glacier is also almost completely snowcovered in late February. In 2003 the glacier is still spilling over at Point A, and is almost entirely snowcovered in mid-February. On January 8, 2022 the glacier is already 95% free of snowcover with some snow patches on the NW margin. By January 24 the glacier is 99% snow free and remains snow free through mid-March in a Landsat and Sentinel image from 3-13 and 3-16 respectively. There is a small patch of relict glacier ice near Point B, while the former glacier at Point A has disappeared. The annual layering preserved in the glacier ice as seen in the Landsat Band 5 image will continue to evolve as the glacier thins. The dirty nature of this ice enhances solar radiation melting, particularly compared to snowcover. Two months of exposure at the 2100 m elevation ice cap will have led to several meters of ice loss. The extent of the glacier has declined to 10.2 km2 in March 2022 a 37% decline since 1986.
Landsat images indicating the near complete snowcover in Landsat 7 image from 2003 and the loss of all snowcover that continued from January until at least March 13 2022. Note the annual layers preserved in the glacier ice now exposed at the surface.
Sollipulli Glacier in early January with only a fringing area of snowpack along the northwest margin. Sixty-four days later the glacier is still bare of snowpack.
Bare glacier ice exposed with months left in the melt season enhances melt. Down slope ice bands and surface roughness on Sholes Glacier.
Heat waves and glaciers don’t usually go together; however, in the last several years an increasing number of heat waves have affected alpine glacier regions around the world. This is true from Arctic Canada to the Himalayas from the Andes to Alaska. Here we review a number of these heat waves from 2018-2022, that I have been involved with assessing and observing. In particular heat waves leave a greater portion of the glacier snow free, which enhances melting and mass balance losses. This is most pronounced when the heat wave occurs prior to or early in the melt season exposing bare glacier ice for the bulk of the melt season. This occurred in summer 2021 in the Pacific Northwest, in summer 2022 in the Central Andes of Chile and Peru, and during the pre-monsoon season in 2022 in the Himalaya. In the summer of 2022 heat waves impacted the glaciers of Svalbard and Europe. In the summer of 2023 the Central Andean glaciers have again been stripped of snowcover.
Lowell Glacier in Landsat images from 7/4, 7/26 and 8/11 with Sentinel images from 7/22 . The snowline is shown with purple dots. Point A-F are fixed reference locations. The snowline migrated upglacier 20 km and 300 m in elevation. A significant snow swamp is between the yellow and purple dots on 7/26, that was not present on 7/22.
The beginning of this “wave” of observations of heat wave impacts on glaciers, was on Lowell Glacier, Yukon where a large snow swamp formed in a matter of days during a Yukon/Northwest Territories Heat Wave. On July 26, the slush covered an area of more than 40 square kilometers, with the rapid development of such a large melt area on Lowell Glacier coinciding with four days where daily temperatures at nearby Haines Junction (~60 km northeast of the glacier) reached 29 degrees Celsius. The only way to generate an extensive snow swamp is to have the snow saturated with water all the way to the surface NASA’s Earth Observatory (NASA EO).
Taku Glacier transient snowline (purple dots) in Landsat images from 7/21 and 9/16/2018.
This same heat event led to the observation that the snow lines on Taku Glacier in Alaska were the highest they had been since tracking began in 1946, 200 m higher than previously observed, with the snow line rising +10 m/day during the heat wave (Pelto, 2019).
Fork Beard (F) and Nerutusoq Glacier (N) Baffin Island on June 1, 2019, June 18, 2019 Sentinel images and June 30 Landsat image. Purple dots indicate the snowline.
During June 2019 on Baffin island Pangnirtung featured four days with record temperatures for that date June 5 (15.1), June 11 (13.5) and June 12 (13.6), and June 19 (14.4). There were 14 days with a maximum temperature above 10 C. On Fork Beard Glacier and Nerutusoq Glacier this drove a snowline rise from 800 m on June 1 to 1100 m by June 18 and 1150 m on June 30. A rate of over 10 m/day for the month.
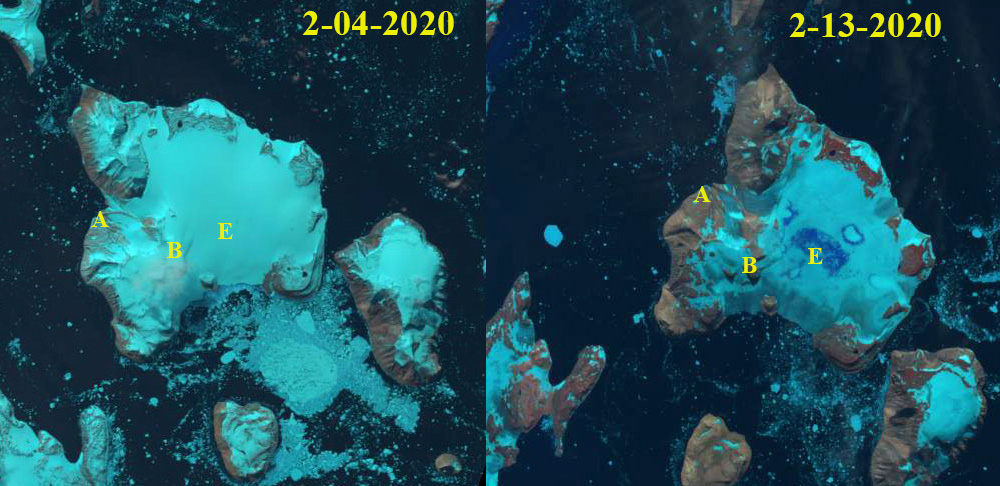
Eagle Island Ice Cap, Antarctica in Landsat images from Feb. 4, 2020 and Feb. 13, 2020. Point E indicates an are area of snow/firn that is saturated with
An all-time temperature record for Antarctica in February 2020, a high-pressure ridge and a blocking high in the Drake Passage caused anticyclonic circulation bringing warm moist air from the Pacific Ocean to the Antarctic Peninsula Xu et al (2021). This led to vertical air flows in a foehn warming event dominated by sensible heat and radiation made generating abrupt warming Xu et al (2021). The visible impact of this heat event were the rapid rapid formation of melt ponds on Eagle Island Ice Cap I reported to NASA EO. On Eagle Island Ice Cap melt averaged 22 mm/day from Feb. 6-11 based on MAR climate model output forced by the Global Forecast System (GFS) generated by Xavier Fettweis. Rapid melting generating significant snowline rise on Coley Galcier, James Ross Island as well (Pelto, 2020).
Nanpa La (NPL) and Nup La (NL) in October 13, 2020 and January 17, 2021 Landsat imagery indicating the snow line rise that has persisted into mid- winter. Snow line indicated by yellow dots.
When record warmth spread over the Mount Everest region in January 2021, the snow lines near Mount Everest rose durng the October-December 2020 period, and remained at nearly 6,000 meters, including the key glacier passes from Nepal into China being snow free into late January. The National Geographic Perpetual Planet Expedition weather team, led by L. Baker Perry and Tom Matthew, had installed weathers stations at high elevations on Mount Everest in 2019 (Matthews et al 2020). These stations provided field observation of how warm it was during this period, which explained the snow free glaciers in winter. Temperature observations and reconstructions of daily weather conditions, dating back to 1950, indicated that the region had experienced the five warmest winter days since 1950 during a short period in January 2021. Prajjwal Panday examined the decline of snow cover area and rise of sthe snowline on glaciers from Oct. 2020 -January 2021 finding a 15% depleation and 200 m rise respectively. Even in the highest mountain range in the world, we are seeing melt conditions during the winter. This study was first published by NASA EO within a month of the event, and then in the journal Remote Sensing.
Easton Glacier has limited snowpack with two months left in the melt season in 2021. Dots indicate the firn line.
The next warm weather event was the Pacific Northwest record heat in late June 2021, setting all-time records across the region. Thompson et al (2022). comparison of daily summer maximum temperaturesthat were 3.6 SDs from the mean.. This heat wave quickly melted away much of the winter snowpack on many glaciers. The heat wave and ensuing warmth stripped the snowcover from glaciers right to the summit on the highest mountains from Mount Shasta, California to Mount Baker, Washington by mid- August exposing the dirtier ice that lies underneath the snow and melts more rapidly than snow under the same weather conditions, to the summit of these mountains. The led to increased discharge in glacier fed streams, while non-glacier fed streams in the region had significant declines in discharge. For the Nooksack River heat waves generate a 24% increase in discharge in the glaciated North Fork and a 20% decline in the unglaciated South Fork (Pelto et al 2022). For water temperature the mean increase was 0.7 °C (±0.4 °C) in the North Fork and 2.1 °C (±1.2 °C) in the South Fork (Pelto et al 2022). The resulting volume loss during the summer season has been the highest we have observed in our 38 years of monitoring North Cascade glaciers. We observed stunted alpine plant growth, experienced days of smoky air limiting visibility and had to navigate and measure more open crevasses than usual.
Whitney Glacier on Mount Shasta in 2021 Sentinel Images.
Jackson and Blackfoot Glacier in early September Sentinel 2 false color images. Point A indicates exposed ice showing annual layers. Point B indicates exposed firn that had been retained through previous summers. The gray color of the firn indicates how dirty it is and that its albedo would enhance melting.
Mount Shasta in California fared even worse, losing all snow cover on its glaciers by September 6. The largest glacier on the mountain and in California, Whitney Glacier, began to separate. In all, the glaciers there had lost 50 percent of their area and volume this century, including ~10-15 percent this summer, and had fragmented from 6 into 17 glacier pieces (Patel, Washington Post, 2021).
The summer of 2022 in the Central Andes of Argentina and Chile glaciers experience a near total loss of snowpack in January due to early summer warmth, leading to dirty/dark glaciers. The darker surfaces of the glacier melt faster leading to more rapid area and volume loss. This includes fragmentation and rapid expansion of bedrock areas amidst the glacier. The snow free conditions lasted until the end of March, extending the impact from the January observations emphasizing that this was a regional issue this summer with snowpack lost from Bajo del Plomo Glacier, Cortaderal Glacier, Palomo Glacier,Volcan Overo Glaciers,Volcan San Jose Glaciers , Cobre Glacier and Olivares Beta and Gamma Glaciers across the Central Andes of Chile and Argentina.
Volcan San Jose glaciers in Feb. 17, 2022 Sentinel image. This highlights just how dirty the ice surface is and how limited the retained snowcover is.
Cobre Glacier, Argentina in false color Sentinel 2 images from Jnauary 13, 2022 and March 16, 2022. Note the expansion of bedrock area amidst the glacier at Point A, glacier fragmenting at Point B and Point C.
Volcan Overo in Sentinel image continues to fragment with no retained snowcover this summer, and bedrock expansion at Point A.
Sentinel images the loss of all snowcover on Sollipulli Glacier that continued from January until at least March 13 2022. Note the annual layers preserved in the glacier ice now exposed at the surface.
Langjokulen (La), Kvitisen (Kv), Bergfonna (Be) and Blaisen (Bl) ice caps on Edgeøya in Sentinel image from 8-20-2022 illustrating the lack of snowcover, limited firn areas and numerous annual layers. This pattern of annual layers due to glaciers being stripped of snow cover is becoming increasingly frequent. Note Andes last winter and Pacific Northwest summer 2021.
During the summer of 2022 Svalbard experienced an extended heat wave in August that led to loss of snowpack on a number of ice caps on Edgeoya.
Rapid snowcover loss on Rhone Glacier early in summer of 2022 in Sentinel images
The European Alps were hard hit in the summer of 2022 experiencing their most negative balances observed during the 70 years of observations.
In the summer of 2023 central Andean glaciers lost snowcover during the February heat waves.
Volcan Overo, Argentina with expanding lakes, blue arrows and fragmenting at yellow arrows.
Sollipulli Glacier lost snowcover in February 2023
The bottom line is that glaciers are simply not compatible with recurring heat waves and the intensity and frequency of these is increasing. This is true from Arctic Canada to the Himalayas from the Andes to Antarctica. This year, for the 34th consecutive year, Alpine glacier volume in the world will decline; their business model is not sustainable with our climate.
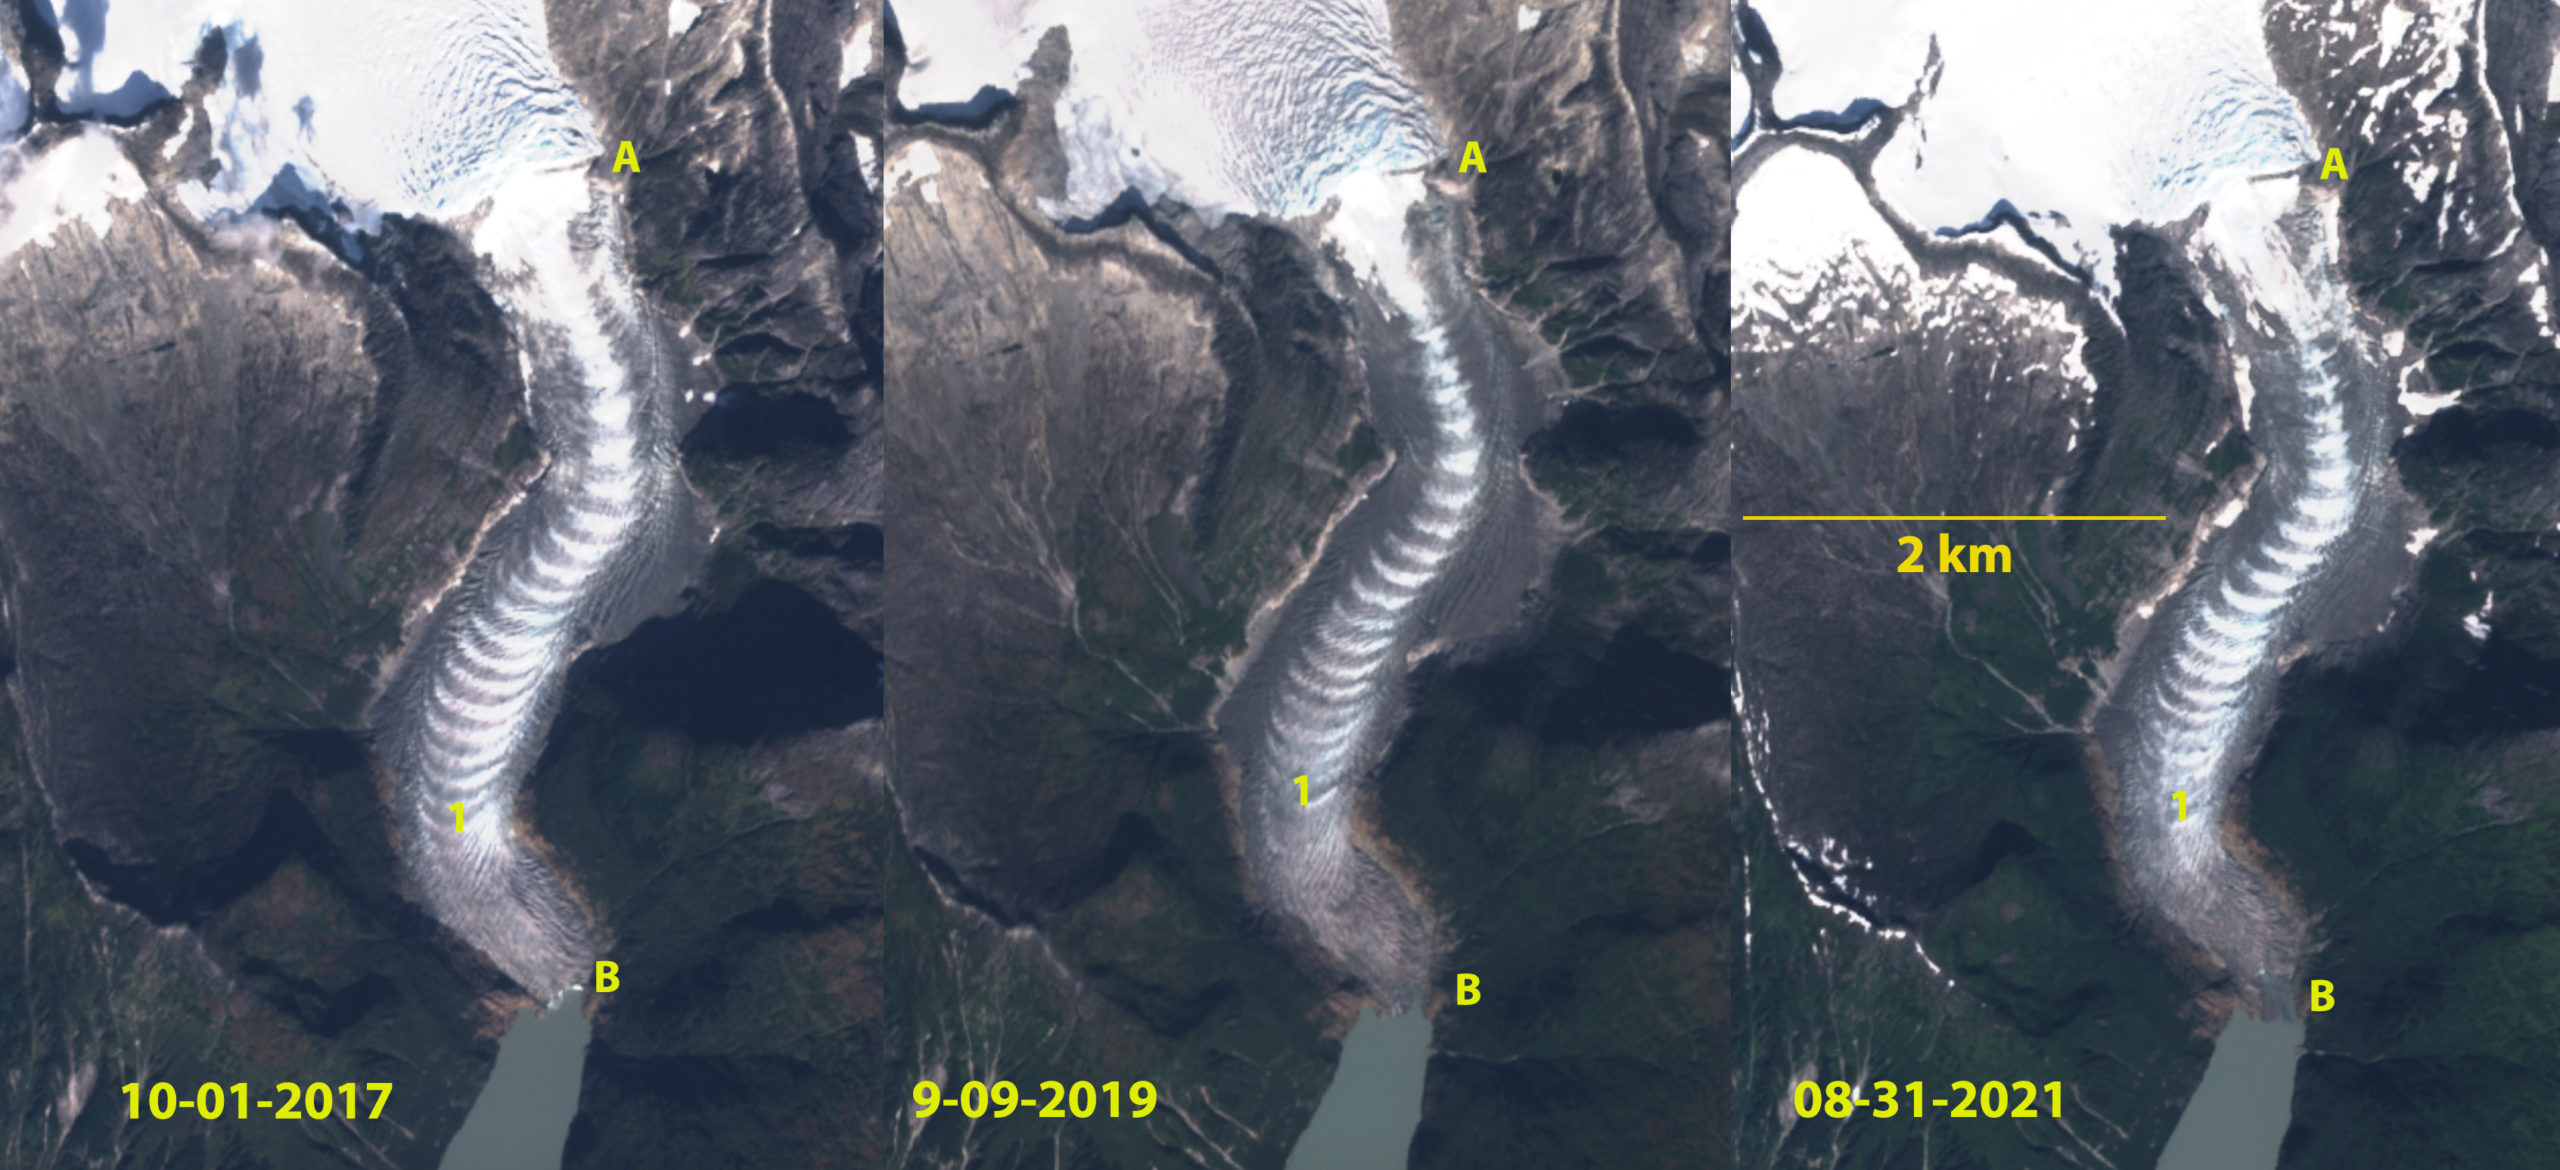
East Twin Glacier in Sentinel 2 images from 2017, 2019 and 2021. Point A marks the threshold, B the terminus contact with lake in 2017, Point 1 is the first ogive above the terminus.
East Twin Glacier is a narrow valley outlet glacier from the Juneau Icefield. The glacier descends from the icefield through an icefall at 975 m- 600 m that generate ogives at the icefall base. The extensive crevassing begins at 975 m with a threshold at 900 m. Davies et al (2022) examination of the Juneau Icefield found 63 glaciers had disappeared since a 2005 inventory, with a 10% reduction of glacier area. This study noted the importance of glacier disconnections occurring which separates the accumulation and ablation zones, leading to stagnation of the glacier segment below. We found 176 such disconnections in the outlet and valley glaciers of the Juneau Icefield Davies et al (2022). The focus of this post is on the development of a disconnection on the main stem of the East Twin Glacier.
In 1984 I had a chance to complete mass balance observations on the glacier. The terminus in the lake was 600 m wide, and the threshold at 900 m was also 600 m wide in 1984. The glacier retreated 900 m from 1984 to 2015 (Pelto, 2017). The terminus has calved into Twin Lake for over a century, but by 2015 the width of the terminus calving into the lake has declined by 75% since 1984, to 150 m. In 2017 there is still a very narrow steepened calving front. By 2019 the terminus no longer has a calving front, but was in contact with the lake. By 2021 the glacier terminates 200 m from the lake on the west side and 100 m from the lake on the east side. The total retreat from 1984-2021 is 650 m. In 2018 the snowline reached ~1250 m, 300 m higher than the long term average. In 2019 the snowline again reached this level. The result is an accelerated reduction in accumulation flowing towards the top of the icefall, along with glacier thinning at the threshold, which enables the disconnection to rapidly develop. The high snowline elevations and exceptional melt in 2018 and 2019 helped to further narrow the glacier at the threshold to 240 m in 2021. The bedrock threshold is quickly cutting across the glacier, this is limiting flow through the icefall and may have shut off the production of new ogives.
The declining mass balance of the Juneau Icefield indicated by the high snowlines is driving thinning, disconnections and retreat (Pelto 2019).
East Twin Glacier in 2018 and 2019 the highest snowlines since observations began on the Juneau Icefield in 2018. Snowline is the purple dots at 1250-1275 m, well above the threshold at Point A which had just below the mean 950 m snow line position from 1946-2000.
East Twin Glacier terminus change from 1984-2021 in Landsat images. Red arrow is the 1984 terminus, yellow arrow the 2021 terminus.
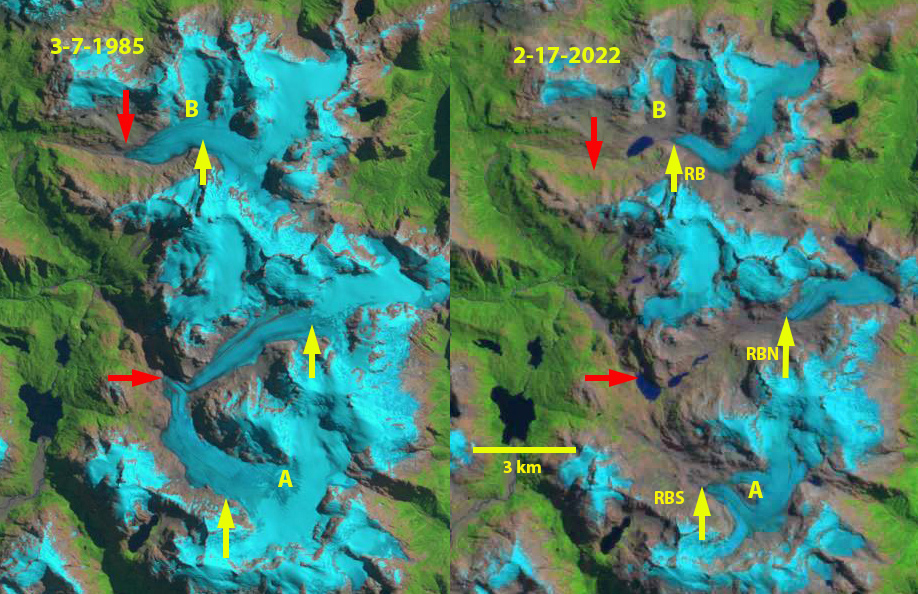
Rio Blanco Glaciers in Hornopirén Naitonal Park, Chile in Landsat 5 and 9 images from 1985 and 2022. Red arrows indicate 1985 terminus position, yellow arrows 2022 terminus position. Point A is an emerging bedrock nunatak and Point B is where tributary separation has occurred.
Hornopirén National Park is in the Los Lagos region of Chile. The park is host to a number of glaciers that are in rapid retreat. Davies and Glasser (2012) mapped the area of these glaciers with 113 km2 in 1986 and 96 km2 in 2011. The retreat of the largest glaciers in the park is spectacular in recent years.Barcaza et al (2017) indicate that Inexplorado glaciers have lost 0.46-0,48 km2 from 2003-2015. Here we examine Landsat imagery to identify changes in three of the larger valley glaciers from 1985-2022. These glaciers from the headwaters of the Rio Blanco and are designated Inexplorado (RB), Rio Blanco North (RBN), Rio Blanco South (RBS). Rio Blanco enters the ocean just east of the community of Hornopirén.
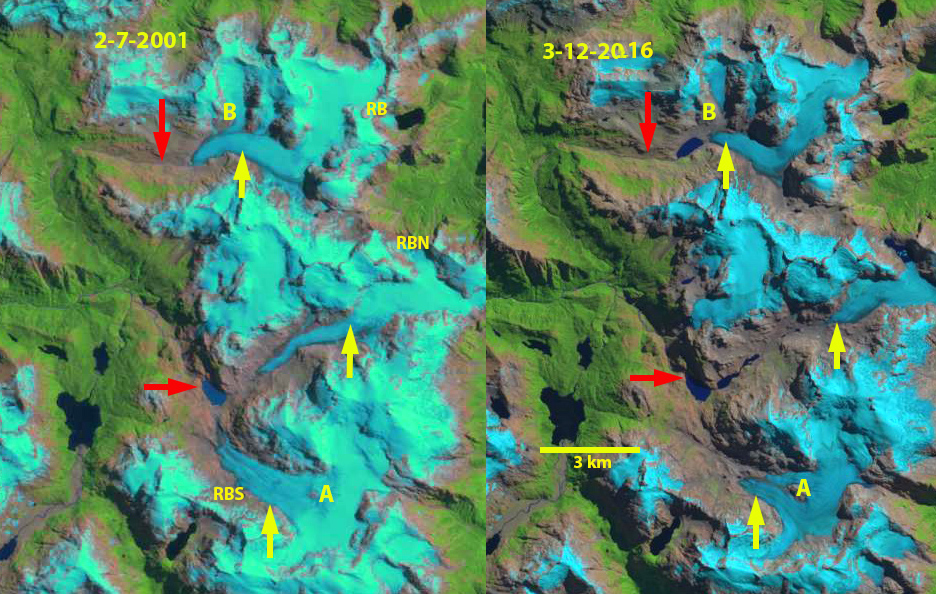
In 1985 the 8 km long RBN and RBS glaciers merged just above the terminus at 820 m, red arrow. In 1985 Inexplorado (RB) was a 7.5 km long glacier terminating at The snowline was at 1300 m. By 2001 RBN and RBS had separated by ~1 km with the formation of a new lake at the former terminus. RBS is developing a nunatak at Point A. Inexplorado had retreated 1 km with a proglacial lake just beginning to develop at the terminus, while the northern tributary at Point B is still feeding the main glacier. By 2016 the retreat of RBN has led to the development of three new alpine lakes in the deglaciated valley. By 2016 RBS thinning and retreat has led to the Point A nunatak in the lower section of RBS becoming a significant bedrock exposure. In 2016 The retreat of Inexplorado has led to the formation of a nearly 0.9 km long proglacial lake and the former northern tributary at Point B has separated. By 2022 RBN has retreated 4.8 km losing 60% of its length since 1985, it has detached from the accumulation and the eastern margin has two lobes now terminating in proglacaial lakes. RBS has retreated 4 km, losing 45% of its length since 1985. Point A is beginning to merge with terminus and the main terminus is likely retreating into a new lake basin. Both RBS and RBN terminate at ~1200 m. Inexplorado has retreated 2.3 km since 1985, 30% of its length, and is still 5.3 km long, terminating at ~1300 m, A new lake basin will likely form between the current terminus and the base of the cefall 1.5 km upglacier of the terminus. The snowline in 2015, 2016 and 2022 was at 1600-1700 m. This leaves only a small percentage of the glacier area above the snowline. The large valley glaciers that just 30 years dominated the headwaters of Rio Blanco have lost ~50% of their length and area and will soon be small slope glaciers clinging to the highest peaks. Retreat here is more extensive than seen 100 km to the northwest at Calbuco Volcano or to the south at the Quelat Glacier Complex.
Rio Blanco Glaciers in Hornopirén Naitonal Park, Chile in Landsat 7 and 8 images from 2001 and 2016. Red arrows indicate 1985 terminus position, yellow arrows 2022 terminus position. Point A is an emerging bedrock nunatak and Point B is where tributary separation has occurred.
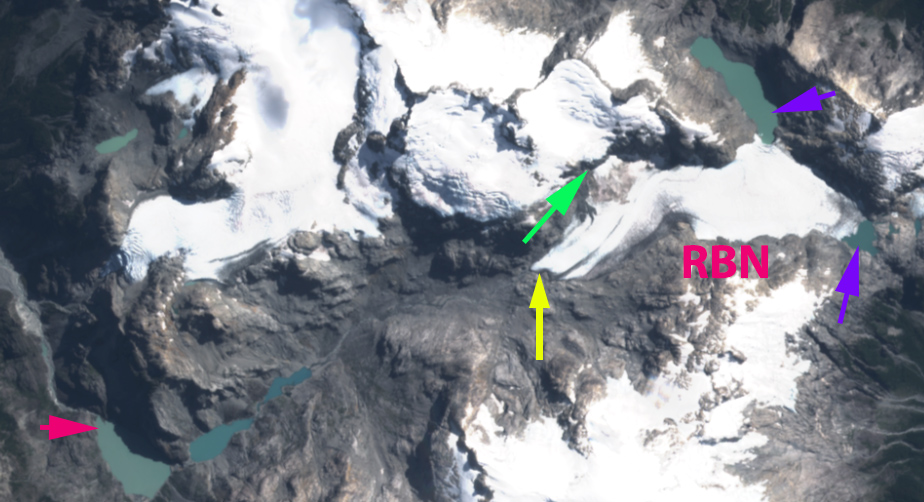
The Rio Blanco North Glacier in March 2022 Sentinel image indicating the two proglacial lakes on eastern margin, purple arrows, the detachment at the green arrow, 1985 terminus locaiton red arrow and 2022 terminus location yellow arrow.
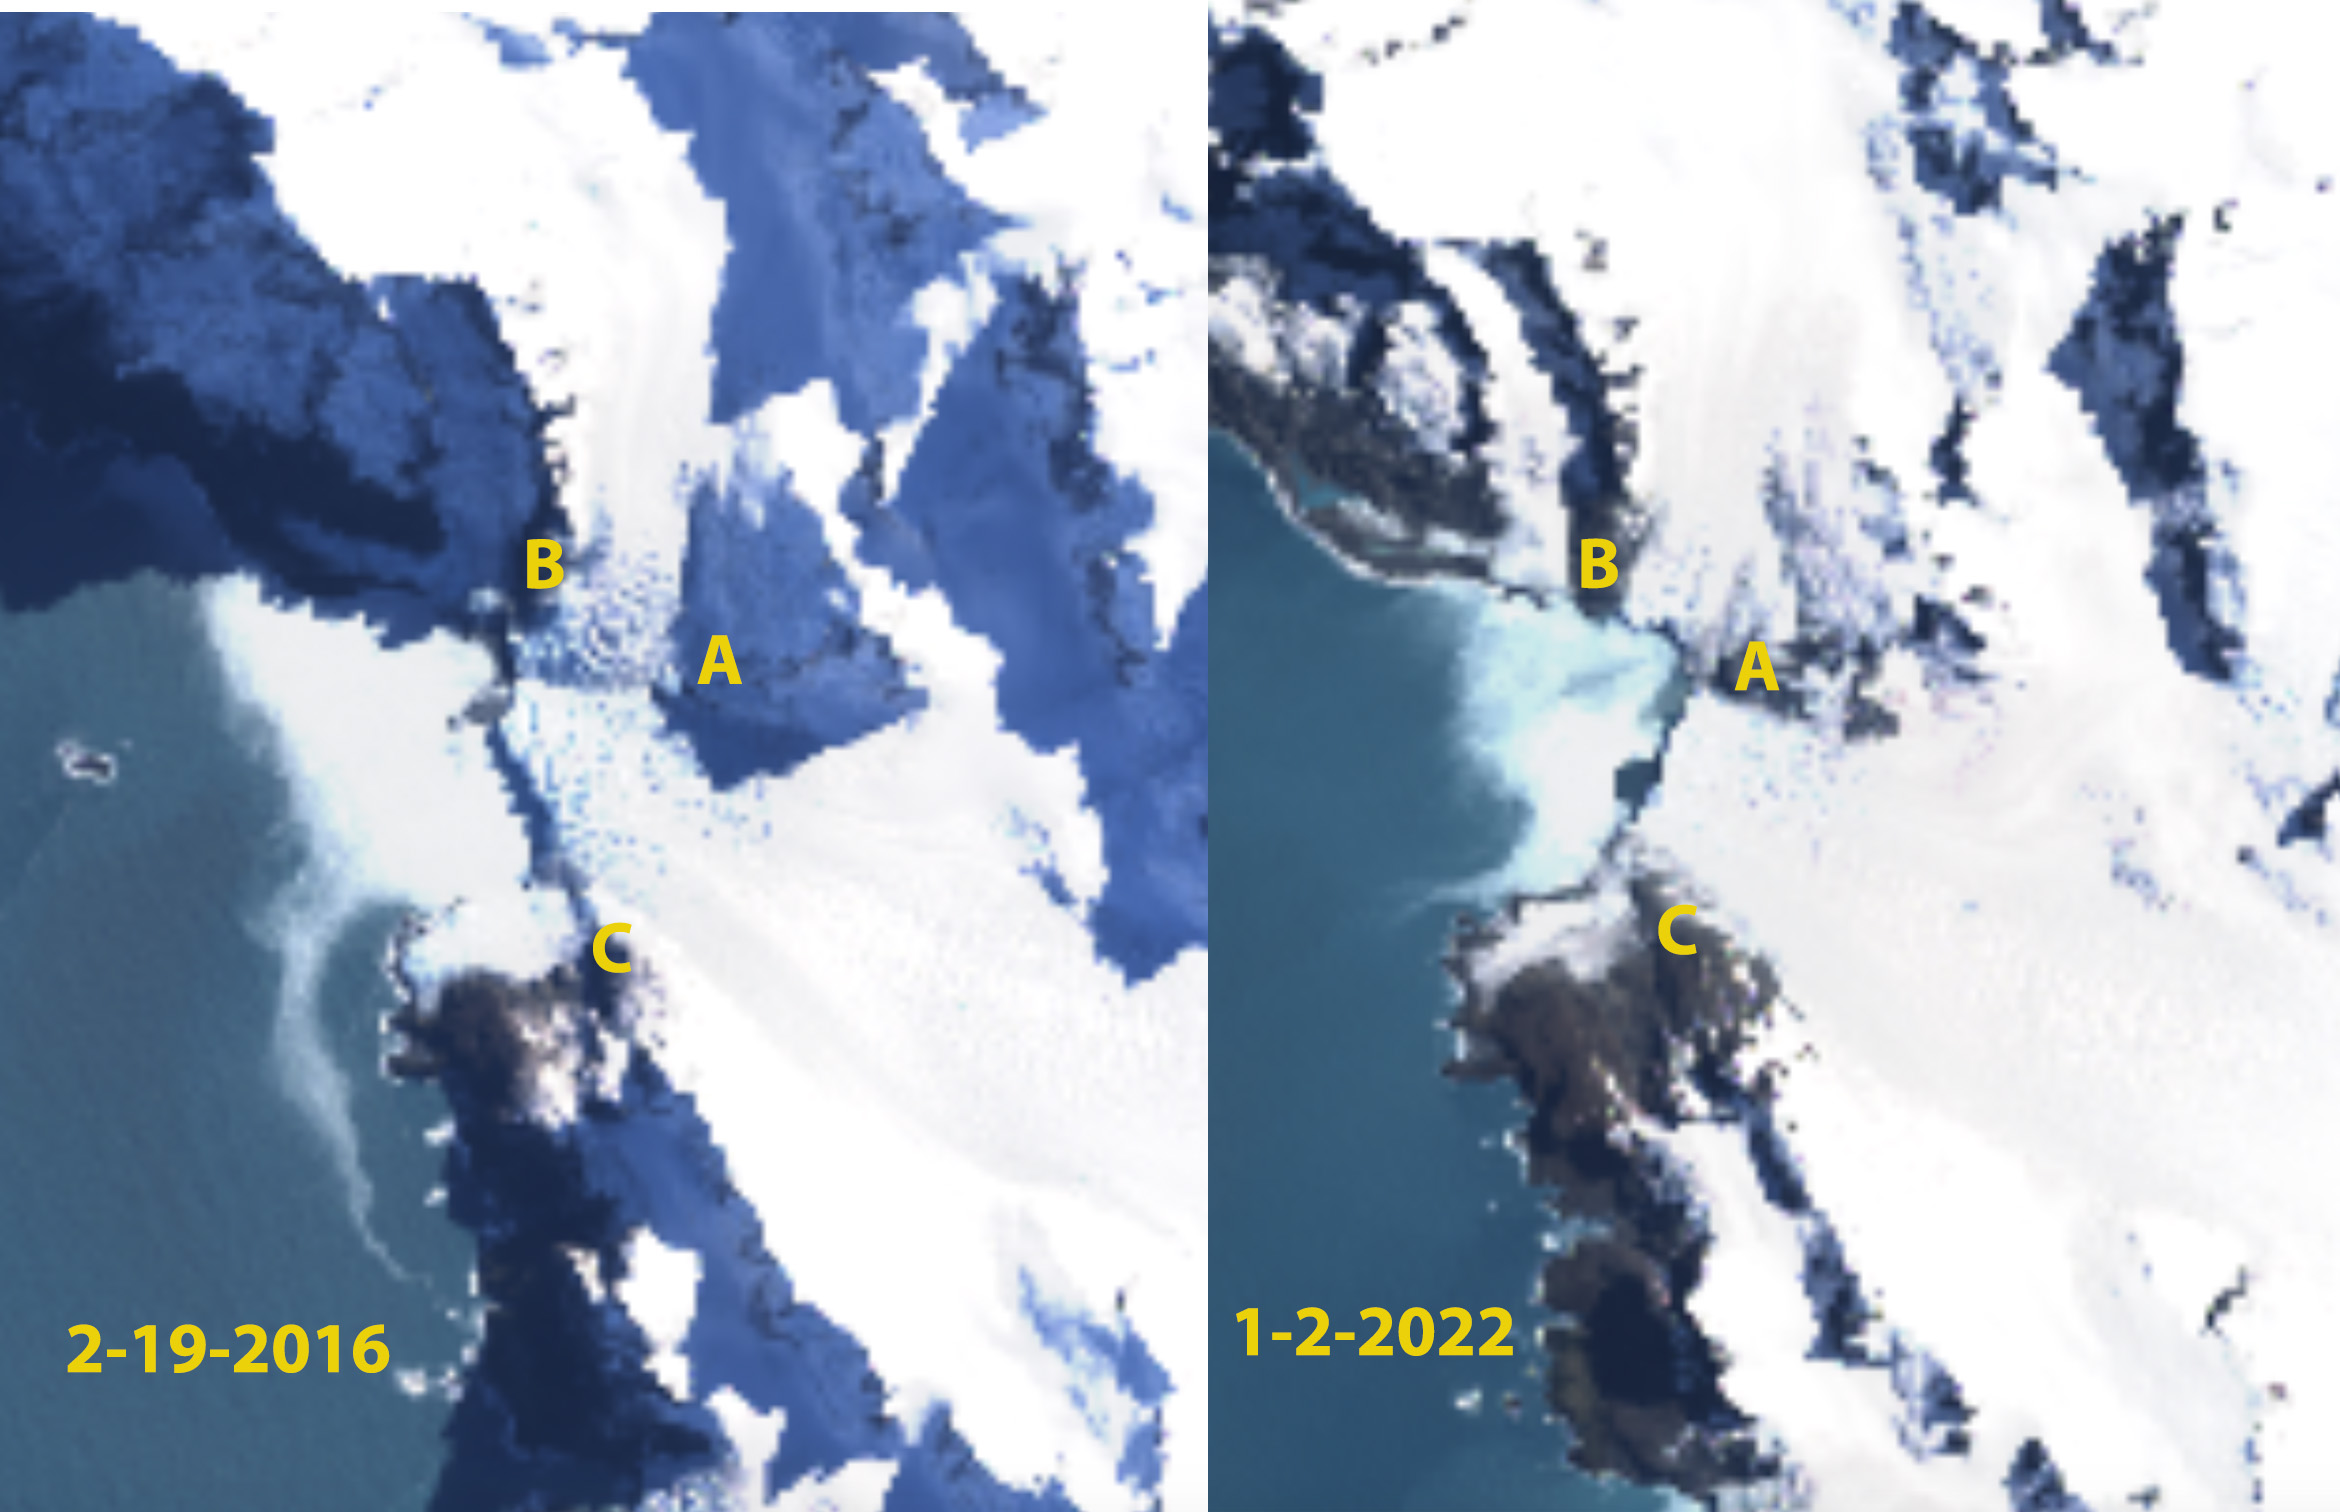
Novosilski Glacier in Landsat images from 2020 and 2022. Note the retreat near Point A in particular. The terminus that extended from Point B-C developed an embayment reaching Point A.
Novosilski Glacier is a large tidewater outlet glacier on the west (cloudier) coast of South Georgia terminating in Novosilski Bay It shares a divide with the rapidly retreating Ross and Hindle Glacier on the east coast. Gordon et al. (2008) observed that larger tidewater and calving outlet glaciers generally remained in relatively advanced positions from the 1950’s until the 1980s. After 1980 most glaciers receded; some of these retreats have been dramatic, such as at Neumayer Glacier. The west coast has featured much less retreat than the east coast. The change in glacier termini position have been documented by Cook et al (2010) at British Antarctic Survey in a BAS retreat map, identified that 212 of the Peninsula’s 244 marine glaciers have retreated over the past 50 years and rates of retreat are increasing. Pelto (2017) documented the retreat of 11 of these glaciers during the 1989-2015 period. NASA Earth piggy backed on the retreat of some east coast glaciers seen in Landsat images.
Novosilski Glacier in Landsat images from 2003 and 2022. Note the retreat from Point D in 2003 to Point A in 2022 ed from Point B-C developed an embayment reaching Point A.
In 2003 Novosilski Glacier terminated in shallow water just east of a small island that acted as a pinning point, Point D. By 2009 the glacier had retreated only a minor amount from this island into deeper water. A rapid retreat ensued and by 2016 the glacier had retreated into a narrower fjord reach. The north and south margins featured remnant ice that was based above tidewater, Point B and C. By 2016 the 2 km wide calving front had retreated 2.5 km from the 2003 position. There was no significant retreat from 2016 to 2020. By March of 2022 the glacier has retreated 1 km in the glacier center further leading to separation of the glacier into a northern and southern arm separated by the the Point A rock rib. The retreat also has led to a 6 km2 expansion of Novosilski Bay. The glacier slope at the terminus is steep and active, suggesting retreat may slow again.
Novosilski Glacier in Landsat images from 2016 and 2022. Note the retreat near Point A in particular. The terminus that extended from Point B-C developed an embayment reaching Point A.
Volcan Overo in Sentinel image continues to fragment with no retained snowcover this summer, and bedrock expansion at Point A.
For an alpine glacier to survive it must remain mostly snowcovered throughout the year, even at the end of the summer. This is one reason for the majesty of glaciated mountains, they shine brightly even in summer. This year in the Central Andes of Argentina and Chile I have chronicled the near total loss of snowpack in January due to early summer warmth, leading to dirty/dark glaciers. This is a similar story to what we saw in the Pacific Northwest last summer. Here is an update at the end of the summer using Sentinel imagery to highlight that these glaciers have remained largely bare for two months. The darker surfaces of the glacier melt faster leading to more rapid area and volume loss. This includes fragmentation and rapid expansion of bedrock areas amidst the glacier. Earlier observations indicate this is a regional issue this summer with snowpack lost from Bajo del Plomo Glacier, Cortaderal Glacier, Palomo Glacier,Volcan Overo Glaciers,Volcan San Jose Glaciers , Cobre Glacier and Olivares Beta and Gamma Glaciers across the Central Andes of Chile and Argentina
Cortaderal Glacier in Sentinel image with no retained snowcover this summer, and bedrock expansion at Point A.
Volcan San Jose Glaciers in Sentinel image continues to fragment with ~5% retained snowcover this summer, and bedrock expansion at Point A.
Las Vacas Glaciers in Sentinel image continues to fragment with no retained snowcover this summer, and bedrock expansion at Point A.
Olivares Beta and Gamma Glacier in Sentinel image with no retained snowcover this summer, retreating away from proglacial lakes and bedrock expansion at Point A.
Bajo del Plomo Glacier in Sentinel image with no retained snowcover this summer, and rapid bedrock expansion at Point A.
Palomo Glacier in Sentinel image with no retained snowcover this summer, and bedrock expansion at Point A.
Volcan Peteroa Glacier in Sentinel image continues to fragment with ~2% retained snowcover this summer, and bedrock expansion at Point A.
Pashleth Glacier in 1987 Landsat and 2021 Sentinel image. Red arrow is 1987 terminus location, yellow arrow 2021 terminus location. Point B-D mark locations where separation has or is occurring along the main glacier and Point A on the western arm.
Pashleth Glacier, British Columbia drains into Pashleth Creek a tributary to the Machmell River, Owikeno Lake and then River Inlet on the British Columbia Coast. Here we examine the glacier retreat and fragmentation that has occurred from 1987-2022. The Machmell River is an important salmon spawning area in its lowest 20 km, particularly for sockeye, with chinook, coho, pink and chum salmon up to the cascades just downstream of junction with Pashleth Creek (Hillaby, 1998). The Rivers Inlet fjord had the third largest run in the province with annual returns of up to 3.1 million sockeye from 1948 to 1992 (Hakai, 2021). The Rivers Inlet sockeye stock has recently received much attention because of a dramatic decline in total abundance from the with an estimated 94% decline in sockeye salmon equilibrium population size (from 3,115,000 to 200,000) hitting a low of under 10,000 in 1999 (Adams et al 2021). In the 1980’s Machmell River escapement numbers averaged 20,000, dropping to 5000 in the 1990’s (Rutherford et al 1998). Harvest rates were reduced in the 1980’s and the commercial fishery closed in 1996. The commercial fishery has remained closed since 1996, with a small amount of fishing permitted by the Wuikinuxv First Nation maintain a modest food, social, and ceremonial harvest. The Rivers Inlet sockeye salmon stock has experienced limited recovery consistently exceeding ~100,00o, and averaging ~250,000 in the last two decades (Adams et al 2021). The study also examined the decline in grizzly bear population and the connection to salmon decline. They observed grizzly bear diet finding the percentage of the diet from salmon declined from ~70% pre-collapse to 23% in the 1990’s and rebounding today with fewer grizzly bears to 64%.
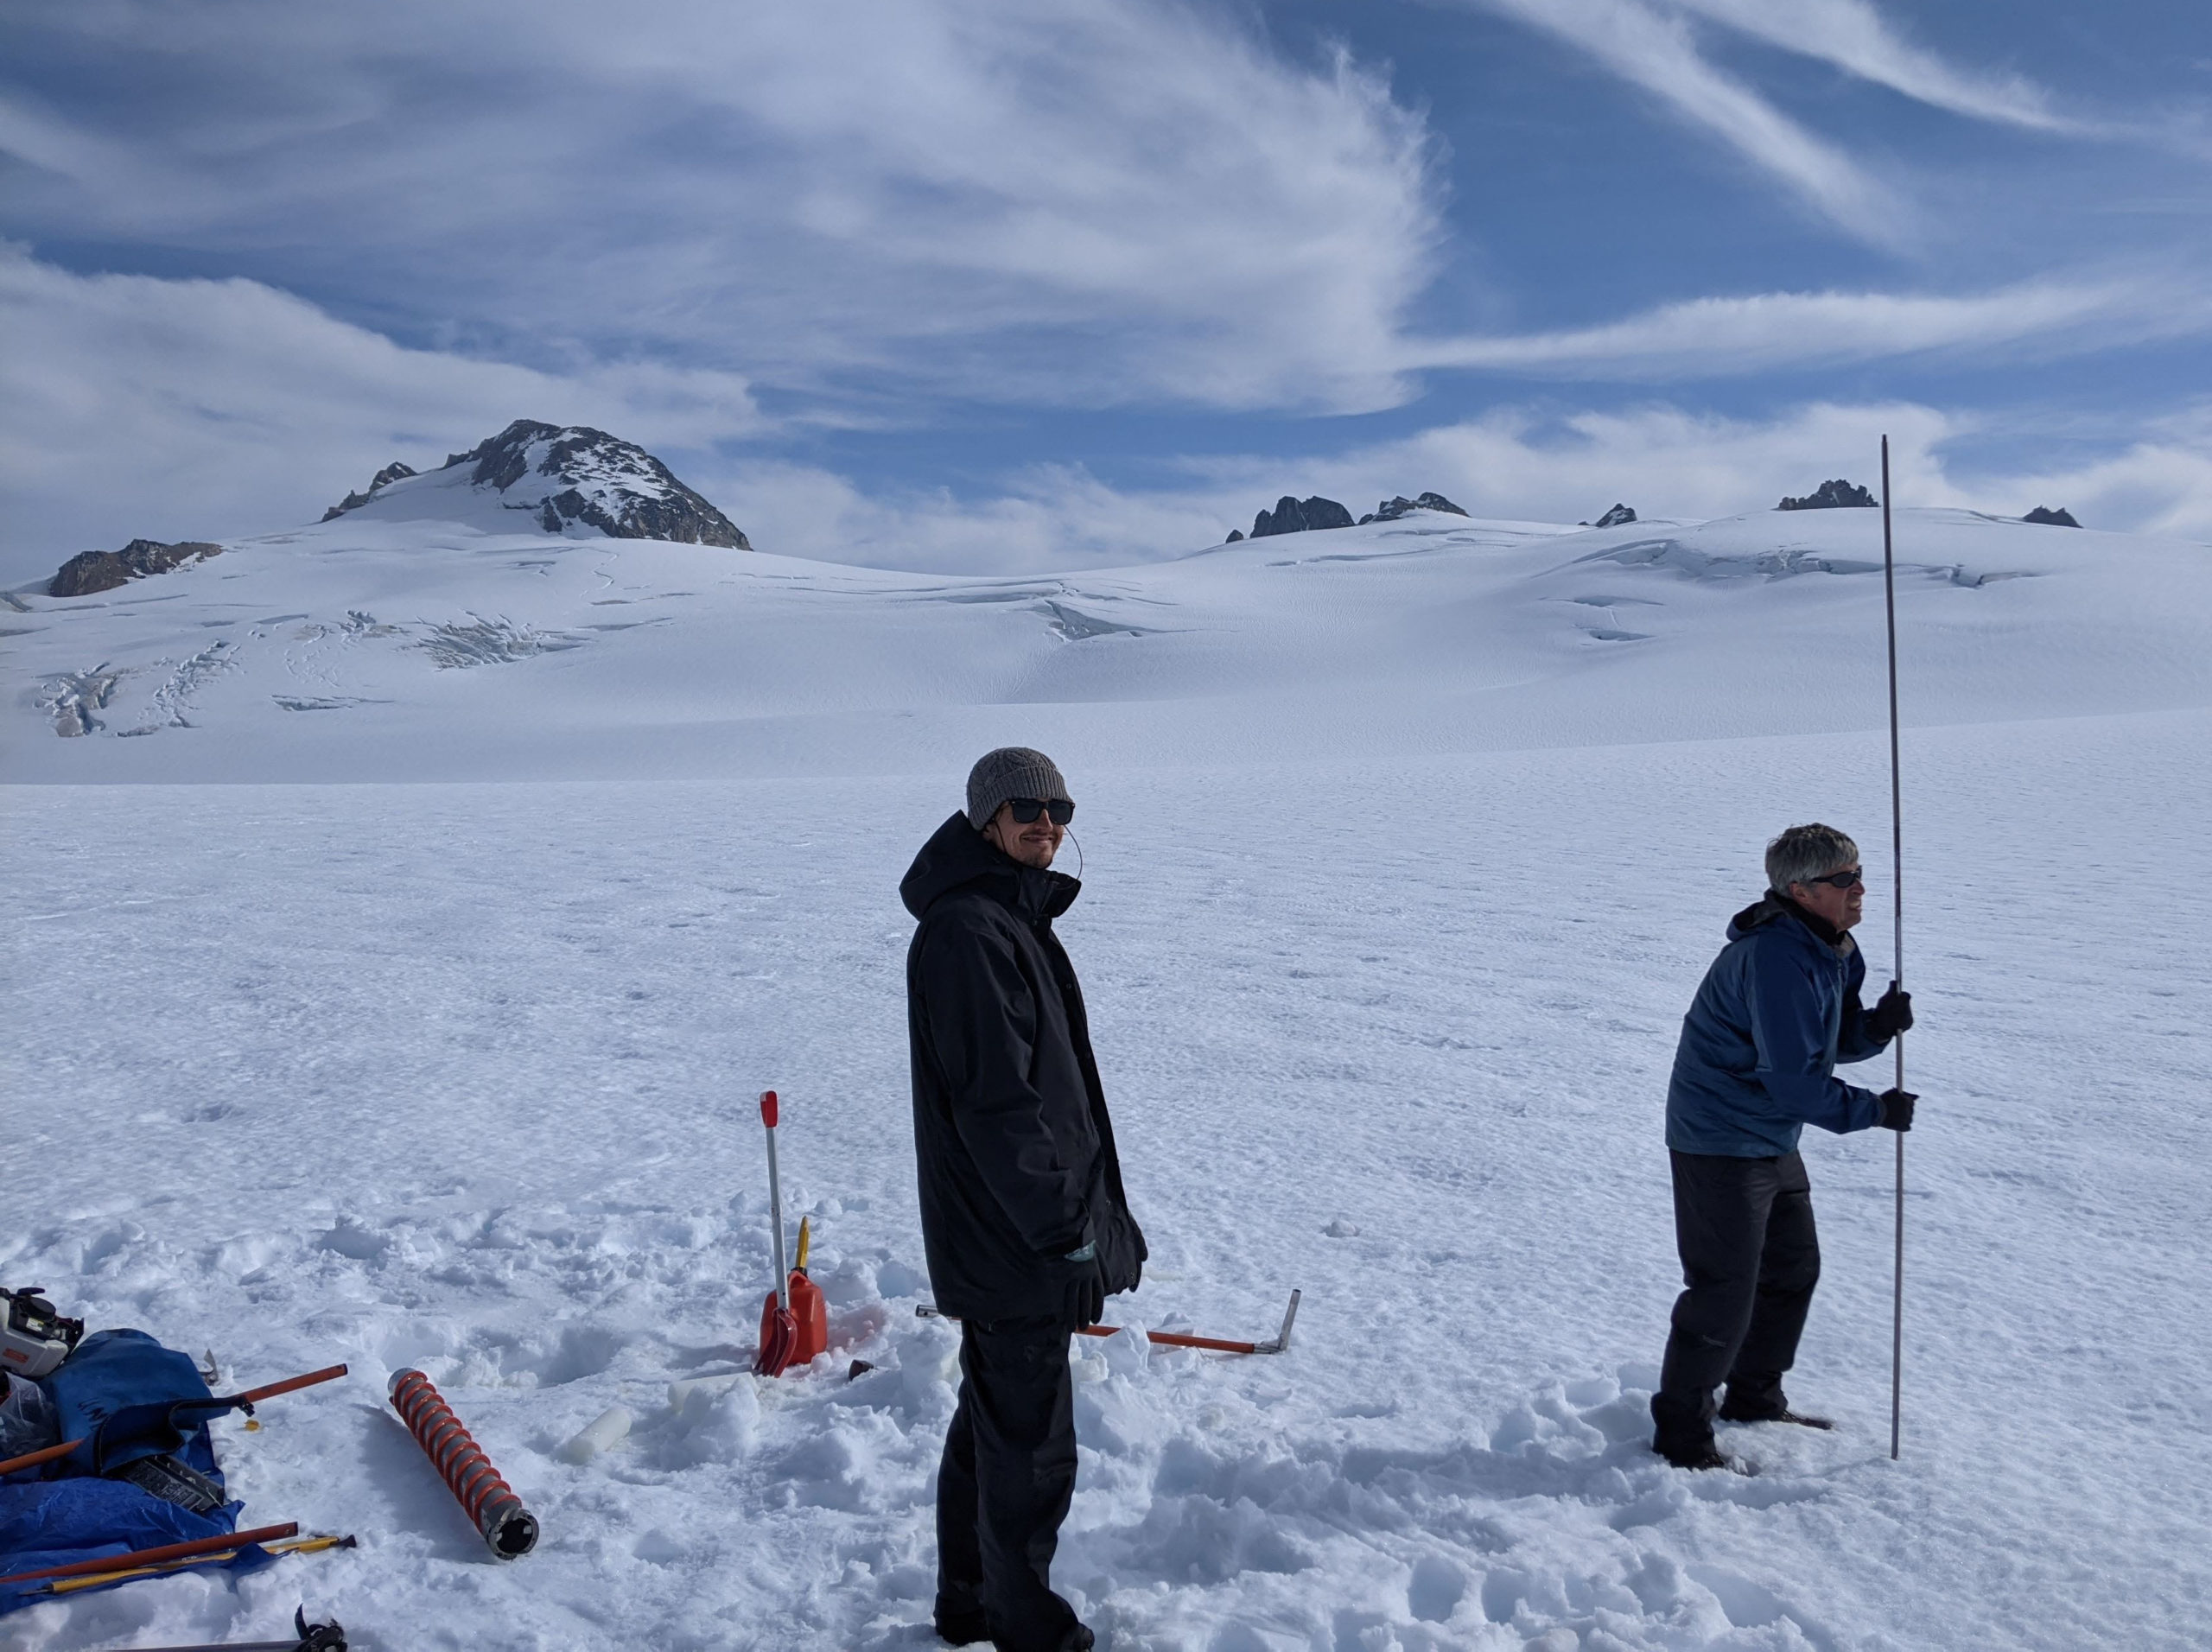
In 1987 Pashleth Glaciers main terminus was at 1000 m and the west terminus at 1100 m, with the snowline at 1700 m. By 2000 significant retreat has occurred and tributaries at Point A-D are all feeding the main glacier. The snowline is at 1800 m in 2000. In 2014 tributaries A-D are still feeding the main glacier. The snowline is at 2000 m in 2014. In 2020 Brian Menounos and Ben Pelto (UNBC) visited the accumulation area of this glacier at 2300 m and found 4.2 m of snow remaining, see below. This area has retained accumulation each and every year. In 2021 tributaries at Point A and B have separated from the main glacier, while the tributary at Point C is on the verge of separation, likely will happen in 2022. At Point D this region is developing a rock rib that indicates contribution from this small triburary is limited and will cease in the near future. The snowline in late August is at 1950 m. The main terminus has retreated 1250 m from 1987-2021 and the west arm 1700 m.
Pashleth Glacier is a large glacier that will continue to supply a large magnitude of summer glacier runoff. The challenge for the salmon will continue to be in the ocean. The neighboring Klippi Glacier retreated 1400 m from 1987-2016, with the two main branches having separated and also feeds the Machmal River. Draining the same icefield to the south Klinaklini Glacier is also rapidly retreating (The Tyee, 2021).
Pashleth Glacier in 1987 and 2014 Landsat image Red arrow is 1987 terminus location, yellow arrow 2021 terminus location. Point B-D mark locations where separation has or is occurring along the main glacier and Point A on the western arm.
Brain Menounos, UNBC probing snowpack on the upper glacier. Searching for a potential measurement station high on the glacier (Image from Ben Pelto).
Crevasse stratigraphy indicates the depth of retained accumulation on upper glacier ( (Image from Ben Pelto)
Cobre Glacier, Argentina in false color Sentinel 2 images from Jnauary 13, 2022 and March 16, 2022. Note the expansion of bedrock area amidst the glacier at Point A, glacier fragmenting at Point B and Point C.
Cobre Glacier drains east from Cerro Orejas a 3949 m peak on the Chile-Argentina border and discharges into the Rio Tordillo. The summer of 2022 has been a difficult season for glaciers in the Central Andes of Chile and Argentina as has been observed with early snowpack loss on Bajo del Plomo Glacier, Cortaderal Glacier, Palomo Glacier,Volcan Overo Glacier and Olivares Beta and Gamma Glaciers. Here we can utilize Sentinel 2 satellite imagery to observe the retreat from 2016-2022 and the area losses apparent during the summer of 2022.
In March 2016 Cobre Glacier terminated on the northern shore of a proglacial lake at ~3000m. By March 2022 the glacier had retreated 700 m from the lake in just six years. During this period thinning of the glacier had narrowed the connections at Point A-C, while a new lake basin is evolving at Point D. Early summer warmth led to a rapid loss of snowpack on Cobre Glacier in 2022. By January 13, 2022 ~5% of the glacier had small pockets of snowcover above 3800 m. Bare ice glacier surfaces melt more rapidly than snow covered surfaces. After over two months of bare ice ablation the small areas of emergent bedrock on January 13, near Point A have enlarged and merged with the margin of the glacier by March 16. At Point B a small ice cap is separating from the main glacier. At Point C a narrow tongue of ice that had connected the main glacier to a small terminus segment has been severed. At Point D margin retreat is leading to expansion of the proglacial lake along the margin of the glacier. In just two summer months the impact of a single warm summer is evident on Cobre Glacier. It is also evident that with no persistent accumulation zone this glacier cannot survive current climate( Pelto, 2010). Dussaillant et al (2019) identified slower mass loss -0.28 m/year in this region from 2000-2018, than further south in the Patagonia Andes or north in the Tropical Andes. In 2022 the Central Andes are experiencing a rapid loss.
Cobre Glacier in Sentinel 2 images from March 2016 and March 2022. Illustrating retreat from 2016 terminus (red arrow) to 2022 terminus (yellow arrow). Fragmentation of the glacier underway at Point A-C is evident. A new evolving lake is at Point D.
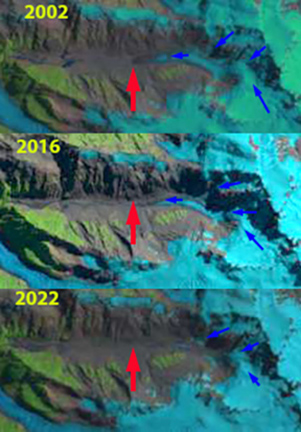
Victoria Glacier in Sentinel images from February 2017 and February 2022. Red arrow is 2002 terminus location, yellow arrow marks 2022 debris cover take over and beginning of stagnating ice region. Point C is lowest point of clean ice in 2017 and just above terminus in 2022. Point A, B and D are icefalls where detachment is underway.
Victoria Glacier in New Zealand’s Southern Alps is the westward draining valley glacier between Fox and Franz Josef Glacier. Victoria Glacier has limited terminus observations over the last 25 years indicating a stationary terminus position from 1998-20o1, retreat in 2005, advance in 2008 and 2009, stationary position 2010-2013 and retreat from 2014-2017 (WGMS, 2021). Here Landsat and Sentinel imagery are used to explore changes to this glacier from 2002-2022. Chinn and Chinn (2020) reported a 3.7 m/year rise in the mean New Zealand end of summer snowline on glaciers over the last 40 years, which is driving mass loss and retreat of glaciers across the range. Baumann et al (2020) provide an inventory of NZ glaciers noting that most of the glacier tongues below 1000 m are debris covered including several that are detached and a 21% decrease in area was noted for the 1978-2016.
In 2002 the glacier extends 2.3 km downvalley from the base of the Icefall at Point A. The active ice front marking the terminus is at 1150 m and clean ice begins 300 m upglacier from the terminus. In 2017 following first a period of advance and retreat the terminus has retreated ~100 m since 2002, clean ice begins 400 m from the terminus, at Point C .The width of the clean ice area is reduced from 2002. In 2017 there is active crevassing in the icefalls at Point and D extending to the valley trunk below. At Point B there is a clean ice connection in 2017, but not active crevassing to the base of the icefall. From 2017-2022 rapid downwasting of the terminus tongue resulted in a 500 m retreat of the active ice front, which is near Point C. There is only small patch of clean ice in the last 1 km of the glacier. Crevassing in the icefalls at Point B and D no longer extends all the way to the valley trunk of the glacier. At the yellow arrow is both where debris cover dominates in 2022, but also marks the beginning of a deeply carved surface stream, indicating near stagnation of the glacier in this region. The recent high snowlines observed in the annual end of summer surveys (NIWA, 2018) will lead to continued reduced flux of ice through the icefalls and detachment at Point B and D in the near future.
Victoria Glacier topographic map with flow arrows and specific elevations.
Victoria Glacier in 2002, 2016 and 2022 Landsat images.Red arrow marks 2002 terminus position, blue arrows indicate flow lines.
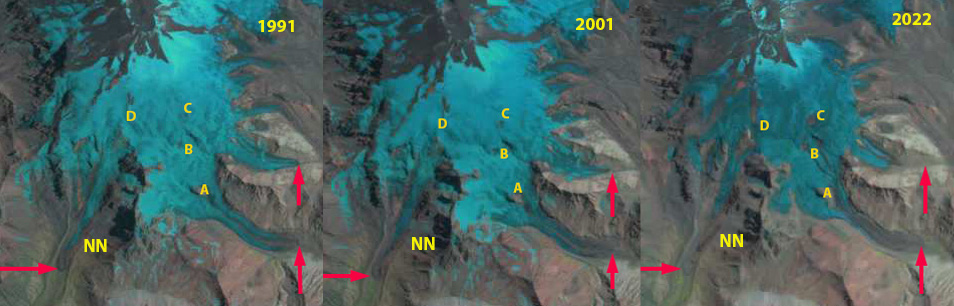
Volcan San Jose, Chile/Argentina Glacier change in Landsat 5-7-9 images from 1991, 2001 and 2022. Red arrows indicate the 1991 terminus location of three glaciers draining from the summit region, including Nieves Negras Glacier (NN). Point A-D are locations of expanding bedrock amidst the glacier. Snowpack very limited in 2022.
Volcan San Jose is a 5850 m glacier draped volcano that straddles the Argentina-Chile border. Here we focus on the glaciers on its souther flank including the Nieves Negras Glacier. Nieves Negras drains into Rio Volcan a tributary of Rio Maipo, while the Argentina terminating glaciers drain into Rio Salinillas. Ayala et al (2020) examined glacier change from 1955–2016 in the Rio Maipo Basin and found a decreasing glacier mass balance trend and that glacier volume decreased by 20%. Dussaillant et al (2019) identified slower mass loss -0.28 m/year in this region from 2000-2018, than further south in the Patagonia Andes or north in the Tropical Andes. Here we examine glacier changes from 1991 to 2022 with Landsat imagery and the low snowpack conditions of 2022 with Landsat and Sentinel images.
In 1991 Nieves Negras and the Rio Salinillas headwater glaciers terminated between 3100 and 3200 m. The snowline is at 4500 m, and there is insignificant bedrock exposed at Point B and C. By 2001 limited retreat had occurred, while bedrock exposure is apparent at Point B. The snowline is at 4600 m in 2001. In February of 2022, the glacier has retained less than 10% snowcover, with the snowline at 5200 m. The surface is notably dirty, which has enhanced melting during this summer. Bedrock area at Point A is now 0.25 km2. Bedrock exposed at Point B has now generated two medial moraines. The bedrock exposed at Point C now has an area of 0.1 km2. At Point D there is nearly continuous bedrock extending along the ridge that marks the International boundary and the east margin of Nieves Negras. Glacier retreat of Nieves Negras is 1.7 km, there is stagnant ice below the current terminus. The debris cover obscures the actual terminus of the glacier at the headwaters of Rio Salinillas. While the northern terminus location indicates a retreat of 900 m.