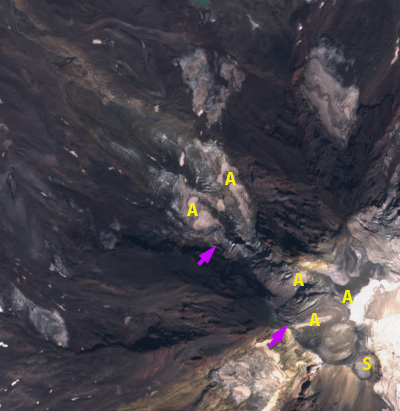
Swanson River glaciers, British Columbia in Landsat images from 1984 and 2019. EM=East Meade Glacier, CG=Canning, red arrows=1984 terminus, yellow arrow=2019 terminus, purple dots=snowline. Points 1-8 are specific glacier locations with very limited to no retained snowcover.
The Swanson River feeds into Tagish Lake in NW British Columbia. The watershed is host to dozens of glaciers. Here we exaine the retreat of the two largest glaciers in the watershed from 1984-2019, referred to as “East Meade” and “Canning Glacier” in this post. We also look at the loss of snowcover on glaciers across the watershed in 2018 and 2019. These glaciers are in the northeast sector of the Juneau Icefield, sharing a divide with the retreating Meade Glacier, Alaska. The Juneau Icefield Research Program focuses on glaciers to the south of these including the retreating Llewellyn Glacier.
In 1984 the two glacier tongues terminated at 1000 m, red arrow and the snowline was at 1350 m, purple dots. This was a year of positive glacier mass balance on the Juneau Icefield, where I was working that summer. By 1998 there has ben modest retreat and the snowline is at 1400-1450 m. The retained snowpack at the end of the summer is limited to the upper reaches of the tributary glaciers. This year was a negative balance year on the Juneau Icefield where I was busy probing snowpack.
By 2018 Canning Glacier had retreated 1400 m since 1984 and terminated at 1100 m. East Meade Glacier had retreated 1100 m since 1984 and terminated at 1100 m. In 2018 there is no retained snowpack on East Meade Glacier. There is limited snowpack at the top of some of the tributaries in wind deposition zones, but many ofthe small alpine glaciers in the area have no accumulation zone. This summer led to the highest snowline ever observed on the Taku Glacier (Pelto, 2019). In 2019 the snowlineis even higher and the glaciers of the Swanson River basin are laid bare. There is no snowpack on East Meade (1) or on the adjacent tributaries at Point 2 and 3. There is no snowpack retained on Canning Glacier (4) or on the alpine glaciers east of the Juneau Icefield at Point 6 and 8. At Point 5 and 7 each has a small patch of retained snowpack at its upper margin close below a peak.
These back to back summers are the type of conditions that lead to the loss of alpine glaciers when they become frequent enough to remove any retained snowpack not just from that year, but from previous years. The retreat of East Meade and Canning Glacier is much less than Meade Glacier, 4 km 1986-2018, and similar to Warm Creek Glacier.
.
Swanson River glaciers, British Columbia in Landsat images from 1998 and 2018. EM=East Meade Glacier, CG=Canning, red arrows=1984 terminus, yellow arrow=2019 terminus, purple dots=snowline.
Canadian Topographic map of the area EM=East Meade Glacier, CG=Canning Glacier and TL=Tagish Lake
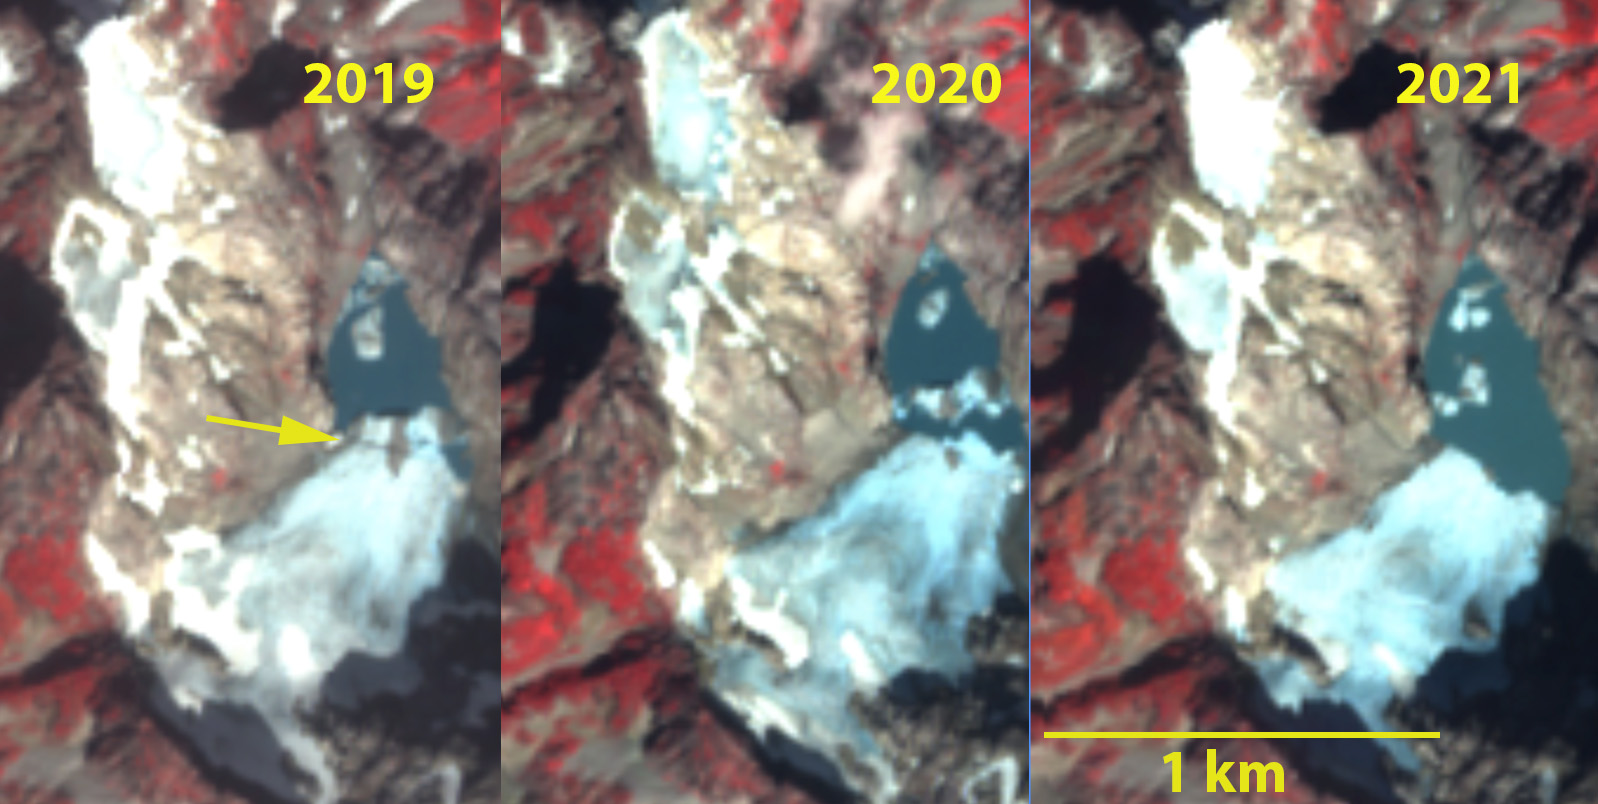
Colonial Glacier in late summer false color Sentinel 2 images from 2019, 2020 and 2021. Yellow arrow indicates step that calves in 2020. Notice the ~10% of snowcover (bright white) remaining on glacier surface with more melt to come.
An alpine glacier disappears when it no longer has a persistent accumulation zone (Pelto, 2010). When this occurs the glacier is typically limited in size, but still can have significant ice thickness that takes time to melt away. Here we look at three glaciers I have worked on, where two disappeared and the third is disappearing in the North Cascade Range, Washington.
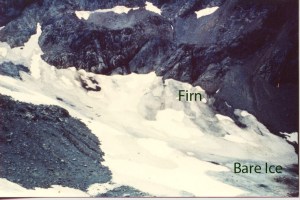
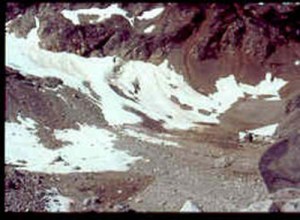
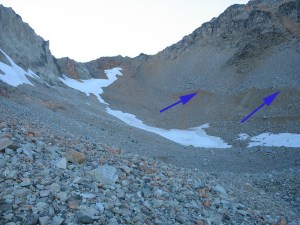
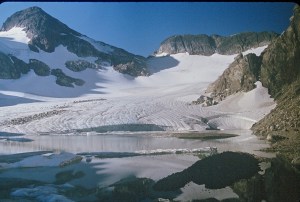
Lewis Glacier was a small cirque glacier in the drier part of the range, near Rainy Pass. In 1985 during my second visit to the Lewis Glacier, was the first time I confronted the idea of a glacier disappearing. We were able to peer down several crevasses and see the bottom of the Lewis Glacier, measurements indicated a maximum depth of 12 meters over an area the size of a football field/soccer pitch. This glacier had been selected for the North Cascade Glacier Climate Projects’s mass balance program assessing mass balance on 10 glaciers across the mountain range. This size made it attractive to observe in terms of response to climate change. The USGS map indicated a significant glacier with an area of 0.12 km2 in the 1950’s. By 1985 (top image) the glacier had lost half of its mapped area, there were still some significant blue ice areas, and areas of firn, snow several years old that is not yet glacier ice. Return visits each summer over the next few years chronicled the demise of the glacier. By 1988 (middle image) the glacier had shrunk dramatically even since 1985, the thickest ice measured was 5-6 meters. By 1990 the glacier was gone (bottom image), no blue ice left in the basin, the blue arrows indicate the lateral moraine above the now empty glacier basin. At the time I had not developed the model for forecasting glacier survival (Pelto, 2010). At bottom is 2021 image of the cirque basin with no glacier.
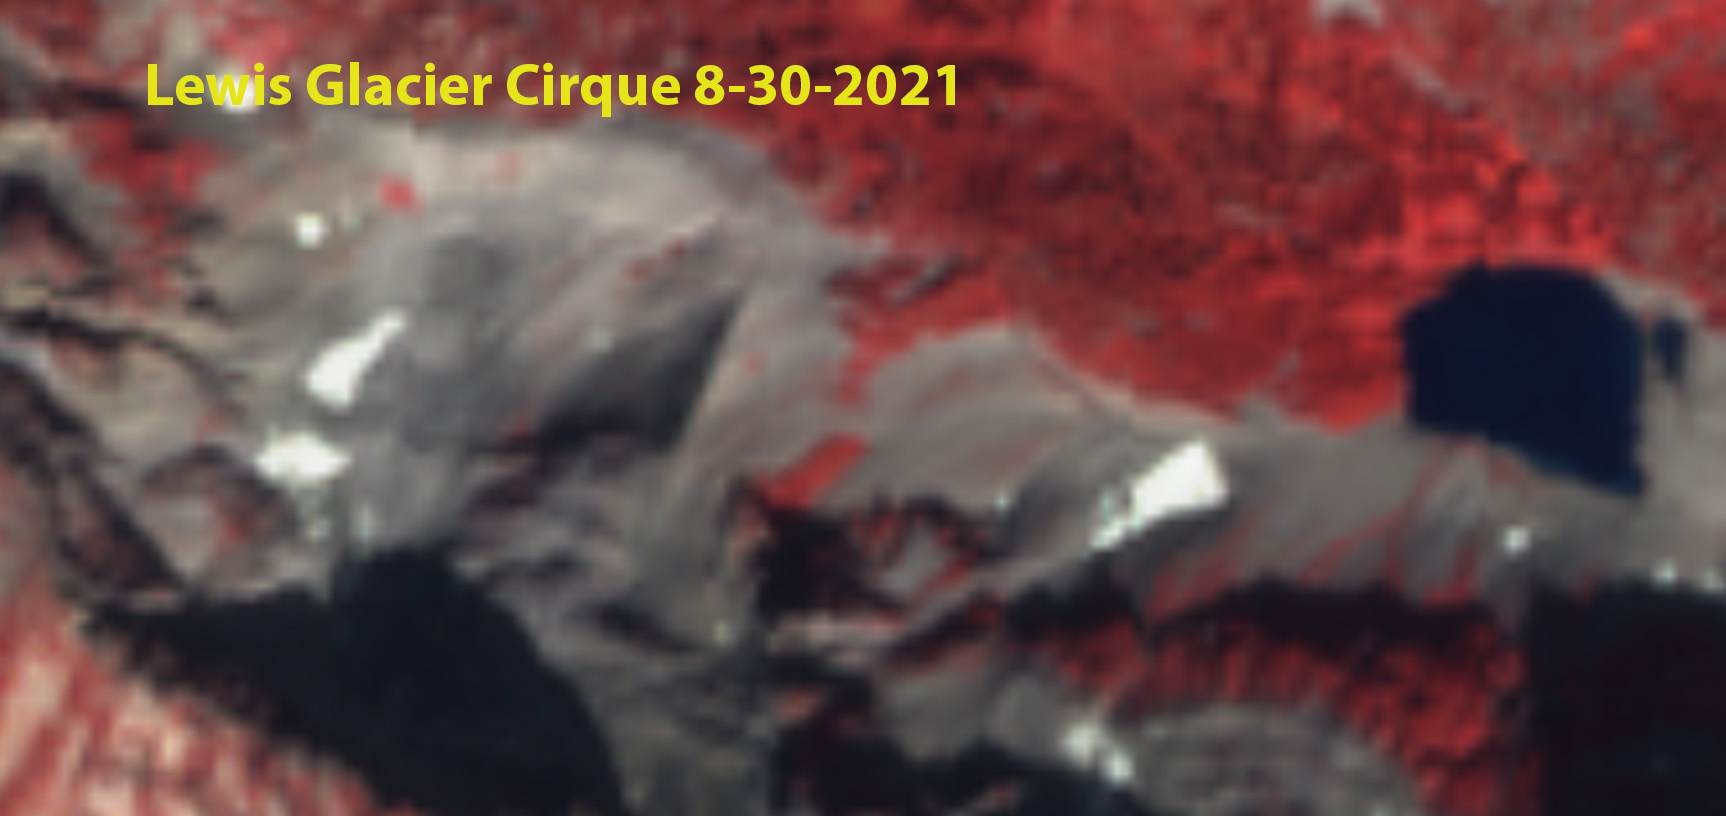
Milk Lake Glacier was a small glacier on the north flank of Glacier Peak in the North Cascades, Washington. The flat topography over the lake indicated a very thin unstable glacier area. In the USGS map for Glacier Peak in the based on 1979 aerial photographs, Milk Lake Glacier fills most of the Milk Lake Basin, had an area of 0.24 km2 with just a fringe of lake visible. Thw flat topography indicates the thin unstable nature of this part of the glacier. By 1988, Milk Lake had formed, a notably circular new alpine lake, the former glacier ice still filled part of the lake as ice bergs. The glacier had retreated to the margins of the lake fringing the west side of the lake. The fringing ice was clearly thin, we found several crevasses that reached bedrock 5-10 m down. In 1994 on a return visit in miserable weather (camera got too wet to function), there was no longer any icebergs in the lake and the lake was more of a jade to turquoise color. The fringing ice had lost about half of its area since 1988. This glacier remnant was not going to last long. By the end of 2005 the glacier had disappeared. The lake retains a beautiful jade color that will slowly become more azure as glacier flour settles. In 2021, see image bottom, the basin does not look like a recently glaciated basin.
Colonial Glacier is a cirque glacier in the Skagit River Watershed, North Cascades of Washington. The North Cascade Glacier Climate Project has made six visits to this glacier since 1985. Meltwater from this glacier enters Diablo Lake above Diablo Dam and then flows through Gorge Lake and Gorge Dam. These two Seattle City Light hydropower projects yield 360 MW of power. In 1979 the glacier was clearly thinning, having a concave shape in the lower cirque, but still filled its cirque, there is no evidence of a lake in this image from Austin Post (USGS). In 1985 my first visit to the glacier there was no lake at the terminus. We measured the glacier area at 0.92 km2. In 1991 the lake had begun to form, second image, but was less than 30 m across. The upper glacier was a smooth expanse of snow. By 1996 the lake was evident, and was 75 meters across. In 2001 the lake had expanded to a length of 125 meters. By 2006 the lake was 215 m in length, and had some thin icebergs broken off from the glacier front. From 2019-2021 a series of late summer Sentinel 2 images indicate the lack of retained snowcover necessary for survival. In 2019 15% of the glacier is snowcovered with three weeks left in the melt season. The terminus is just below a step in the glacier surface. In 2020 there is only 10% snowcover with two weeks left in the melt season. The portion of the glacier below the step has calved off and is now an iceberg in the lake. In 2021 the exceptional June heat wave took its toll and by the end of August the glacier only has 10% retained snowcover. The glacier area in 2021 is 0.26 km2, a 70% decline in area. The glacier has retreated 440 m and now is 520 m long. The lake has an area of 0.1 km2. The continued losses of Colonial Glacier are not being replenished by snowfall, this business model can only lead to the glacier disappearing. Colonial Glacier still has substantial area and thickness that will allow it to survive for a couple more decades. The continued loss of glacier area from Colonial and all other glaciers in the region reduce the mitigating affect of enhanced summer streamflow due to higher glacier runoff during warm dry periods.
Lewis Glacier cirque in Sentinel 2 image from 2021, Lewis Lake is lower right.
Milk Lake cirque in 2021, looking like a basin that was not recently glaciated.
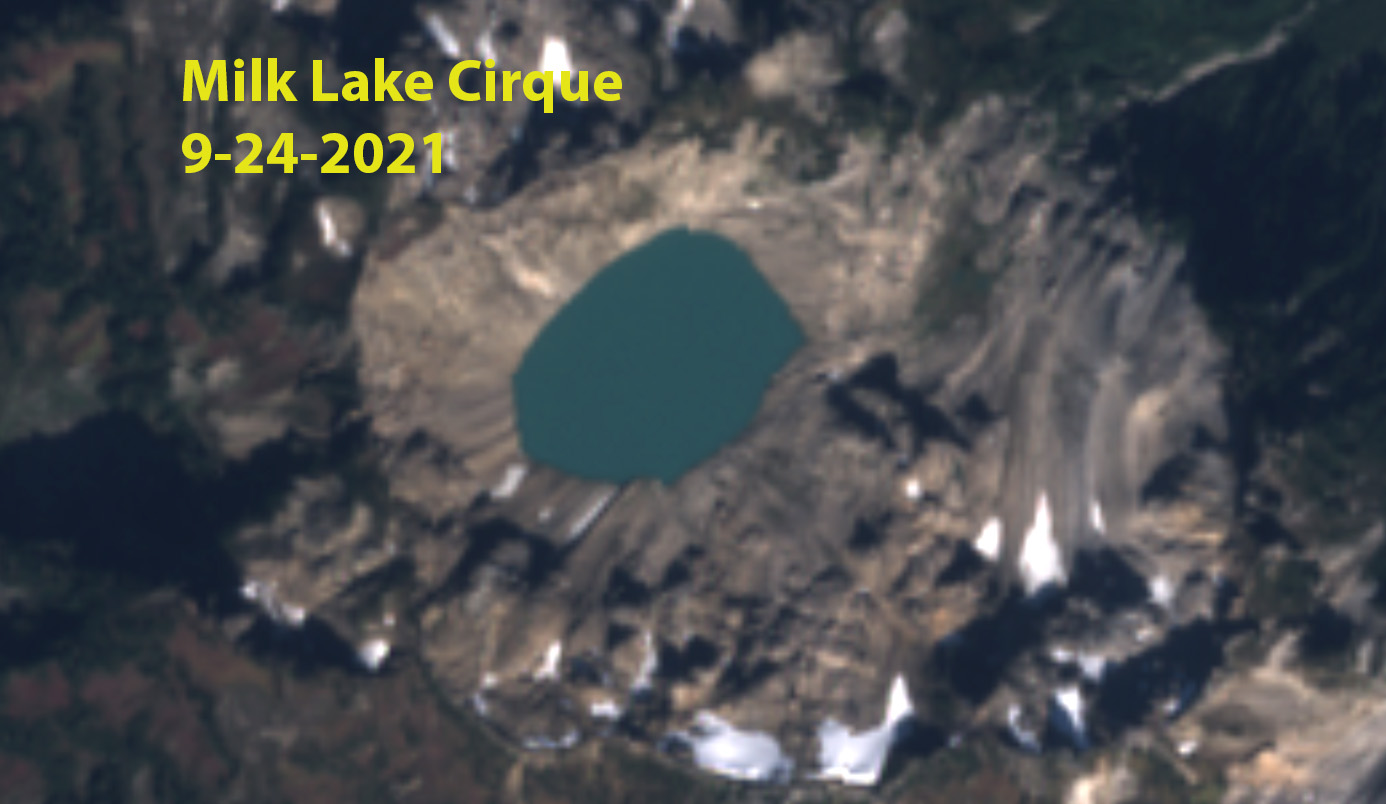
Bernardo Glacier in Landsat images from 1986 and 2021 illustrating retreat at the southern (S), middle (M) and northern (N) terminus respectively. Red arrows are 1986 terminus locations, yellow arrows are 2021 terminus locations. Separation from Tempano occurs at S, while lake expansion occurs at M and N.
Bernardo Glacier is an outlet glacier on the west side of the Southern Patagonia Icefield (SPI) that currently ends in an expanding proglacial lake system, with three primary termini. Here we examine changes from 1986 to 2021 using Landsat images. Davies and Glasser (2012) indicate that over the last century the most rapid retreat was from 2000 to 2011. Willis et a (2012) note a thinning rate of 3.4 meters per year during this period of the Bernardo Glacier region, which drives the retreat. Mouginot and Rignot (2014) illustrate that velocity remains above 200 m/year from the terminus to the accumulation zone on Bernardo Glacier. Eñaut Izagirre visited the glacier in 2019 and provided images of the middle terminus of Bernardo Glacier, below.
Bernardo Glacier in Landsat images from 1998 and 2020 illustrating retreat at the southern (S), middle (M) and northern (N) terminus respectively. Red arrows are 1986 terminus locations, yellow arrows are 2021 terminus locations. Separation from Tempano occurs at S, while lake expansion occurs at M and N.
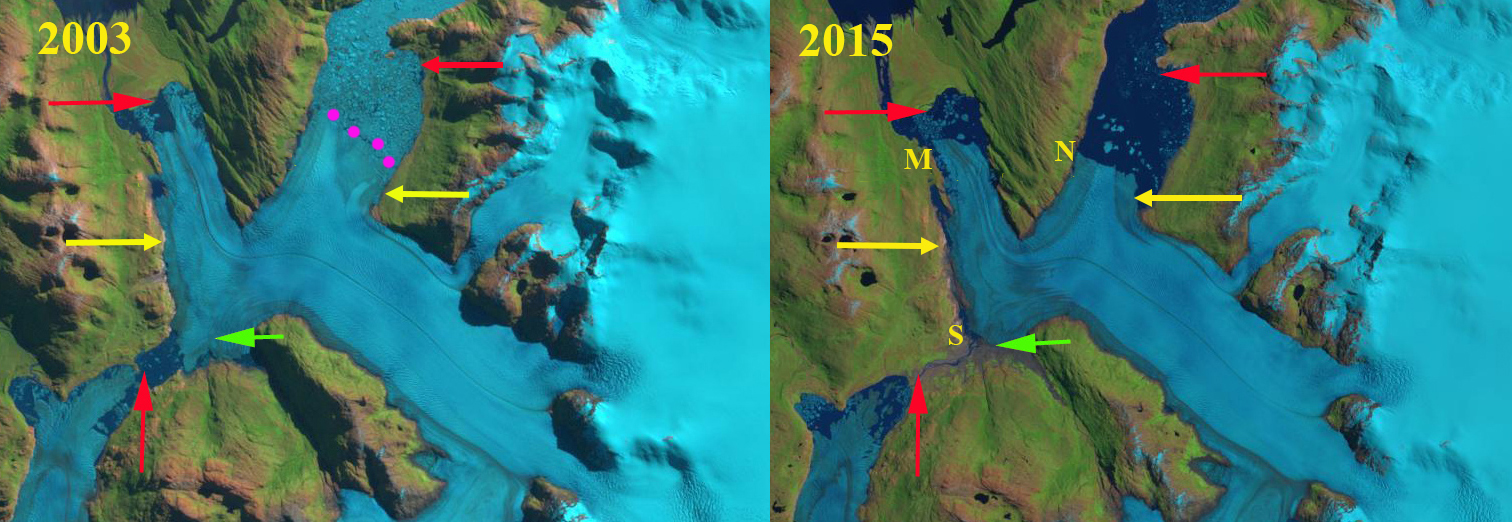
In 1986 Bernardo the southern terminus of the glacier was in tenuous contact with Tempano Glacier. The middle terminus primarily ended on an outwash plain with a fringing proglacial lake developing. The northern terminus had retreated a short distance south from a peninsula that had acted as a pinning point. By 1998 the northern terminus had retreated into the wider,deeper portion of the lake basin that was now filled with icebergs. The middle terminus remained grounded on an outwash plain, with proglacial lake expansion at the NW corner of the terminus. A small lake has developed completely separating Bernardo Glacier and Tempano Glacier. By 2003 the northern terminus had retreated 2 km from 1986, the middle terminus 1.5 km and the southern terminus 1.2 km in an expanding proglacial lake. By 2015 the lake between Tempano and Bernardo Glacier had drained, but a fringing proglacial lake at the margin of Bernardo Glacier was forming. In 2015 the northern terminus had retreated 3.5 km since 1986, the middle terminus 2.5 km and the southern terminus 2.75 km. From 2015 to 2020 the change of the southern terminus was limited to a limited expansion of the fringing proglacial lake, a limited retreat of the the northern terminus, while the middle terminus had retreated significantly into a wider portion of the lake basin. By 2021 the southern terminus had retreated 3 km since 1986, the middle terminus 4.6 km and the norther terminus 4.1 km. This led to a 8.7 km2 lake expansion at the middle terminus and a 7.8 km2 lake expansion at the northern terminus. Gourlet et al (2016) identify Bernardo Glacier as having thinner ice than other large outlet glaciers such Jorge Montt or O’Higgins, which helps lead to rapid terminus change. The retreat is similar to the extensive retreat observed at Dickson Glacier and Upsala Glacier.
Southern Andean huemel an endemic deer on the foreland beyond Bernardo Glacier (photograph from Eñaut Izagirre).
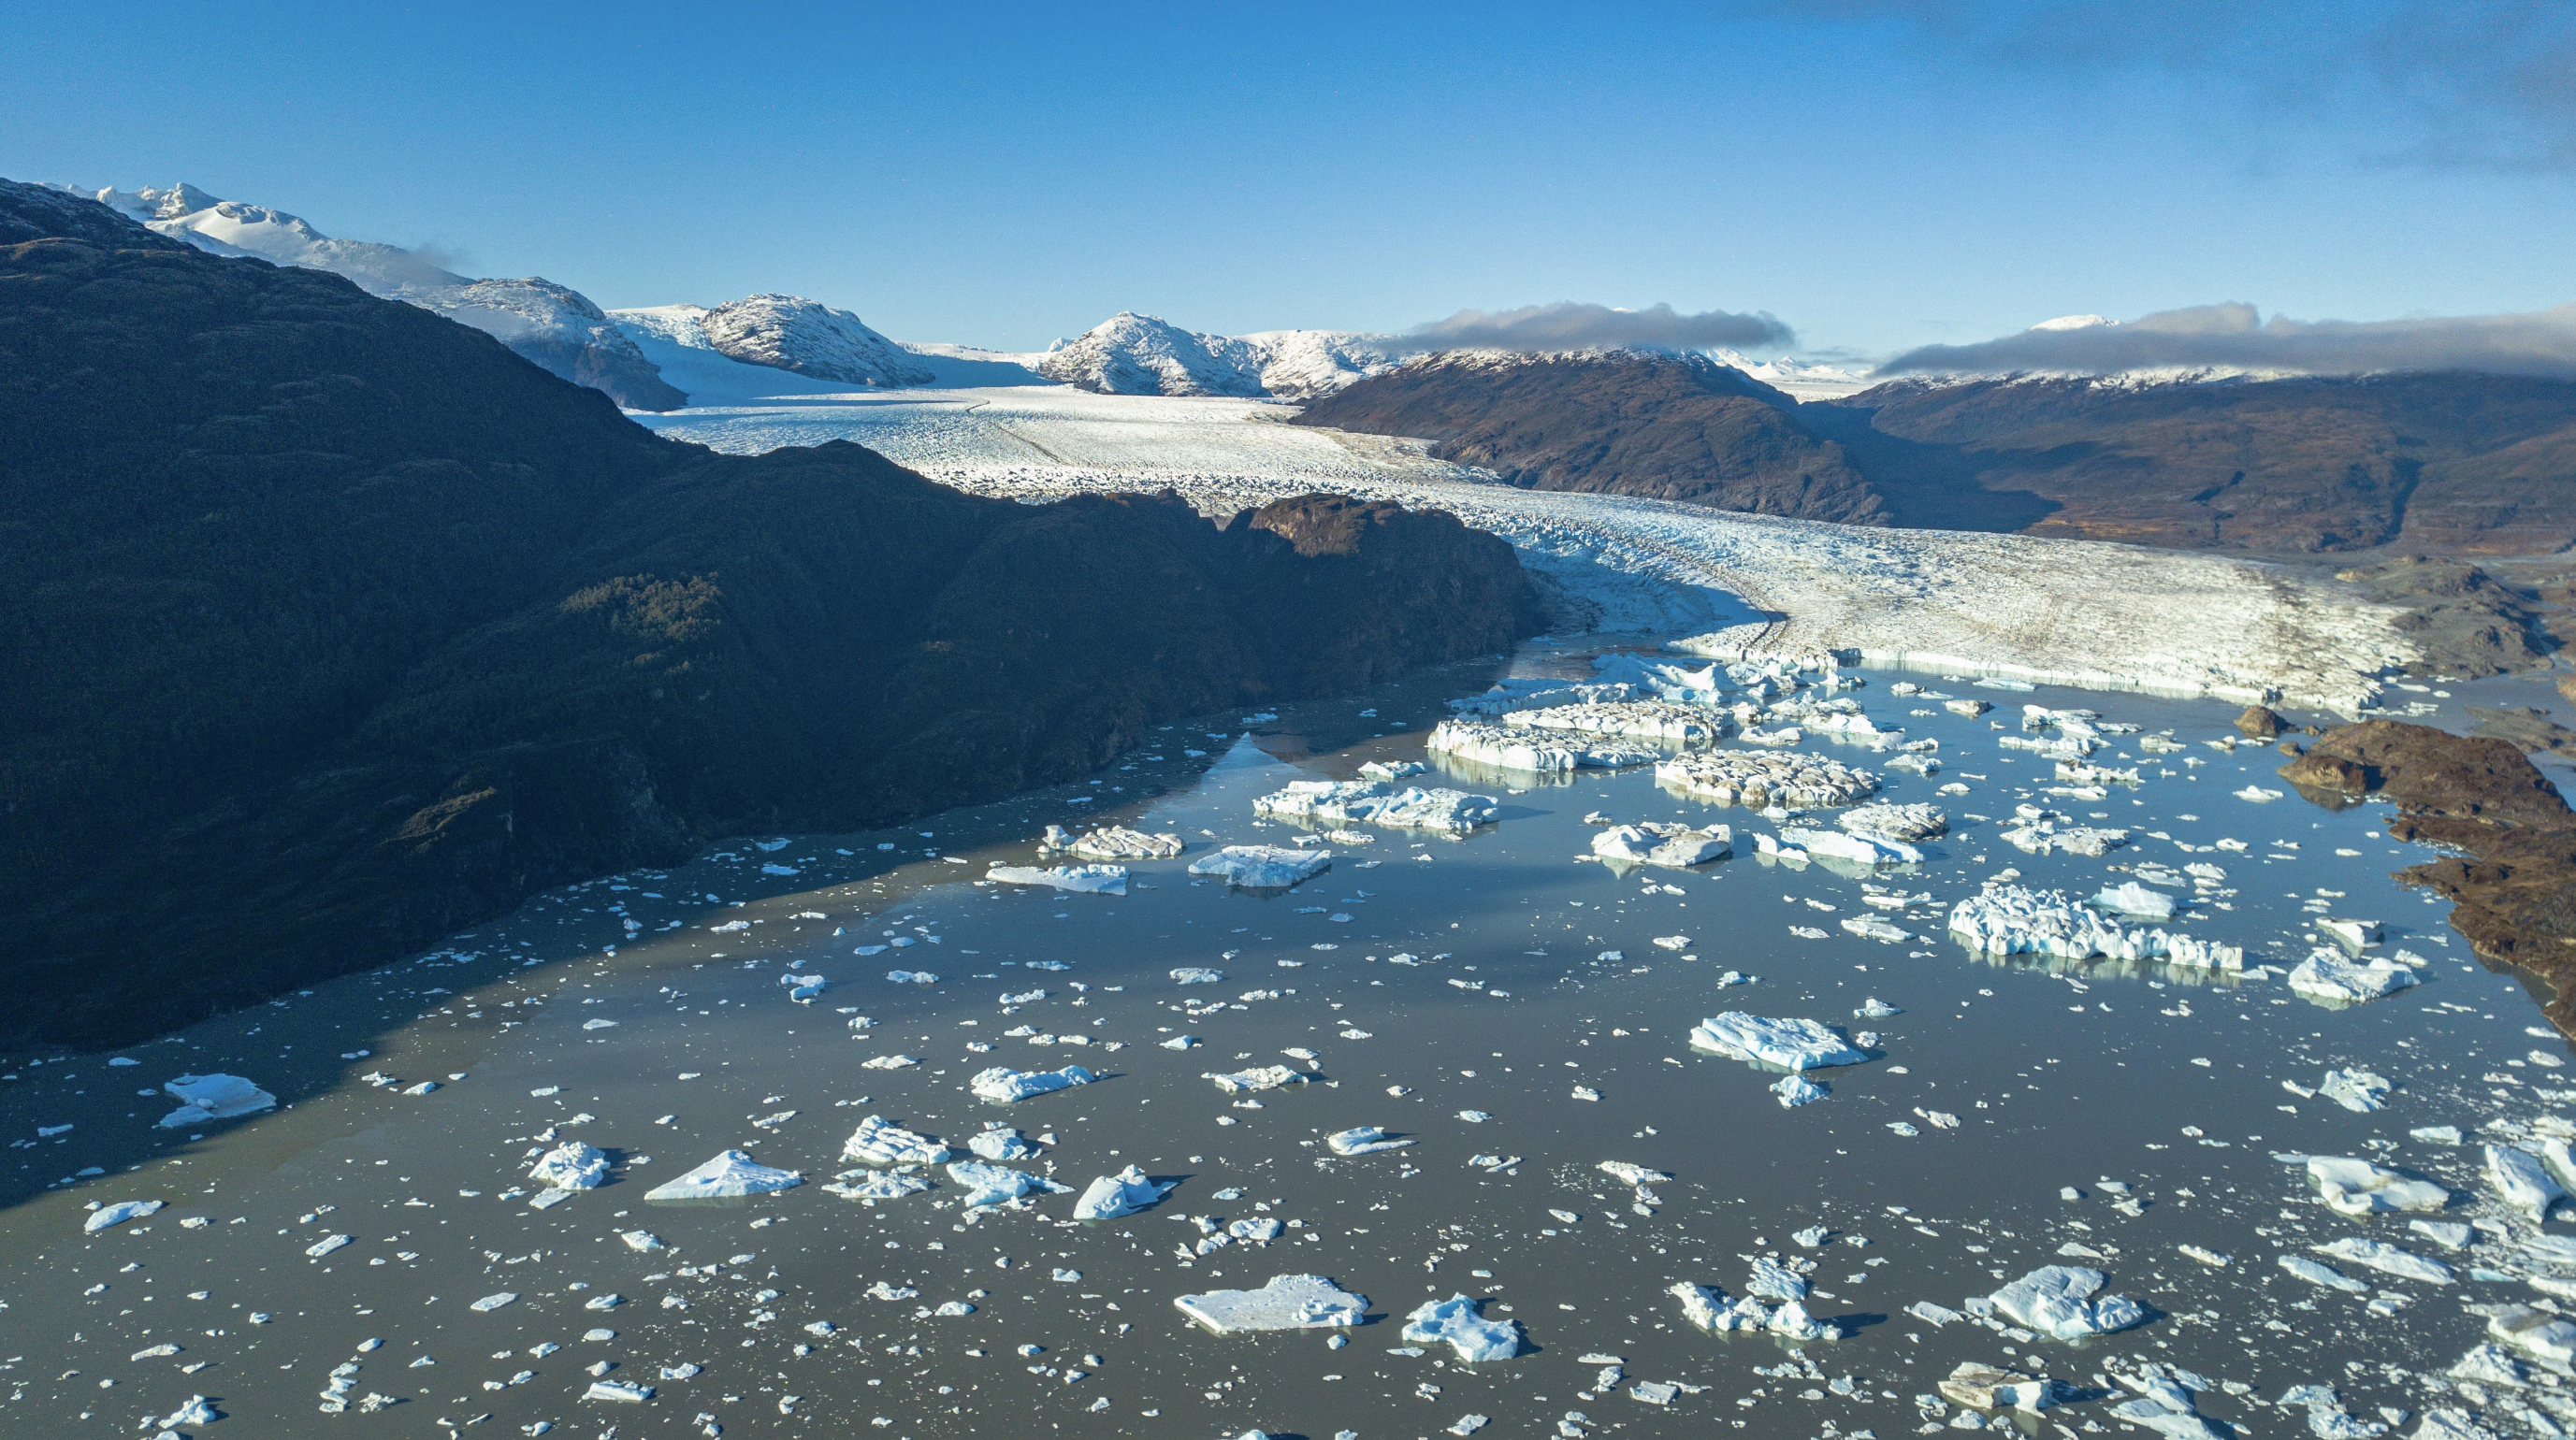
Middle terminus of Bernardo Glacier in 2019 taken by Eñaut Izagirre who considers this a condor-view.
Bernardo Glacier in Landsat images from 2003 and 2015 illustrating retreat at the southern (S), middle (M) and northern (N) terminus respectively. Lake expansion and then drainage occurs at S. Red arrows are 1986 terminus locations, yellow arrows are 2021 terminus locations.
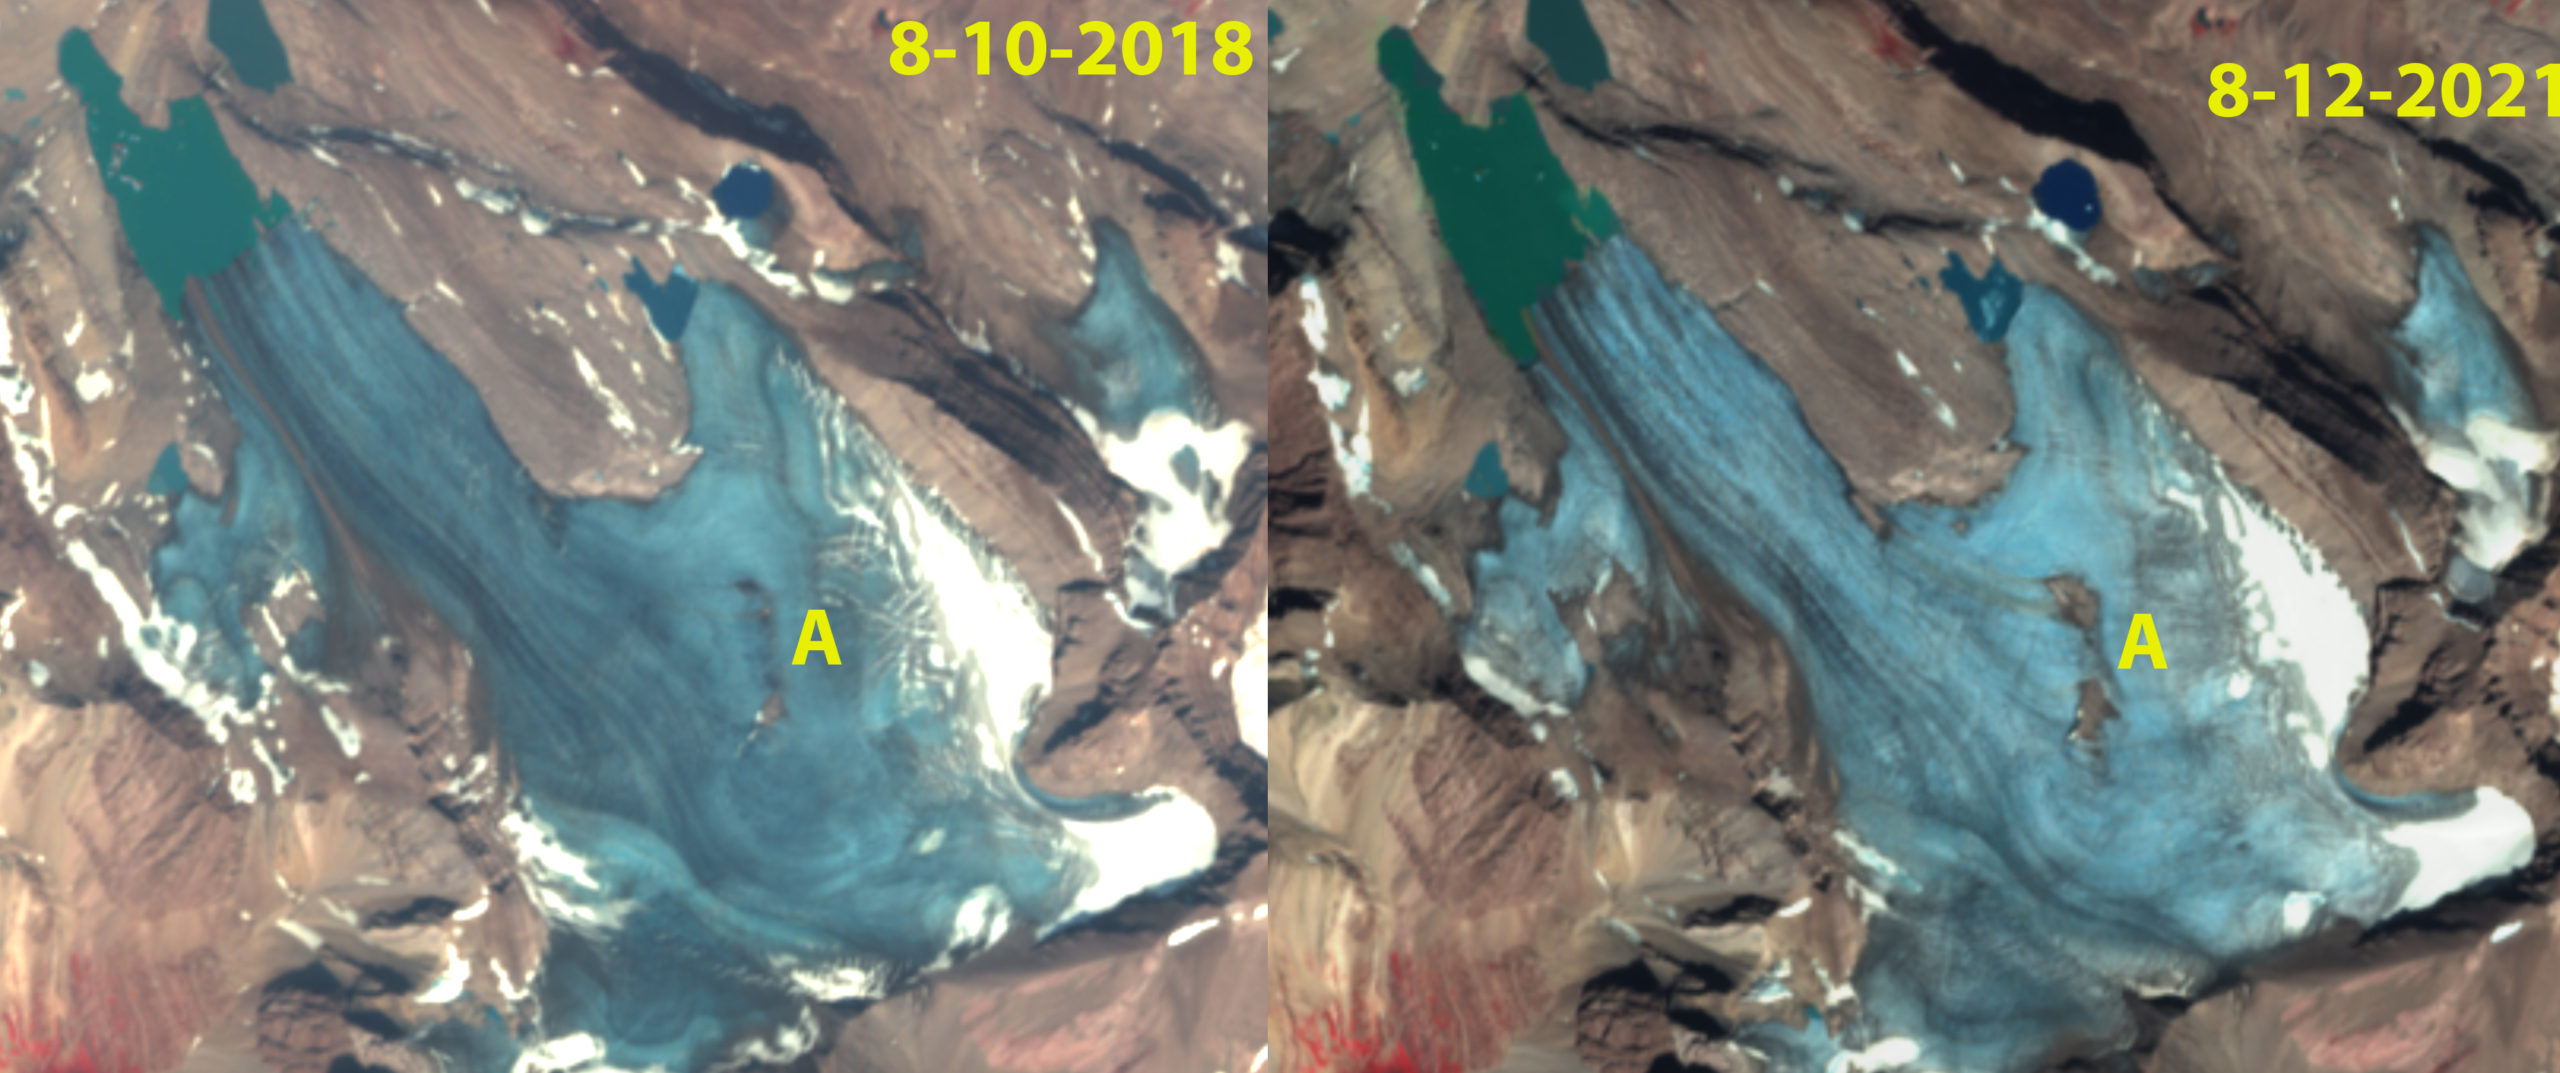
Field Glacier on Aug. 31, 2021 in a Sentinel image. Note former glacier junctions A and B where the glacier has separated this century. The 7.5 km2 lake did not exist when I first visited this glacier.
The Field Glacier flows from the northwest side of the Juneau Icefield, and is named for Alaskan glaciologist and American Geographical Society leader William O. Field. Bill along with his work around Glacier Bay helped initiate the Juneau Icefield Research Program, which Maynard Miller then ably managed for more than 50 years. The JIRP program is still thriving today led by Seth Campbell. In 1981, as a part of JIRP, I had my first experience on Field Glacier completing a snowpit in its upper accumulation area. In the summer of 1983 I met with Bill to discuss where to setup a long term glacier mass balance program. I ended up selecting the North Cascade Range. In 1984 we skied back to the same snowpit site on Field Glacier, finding 3.8-4.1 m of retained snowpack in crevasses. At the end of our 11th field season in the North Cascade Range I spent a couple of nights at Austin Post’s (USGS) house and he reviewed his choice for a glacier to name after Bill, who had passed earlier that month. This was truly a remote area, which was why it had remained unnamed.
In 1984 the glacier began from the high ice region above 1800 meters, with two main branches joining at Point A and one significant tributary joining from the northern branch at Point B. There are icefalls near the snowline at 1350 meters on both the southern branch and the tributary entering at Point B. In 1984 the glacier descended the valley ending at 100 meters on the margin of an outwash plain. The meltwater feeds the Lace River which flows into Berners Bay. This post focusses on the changes from 1984-2021 using primarily Landsat imagery.
Field Glacier in Landsat images from 1984 and 2021 illustrating lake development, glacier separation at Point A and B and progressive detachment/separation at Point C,D and E. Purple dots indicate the snowline elevation at 1350-1400 m.
The USGS map from 1948 imagery and the 1984 imagery indicate little change in the terminus position. There is a narrow fringing proglacial lake along the southern edge of the terminus in 1984 with most of the margin resting on the outwash plain. In 1997 the proglacial lake was still a narrow fringing lake, though clearly poised to expand as it extended nearly the full perimeter of the terminus. By 2006 the proglacial lake at the terminus averaged 1.6 km in length, with the east side being longer. There were several small incipient lakes forming at the margin of the glacier above the main lake. In 2009 the lake had expanded to 2.0 km long and was beginning to incorporate the incipient lake on the west side of the main glacier tongue. There was also a lake on the north side of this tributary. This lake was noted as being poised to soon fill the valley of the south tributary and fully merge with the main lake at the terminus (Pelto, 2017). In 2013 Landsat imagery indicates the fragile nature of the terminus tongue that was about to further disintegrate, retreat from 1984-2013 was 2300 m and the lake had an area of 4.0 km2 (Pelto, 2017). This disintegration led to the separation of the two branches by 2017.
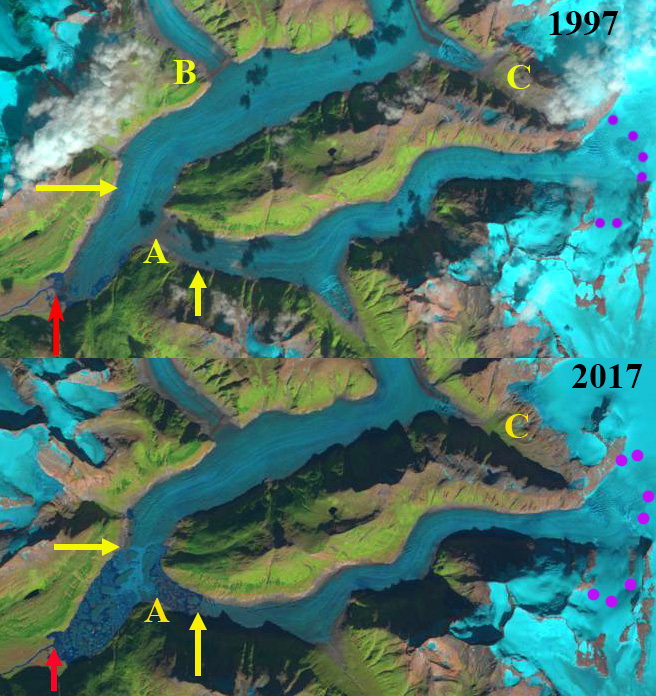
In 2021 the Field Glacier has two main branches are separated by 4 km, Point A. The tributary at Point B is also separated, no longer joining the main glacier. There is another separation imminent at the junction-Point E, 5 km of this former tributary. At Point C and D progressive detachment of smaller tributaries are evident. From 1984 to 2021, Field Glacier has experienced a retreat of 5500 m of the southern branch and 4100 m of the northern branch. The lake has expanded to 7.5 km2. Fringing lake on the northern branch indicates the lake will expand at least another 1 km. For the southern branch the glacier is close to what will be the lake margin. The record snowline elevation on the icefield in 2018 and 2019 (Pelto, 2019), has led to a continuation of the rapid mass balance loss, retreat, and lake development at Field Glacier. This glacier is experiencing retreat and lake expansion like several other glaciers on the Juneau Icefield, Gilkey Glacier,Llewellyn Glacier, and Tulsequah Glacier (Pelto, 2017).
Field Glacier in Landsat images from 1997 and 2017 illustrating lake development, glacier separation at Point A and B and progressive detachment/separation at Point C,D and E.
Field Glacier terminus in Landsat images from 1984 and 2013, dots indicate terminus, with pink arrows in 2013 indicating where marginal lakes have developed.
Field Glacier terminus in Landsat images from 2006 and 2009, red line is terminus with orange arrows indicating fringing lake development.
Drogpa Nagtsang Glacier, China retreat and proglacial expansion in 1993 and 2021 Landsat images. Red arrow is the 1993 terminus, yellow arrow the 2021 terminus and yellow dots are the snowline.
Drogpa Nagtsang Glacier, China is 30 km west of Mount Everest terminating in an expanding proglacial lake. The glacier begins on the Nepal border at 6400 m, and its meltwater enters the Tamakoshi River that supplies the Upper Tamakoshi Hydropower project a 456 MW run of river project that began operation in September 2021. King et al (2017) observed the mass balance of 32 glaciers in the Mount Everest area including Drogpa Nagtsang and found a mean mass balance was -0.7 m/year for lake terminating glaciers. In this basin from 2000–2016, mass balance loss resulted in surface elevation to decline at a rate of −0.63 m a−1, which drove a velocity decline of ~25% (Zhong et al 2021). They also noted that the area of proglacial lakes in glacier contact increased by ~204% . Pelto et al (2021) documented the exceptionally high winter snowline in the Mount Everest region from October 2020-January of 2021. Here we examine changes in Drogpa Nagtsang Glacier since 1993 and the snowline variation from October 2020-November 2021.
In 1993 Drogpa Nagtsang Glacier had a substantial number of coalescing supraglacial ponds on its relatively flat stagnant debris covered terminus. The snowline in 1993 was at ~5450 m. At Point A there is extensive crevassing indicating vigourous flow. At Point B a tributary glacier joins the main glacier. At Point C the glacier is a 1.2 km wide glacier tongue. Quincey et al (2009) observed flow of less than 10 m/a in lower 5 km of glacier in 1996 and peaking at 20-30 m/a 8 km from terminus. By 2015 a 2.7 km long lake has developed (Pelto, 2019). In 2021 the lake has expanded to 3 km long. At Point A there is no longer significant crevassing indicating reduced flow. At Point B the tributary no longer connects to main glacier. At Point C the glacier tongue has lost 30% of its width and debris cover width has expanded. The terminus area remains stagnant and the lake is poised to continue expansion.
Snowline variation from October 2020-November 2021, yellow dots. These are Landsat images except May 2021 is from Sentinel.
In October 2020 the snowline on Drogpa was at 5650-5700 m. By mid-January after the record winter heat wave of 2021 the snowline had risen to 5750-5800 m. In May of 2021 as the summer monsoon began the snowline was below the terminus of the glacier (5000 m). In June the snowline had risen to 5450 m. This is a summer acccumulation type of glacier, which means most of the accumulation snowfall occurs during the summer monsoon above the snowline simultaneous with high melt rates below the snowline. The snowline is close to mean freezing level, which has risen to 5400 m in recent years for the summer monsoon period (Perry et al 2020)The snowline than rises in the post-monsoon period. By October 2020 in the post-monsoon period the snowline had rise to 5600 m. A significant storm in late October lowered the snowline to 5250 m for November 2021. This suggests the snow free start to winter we saw last year will not occur this year.
Seven outlet glaciers of the Queulat glacier complex, Chile in 1987 and 2020 Landsat images. A=Rosselot Glacier and D=Colgante Hanging Glacier are the only ones in 1987 not terminating in a proglacial lake. The other five retreated from a proglacial lake since 1987 and Rosselot Glacier retreat has led to formation of two lakes.
Nevado Queulat, Chile is the centerpiece of the Queulat National Park in the Aysen Region. This massif is host to the Queulat glacier complex, which has a number of outlet glaciers. Rosselot Glacier is the largest glacier and it flows north draining into Lago Rosselot and then the Rio Palena. Colgante Hanging Glacier flows south and is the second largest terminating at the top of a cliff as a hanging terminus creating a spectacular waterfall. Paul and Molg (2014) observed a rapid retreat in general of 25% total area lost from glaciers in the Palena district of northern Patagonia from 1985-2011. Meier et al (2018) note a 48% reduction in glacier area in the Cerro Erasmo and Cerro Hudson region, since 1870 with half of that occurring since 1986. The 3.8 km retreat of Erasmo Glacierfrom 1998 to 2018 is a rate of ~200 m/year. Here we examined the changes from 1987 to 2021 of seven outlet glacier locations around the ice cap.
Seven outlet glaciers of the Queulat glacier complex in Queulat National Park in Chile in 2021 Sentinel 2 image. A=Rosselot Glacier and D=Colgante Hanging Glacier are the only ones in 1987 not terminating in a proglacial lake. The other five retreated from the proglacial lake since 1987 and Rosselot Glacier retreat has led to formation of two lakes.
In 1987 Rosselot (A) terminates against the valley where the valley turns to the east,and there is no lake at the terminus. In 1999 glacier retreat has exposed a new lake that is 900 m across. By 2015 the glacier has retreated south of a second lake that is 700 m across. In 2021 the glacier has retreated 250 m from the edge of the lake terminating at an elevation of 650 m. The total retreat from 1987-2021 has been 2100 m, ~60 m per year. This is the loss of 15% of the entire glacier length.
Seven outlet glaciers of the Queulat glacier complex, Chile in 1999 and 2015 Landsat images.
Outlet Glacier B terminates in a lake at 750 m. In 1999 the glacier has retreated to the top of a steep slope above the lake terminating at 850 m. In 2015 the glacier is terminating at 925 m and is receding up a north-south oriented valley. By 2021 the glacier has retreated 1100 m from the shore of the lake.
Outlet Glacier C terminates in a small fringing proglacial lake. By 1999 the glacier has retreated ~400 m to the base of a steeper slope, there is still ice cored moraine beyond the terminus. By 2015 a 500 m lake has formed beyond the terminus. In 2021 the glacier has retreated ~1000 m since 1987.
Colgante Hanging Glacier (D) terminates at the top of a steep cliff in 1987. The glacier reamins at the top of this cliff up to 2021, with considerable avalanching off the front into the valley below. A reconstituted glacier at the bottom of the cliff is thinning.
Outlet Glacier (E) terminated in a proglacial lake at 700 m elevation in 1987. By 1999 the glacier had a tenuous connection to the lake with a reconstituted stagnant area in contact with the lake. In 2015 the glacier no longer reaches the lake. In 2021 the terminus of the glacier is 400 m from the lake.
Outlet Glacier (F) terminated in a proglacial lake at 750 m elevation in 1987. In 1999 the glacier still connected to the lake. By 2015 the glacier had receded from this lake. In 2021 the glacier has retreated 350 m from the lake and terminates at 1000 m.
Outlet Glacier G is a stagnant debris covered glacier tongue that is in contact with a proglacial lake in 1987 and 1999. By 2015 the glacier has retreated from contact with the lake. In 2021 the glacier has retreated 600 m across an outwash plain from the lake.
Barcaza et al (2017) indicate that Colgante Hanging Glacier did not retreat from 2000-2015, while Rosselot Glacier lost 0.9 km2.
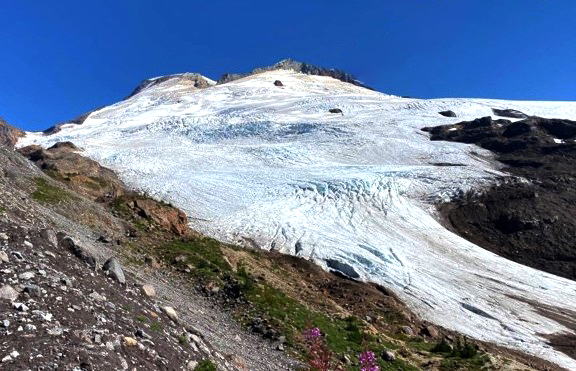
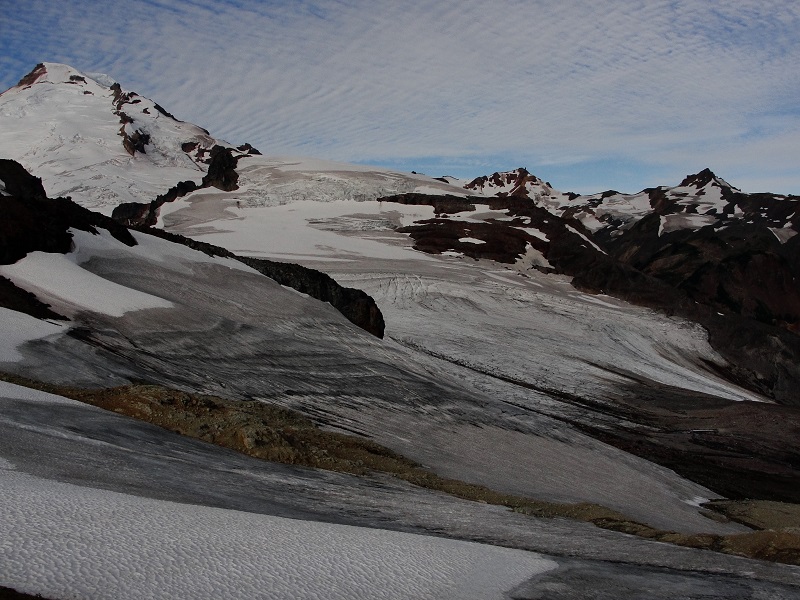
Easton Glacier on Mount Baker in late August 2021, with less than 20% of the glacier retaining snowpack.
The exceptional heat of the summer of 2021 across glaciated mountain ranges of the Pacific Northwest, reduced snowcover extent from Mount Shasta, CA north to Mount Adams and Mount Baker, WA and east to Glacier National Park, MT, Kokanee Glacier, BC and Bonnet Glacier, Alberta. Here we examine late summer images to illustrate the extent of exposed bare ice and firn across glaciers in the region. For a glacier to be in equilibrium requires at least 50% to be in the accumulation zone, snow covered at the end of the summer. At the end of the summer the snowcovered area varied from 0-20% on all of the glaciers reviewed here, the snowcovered area is the accumulation area ratio. Low accumulation area ratios such as this indicate mass loss of at least 2 m w.e. in 2021 on these glaciers. That is the equivalent of losing a 2 m thick slide of ice off the surface of the entire glacier.
When there is a persistent pattern of snowcover loss on the upper part of the glacier this indicates the lack of a consistent accumulation zone indicating the glacier cannot survive (Pelto, 2010). One indicator of this is new bedrock being exposed on the upper glacier as seen on both Easton and Bonnet Glacier here.
As the winter season begins hopefully a La Nina pattern will deliver much needed deep snowpacks.
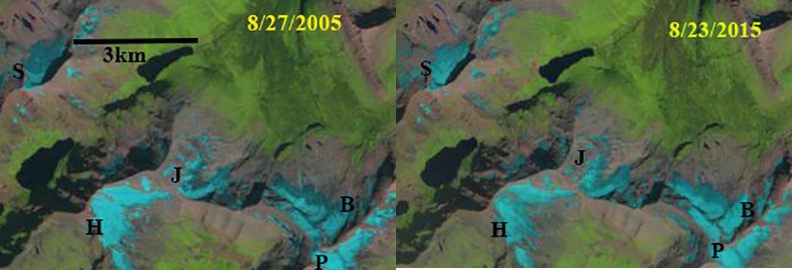
Sentinel 2 False and True Color images from 8-25-2021. Yellow arrows indicate where glacier is separating and blue arrows the small remanent of 2021 snowpack remaining. This remanent will not last to the end of the melt season.
Jackson and Blackfoot Glacier in early September Sentinel 2 false color images. Point A indicates exposed ice showing annual layers. Point B indicates exposed firn that had been retained through previous summers. The gray color of the firn indicates how dirty it is and that its albedo would enhance melting.
Adams Glacier on Mount Adams in Sentinel 2 True Color image from 8-30-2021. Pink arrows indicate icefall top and bottom. S=summit area, A=Areas where limited pockets of 2021 snowpack has been retained through August.
The upper reaches of Kokanee Glacier to Cond Peak (2800 m) with no retained snow in 2021. Bare ice is exposed on the lower half of the image, and firn, or multi-year snow above. Picture taken during fieldwork by Ben Pelto.
Bonnet Glacier in Sentinel 2 images indicating the emergence of bedrock due to thinning in the former accumulation zone, Point A. Note the lack of retained snowcover in both years with at least a month left in the melt season.
Watercolor painting of Sholes Glacier. The small figure is at the current terminus of the glacier, and the photo that inspired this painting was taken from where the glacier used to end about 35 years prior. By Jill Pelto
Sholes Glacier is on the northeast flank of Mount Baker, WA. We have spent the last 32 years completing detailed measurments on this glacier that has revealed a story of glacier mass balance loss, thinning, retreat, declining area, and a cascade of other consequences impacting other “ologies” beyond the glacier. If you are intrigued by many ologies, the Podcast by Allie Ward will be inspiring as it was to this title.
Sholes Glacier and stream gage station. We have constructed a rating curve for this station, that the Nooksack Indian Tribe maintains (Grah and Beaulieu, 2013).
The climatology of the region has shifted, with one key change being more frequent and intense heat waves. Glaciers and heat waves just are not compatible. Using daily maximum temperatures for the 1981-2021 period for Mount Baker from ERA5 temperature reanalysis, completed by Tom Matthews at Loughborough University, indicates that there have been 83 days where the maximum temperature exceeded 12°C, an average of 2 days/year. In the last five years there have been 22 days exceeding 12°C, over 4 days/year. There have been 16 days during 1981-2021 period when the maximum temperature exceeded 14°C, 75% (12) of these have been in the last five years.
Probing snow depth on Sholes Glacier in 2014, this is completed annually at a fixed network of over 100 locations.
In terms of glaciology the result of the climate shift is that the glacier has lost 25-30% of its volume from 1990-2021. The terminus has retreated 155 m while the area has decreased by 25%. The changes have been most rapid in the last 8 years. The two years of largest mass loss were 2015 and 2021. We measure both melting (ablation) on the glacier and runoff from the glacier. This combination allows determination of the amount of glacier runoff. During 24 heat waves in the region from 2009-2021 mean daily ablation during the heat waves has ranged from 4.5-7.2 cm w.e./day (w.e.=water equivalent). The highest rate of 7.2 cm was during the June 26-July 1, 2021 period.
Sholes Glacier in 2015 exhibiting the darkening of the surface that occurs in high melt years, increasing melt rates. How much black carbon and algae is part of this darkening is the research of Alia Khan (WWU).
For a glacier to be in equilibrium or have a positive mass balance the majority of the glacier must be in the accumulation zone, snow covered at the end of the summer, that is an accumulation are ratio (AAR) greater than 50%. Pelto and Brown (2012)noted that for Mount Baker an AAR of 60% is required for a break even balance for the year. From 2013-2021 the average accumulation area ratio has been 35%. For Sholes Glacier if 50% of the glacier is exposed ice and firn in early August that increases mass loss. The ice and firn for the same weather conditions have a 30-40% higher melt rate than the snowpack. An early season heat wave strips the snow off earlier exposing the darker faster melting glacier surfaces for longer further increasing mass loss, note image above.
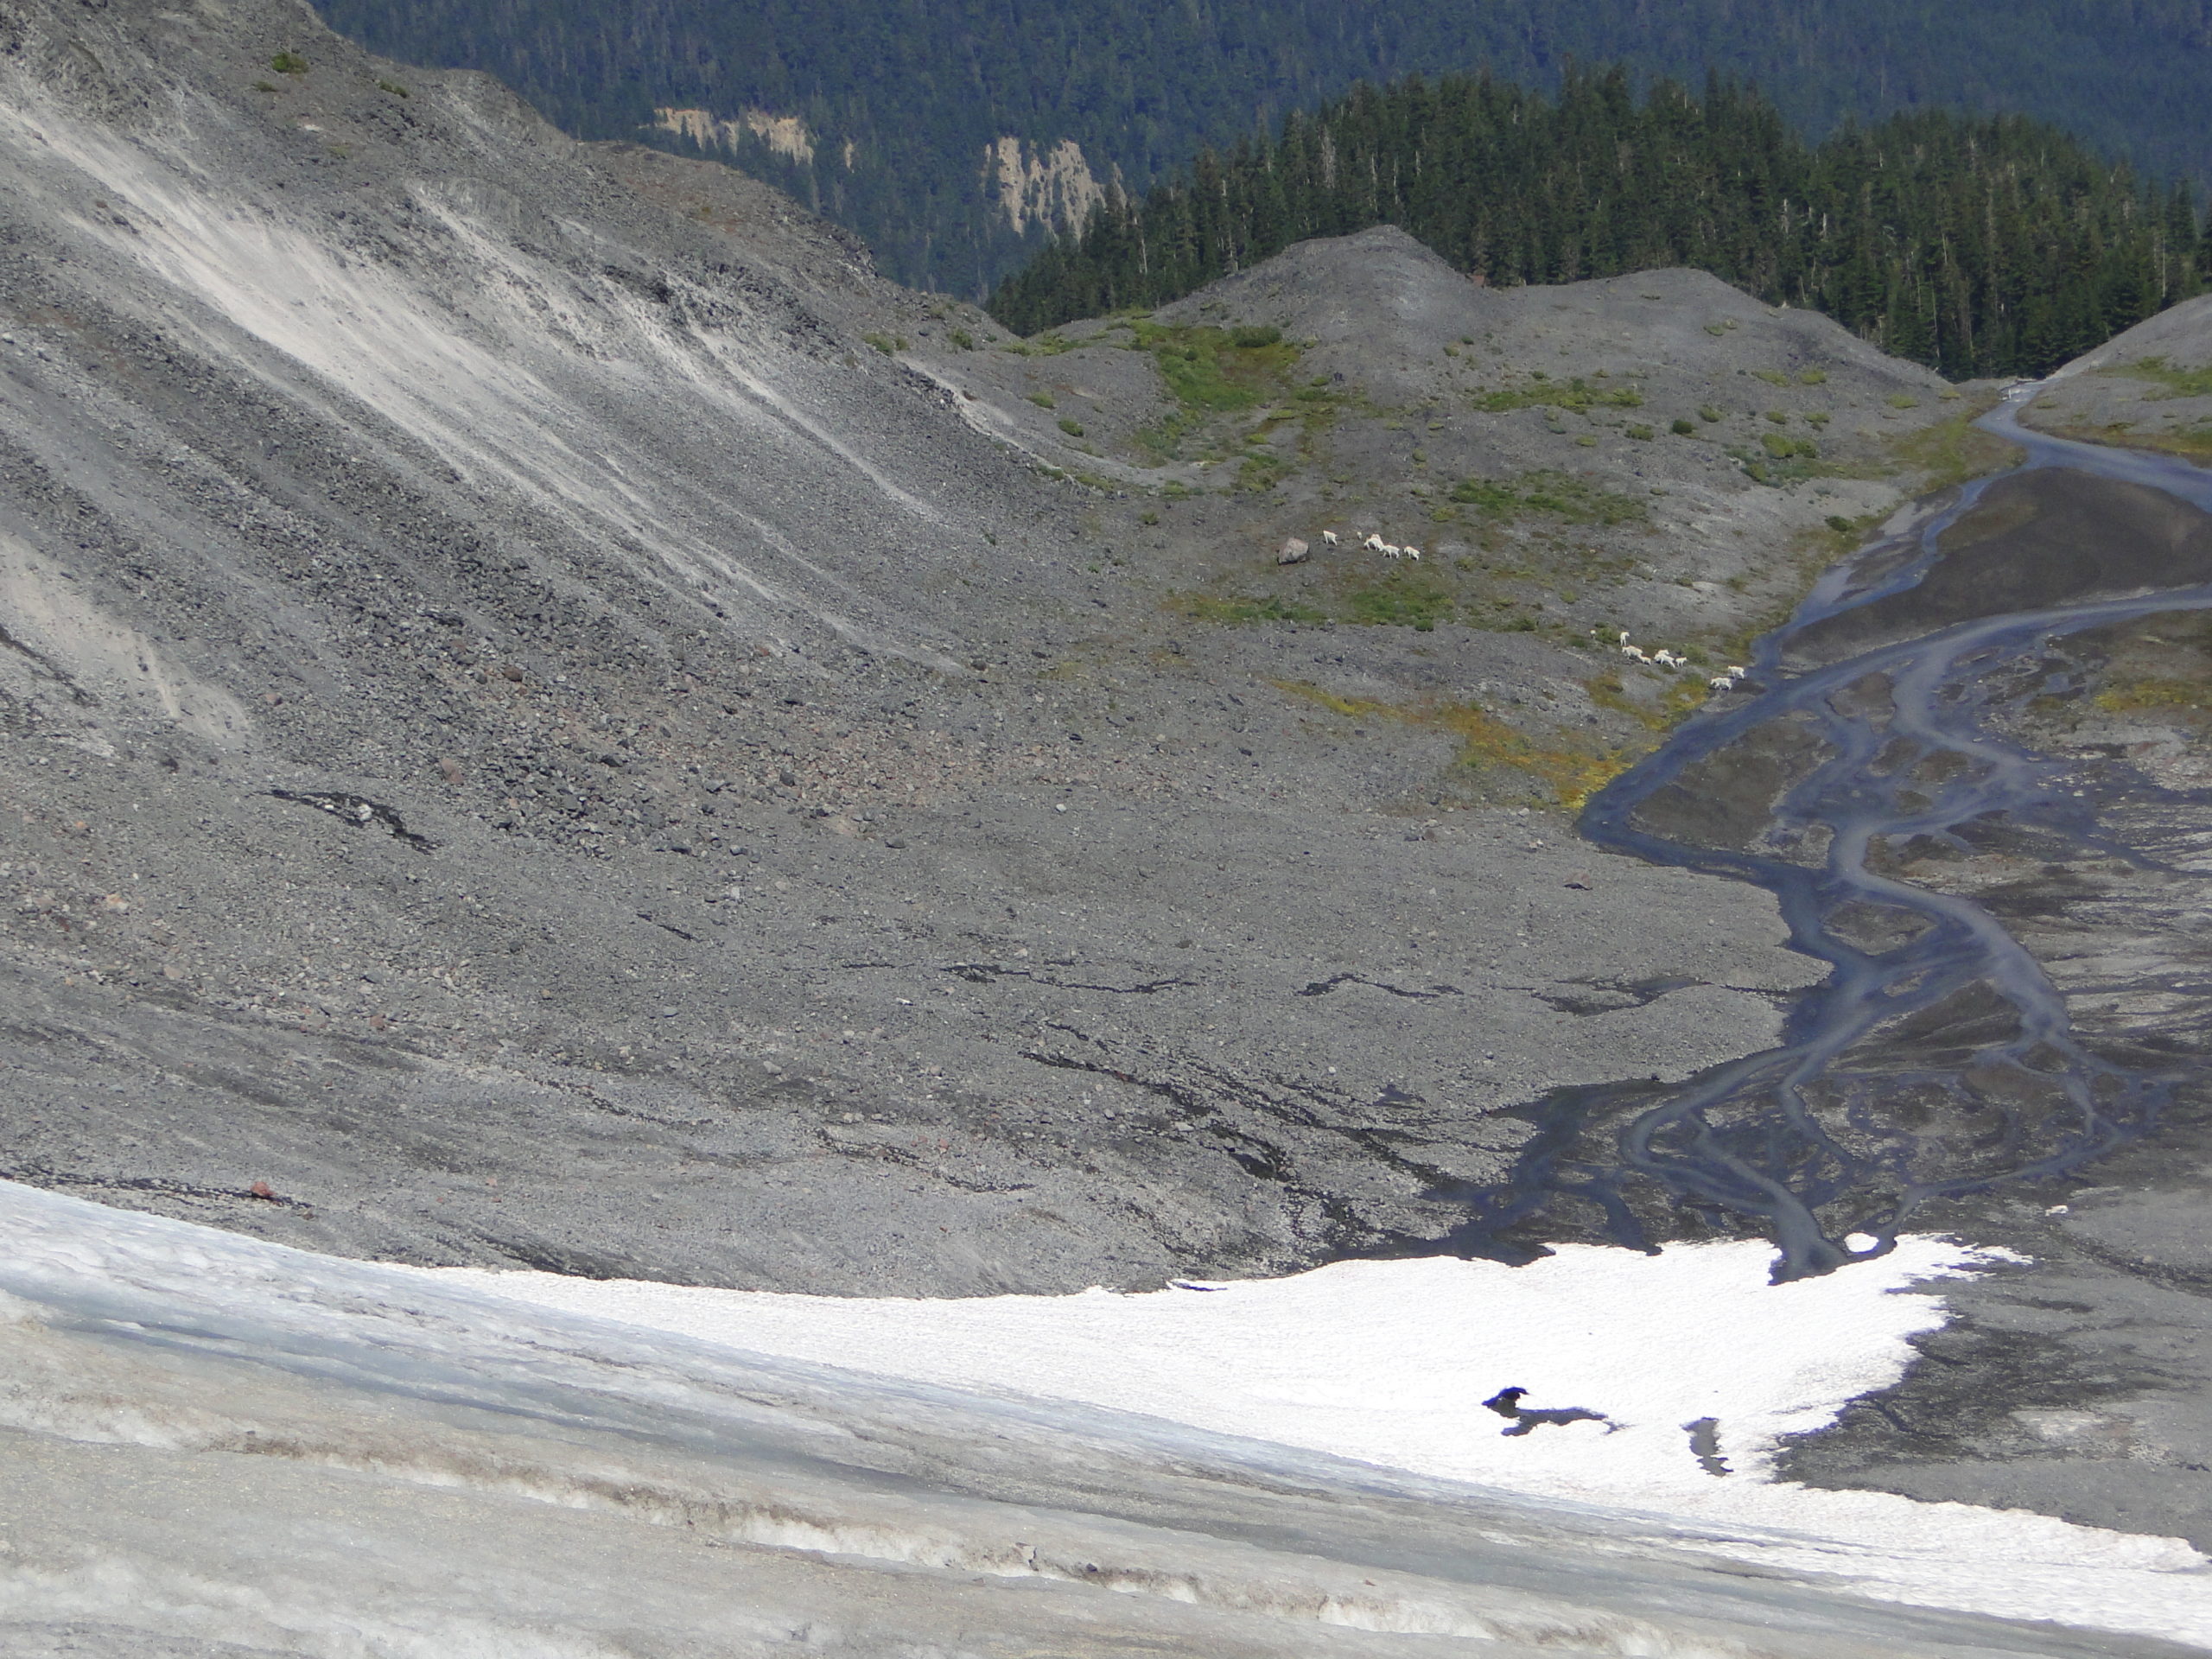
Sholes Glacier in 2021. The glacier has retreated 170 m from 1990-2021, the terminus in 1990 is approximately whre the goats are crossing the stream.
Hydrology downstream in Wells Creek and the North Fork Nooksack River is changing in part because of the changes in glacier runoff. Glacier runoff is a major source of streamflow during the summer low-flow season and mitigates both low flow and high water temperatures (Pelto, 2015). This is particularly true during summer heat waves, but this ability has been diminishing in the region (Moore et al 2020) For the last 37 summers we have been in the field monitoring North Cascade glaciers response to climate change including during heat waves (Pelto, 2018). In the last decade we have made synchronous observations of glacier ablation and stream discharge immediately below Sholes Glacier, Mount Baker (Pelto, 2015). This in conjunction with observed daily discharge and temperature data from the USGS stations on the ~6% glaciated North Fork Nooksack River (NFN) and the unglaciated South Fork Nooksack River (SFN), contrasts and quantifies the ameliorating role of glacier runoff on discharge and water temperature during 24 late summer heat wave events.
Measuring discharge below Sholes Glacier in 2016.
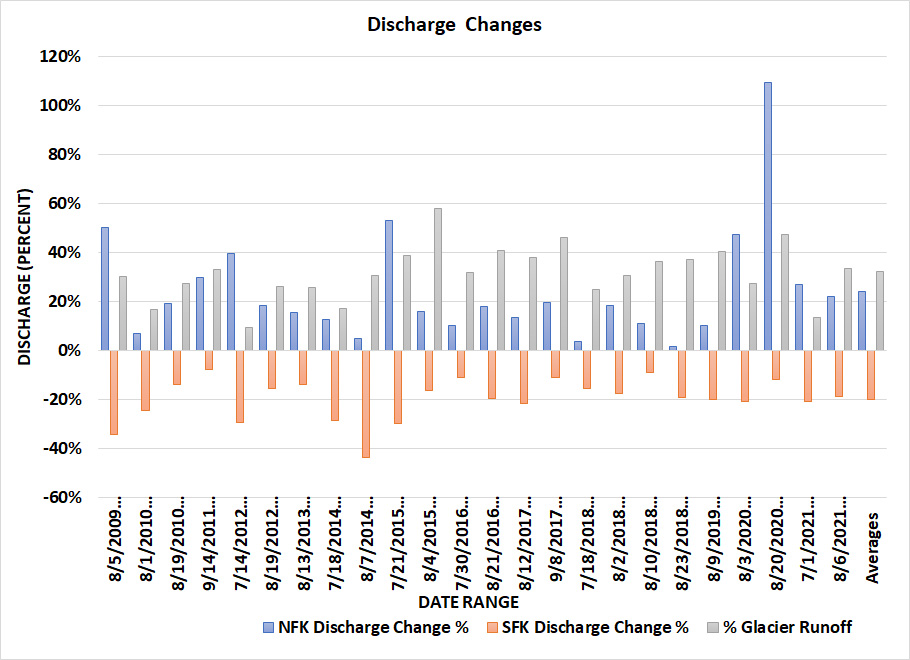
Sholes Glacier and ablation measurements on Sholes Glacier indicate daily ablation ranging from 5-6 cm/day, which for the NFN currently yields 9-11 cubic meters/second. This is 40-50% of the August mean discharge of 24 cubic meters/second, despite glaciers only covering 6% of the watershed. In the unglaciated SFN warm weather events generated a mean stream temperature change of +2°C, only 1 event in the NFN generated this rise and the mean was +0.7°C. Durng the June 2021 heatwave from June 21-29 maxium daily stream temperature in SFN warmed 3°C, vs 0.8°C for NFN. This illustrates that a greater proportion of snowmelt, which NFN recieves, has limited the temperature rise. Discharge rose at least 10% in 20 of the 24 events in the NFN with an average increase of 24%. In the SFN all 24 events led to a decreased discharge with an average decrease of 20%. The primary response to these summer heat waes is increased discharge in the heavily glaciated NFN, and increased stream temperature in the unglaciated SFN.
Discharge change during heat waves in South Fork (decreases) and North Fork Nooksack River (increases) above. Below temperature change during heat waves in South Fork (significant rise) and North Fork Nooksack River (small rise).
Glacier runoff is a product of glacier area and melt rate. Overall glacier runoff declines when area reductions exceed, ablation rate increases. This has already occurred in the NFN and now glacier runoff is declining (Pelto, 2015). The measured ablation rate is applied to glaciers across the NFN watershed, providing daily glacier runoff discharge to the North Fork Nooksack River. For the NFN glacier runoff production was equivalent to 34% of the total discharge during the 24 later summer heat wave events. As the glaciers continue to retreat the NFN will have a declining mitigation of heat waves for discharge and temperature and trend towards the the highly sensitive SFN where warm weather leads to declining streamflow and warming temperatures.
Nooksack Falls heavily glacier fed.
Aquatic ecology in glaciated watershed in turn is impacted. Glaciers are important in maintaining sufficient discharge and stream temperature that are critical for salmon in the North Fork Nooksack. Some cold-water trout and salmon species are already constrained by warm water temperatures and additional warming will result in net habitat loss (Isaak et al 2012). In the Fraser River and Thompson River, BC fish community thresholds were obsrved for mean weekly average temperatures of about 12°C and again above 19°C (Parkinson et al 2015). Below 12°C the community were characterized by bull trout and some cold water species, between 12°C and 19°C by salmonids and sculpins and above 19°C by minnows and some cold water salmonids (Parkinson et al 2015). These thresholds indicated small temperature changes can be expected to drive substantial changes in fish communities. During the 24 warm weather events noted in the North Fork only two events exceeded 12°C, while in the South Fork 15 of the events exceeded 19°C. This suggest that both rivers are near a threshold that could alter the fish community.
In the North Fork Nooksack the number of returning chinook is divided into natural and hatchery spawned salmon. The Chum and Coho salmon data for the Nooksack River during the 1999-2013 interval indicate there are two salmon population peaks for each species. The early peak is in 2002 and the second peak occurs in 2010 (Washington Dept. Fish & Wildlife, 2020). Overall numbers have not sustained an increase and remain endangered.
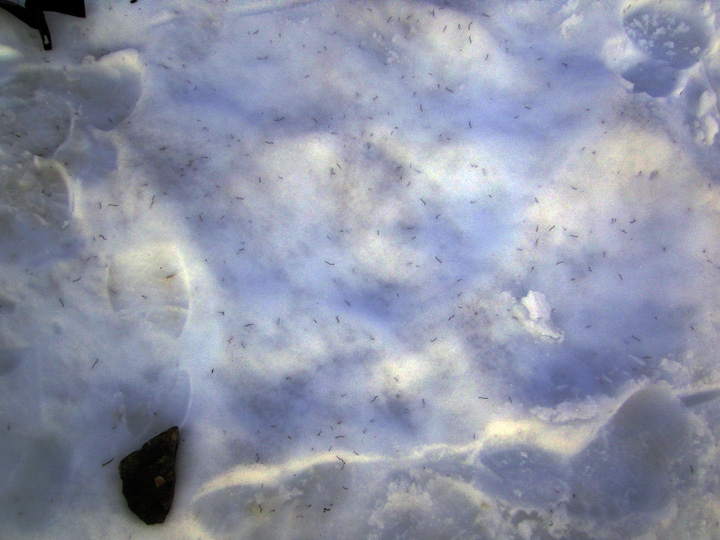
Ice Worm counts as the sunsets, 110 worms per square meter.
The climatology and glaciology has been difficult for ice wormology On the glacier itself ice worm population density surveys conducted annually indicate the density of ice worms has decreased since 2000 and that even 10 m beyond the edge of the glacier on snowpack they do not exist. This combined with the reduction in glacier area indicate population decline of ice worms.
In 2009 we observed the largest goat herd 62 goats (13 kids), some of them seen here below Sholes Glacier.
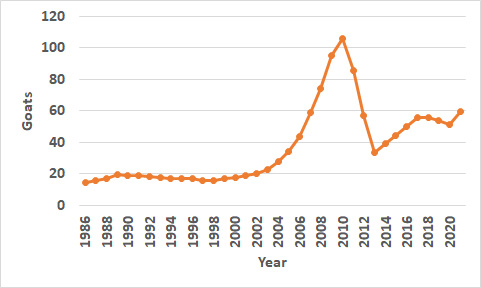
The climatology has been more favorable in terms of Goatology.We have conducted annual mountain goat surveys in the Ptarmigan Ridge-Sholes Glacier region each years since 1984. Populations stayed steady from 1984-2000, before rising dramatically through 2010. The difficult winters of 2011 and 2012 reduced the population, followed by a recovery up to 2021.
Three year running mean of mountain goat census conducted each summer while we are working on Ptarmigan Ridge, Sholes Glacier and Rainbow Glacier.
Jackson and Blackfoot Glacier in late August and early September Sentinel 2 false color images. Point A indicates exposed ice showing annual layers. Point B indicates exposed firn that had been retained through previous summers. The gray color of the firn indicates how dirty it is and that its albedo would enhance melting. The yellow arrow indicates the one patch of retained snow in 2021 on Blackfoot Glacier with no retained snow on Jackson Glacier.
The exceptional heat of the summer of 2021 across glaciated mountain ranges of the Pacific Northwest, reduced snowcover extent from Mount Shasta, CA north to Mount Baker, WA and west to Kokanee Glacier, BC and Bonnet Glacier, Alberta. In Glacier National Park, Montana retained snowcover by the end of summer in 2021 is the lowest observed on Blackfoot and Jackson Glacier. Snowcover extent in late summer is a good indicator of glacier mass balance, which controls changes in glacier volume/glacier area (Pelto, 2019). Here we examine the percentage of Blackfoot and Jackson Glacier that have a persistent accumulation zone from 1998-2021.
The USGS in Glacier National Park has over the last 15 years maintained an extensive glacier monitoring program including consistent mass balance observations on Sperry Glacier, and repeat mapping of the 37 named glaciers, 25 of which still qualify as glaciers. The repeat mapping indicates the area lost from 1966 to 2015, (USGS, 2017). There is considerable variation between glaciers, some have lost more than 80% of their area and others have lost less than 20% during this 50 year period. Blackfoot Glacier is the second largest glacier in Glacier National Park in Montana. Jackson Glacier the seventh largest. The USGS identified the area of Blackfoot Glacier in 2015 as 1.5 km2, a reduction of 18% from 1966-2015 (USGS, 2017). Jackson Glacier had an area of 0.8 km2, losing 40% of its area from 1966-2015. Extrapolating area loss to determine when a glacier will disappear, is typically not a useful approach. Glaciers that lack a persistent accumulation zone cannot survive current conditions (Pelto, 2010). Other glaciers may have a persistent accumulation even if small that allows them to persist.
In 2005 a year of mass balance loss in the region the retained area of accumulation in late August on Blackfoot Glacier was ~60% and Jackson Glacier ~40%. The retained area of accumulation in mid-August of 2015 was ~60%, on Blackfoot Glacier and Jackson Glacier 30-40%. In September 2019 at the end of the melt season an accumulation area covered 10-15% of Jackson and 20% of Blackfoot, the lowest observed since at least 1998. In early September 2020 as summer ended both glaciers had an accumulation area ratio of ~40%. The higher typical end of. summer snowcover extent on Blackfoot Glacier explains why area loss has been less in recent decades..
The June-August 2021 period was the warmest of the 127 period of record for the Western Montana climate division (NOAA, 2021). The result was that by the end of August 2021 0n Aug. 30 less than 5% of Jackson and ~10% of Blackfoot had retained snowcover. By September 6, 2021 Jackson Glacier had no significant snowcover and Blackfoot Glacier had less than 10% remaining. Both of these are minimum values indicating large mass balance losses for both glaciers in 2021, likely over 2 m as has been observed to the north on Kokanee Glacier, BC and to the west on Easton Glacier, Mount Baker, WA. There is considerable exposed firn on both glaciers, snow that was retained in recent years, indicative that the glacier had been stripped of more snowcover than other years. The gray color of the firn indicates it is dirty, which will enhance melting.
Jackson and Blackfoot Glacier in late early September of 2019 and 2020 Sentinel 2 false color images. Point A indicates areas of retained accumulation. layers. Point F indicates exposed firn that had been retained through previous summers.
Blackfoot Glacier (B) and Jackson (J) Glacier snowpack in 2005 and 2015.
The southwest side of Kokanee Glacier from the ridge with Cond Peak at the Right and Sawtooth Ridge at center.
By Ben Pelto, PhD, UBC Mitacs Elevate Postdoctoral Research Fellow
Since 2013 I have been working on the Kokanee Glacier. Located just outside of Nelson in southeastern British Columbia (BC), the Kokanee Glacier is due north of the Washington-Idaho border. This work began as part of a five-year study of the cryosphere in the Canadian portion of the Columbia River. This project was carried out by the Canadian Columbia River Snow and Glacier Research Network — spearheaded by the Columbia Basin Trust. The glacier research, which included the Kokanee Glacier, was led by my former PhD supervisor at the University of Northern British Columbia Dr. Brian Menounos and myself. At the culmination of the project, we published a technical report, and a plain language summary of that report. When the five-year project officially ended in 2018, I learned of a BC Parks program called Living Labs, which offers funding for climate change research in BC Parks, particularly research which documents change and guides protected area management. With Living Labs funding in 2019-2021, I have kept the annual mass balance trips going — now a continuous nine-year record — and a winter mass balance trip in 2021. In conjunction with this, Brian Menounos has secured continued funding (continued from our 5-year project) from BC Hydro for LiDAR surveys of the glacier every spring and fall. These surveys are carried out by the Airborne Coastal Observatory team from the Hakai Institute.
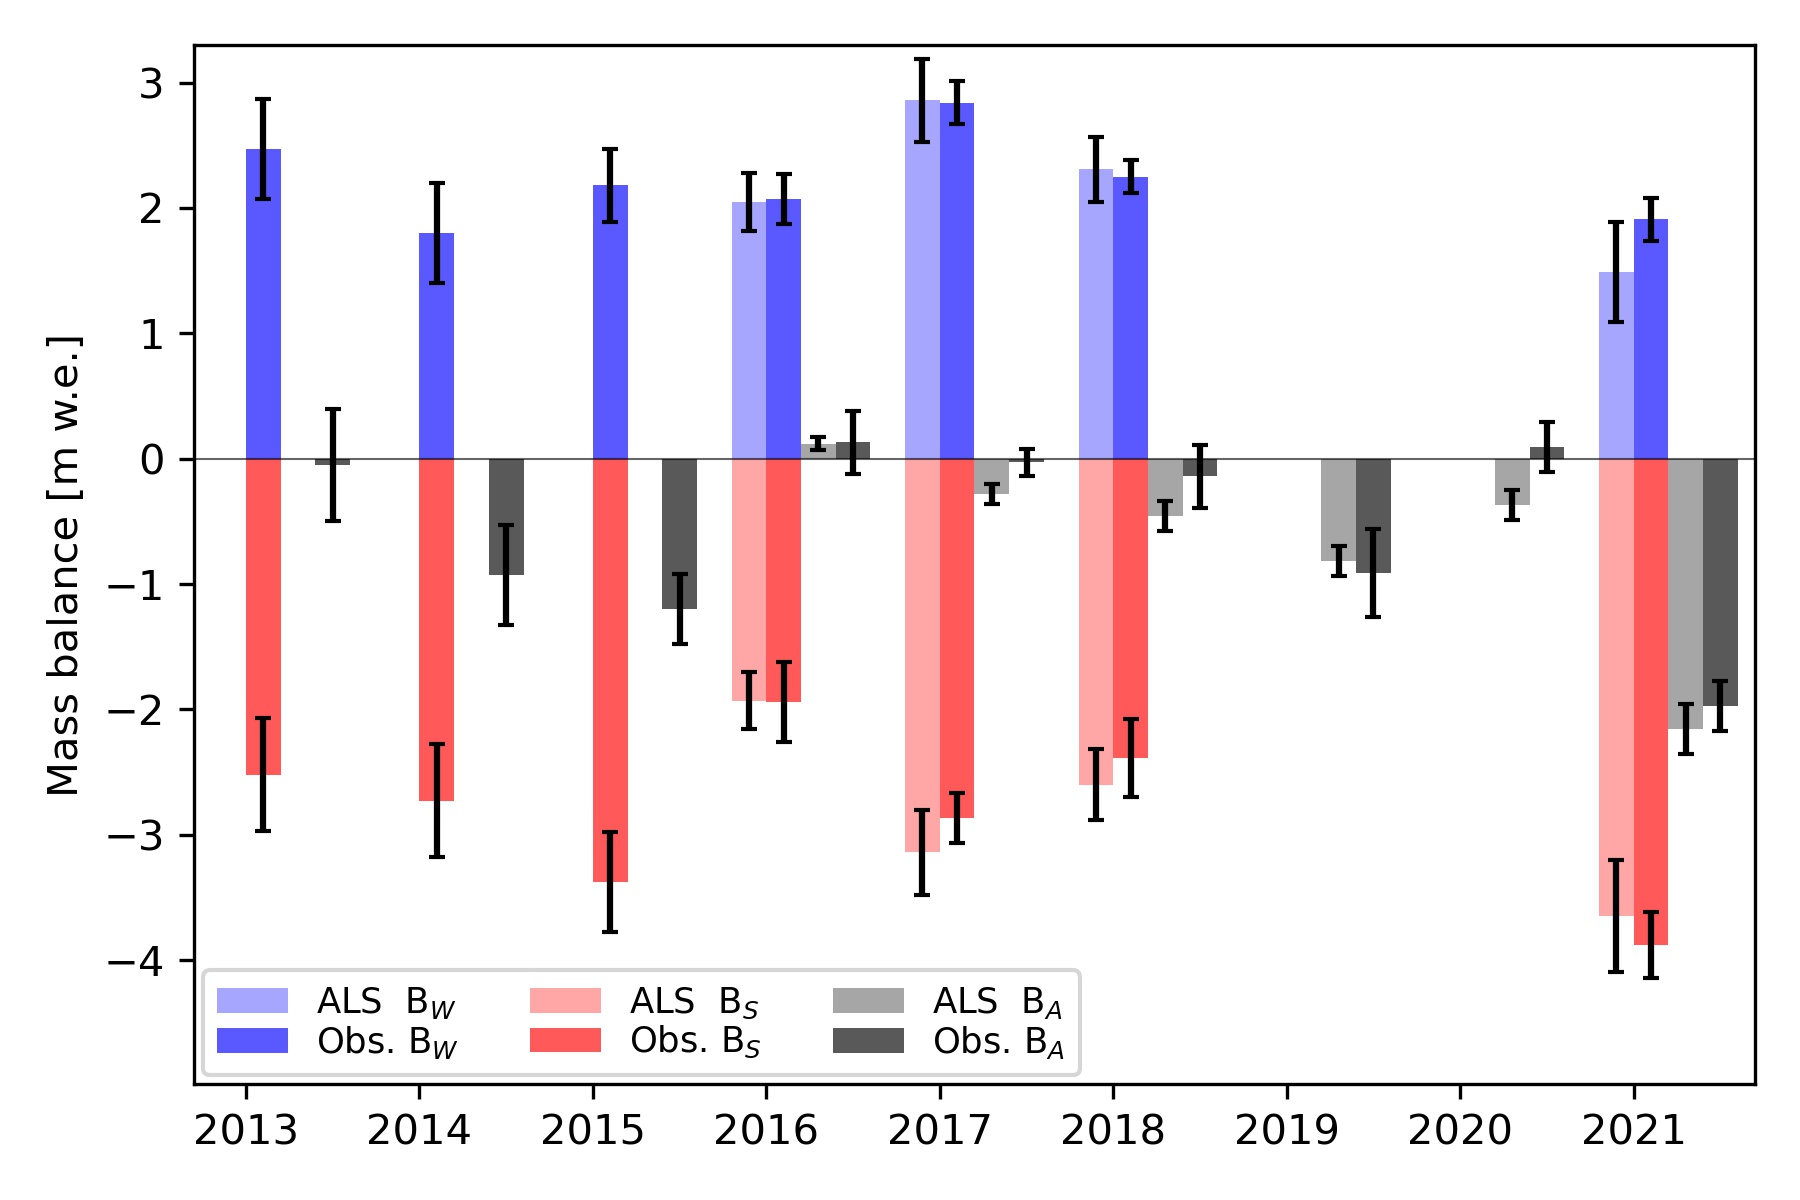
During the 2021 spring trip, we found that the Kokanee Glacier had an average snow depth of 4.4 meters. Using snow density measurements collected with a snow-corer, we found that the winter balance for 2021 was 1.91 meters water equivalent (m w.e.). This value was lower than the 2013-2020 average of 2.18 m w.e. (Pelto et al. 2019).
Ali Schroeder probing snow depth on the Kokanee Glacier while Joel McBurney and Drew Copeland look on.
Ben Pelto with the snow corer with Tom Hammond and Micah May on Kokanee Glacier. Photo: Jill Pelto
With a below average winter balance, 2021 would need to feature a cool summer. Instead, multiple heat waves occured, with temperature records being broken across the province. Wildfires burned all over BC and the neighboring US states of Washington and Idaho, swamping the region in smoke for weeks on end. Rather than mitigate for a slightly-below-normal snowpack on the Kokanee, summer 2021 took a blow-torch to glaciers across the region.
We hiked into the Kokanee Glacier on September 12, stopping under a boulder to wait out proximal booms of thunder and flashes in the clouds. We got pelted with bursts of both hail and graupel, and soaked in the rain, before gingerly working our way up boulder field and talus that is climbers route up the Keyhole to the Kokanee Glacier. Like the satellite imagery had shown, there was no snow in sight on the glacier — bare ice only. Instead of my usual camp on the snow, we chose a climbers bivy site to set our tent.
Camp in the Keyhole — a total lack of snow forced us to skip camping on-glacier.
The Keyhole route, a challenging scramble with 43 lb packs.
Stepping out onto the glacier, we immediately ran into difficult terrain, crevasse bridges of snow or firn had collapsed, leaving bedroom-width crevasses gaping open, necessitating an exercise in maze navigation. Our first stop was a stake at 2600 m which typically retains snow (50 to 100 cms), but this year had lost 1.6 meters. In fact, two stakes drilled at the site in 2015 and subsequently buried by snow had melted out, demonstrating that all snow/firn from the intervening years had been lost. This observation clued me in to the magnitude of melt to expect this year.
The first stake visited, showing 1.6 m of melt
Exposed layers of firn in a crevasse by the stake, showing 1.5 m-thick annual layers — now being eaten away by melt.
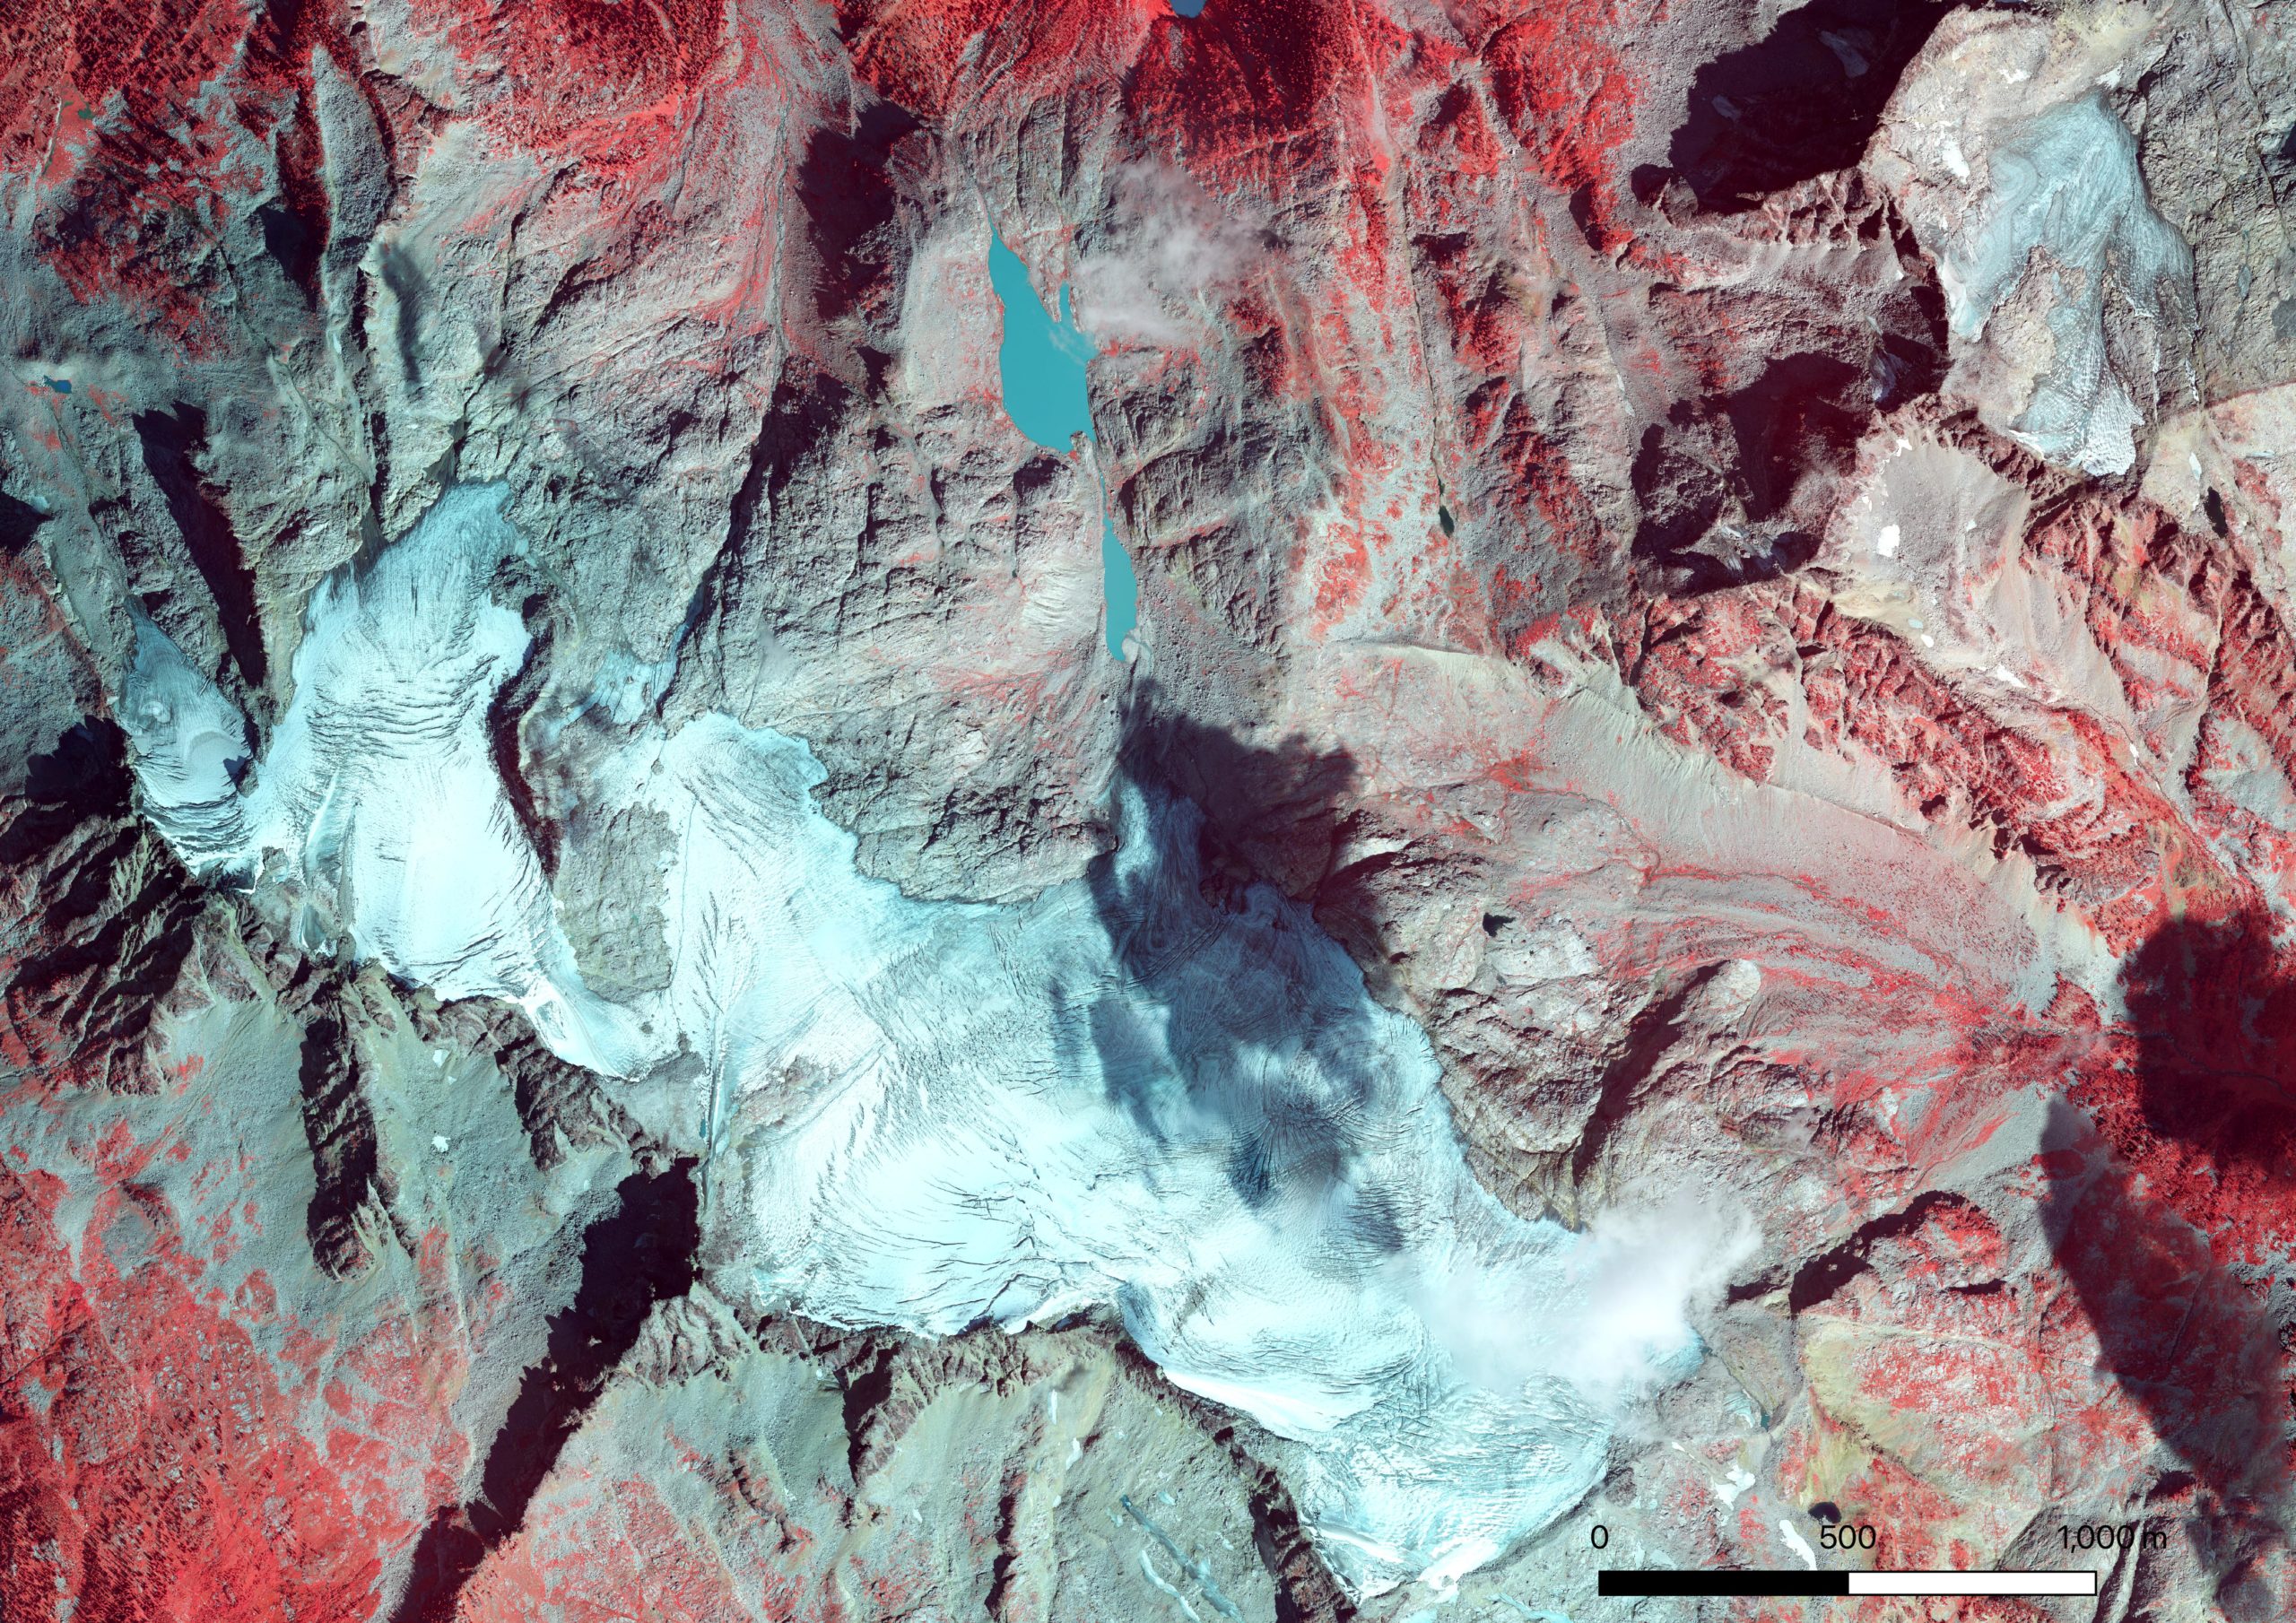
Travel on the glacier was more challenging in spots, but overall faster, as the total lack of snow meant that most crevasse bridges were gone, requiring less probing of crevasse bridges and roped-travel. Later, using a satellite image from the dates of our visit, I mapped the retained snow cover, limited to two tiny patches high on the glacier’s east side. The accumulation area ratio (AAR), or the ratio of snow cover to bare ice/firn was <0.01, meaning that under 1% of the glacier was covered in snow.
The upper reaches of Kokanee Glacier to Cond Peak (2800 m) with no retained snow in 2021. Bare ice is exposed on the lower half of the image, and firn, or multi-year snow above
The brown surface is multi-year firn, exposed by the loss of snow. In a typical year, the snow line would be visible here. The white surface below the brown is bare glacier ice.
Near infrared-Red-Green 30 cm resolution ortho image of Kokanee Glacier from the Hakai Geospatial/ACO team on Sept. 2, 2021. Note how badly crevassed the glacier is, most crevasses are exposed with no retained snow. The white color and mottled appearance over the upper glacier is a skiff of overnight snow just a few centimeters thick that melted off the next day. Also note bare ice patches exposed under formerly perennial snow patches that have shrunk in recent years and now are disappearing.
Visiting the toe of the glacier, our lowest stake indicated just under 5 m of ice melt, double that of 2020. In May, this location had 3 m of snow; the combined melt of snow and ice (loss of winter snow and glacier ice) is termed the summer mass balance, and at this site was -6.2 m w.e., far higher than the usual -4 m w.e. I also noticed that much of the thin ice along the margin of the toe was gone, and a little rock nunatak (rock island) that appeared in 2015 (images below) became a bite out of the glacier rather than a island. We estimated that the toe experienced 60 m of retreat. Over the past 5 years, the Kokanee has lost an average of 16 m in length annually. Expecting to see above average thinning and retreat, I was still startled to see how diminished and thin the toe looked.
2015: a small hole forms in the glacier margin above the toe, Jesse Milner in the foreground
2021: the hole is now a bite out of the glacier with two prominent rock knobs
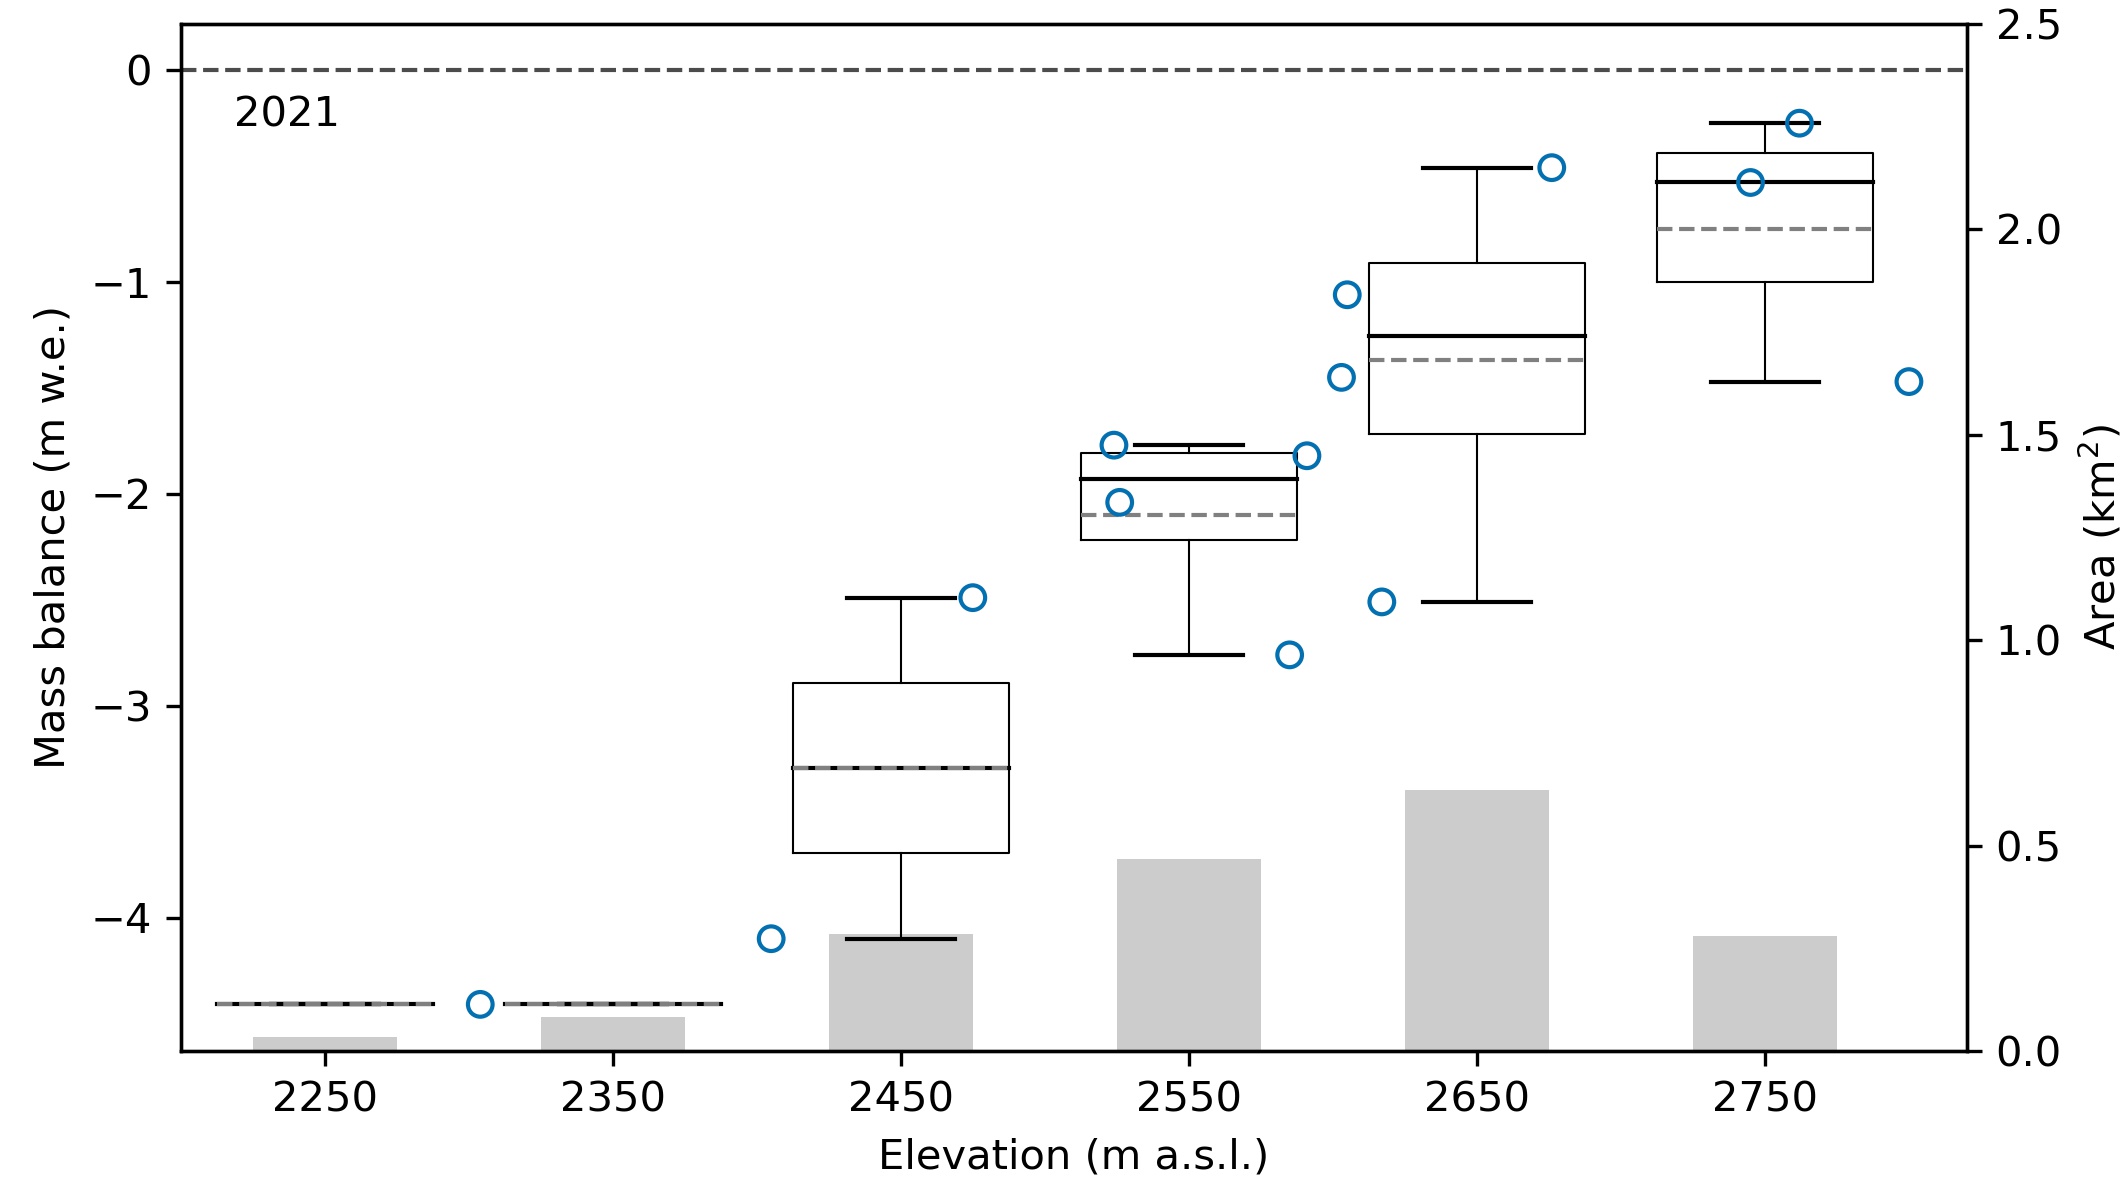
A week prior to my field visit, the Hakai Institute ACO team flew a LiDAR survey of the Kokanee Glacier as part of their work with Brian Menounos at UNBC. Comparing this year’s glacier surface with that from last year’s survey, Brian found a whopping 2.55 m of thinning. After mapping the glacier facies (ice/firn/snow) to represent on the density of the observed thinning, this equates to a glacier mass balance of -2.16 m w.e., higher than the previous record loss of -1.20 m w.e. in 2015.
LiDAR-derived height change 2020 to 2021 from 1 m resolution DEMs from Brian Menounos and the Hakai Institue ACO team. The black line is the 2021 glacier outline, note the bite out of the glacier above the toe to the NE corner of the glacier. Small red patches off-ice are seasonal snow patches losing mass. Points represent mass balance observation locations.Kokanee Glacier terminus from 2015 to 2021. 140 meters of retreat for 23 m/yr. Data in the GIF are from Hakai Institute and Brian Menounos of UNBC ACO glacier surveys.
Back home, I crunched the numbers from our glaciological observations of mass balance (consisting of 14 ablation stakes this year) and calculated a mass balance of -1.97 m w.e. With Brian, I published a paper in 2019 (Pelto et al. 2019) comparing glaciological (field) and geodetic (LiDAR) mass balance estimates and found them to be similar — if some factors like snow and firn density were carefully considered. The small difference between estimates is likely due to timing (the LiDAR mass balance is from 8/26/2020 to 9/3/2021, while the field mass balance is 9/12/2020 to 9/13/2021), and that there was a skiff of fresh snow (likely 5-10 cms) on the glacier during the 2020 LiDAR survey.
Kokanee 2021 glacier mass balance. Blue dots are observations. The boxplots show the 100 m bins used to estimate glacier-wide mass balance (median line in black, mean dashed grey line). The grey bars depict the area of the glacier for each 100 m elevation-bandSeasonal and annual mass balance for Kokanee Glacier from LiDAR and glaciological measurements for each balance year from 2013 to 2021 with 2σ uncertainties.
In 2017, I visited the Kokanee Glacier to measure it’s ice thickness using ice-penetrating radar. I found that the glacier on average was 43 m thick using my measurements to tune a glacier model. I published these results in the Journal of Glaciology (Pelto et al. 2020). In the five years since that work, the glacier has lost over 4.8 m of total thickness. That equates to a loss of over 11% of its total volume. 2021 alone wasted away 6% of the glacier’s total volume — an eye-watering number for a single year.
Cumulative mass balance for Kokanee Glacier 2013-2021 from both field and LiDAR measurments. LiDAR-derived mass balance began in 2016.
The heat of 2021 was an outlier, but years like 2021 and 2015 take a toll on the glaciers. Currently, glaciers in western North America are losing around 0.75 m of thickness per year (according to my work in the Columbia Basin (Pelto et al. 2019) and work by Brian Menounos for all of western North America (Menounos et al. 2018)). The better years for Kokanee Glacier (2016 mass balance: +0.12 m w.e.) pale in comparison. That meager surplus was lost the very next year (2017).
Herein lies the issue, positive mass balance years in recent decades are not large enough to offset even average years; hot dry summers take years off the lifespan of glaciers across western North America.
Losing 6% of it’s total volume in 2021, the best we can hope for Kokanee Glacier is a few near-neutral or positive mass balance years to cover back up the exposed firn, to keep the glacier albedo from becoming too dark and increasing the rate at which ice can melt.
Bonnet Glacier in Sentinel 2 images indicating the emergence of bedrock due to thinning in the former accumulation zone, Point A. Note the lack of retained snowcover in both years with at least a month left in the melt season.
Bonnet Glacier, Alberta drains north from Bonnet Peak in the Sawback Range 30 km east of the Rocky Mountain Crest. It is at the headwaters of Douglas Creek that feeds into the Red Deer River. In 2017 we reported on the formation of new alpine lakes and the 900 m retreat of the glacier, 20% of its length, from 1987-2016 (Pelto, 2017). Here we examine changes from 1987-2021, including developments in the accumulation zone that provide a future forecast. An inventory 0f glaciers in the Canadian Rockies indicated area loss of 15% from 1985 to 2005 (Bolch et al, 2010), with Alberta glaciers losing area at a higher rate. Tennant et al (2012) noted that from 1919-2006 the glaciers in the central and southern Canadian Rocky Mountains lost 40% of their area. Of the 523 glaciers they observed 17 disappeared and 124 separated. Columbia Icefield, 125km northwest, lost 23 % of its area from 1919-2009 (Tennant and Menounos, 2013).
In 1987 and 1990 the accumulation zone is limited to upper periphery of Bonnet Glacier. In 2015 and 2016 the accumulation zone is restricted to the northeastern periphery. This is indicative of a glacier without a significant persistent accumulation zone. The consistent mass loss is driving the retreat and glacier thinning. In 2018 in the midst of what had been the accumulation zone a small area of bedrock has emerged at Point A. By 2021 this area has expanded substantially with the two bedrock areas poised to merge soon. This thinning in the midst of the former accumulation zone is indicative of a glacier that cannot survive (Pelto, 2010). In 2015, 2018 and 2021 the accumulation area ratio was between 10-15%, a value that typically results in glacier annual mass balance of more than -2 m. The area of main proglacial expanded 50% from 2016 to 2021 to 0.33 square kilometers.
Bonnet Glacier in Landsat images from 1987, 2016 and 2021 indicating retreat. Red arrows indicate 1987 margin, yellow arrows 2016 and the green arrow 2021. Point A indicates the emerging bedrock.
Bonnet Glacier in Landsat images from 1990, 2015 and 2021 indicating retreat. Purple arrows indicate lakes that have formed due to retreat. Point A indicates the emerging bedrock.
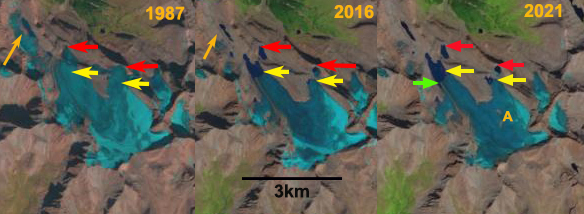
Southeast #3 Glacier, Devon Ice Cap in July 9, 2016 and August 29, 2021 Sentinel 2 images of the lower 10 km showing three supraglacial streams S1, S2 and S3 and the outlet plumes of each stream at Point 1-3. The yellow line is the 2016 margin.
The southeast sector of the Devon Ice Cap, Devon Island, Nunavut has three tidewater outlet glaciers Southeast Glacier #1, #2 and #3. Van Wychen et al (2017) indicate the dynamic discharge of the three at .06-.07 Gt per year, all three glaciers have been retreating during this period. Southeast #3 is between 0.01 and 0.02 Gt per year. Sharp et al (2011) note that increasing summer temperatures has led to increased mass loss on Devon Ice Cap. Here we examine retreat and the supraglacial stream networks using Landsat and Sentinel 2 imagery.
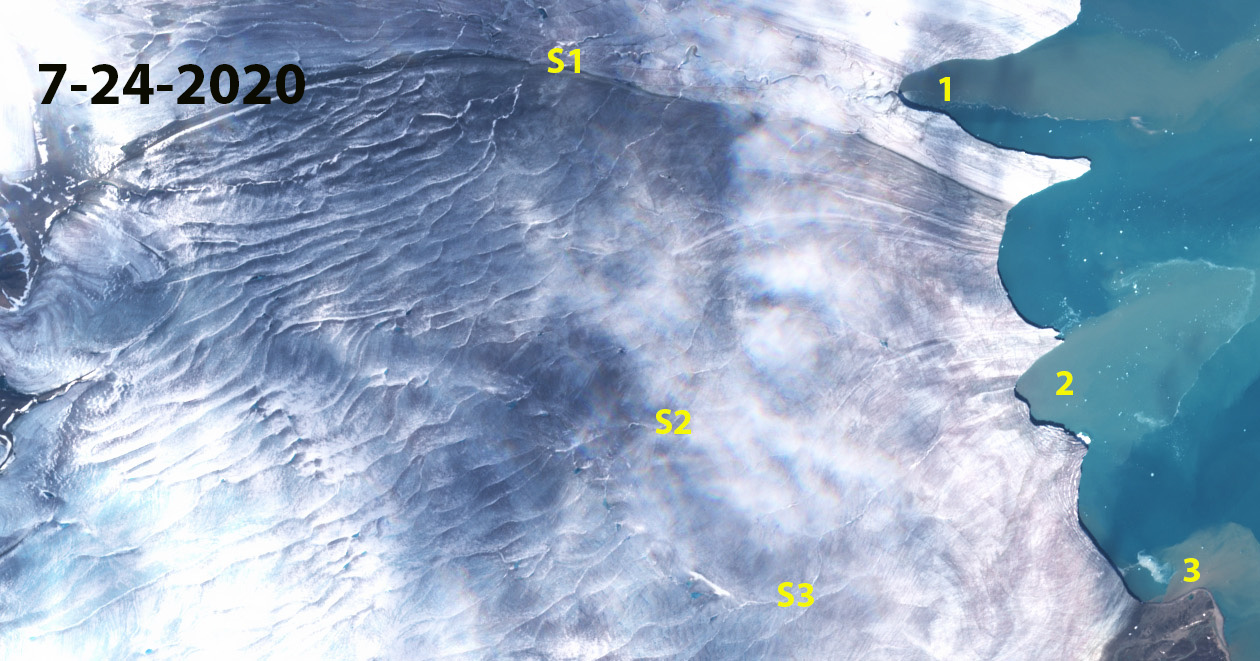
In 2002 the calving front of Southeast #3 Glacier extended north from with five distinct peninsulas of ice. The retreat by 2016 was more pronounced on the north south oriented southern portion of the front than the northwestern part. From 2016 to 2021 it is evident that the glacier front has receded, particularly at the prominent ice peninsulas evident in 2016. The retreat averages 600 m across the 5 km wide tidewater front seen above from 2016-2021. This is an addition to the 1200 m retreat from 2002-2016, while the northwestern section retreated ~500 m during the 2002-2021 period. S1, S2 and S3 indicates supraglacial stream drainages that exit the glaciers at Point 1-3 respectively. The plumes of sediment from these streams is evident in the July 24, 2020 image below from each of these surface outlet streams. The plumes are evident in the July 2016 image, but no the late August image of 2021. The lack of plumes on 8-29-2021 indicate the lower melt rates that are typical of late August. The stream network has become more prominent as melt rates have led to greater flow and more incising into the ice.
This retreat has occurred during the same period that was noted as generating three new islands in 2018 on the northeast margin of the Devon Ice Cap. Noel et al (2018) observe that this is part of a trend seen across Canadian Arctic ice caps have been losing mass for decades and that mass loss accelerated in 1996.
July 24, 2020 Sentinel 2 image of the lower 10 km of Southeast #3 Glacier showing three supraglacial streams S1,S2 and S3 and the outlet plumes of each at Point 1-3.
Southeast #3 Glacier in 2002 and 2021 Landsat images. Yellow dots indicate the 2002 margin of the glacier.