Adams Glacier, Washington 50% area loss since 1998, No retained Snow in 2021

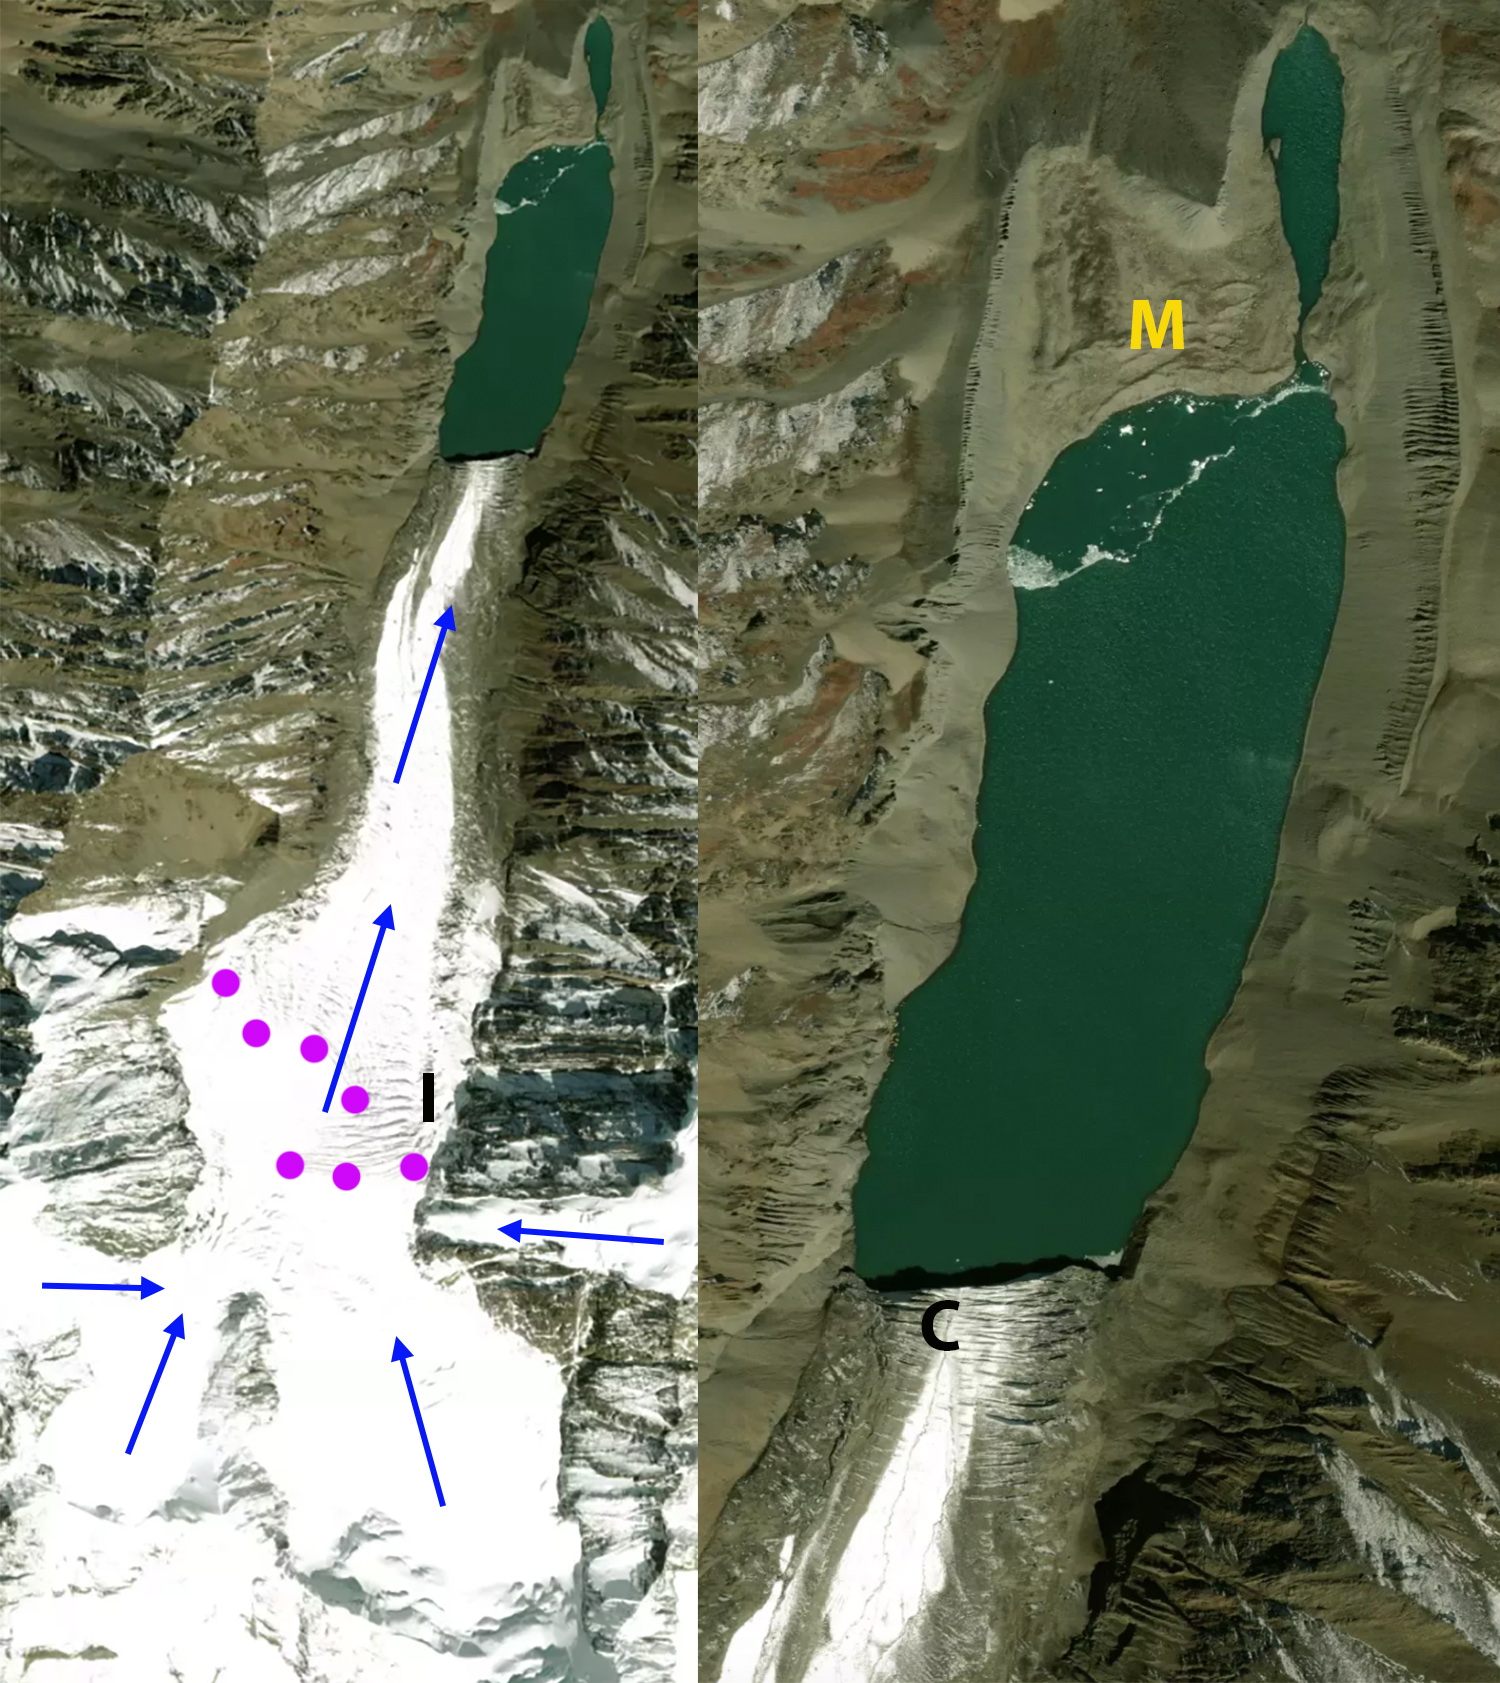
Adams Glacier in Sentinel 2 False Color image from 8-30-2021. Green dots indicate margin of the Adams Glacier and the now separated Adams Outlier section. The pink arrows indicate the top and bottom of the icefall. F=regions of exposed firn, A=areas of perennial retained accumulation. 

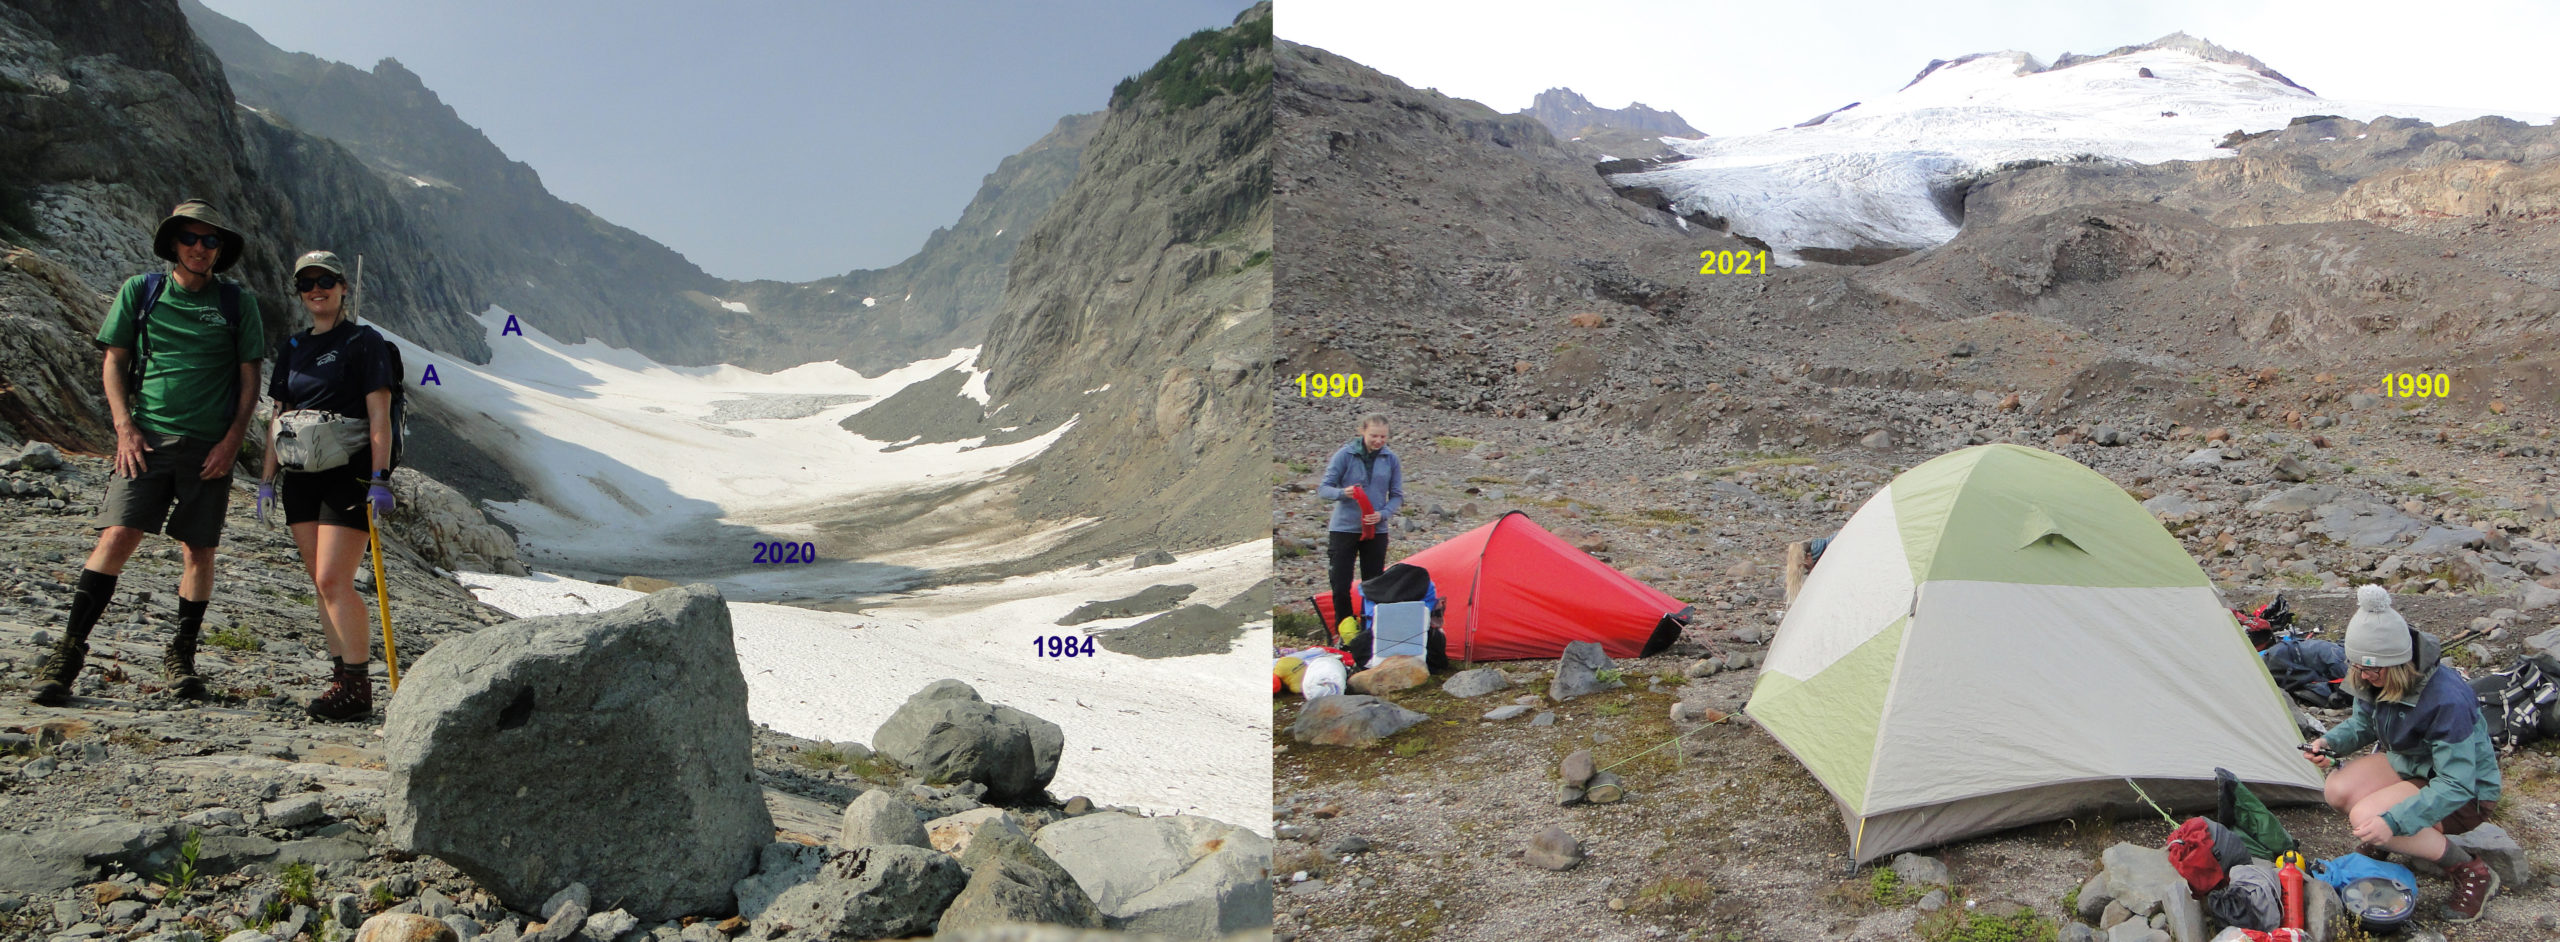
Adams Glacier descends the north side of Mount Adams a 3743 m stratovolcano in the Cascade Range of Washington.  The glacier begins from the summit plateau between 3600 m and 3700 m, before descending a steep icefall down to 2750 m and then diverging on lower slopes terminating at 2225 m. Sittts et al (2010) mapped the area change of Mount Adams glaciers from 1904 to 2006.  The area was 6.93 km2 in 1904 declining to 5.16 km2 by 1969, 4.62 km2 by 1998, and 3.68 km2 in 2006. This decline since 1969 has been due largely to increased summer temperatures (Sittts et al 2010) .  Here we examine the impact of the particularly warm summer of 2021 on snowpack, glacier volume and reassess the area of the glacier. The winter of 2021 had above average snowfall with 157% of the mean peak winter snowpack in April at the nearest Snotel site at Potato Hill ( 1375 m), the snowpack loss date after a dry May was the same as usual, see figure below.  The mean June-August temperature at the Mount Adams Ranger Station (600 m) was the second warmest for the 1984-2021 period to 2015.

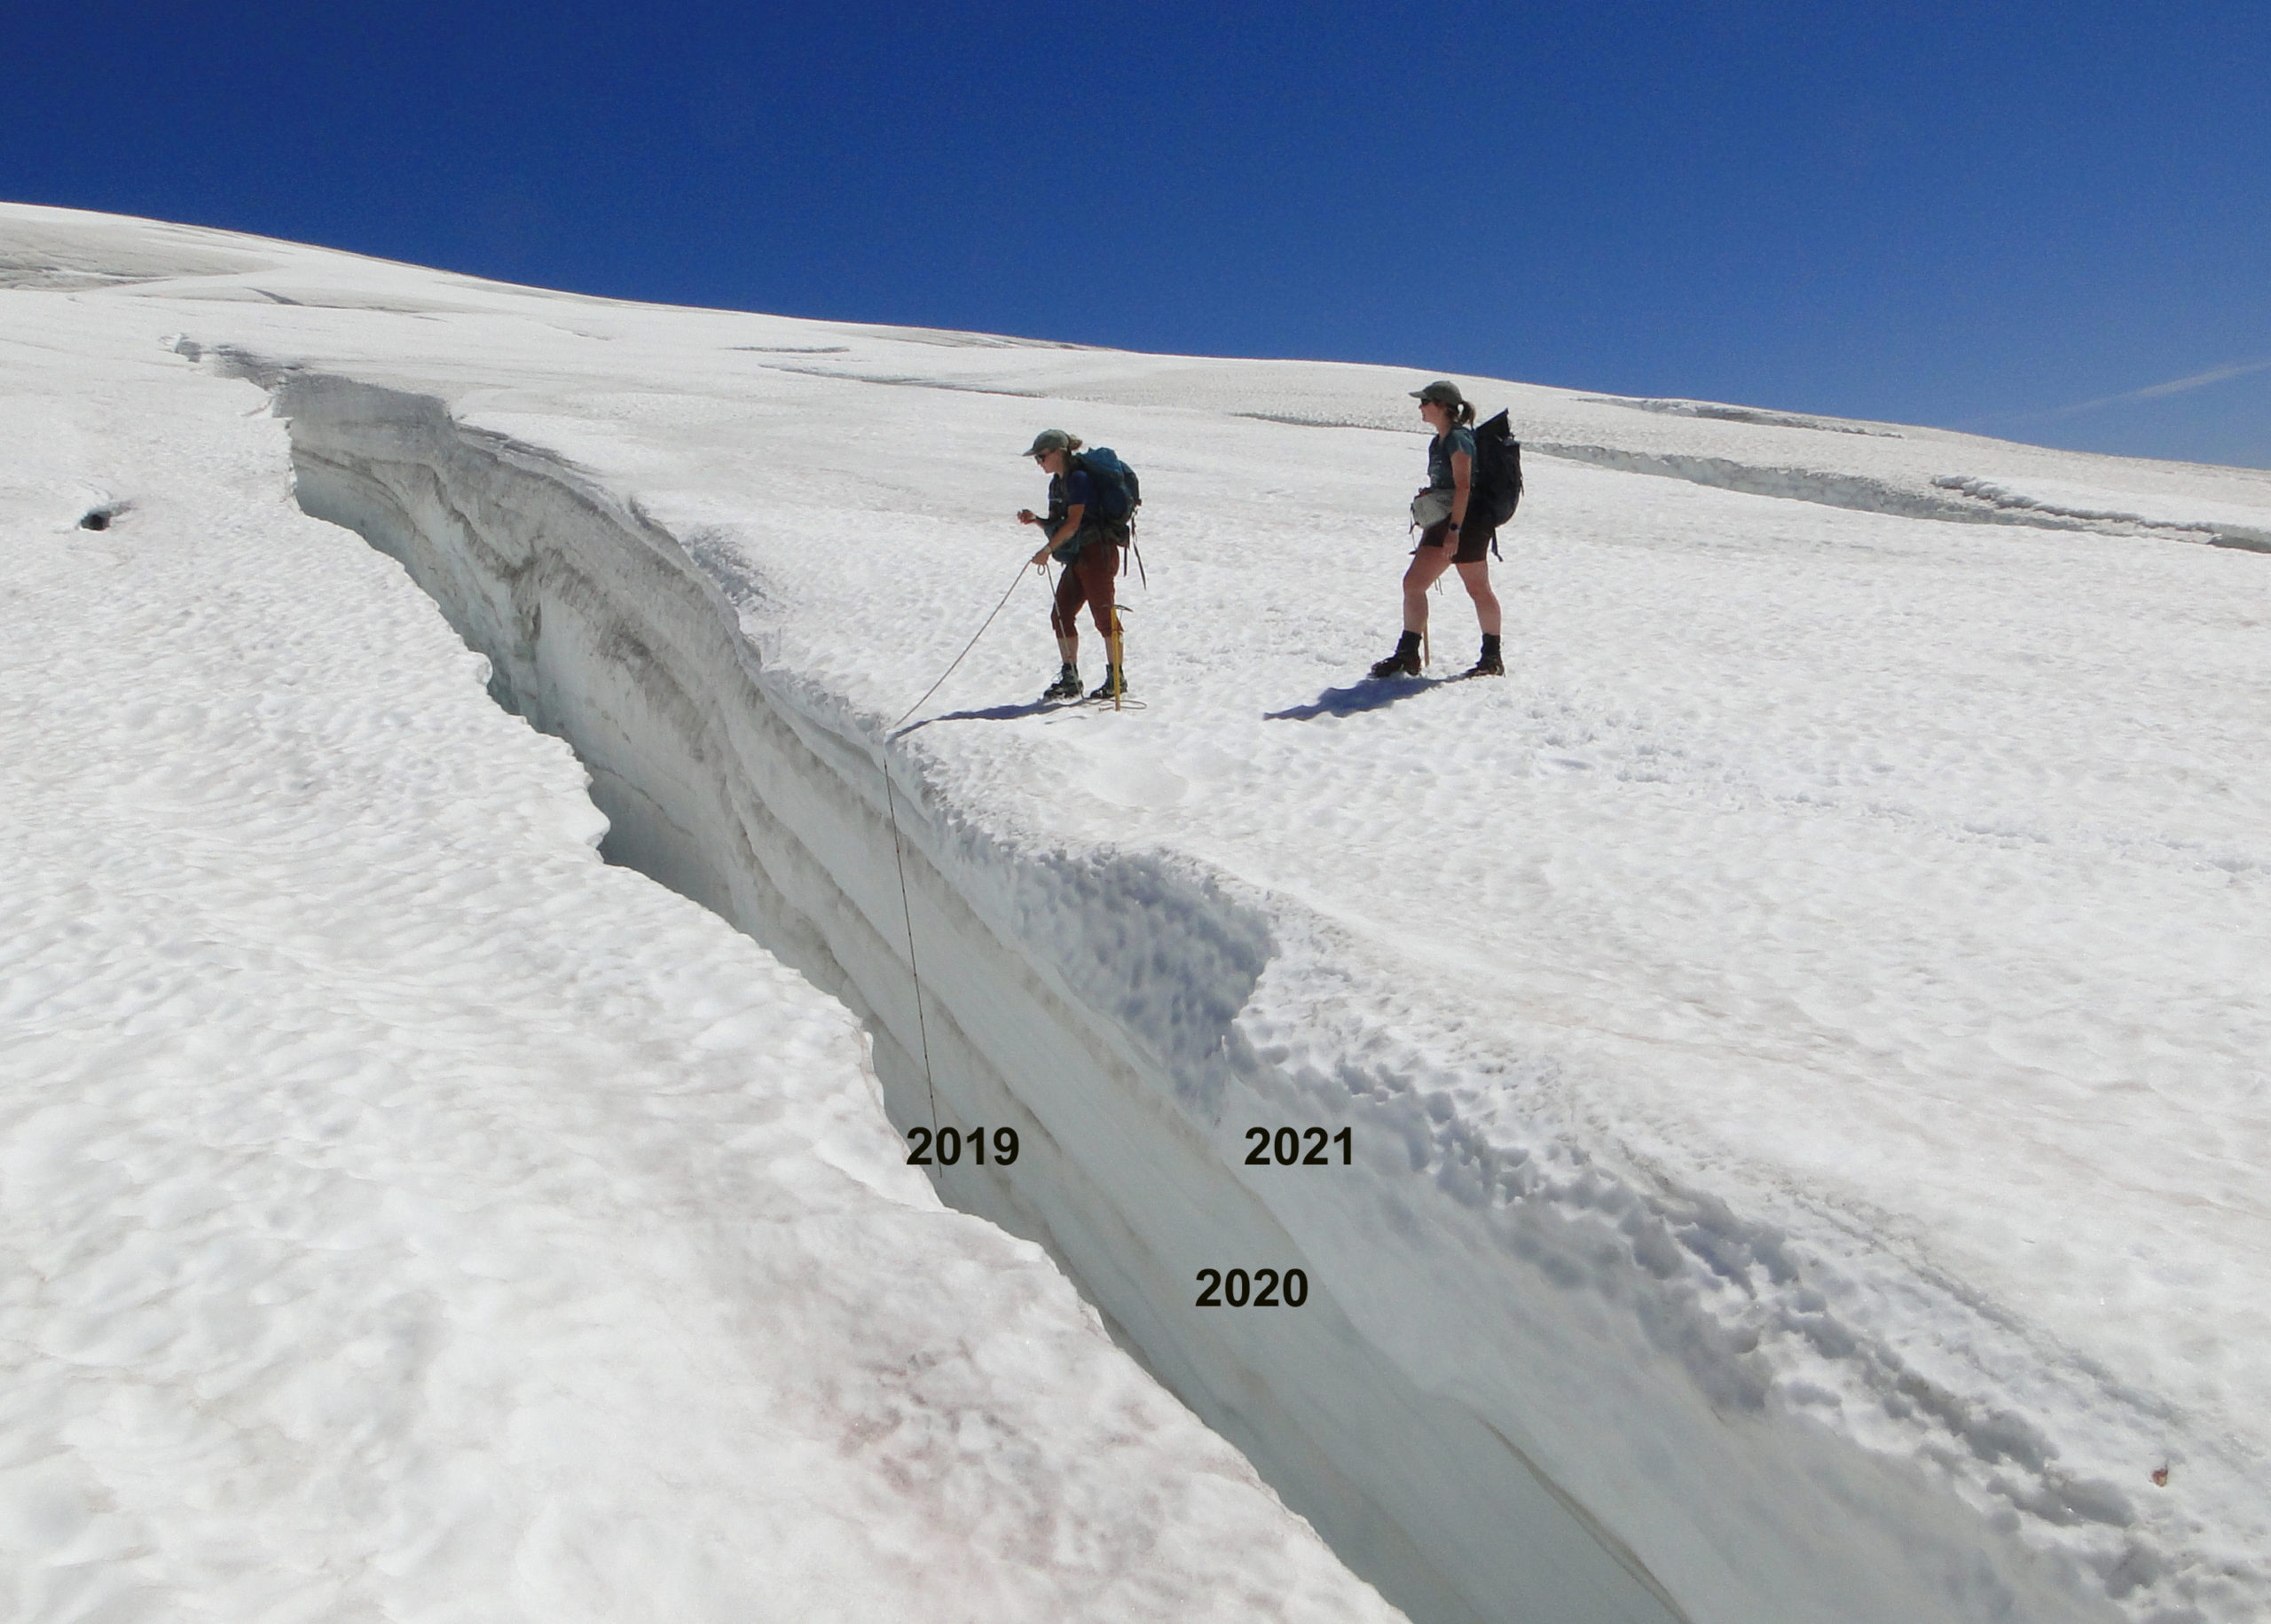
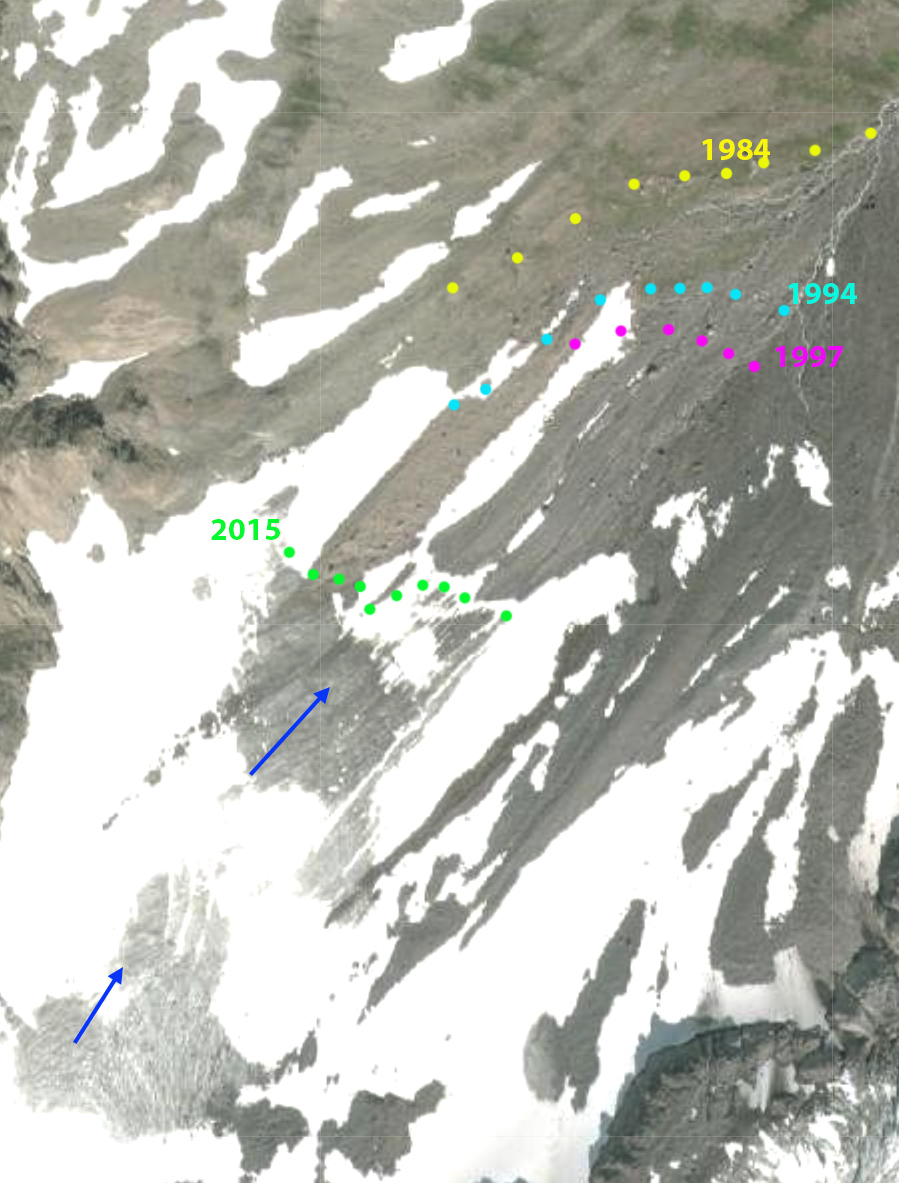
Snowpack loss from June 21 to August 25 in Sentinel images. AO=Adams Outlier, T=Terminsu Zone, I=Icefall, S= bergshrunds on upper glacier.

On June 21, 2021 nearly the entire glacier is snowcovered, which is typical.  By July 1, 2021 areas of the glacier below the icefall are rapidly losing snowcover. By August 15, 50% of the glacier has retained 2021 snowcover. This rapidly diminishes to ~10% by Aug. 25, 2021. On Aug. 30, 2021 there are large areas above 10000 feet that typically retain snowcover to the end of the summer that have lost all snowcover and are particularly dirty firn, snow that fell in recent years but has not been converted to glacier ice. The retained snowcover is in five patches, the lower three are all avalanche runout zones and the upper two regions, above the icefall, of wind drift redeposition.

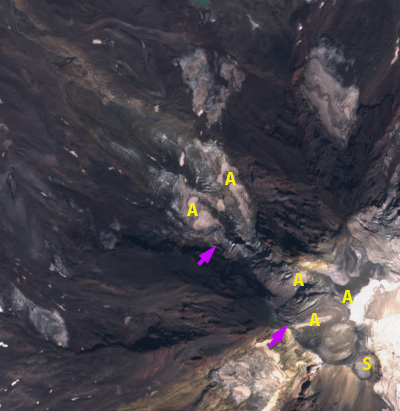
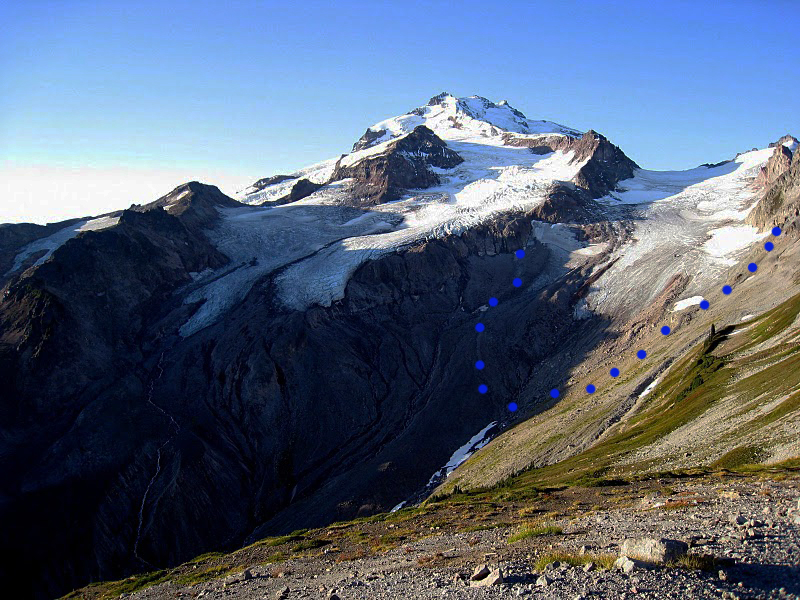
Adams Glacier in Sentinel 2 True Color image from 8-30-2021. Pink arrows indicate icefall top and bottom. S=summit area, A=Areas where limited pockets of 2021 snowpack has been retained through August.

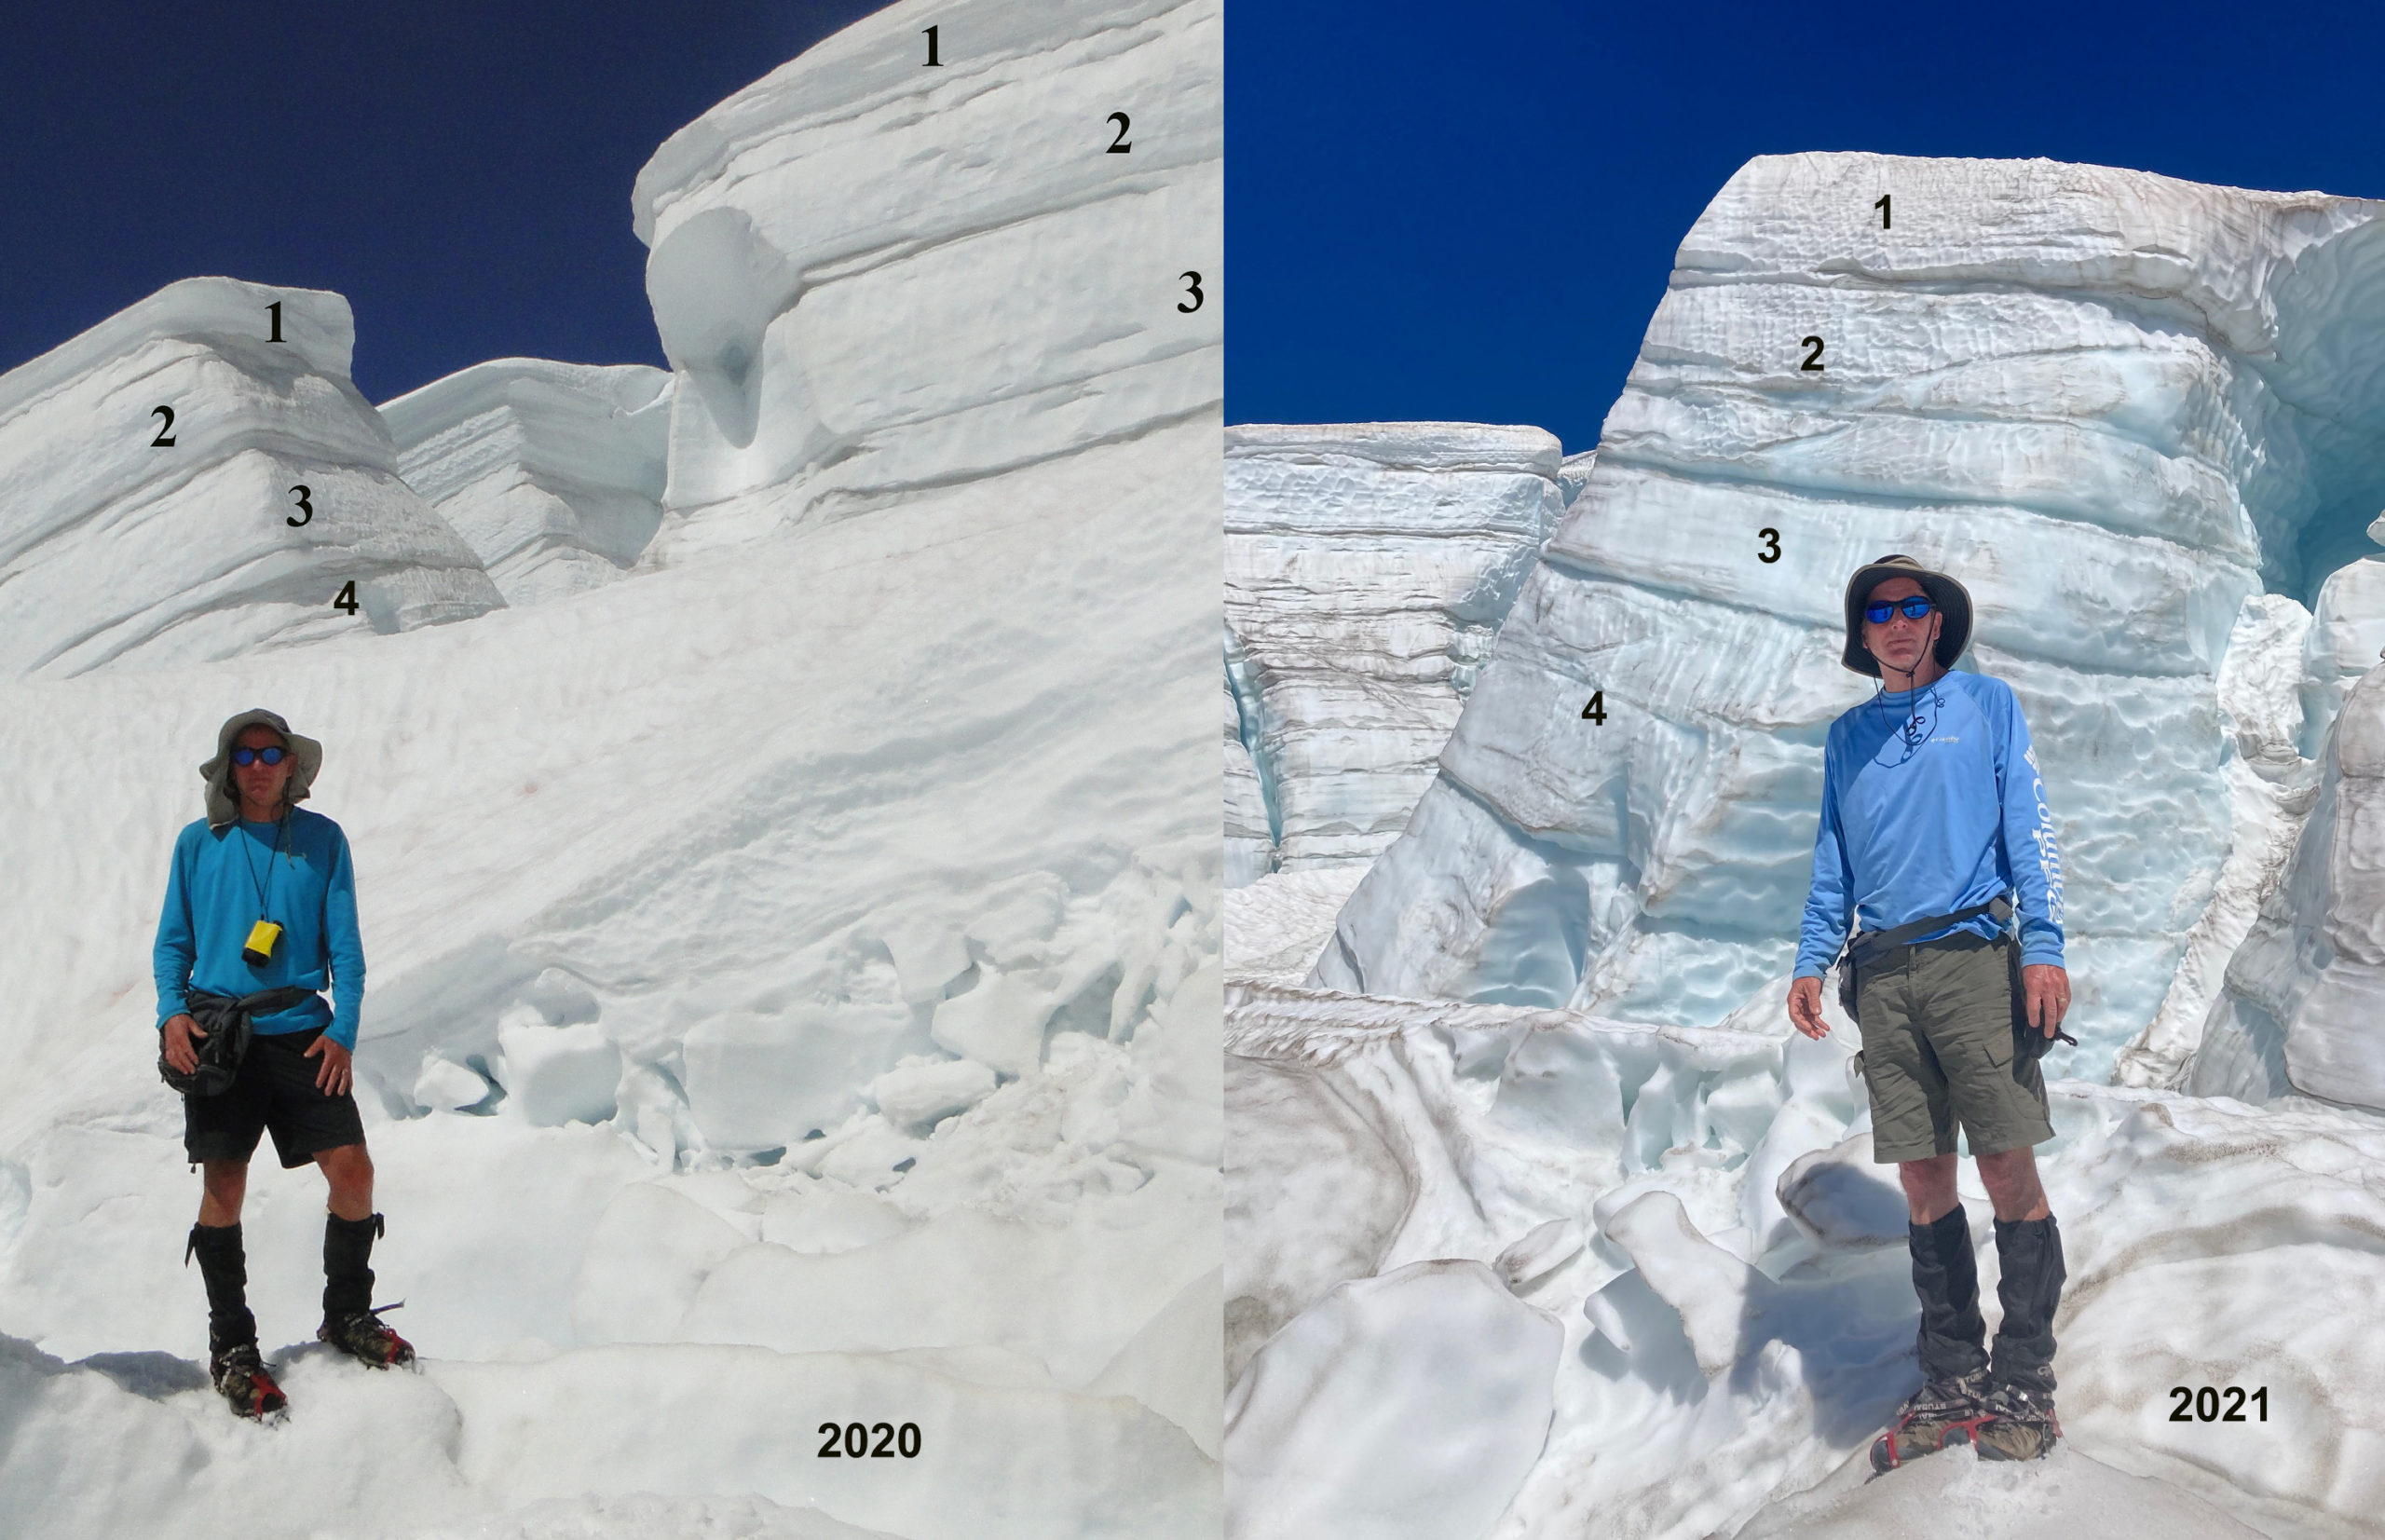
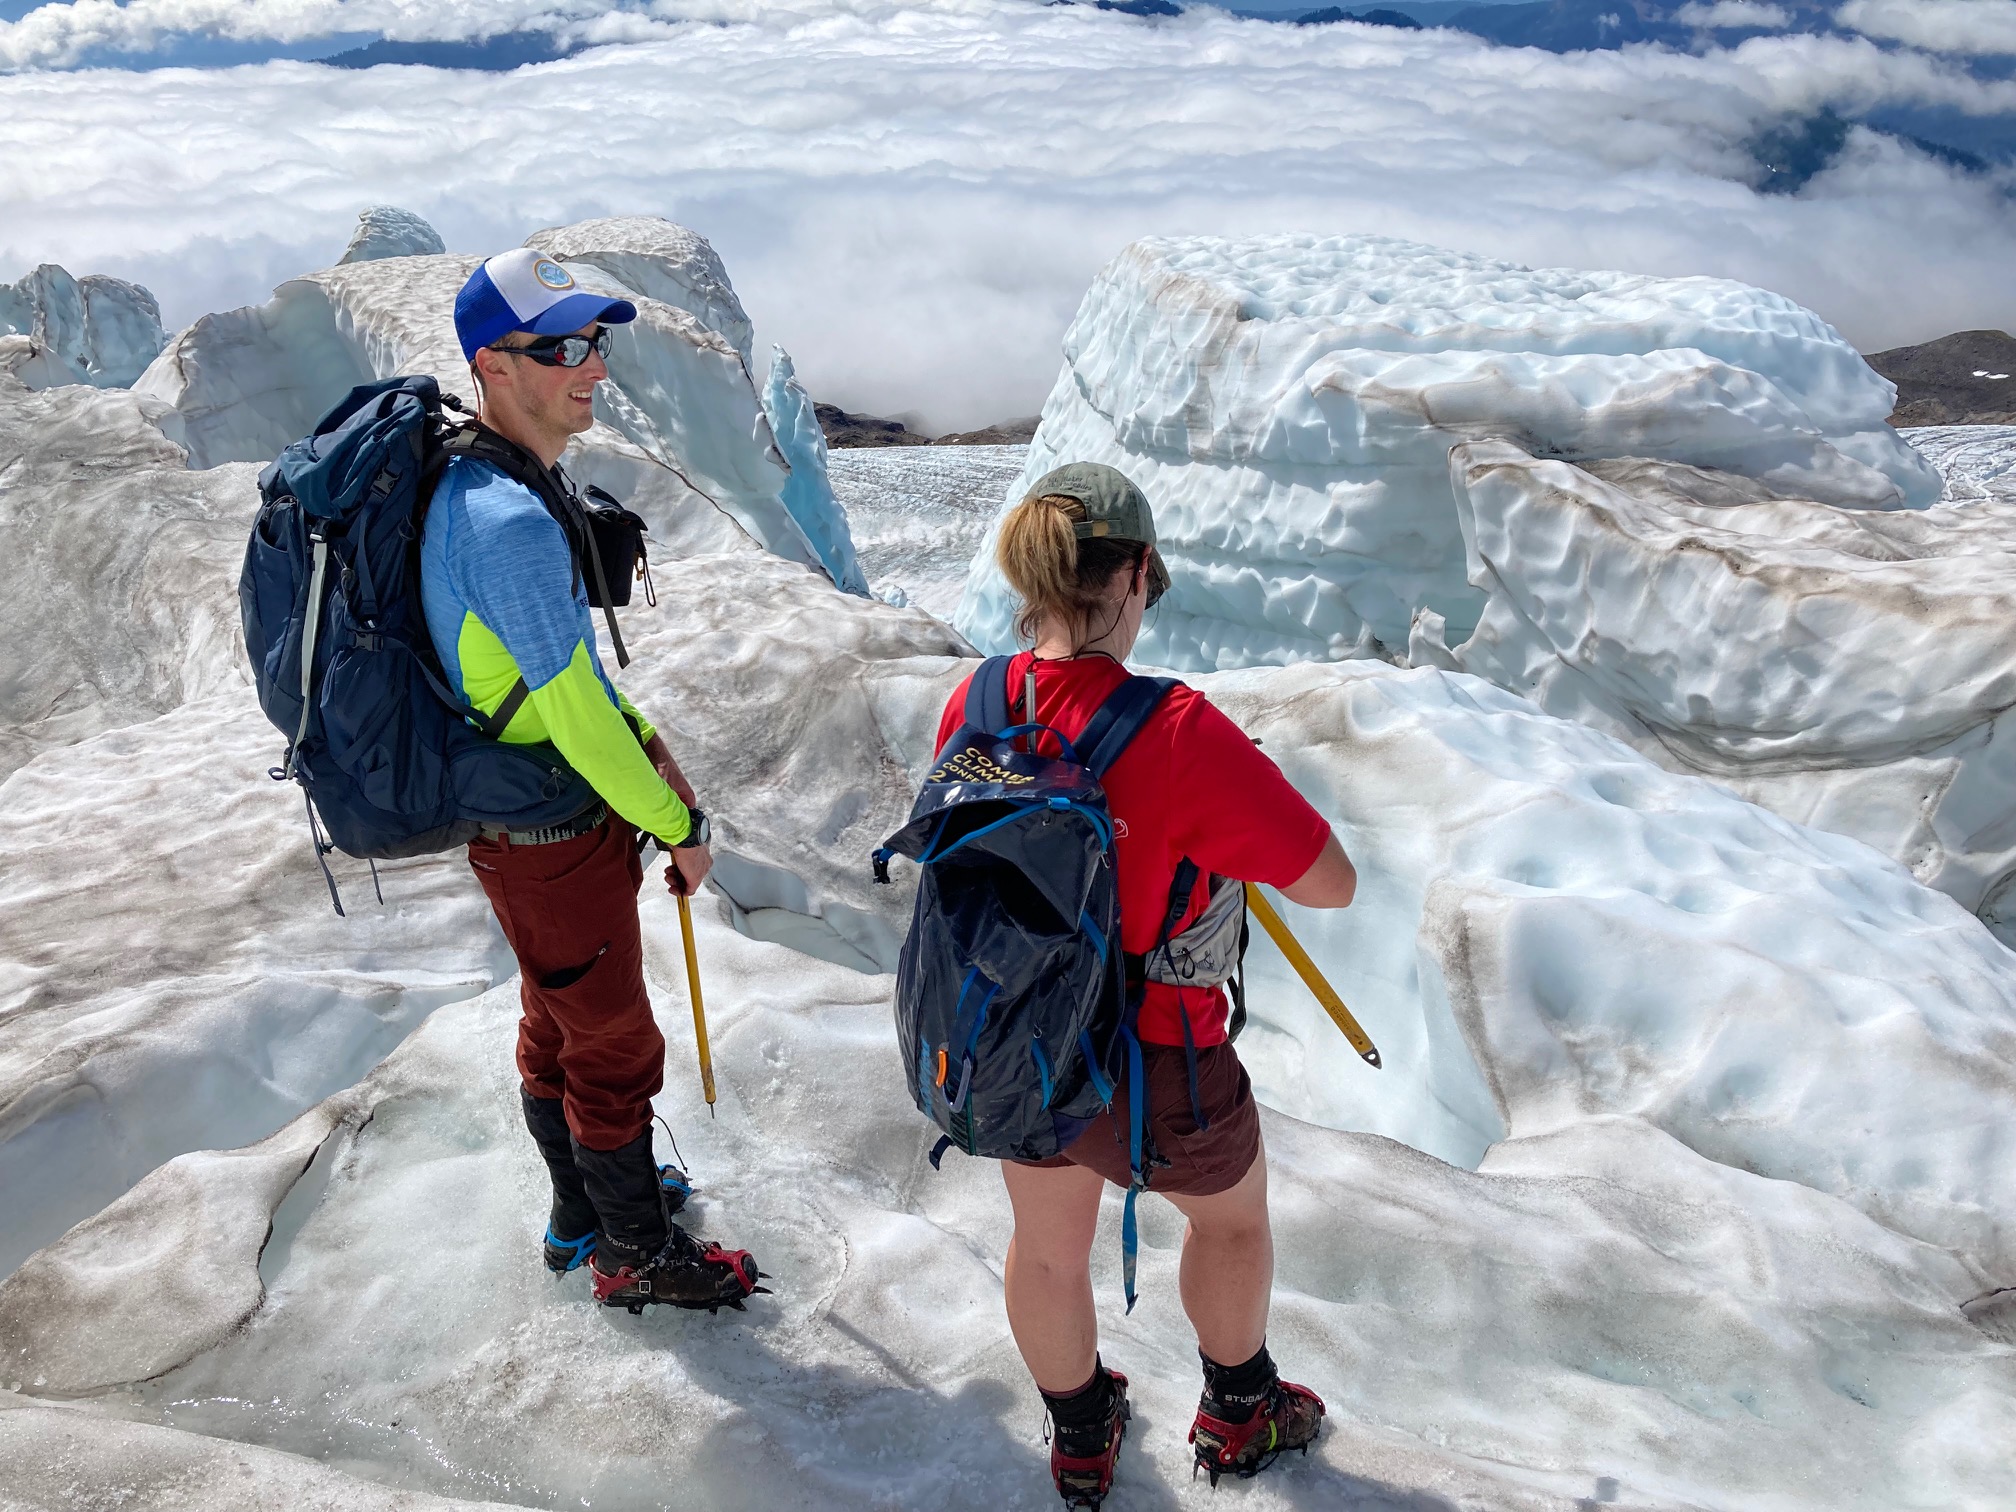
Similar to Whitney Glacier on Mount Shasta , Adams Glacier will not retain snowcover in 2021. The early exposure of bare firn and ice, which melt at a faster rate than snow is causing rapid mass losses on the upper glacier this summer, as we have reported from Easton Glacier on Mount Baker. The current area of the main glacier is 1.9 km2, with the outlier have an area of 0.3 km2. The combined area of 2.2 km2 is less than 50% of the 1998 total. The loss of snowpack from the Adams Glacier is greater than in any year since 1984, exceeding 2015.  The winter of 2015 had less snowfall and the mean summer temperature was warmer.  The key difference is likely the excessive melt of the late June 2021 heat wave that is particularly impactful early in summer. Finn et al (2017) noted that the upper reaches of Adams Glacier ranged from ~25 to 60 m thick, while lower down on the volcano are the glacier is less than<~30m thick. This summer mass losses will be in the 2-3 m range on Adams Glacier, based on the duration of exposed ice and percentage of the glacier in the accumulation zone. This will represent a 5-10% volume loss for this glacier in 2021.

Snowpack at Potato Hill (1375 m) a Snotel site.  The 2021 winter had above average peak snowpack (black line), but typical melt out date.


Whitney Glacier , Mount Shasta Losing all of its Snowcover and Separating in 2021

Whitney glacier 89-25-2021 comparison

Sentinel 2 False and True Color images from 8-25-2021.  Yellow arrows indicate where glacier is separating and purple arrows the small remanent of 2021 snowpack remaining. This remanent will not last to the end of the melt season. 

The summer of 2021 is proving to be catastrophic for Whitney Glacier on Mount Shasta, California in terms of volume loss, ~15-20% this year leading to long term impacts, adding to the 50% area reduction and 1000 m retreat since 2005.  The glacier will lose 100% of its 2021 snowpack and is in the process of separating into two glaciers. Here we review the glaciers behavior in recent decades and examine using Sentinel Imagery the impacts in summer of 2021.Mount Shasta is a stratovolcano home to the largest glaciers in California, Whitney Glacier on the north side is the longest. In 1981 USGS (Driedger and Kennard, 1986) mapped the area and volume of several of the glaciers, in a landmark study of glacier volume on Cascade volcanoes. Whitney Glacier had an area of 1.3 km2, a maximum depth of 38 m, and a volume of 25 million m 3. The majority of the glacier was in the 20-35 m thick range. The glacier was noted as having a length of 3.0 km ending on the USGS map at 9900 feet.

whitney 1993

Digital Globe image indicating a area of retreat from 2005-2012 and the limited crevassing near 2012 terminus.

Tulaczyk and Howat (2008) noted that Whitney Glacier did advance during the 2000-2005 period, following a retreat in the 1980’s and 1990’s. The most recent advance was limited to the 1999-2005 period due to heavy snowfall from 1998-2002, ended with the glacier 850 m in advance of its 1951 position. There was a period of advance for many Cascade volcanoes glaciers between 1950 and 1980, followed by retreat after. On Mount Baker, Washington all of the glaciers advanced during the 1944-1979 period by an average of 480 m (Pelto and Hedlund, 2001). By 2010 Pelto and Brown (2012) observed all were retreating with an average retreat of 370 m.  In 2012 the glacier is thin in its lower reaches with no crevassing. By 2014 the terminus of the glacier had retreated 700 m from 2005 and was 2.6 km in length and terminated at 10200 feet, 300 feet higher than a decade before or in the 1981 map.

whitney glacier snowpack 2021

Sentinel 2 True Color images from 6-16-2021, 6-28-2021 and 7-18-2021 illustrating the progressive snowcover loss on the glacier. Point A and D are on the upper Glacier, Point B is where the upper and lower glacier have joined and Point C is near the top of the lower glacier. 

The summer of 2021 followed a 15 year period of overall significant mass loss and retreat on Whitney Glacier that led to a thinner glacier with a reduced velocity and consequently fewer crevasses. The stage was set with  60-75% of normal snowpack in early April 2021 at the stations in the region in the 6000-7600′ range, dropping to 20-25% of normal by early May (CDEC, 2021). This was followed by an exceptionally warm early summer, that helped strip the snowpack away early. By June 16, the snowline on Whitney Glacier had risen to 10,800 feet, near Point C, while the upper glacier extending from Point A and D to Point C was nearly all snowcovered. By June 28 the snowline had risen to 11,200 feet on the lower glacier and the upper glacier snowline was near 12,500 feet, with the west facing upper section (Point A) above 13000 feet nearly all bare. By July 18 there is a small area of snowcover near Point C on the lower glacier and Point D on the upper glacier.  Most of the glacier is bare of snowcover.  This underscores the particularly detrimental impact of early season heat waves that strip away winter snowpack and exposes the dirtier glacier ice and firn.  The ice and firn melt ~30% faster than the snowcover for the same weather conditions. Our measurements on Mount Baker during heat waves over the last three decades indicate typical ice melt of 7-9 cm of melt per day. The average temperature over the last 70 days since much of the glacier was bare ice has been 16.8 C at Snow Bowl station at 7617 feet.  Given area summer lapse rates this equates to a temperatures of ~12-13 C at the mean glacier elevation.  The temperature at this station reached 29 C on June 27, 28 C  on June 28 and exceeded 25 C from June 25-June 30. The rapid melt rate led to a number of areas of slushy, swampy glacier surface conditions even high on the glacier (Mount Shasta Avalanche Center ). Using the degree day formula for melt derive on Mount Baker during warm summer conditions (Pelto, 2015 and 2018) of .0053m w.e.C-1D-1, yields a cumulative melt of 4.8 m w.e., equivalent to over 5 m of ice thickness.

This given mean ice thickness in the 25-30 m range indicates that this summer ~15-20% of the glacier ice volume will be lost on Whitney Glacier. The glacier is now 2300 m long and has an area of 0.6 km 2, which is less than 50% of its area just 16 years ago. This is leading to separation of the lower and upper glacier at the yellow arrows.  There is certainly still stagnant ice in this zone, but there is no longer a dynamic connection between the upper and lower Whitney Glacier.

mount-shasta-trail-map
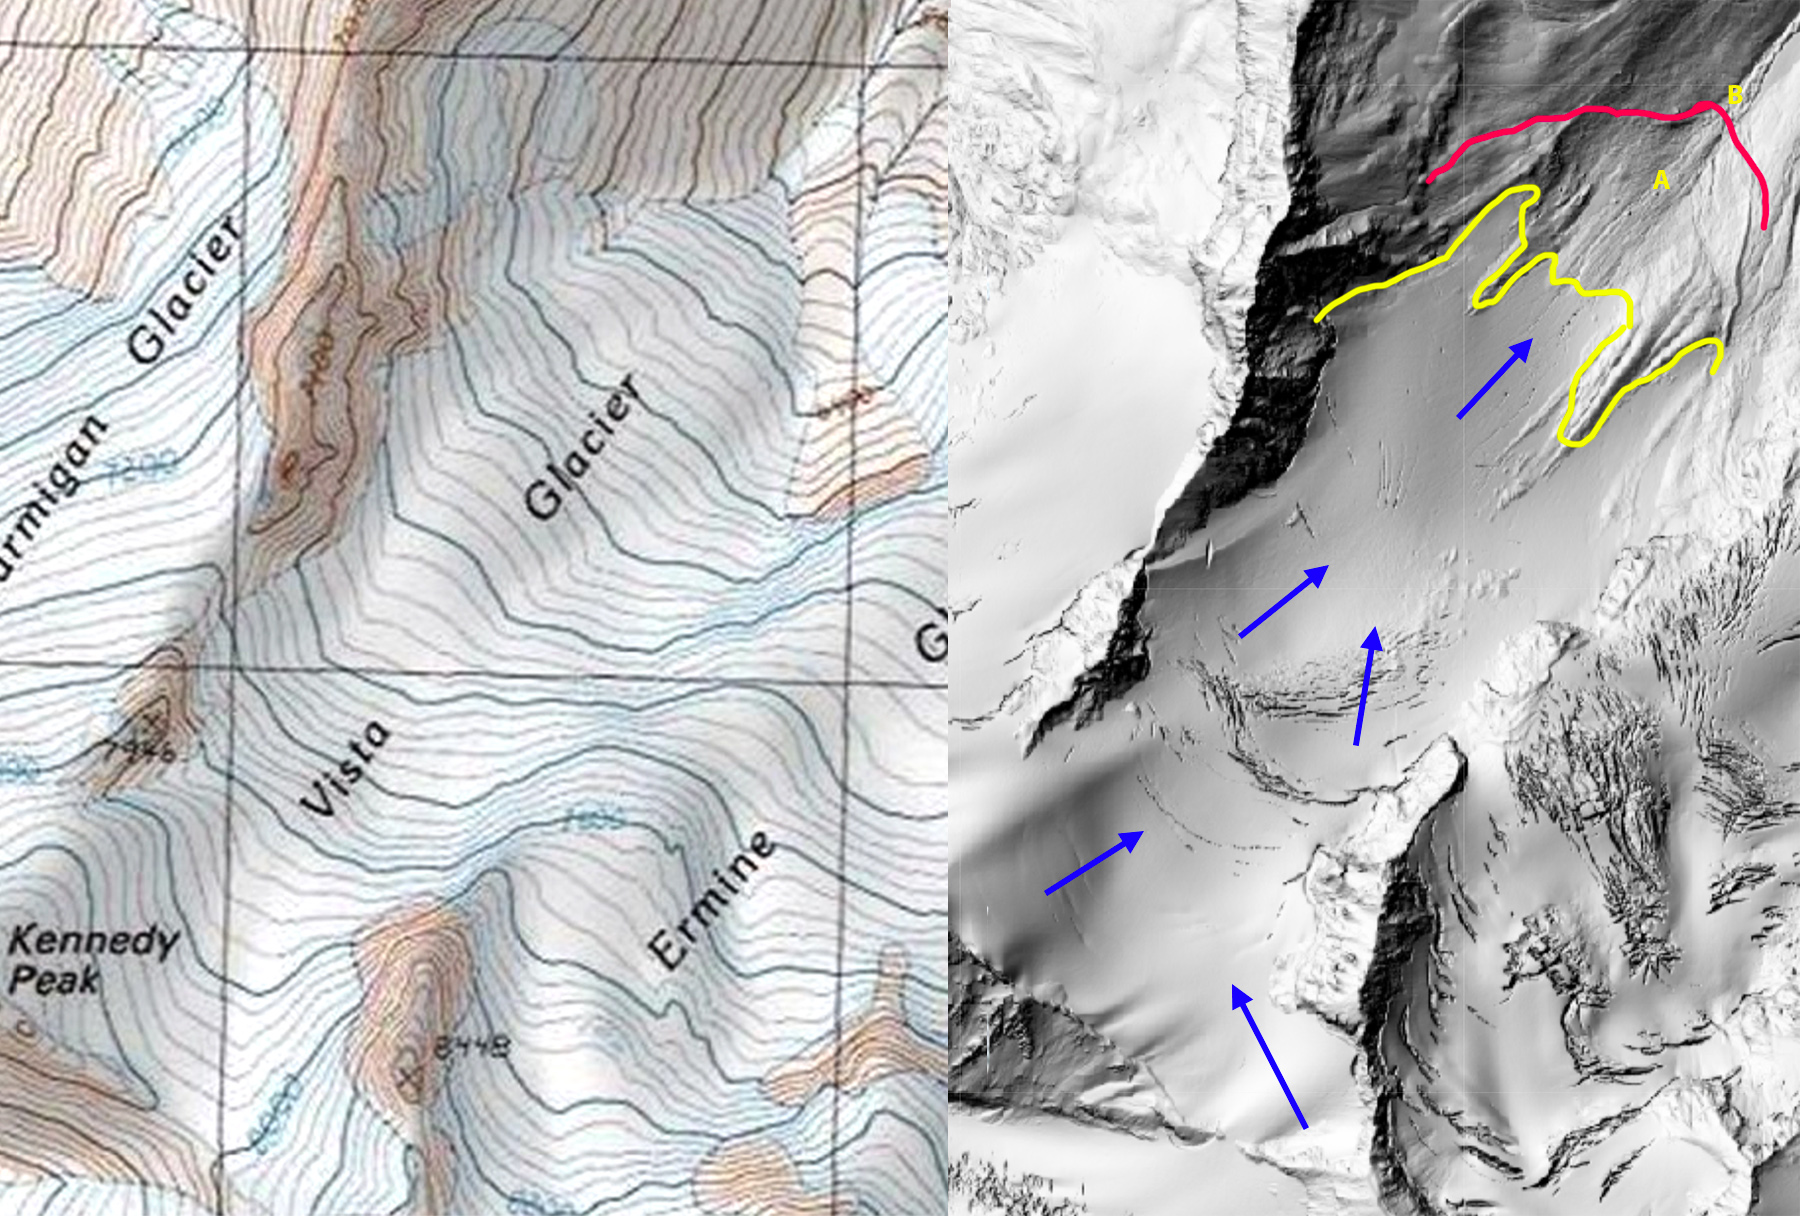
Topographic map of Mt. Shasta.indicating the top of Whitney Glacier near the summit of Shasta and the ~1981 and 2005 terminus position.

A Tale of Two Glaciers Columbia and Easton Glacier 2021

Terminus of Columbia Glacier on left with 1984 terminus location noted.  Observe the avalanche fans (A) and the relatively high snowcover on 8-2-2021.  At right is Easton Glacier on 8-11-2021 with the location of the 1990 terminus indicated, 440 m of retreat to the 2021 terminus position. The glacier has only 38% snowcover at this time, which is better illustrated below.

Columbia and Easton Glacier in the North Cascade Range of Washington are two of the reference glaciers for the World Glacier Monitoring Service.  We have monitored their mass balance in the field for 38 and 32 years consecutively. This year Ashley Parks, Sally Vaux, Jill Pelto  and I worked on all of the glaciers with Abby Hudak, Rose McAdoo and Ben Pelto joining us for either Easton or Columbia Glacier. In 2021 a combination of an above average winter snowfall and a record summer melt has led to a different story of mass balance for the two glaciers. At Mount Baker and Stevens Pass winter snowpack on May 1 was 116% and 115% of normal (NWAC, 2021). From June 1-Aug. 17 the mean average temperature is similar to 1958 and 2015, and well above every other year. With the maximum temperature exceeding 80 F on 17 days during this period at Stevens Pass ( 3950 ft, 1200 m), each of those days represents exceptional melt conditions.  Our observations indicate 11-14 cm of snowpack melt on glacier during exceptionally warm days like this. Just the melt from these 17 days would equate to half of the average summer melt for a North Cascade glacier (Pelto, 2018).  The earlier summer heat wave has led to exposure of greater higher albedo and faster melting glacier ice, which is why such a heat wave is more impactful than in late summer.

Columbia Glacier occupies a deep cirque above Blanca Lake ranging in altitude from 1400 meters to 1700 meters. Kyes, Monte Cristo and Columbia Peak surround the glacier with summits 700 meters above the glacier. The glacier is the beneficiary of heavy orographic lifting over the surrounding peaks, and heavy avalanching off the same peaks.  Standing on the glacier is a bit like being in the bottom of a bath tub, with avalanche slopes extending up both sides, predominantly on the west side. The last half of January 2021 was a dry period in the region, with an extensive crust forming on the snowpack. This was followed by 106 inches of dry snowfall from Feb. 4 to Feb. 20,and then 34 inches of wet snowfall and even rain through Feb. 24 This generated extreme avalanche danger and numerous climax avalanches in the Stevens Pass region.

NWAC’s avalanche forecast on 2/20 for Stevens Pass indicated that, “We haven’t seen rain above 3,500ft or so since mid-January, so one of the main concerns is that slabs 5-10′ feet thick may begin to come crashing down. The avalanche cycle(s) may last through the day Monday. In any case, very large storm slabs and wet loose avalanches are expected to continue to run from steep slopes through Monday as our once beautiful cold, dry snow becomes overloaded by wet, heavy rain and snow.”

The avalanche slopes with many pockets above Columbia Glacier in Aug. 2020, one fan can be seen bottom center. These have to filled each winter season before slides occur, in 2020 avalanching was limited.

As we headed up onto Columbia Glacier on Aug. 1, 2021 we noted a significant number of large avalanches had descended near and onto the glacier. The glacier was 87% snowcovered, including the terminus area.  This is well above the recent early August average. As is the case every year we measure snow pack depth in a grid across the entire glacier.  Snow depth in the three biggest west side avalanche fans averaged 4.9 m, 25% above normal.  The three largest fans comprise an area of 0.14 km2, yielding a volume of 686, 000 m3 swe.  The melt season ends in another month, however, due to this substantial avalanching that will keep this section of the glacier covered in snow, Columbia Glacier will have a small-moderate negative mass balance.

Ashley Parks, Jill Pelto and Sally Vaux measuring snow depth in the Columbia Glacier avalanche fans.

The three primary avalanche fans each had a slope of 23 degrees.  Here we are spaced out at 50 m intervals mapping the size of the fan.

Easton Glacier on the south flank of Mount Baker does not recieve avalanche accumulation, and the regions above 2500 m, typically have significant wind  scouring, that leads to little increase in mass balance with elevation above this elevation on the upper glacier. There are both basins where snow is preferetially deposited by wind and convex regions where snowpack is scoured. In 2021 enroute to the glacier terminus we observed considerable stunted alpine vegetation, that emerged and then did not grow.  This was prevalent on rocky slopes that were exposed during the heat wave.  The example below is of Lupine with the growth from last year now brown and flat indicating the stunted size this year.

Stunted Lupine, each patch is typically 20-30 cm high and equally broad. Here the plants are 3-5 cm high.

On Aug. 11, 2021, the glacier had only 38% snowcover, with more than 50% of the area above 2500 m having lost all winter 2021 snowcover.  By summer’s end the glacier will certainly have the lowest percentage of snowcover of any year since we began monitoring in 1990. The bench at 2000 m typically has 2.75 m of snowpack on Aug. 10, and this year was 50% bare, with an average depth of 0.25 m.  The icefall above also lacked snowcover as well. There are a number of pockets/basins, where wind deposition increased snow depth and this snowpack will be retained.

The observations across the range illustrated that glaciers or areas of glaciers that do not have enhanced deposition from wind drifting or avalanching are either bare already or will be by the end of August.  The full extent of the loss on Columbia and Easton Glacier from this summer will be evident in a month. What is apparent is that the losses from Easton Glacier will be extraordinary. More frequent heat waves continue to plague alpine glaciers, these can even occur in winter such as on Mount Everest in January 2021 (Pelto et al. 2021)

View of the lack of snowcover in the icefall at 2000-2300 m on Easton Glacier.  The lack of snowcover above this point is also evident in the upper image.

Rose McAdoo and Jill Pelto measuring the 2021 snowpack at 2350 m is alareay thinner  than the 2020 or 2019 retained snowpack and will be gone by the end of the month.

In 2021, I am in front of the same serac as in 2020, down slope. The average retained accumulation at this 2600 m location in the laterally extensive layers is 2-2.2 m.  This year there will no retained accumulation.

Ben and Jill Pelto amongst the seracs where snowpack should be extensive, but in 2021 they are standing on 2020 firn.

NORTH CASCADE GLACIER CLIMATE PROJECT 2021 -38th Annual Field Program

A few measures of what it takes to execute a field monitoring program of glaciers for 37 years, with no helicopter support (Illustration by Megan Pelto).

2021 Field Season: For the 38th consecutive summer we are heading into the field later this week to measure the impact of climate change on North Cascade glaciers. We will complete detailed measurements on 10 glaciers, three of which are part of the World Glacier Monitoring Service reference glacier network (42 glaciers globally) that have 30 consecutive years of mass balance observations.  This field season follows both a historic heat wave at the end of June and a month long sustained period of warm weather that has extended from Late June to now. We have observed the rise of the snow line around Mount Baker from a lower than average late June ~1200 m on June 23 to  ~1850 m on July 23, average in late July is 1750 m.  The result is a greater exposure of bare ice on glaciers with summer only half over. For ice surfaces with a higher albedo and greater density the observed melt rates are 7-9 cm/day water equivalent during warm weather events vs 4-6 cm/day for snow surfaces.  We will provide preliminary observations in three weeks when the field season is completed as we did with the 2020 Field Report.

Who we are? NCGCP was founded in 1983 to identify the response of North Cascade glaciers to regional climate change, particularly changes in mass balance, glacier runoff and terminus behavior.   NCGCP is a field project that has a broader interdisciplinary scope and examines more glaciers than any other program in North America.  It does so cost effectively relying on no permanent camps, helicopter support or salaries for the director. The field season includes no days off and each day is spent completing measurements on glaciers.  The focus is on glacier mapping, mass balance measurement, terminus observations and glacier runoff monitoring.

Why study glaciers in the North Cascades? Glaciers are one of the world’s best climate monitors and are a critical water resource to many populated glaciated regions. This is particularly true in the North Cascades where 700 glaciers yield 200 billion gallons of summer runoff and glaciers have lost 30 % of their area in the last century.  This has reduced glacier runoff in late summer in the region as the reduction in glacier area has been exceeded the increase in melt rate (Pelto, 2011) .

Field Team 2021:

Jill Pelto is an artist and scientist from New England who grew up loving winter sports and trips to the mountains. She incorporates scientific research and data into paintings and prints to communicate environmental changes. Her multi-disciplinary work weaves visual narratives that reveal the reality of human impacts on this planet. She completed both her B.A. degrees in Studio Art and Earth and Climate Science and her M.S. focused on studying the stability of the Antarctic Ice Sheet at the University of Maine, spending two field seasons at a remote camp in the southern Transantarctic Mountains. Jill will be joining the project for her 13th field season. She is excited to continue documenting North Cascade Glacier changes that she has witnessed each of the last 12 years—through science and art.

Jill Pelto sketch of Easton Glacier Icefall

Mauri Pelto has directed the project since its founding in 1984, spending more than 700 nights camped out adjacent to these glaciers. He is the United States representative to the World Glacier Monitoring Service, author of the AGU blog “From a Glacier’s Perspective”, and associate editor for three science journals.  His primary job is Dean of Academic Affairs at Nichols College, where he has been a professor since 1989.

Mauri Pelto probing on Easton Glacier

Sally Vaux (she/her) is an incoming MS student in Environmental Science at Western Washington University. Her research interests include the impacts of aerosol deposition on snow and ice melt and equitable K-12 science education. While obtaining her BS in Environmental Science from WWU, Sally began a water quality monitoring project focused on dissolved organic carbon in the Nooksack River. This summer, she is working on a NASA Space Grant project to understand how climate-driven increases in frequency and intensity of wildfires in the Arctic lead to light-absorbing aerosol deposition on sea ice and how these deposits impact ice albedo. She will also be working to adapt polar and alpine snow science into lessons for elementary and middle school students in Whatcom County, WA. Outside of school and work, Sally likes to run, ski, bike, and read.

Ashley Parks is a recent Huxley graduate from Western Washington University, Environmental Science. Growing up in Bellingham and being an avid fan of winter sports, she has been able to become familiar with the North Cascade Mountain Range, inspiring her to become interested in the glaciology of her region. As glaciers enter a period of trouble due to the climate crisis, she hopes to connect our understanding of climate change effects on local glaciers, and what that means for local communities. Ashley will also be collecting pink snow for The Living Snow project which is run out of Western Washington University in order to characterize the biodiversity of the algae in the snow and its impact on snowmelt dynamics. This summer’s goal is to be able to communicate her findings through an artistic medium that she can share with others, and to be able to gain experience with field data collection.

Field Partners 2021

Alia Khan’s, research team including grad students Sally Vaux and Shannon Healy focus on environmental chemistry in the cryosphere, including black carbon and snow algae to document global change of glacier and snow melt in mountainous and polar regions.

Western Washington University Cryosphere Studies and Aquatic Biochemistry Lab.

Rose McAdoo, is a visual artist using desserts to communicate science and make big ideas digestible. Her work pulls her between New York City, Alaska, and Antarctica — where she works as the sous chef for NASA’s Long Duration Balloon atmospheric research camp and as a member of the winter Search and Rescue team. In 2019, her edible documentation of the U.S. Antarctic Program’s field season won the attention of NPRForbes,  and — most recently — as the featured cover artist for the American Polar Society. She’s currently working as an ice climbing and glacier helicopter guide in Seward, Alaska, and is eager to further visualize the extensive research of the North Cascades Glacier Climate Project.

Cassidy Randall,  is a freelance writer covering stories that push the boundaries on how we think about environment, adventure and people exploring the bounds of human potential https://www.cassidyrandall.com/ . She’s on assignment with NCGCP for National Geographic.

Nooksack Indian Tribe, for the 10th consecutive year we will be conducting field work aimed at providing field validation and streamflow calibration data below Sholes Glacier for the ongoing work of the tribe.

Measuring streamflow below Sholes Glacier. Forest fire haze obscuring sky

2021 Schedule

Jul 31:  Hike in Columbia Glacier
Aug. 1: Columbia Glacier
Aug. 2: Columbia Glacier
Aug. 3: Hike Out Columbia, Hike in Ptarmigan Ridge
Aug. 4:  Sholes Glacier
Aug. 5:  Rainbow Glacier
Aug. 6:  Rainbow Glacier
Aug.7:  Hike out, Hike In Lower Curtis Glacier
Aug. 8:  Lower Curtis Glacier
Aug. 9:   Hike out, Hike in Easton Glacier
Aug. 10:  Easton Glacier
Aug. 11:  Easton Glacier
Aug. 12:  Hike out Easton/Hike in Daniel
Aug. 13: Ice Worm Glacier Survey
Aug. 14: Daniel and Lynch Glacier Survey
Aug. 15: Hike out
Aug. 16:  Arrive home

Tulsequah Glacier, BC 2021 Glacier Lake Outburst Flood


Landsat images of Tulsequah Glacier on June 22 and July 5, 2021.  Lake No Lake is between the yellow arrows with the margin of glacier extending upvally on June 22nd. By July it has receded back to main valley and lake has largely drained. The former location of Tulsequah glacier dammed lake is at red arrow.

Tulsequah Glacier, British Columbia drains east from the Juneau Icefield and is best known for its Jökulhlaups or glacier lake outburst floods (GLOF) from Tulsequah  Lake and Lake No Lake dammed by Tulsequah Glacier in northwestern British Columbia, Canada (Neal, 2007). The floods pose a hazard to the Tulsequah Chief mining further downstream. This glacier feeds the Taku River which has seen a significant decline in salmon in the last decade (Juneau Empire, 2017).The continued retreat of the main glacier at a faster rate than its subsidiary glaciers raises the potential for an additional glacier dammed lakes to form. The main terminus has disintegrated in a proglacial lake.  Pelto (2017) noted that by 2017 the terminus has retreated 2900 m since 1984, with a new 3 km long proglacial occupying the former glacier terminus. The USGS has a stream gage measuring a range of parameters including turbidity and discharge which can identify a GLOF. Neal (2007) examined the 1988-2004 period identifying 41 outburst floods from 1987-2004. Here we examine Landsat images and USGS records of Taku River to quantify the 2021 GLOF event between June 25 and July 3.

USGS records of turbidity and discharge on Taku River that indicate the onset on glacial lake drainage and of the GLOF event on July 3, note purple arrows.

On June 22, 2021 the region between the yellow arrows is an iceberg choked lake. The red arrow indicates the location where Tulsequah Lake used to expand, it is limited. The terminus of the glacier reaching upvalley 600 m from the main glacier.  Discharge is at 60,000 cfs and the turbidity is at ~100 FNU. Starting on the June 25th through the 27th turbidity rises to 400 FNU, while discharge rises to 90,000 cfs.  This is during a protracted dry period and is the result of the beginning of increased glacier discharge from the lake. On July 27th-June 30th it is evident that the margin of the distributary glacier tongue has receded ~500 m back to the main glacier margin, representing a terminus collapse generating icebergs likely resulting from a fall in water level. There is no change in the small Tulsequah Lake at the red arrow. On July 3rd turbidity rises above 500 FNU and discharge exceeds 130,000 cfs, this is at the high end of the typical peak GLOF events from Lake No Lake as noted by Neal (2007)  from 90,000-130,000 cfs. This is the main event and was reported by the USGS. By July 5 Landsat imagery indicates the water level has dropped between the yellow arrows, resulting in more prominent icebergs. The Sentinel image illustrates the zone of iceberg stranding as well.  The icebergs continue to melt away by July 20. No change at the red arrow. If we look back to Sept. 2020 we see what Lake No Lake will appear like by the end of summer and that the distributary terminus margin does not extend upvalley at that time. The large proglacial lake that has formed after 1984 due to retreat helps spread out the discharge from ice dammed lake GLOF’s of Tulsequah Glacier.  This lake will continue to expand and the damming ability of the glacier will continue to decline, which will eventually lead to less of a GLOF threat from Lake No Lake.

Sentinel images from June 22, July 5 and July 20 of the area of the lake and then the area of stranded icebergs.  Note how almost the entire width of a the northern tributary flows into this valley.


Landsat images of Tulsequah Glacier on June 27 and June 30.  Lake No Lake is between the yellow arrows. The former location of Tulsequah glacier dammed lake is at red arrow.

Tulsequah Glacier in 1984 and 2017 Landsat images.  The 1984 terminus location is noted with red arrows for the main and northern distributary tongue, southern distributary red arrow indicates lake margin.  The yellow arrows indicate the 2017 glacier terminus locations. The retreat of 2900 m since 1984 led to a lake of the same size forming. Purple dots indicate the snowline.


Landsat images of Tulsequah Glacier on Sept. 15, 2020.  Lake No Lake now drained fills between the yellow arrows. The former location of Tulsequah glacier dammed lake is at red arrow.

Sheridan Glacier, Alaska Retreat Causes Rapid Lake Expansion

Sheridan Glacier in 2002 and 2020 Landsat images illustrating retreat of the margin and expansion of the lake. Red arrow is 2002 margin on small island, yellow arrow is 2020 terminus location just north of Sherman Glacier stream and purple dots are the snowline.

Sheridan Glacier in the Chugach Mountains of Alaska begins at 1500 m and flow southwest out of the mountains with the terminus spreading out in a  lake basin on the low slope coastal plain.  Sheridan Lake is a proglacial lake at the terminus that drains into the Sheridan River which 12 km later reaches tidewater. From 1950 to 2000 Sheridan Glacier experienced modest retreat, with the terminus, with a fringing proglacial Sheridan Lake persisting, followed by a terminus disintegration from2000-2016. (Shugar et al 2018). Here we examine Landsat imagery from 2002-2020 to identify the retreat and resultant lake expansion.

In 2002 the proglacial lake has an area of 3.8 km2, with the terminus crossing one small island in the lake.  The snowline is at 750 m. In 2013 there is a 4 km2 terminus area that has disintegrated, the terminus has retreated off of the island.  The snowline is at 850 m. By 2016 the terminus has retreated north of the glacier stream from Sherman Glacier entering from the east, though much of the lake is still filled with an iceberg melange.  The snowline is at 925 m.  In 2020 the Sheridan Lake area has expanded to 11.2 km2, representing a retreat of 7.4 km2 since 2002.  The snowline in 202o is at 970 m.  In June 2021 there are a significant number of new icebergs indicating ongoing lake expansion during 2021.  Sheridan Lake is not a large glacial lake by Alaskan standards, but is bigger than any glacial lake in most alpine regions such as the Himalaya.  The ability to be so large is in large part due to the ability to develop larger basin on low sloped terrain near the coastline.

The amount of terminus retreat here is less than that at Excelsior Glacier or Yakutat Glacier, but the lake expansion rate is comparable to Excelsior Glacier.

Sheridan Glacier in 2013 and 2016 Landsat images illustrating the breakup of a large terminus region generating a melange of icebergs. Red arrow is 2002 margin on small island, yellow arrow is 2020 terminus location just north of Sherman Glacier stream and purple dots are the snowline.

June 2021 Sentinel Image indicating considerable new iceberg activity leading to ongoing lake expansion in 2021.


Paarliit Sermia, Southern Greenland Terminus Separation

Paarliit Sermia in 2000 and 2020 Landsat images.  The red arrow indicates the 2000 terminus location and the yellow arrow the 2020/21 terminus location. A denotes the junction of two main glacier branches, while B,C and D indicate tributaries

Paarliit Sermia is one of the most southerly tidewater glaciers in Greenland.  It is an outlet glacier of a mountain icefield and not part of the main ice sheet.  Similar to other icefield outlet glaciers whether in Alaska  (Dawes Glacier) or Patagonia (Upsala) retreat is leading to glacier separation. Greenland tidewater outlet glaciers in this region have experienced substantial retreat since 1990, Weidick et al (2012) and Howat and Eddy (2011).  There was also an increase in sea surface temperature (Straneo et al, 2013).  Moon et al (2020) noted a there is a rapid reconfiguration of the Greenland Ice Sheet Coastal margin due to retreat. The retreat of glaciers in southern Greenland is changing the physical geography and hence the physical oceanography of the fjords.  Here we examine Landsat imagery from 2000-2021 to identify the changes of Paarliit Sermia.

The Greenland Topographic map indicates the terminus down fjord from tributary B, 6.5 km from the main junction of two glacier branches at Junction A.  Tributary B, C and D all feed the main glacier. By 2000 the glacier has retreated beyond tributary B and C.  The snowline is between 550 m and 600 m in 2000 and 2002. In 2017 the glacier has retreated beyond Tributary D, and the snowline is slightly above 600 m. The two main branches are still joined, with the terminus now just 1 km from Junction A. Former Tributary C and D no longer reach tidewater. In 2020 the two main branches have separated and Point A is no longer a junction glacier has separated into two branches, the snowline is at ~600 m. In mid-June of 2021, the snowline is already at 500 m, despite being early in summer.  Paarliit Sermia has retreated 2.4 km from 2000-2021, a rate of ~200 m/year.

Nearby Kangersuneq Quingordleq Glacier retreated 2.8 km from 1999-2016. To the northeast Qaleraliq has experienced a 3.2 km retreat of its west arm and 1.2 km of its east arm from 1992 to 2012.   To the northeast Tingmiarmiit Glacier’s retreat from 1999-2015 has led to complete separation of the western and northern tributary. The western tributary is the main glacier and has retreated 2.4 km and the northern tributary has retreated 2.2 km in the 16 year period. In the case of nearby Tasermiut Fjord retreat has led to the fjord losing its tidewater connection.

Paarliit Sermia in 2002 and 2017 Landsat images.  The red arrow indicates the 2000 terminus location and the yellow arrow the 2020/21 terminus location. A denotes the junction of two main glacier branches, while B,C and D indicate tributaries

Paarliit Sermia in 1980’s Greenland Topographic map (from Nuna GIS) and 2021 Landsat images.  In the Landsat image the red arrow indicates the 2000 terminus location and the yellow arrow the 2020/21 terminus location.  On both map and image A denotes the junction of two main glacier branches, while B,C and D indicate tributaries

Dawes Glacier, Alaska Retreat Driven Separation

Dawes Glacier retreat in 1985 and 2020 Landsat images. Red arrow 1985 terminus, yellow arrow 2020 terminus. Point 1-3 are tributaries joining the main glacier. The glacier is about to separate into two calving termini.

Dawes Glacier terminates at the head of Endicott Arm in the Tracy Arm-Fords Terror Wilderness of southeast Alaska. Endicott Arm is a fjord that has been extending with glacier retreat, and is now  58 km long.  Dawes is a major outlet glacier of the rapidly thinning Stikine Icefield. Melkonian et al (2016) observed a rapid thinning of the Stikine Icefield of -0.57 m/year from 2000-2014.  Here we compare Landsat imagery to identify changes from 1985-2020. Endicott Arm is host to a population of harbor seals that prefer hauling out on icebergs during the day supplied by Dawes Glacier (Blundell and Pendleton, 2015)

In 1985 the glacier terminated at the red arrow in each image, the tributaries at points 1,2 and 4 connected with the main glacier. Point 3 is the junction point of two tribuataries. The northern arm is 1.3 km wide and the eastern arm is  2.5 km wide.  The snowline was at 1100 m.  In 1987 the snowline on the glacier was at 1150 m.  By 1999 the glacier had retreated 900 m since 1985 and the snowline was at  1300 m.  In 2019 the tributaries at Point 1, 2 and 4 have detached from the the main glacier. At Point 3 the northern arm has declined to 0.7 km wide and the eastern arm is  1.8 km wide.  In 2019 the snowline is at a record 1450-1500 m.This fragmentation of Dawes Glacier will continue, which leads to a reduced ice flux to the terminus reach. By 2020 Dawes Glacier has retreated 3.8 km since 1985, a rate of 105 m/year. The snowline is again exceptionally high at 1400-1450 m. Of equal importance the glacier terminus is separating into two individual calving termini, that could become fully separate this summer of 2021.

McNabb et al (2014) reported a thinning of 62 m/year from 1985-2013. The reduced inflow and up glacier thinning is ongoing and has driven the increased retreat rate despite a reduction in water depth at the cavling front. A key mechanism for retreat over the last century has been calving. The 2007 Hydrographic map of the area indicates water depth at the calving front still over 100 m, with a depth of 150 m 1 km down fjord of the terminus (see bottom image). The  depth more recently has declined to 60 m at the calving front in 2013 (Melkonian et al 2016), yet retreat has increased driven by enhanced melting. The glacier thinning is continuing, but the retreat rate will decline as the fjord head is approached.

At the glacier front the velocity was 13 m/day in 1985, increasing to 18 m/day by 1999 and declining to 5 m/day by 2014 (Melkonian et al 2016).

This reduction will reduce calving and iceberg production. As icebergs are reduced harbor seals will be disappointed as they prefer icebergs to haul out on. The Alaska Department of Fish and Game has been monitoring harbor seals in the fjord and noting that females travel to pup on the icebergs in the spring and also utilize them for mating.  ADFG attached satellite tags to harbor seals to monitor their movements beyond the breeding and puppin season finding  that that adult and sub-adult seals captured in Endicott Arm spent the late summer and fall months in Stephens Passage, Frederick Sound, and Chatham Strait. How will a reduction in icebergs affect this population overall?

The retreat leading to separation is also happening at other outlets of Stikine Icefield such as Baird Glacier and Sawyer Glacier.

Dawes Glacier retreat in 1985 and 2020 Landsat images. Red arrow 1985 terminus, yellow arrow 2020 terminus and purple dots the snowline. Point 1-4 are tributaries joining the main glacier.

Dawes Glacier retreat in 1985 and 2020 Landsat images. Red arrow 1985 terminus, yellow arrow 2020 terminus and purple dots the snowline. Point 1-4 are tributaries joining the main glacier.

Dawes Glacier in June 2021 Sentinel image. Indicating the impending separation of the terminus.

Hydrograh of Endioctt Arm from 2007.

Jacobsen Glacier, BC Separation Nearly Complete

Jacobsen Glacier in Landsat images from 1987 and 2019. Red arrow 1987 terminus location, yellow arrow 2019 terminus location and pink dots the snowline. Point A indciates ice marginal lake in 1987, Point C is the glacier junction, Point B an emerging rock rib and Point D a nunatak.

Jacobsen Glacier is part of the Monarch Icefield of the Coastal Range of British Columbia. VanLooy and Forster (2008) noted that the glacier retreated at a rate of 30 meters/year from 1974 to 1992 and 47 meters/year from 1992-2000. Menounos et al (2018) identified a mass loss for glaciers in this region of ~0.5 m year from 2000-2018 which is driving retreat. The glacier is at the headwaters of jacobsen Creek, which joins the Talchako River and then Bella Coola River.  The Bella Coola River is one of the most important salmon producing rivers on the British Columbia’s central coast. It supports the largest chinook and chum salmon populations, surveyed at 23k and 190k in surveys during the last decade (Pacific Salmon Foundation, 2021)  The sockeye and pink salmon runs have largely collapsed this century (Pacific Salmon Foundation, 2021). In this post we examine Landsat satellite imagery from 1987-2019 and Sentinel imagery from 2021 to illustrate the changes.

In 1987 the glacier terminated in a 1.8 km long proglacial lake at an altitude of ~1080 m .  The north margin had a separate terminus in the proglacial lake at Point A.  The terminus in the main proglacial lake 900 m wide. At Point B there is an icefall, but not exposed bedrock. The snowline was at 2050 m.  By 1995 the glacier had retreated 500 m.  The glacier was in contact with the proglacial lake at Point A.  The snowline was at 2100 m. By 2000 the glacier has retreated from the proglacial lake at Point A, due to thinning.  In 2016 the snowline is at 2150 m.  The glacier is now separated from the proglacial lake at Point A by ~500 m.  The southern tributary no longer reaches the expanding proglacial lake. In 2018 there is bedrock exposed at Point B.  The snowline is at 2100 m.  In 2019 the proglacial lake has expanded to a length of  3.3 km, a retreat of 1500 m from 1987-2019. The retreat and lake expansion has been 1500 m from 1987-2019, a rate of 47 m/year, only a slight change from the 1990-2000 reported rate. The snowline is at 2100 m. In May 2021 the Sentinel image indicates the medial moraine has widened to the point there is no interaction between the northern and southern tributary of Jacobsen Glacier.  The terminus in the expanding lake is now 400 m wide. The lake basin likely ends before Point C, based on surface slope changes of Jacobsen Glacier.

The retreat rate during this period is  less than the ~120-130 m/year at Bridge Glacier, Franklin Glacier or Klinaklini Glacier, and slightly more than at Bishop Glacier and Klippi Glacier. The combined loss in glacier area impacts glacier runoff particularly in late summer. Moore et al (2020) examining the Columbia River basin headwaters of Canada noted, “that glacier-melt contributions to August runoff have already have passed peak water, and that these reductions have exacerbated a regional climate-driven trend to decreased August streamflow contributions from unglacierized areas.”

Jacobsen Glacier in Landsat images from 1995 and 2018. Red arrow 1987 terminus location, yellow arrow 2019 terminus location and pink dots the snowline. Point A indciates ice marginal lake in 1987, Point C is the glacier junction, Point B an emerging rock rib and Point D a nunatak.

Jacobsen Glacier in Landsat images from 2000 and 2016. Red arrow 1987 terminus location, yellow arrow 2019 terminus location and pink dots the snowline. Point A indciates ice marginal lake in 1987, Point C is the glacier junction, Point B an emerging rock rib and Point D a nunatak.

Sentinel Image from May 2021