Jacobsen Glacier, BC Separation Nearly Complete
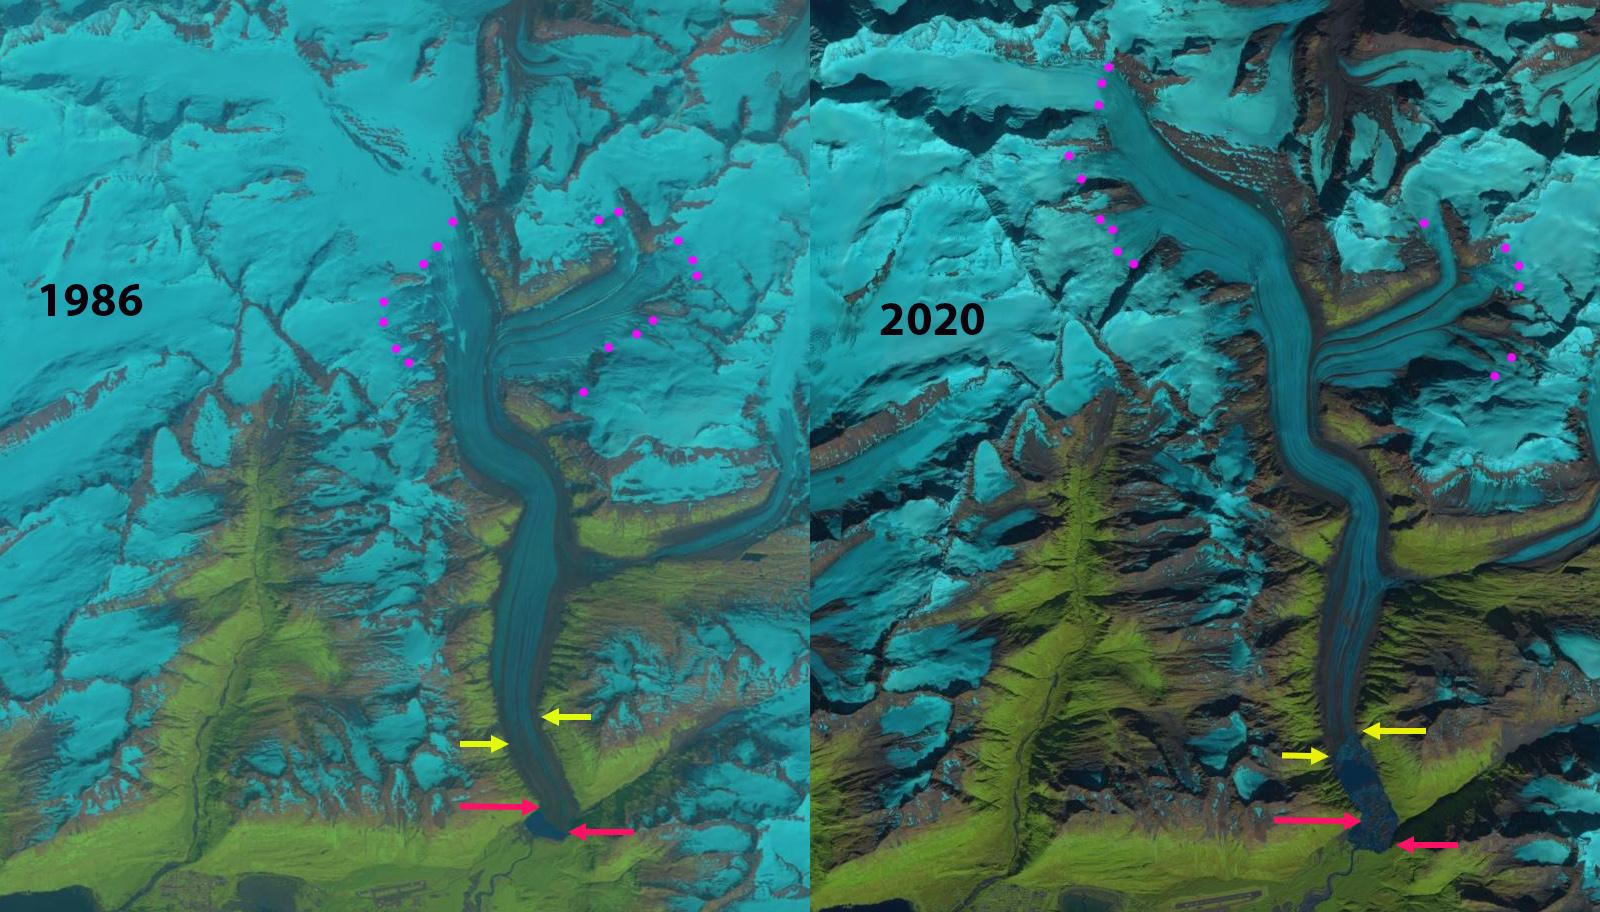
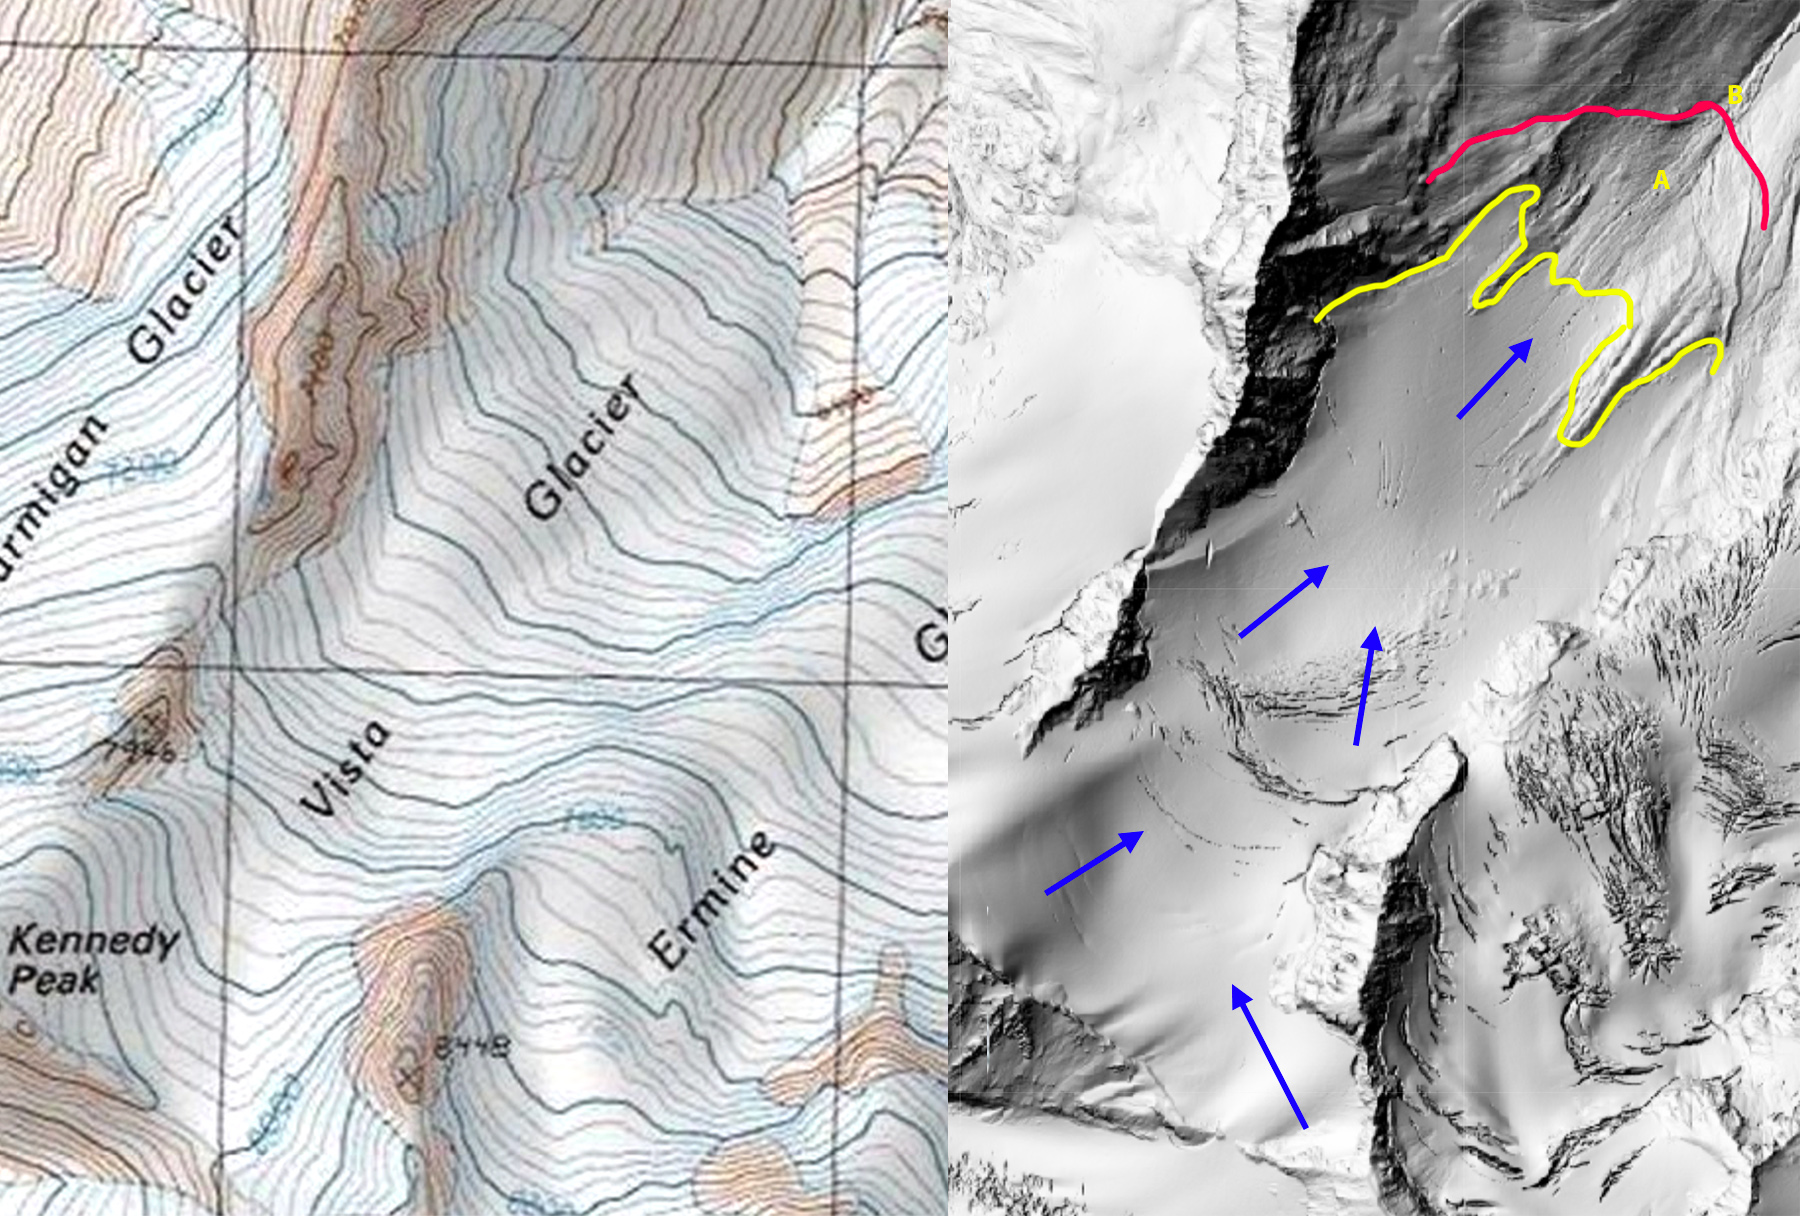
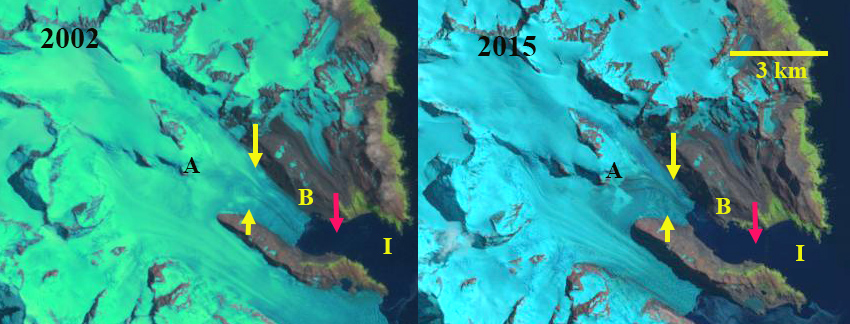
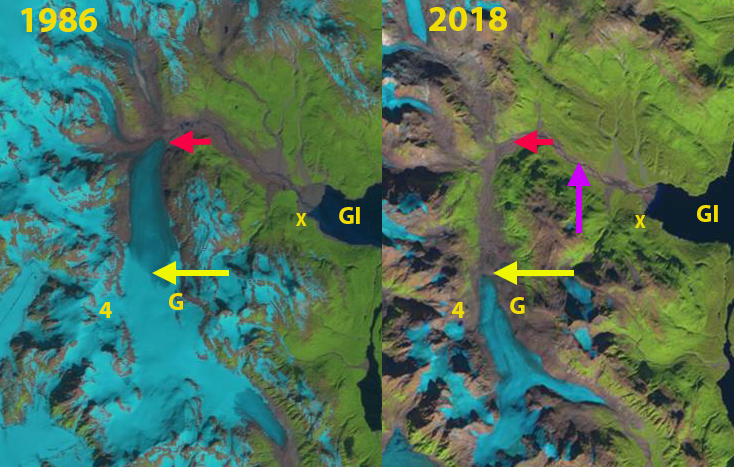
Jacobsen Glacier in Landsat images from 1987 and 2019. Red arrow 1987 terminus location, yellow arrow 2019 terminus location and pink dots the snowline. Point A indciates ice marginal lake in 1987, Point C is the glacier junction, Point B an emerging rock rib and Point D a nunatak.
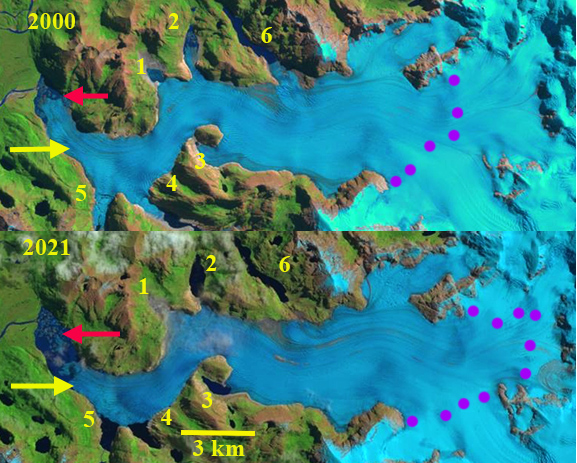
Jacobsen Glacier is part of the Monarch Icefield of the Coastal Range of British Columbia. VanLooy and Forster (2008) noted that the glacier retreated at a rate of 30 meters/year from 1974 to 1992 and 47 meters/year from 1992-2000. Menounos et al (2018) identified a mass loss for glaciers in this region of ~0.5 m year from 2000-2018 which is driving retreat. The glacier is at the headwaters of jacobsen Creek, which joins the Talchako River and then Bella Coola River. The Bella Coola River is one of the most important salmon producing rivers on the British Columbia’s central coast. It supports the largest chinook and chum salmon populations, surveyed at 23k and 190k in surveys during the last decade (Pacific Salmon Foundation, 2021) The sockeye and pink salmon runs have largely collapsed this century (Pacific Salmon Foundation, 2021). In this post we examine Landsat satellite imagery from 1987-2019 and Sentinel imagery from 2021 to illustrate the changes.
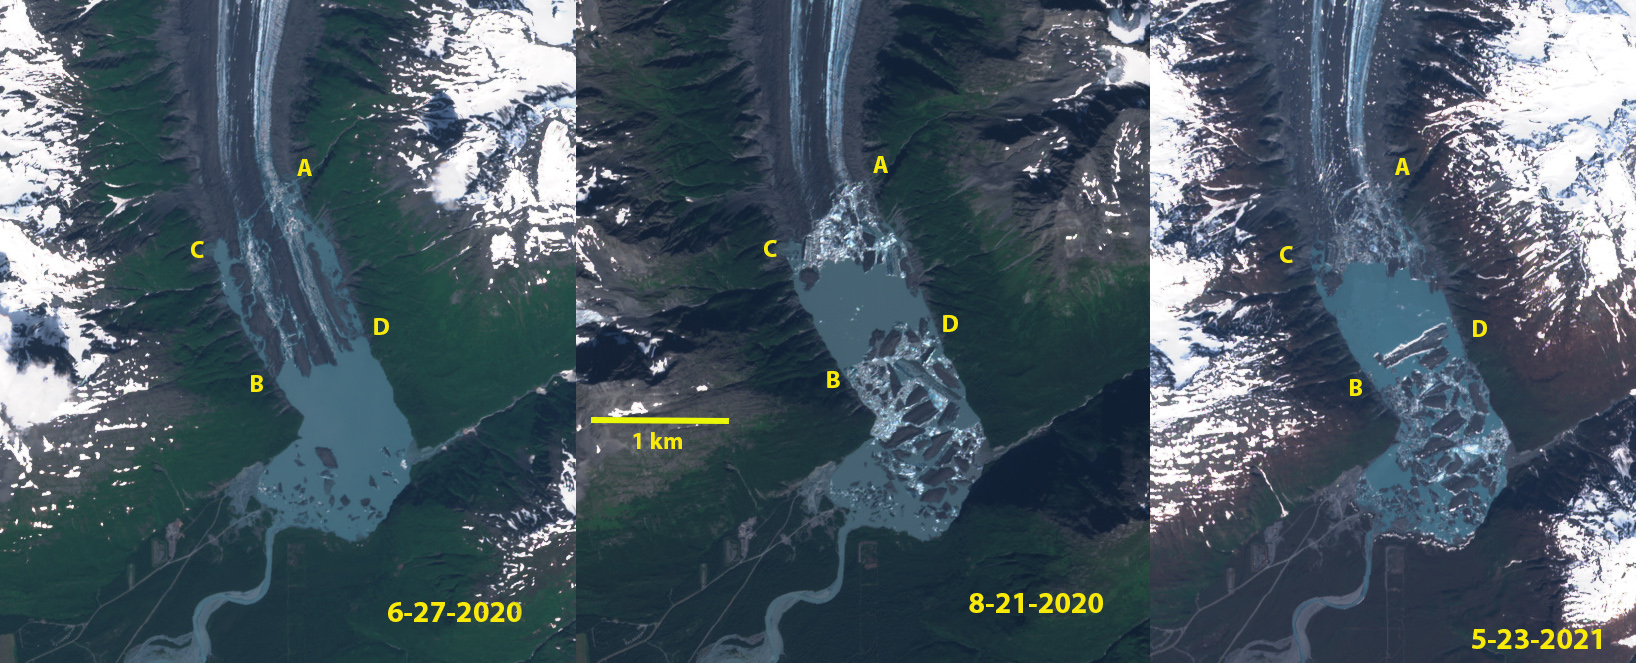
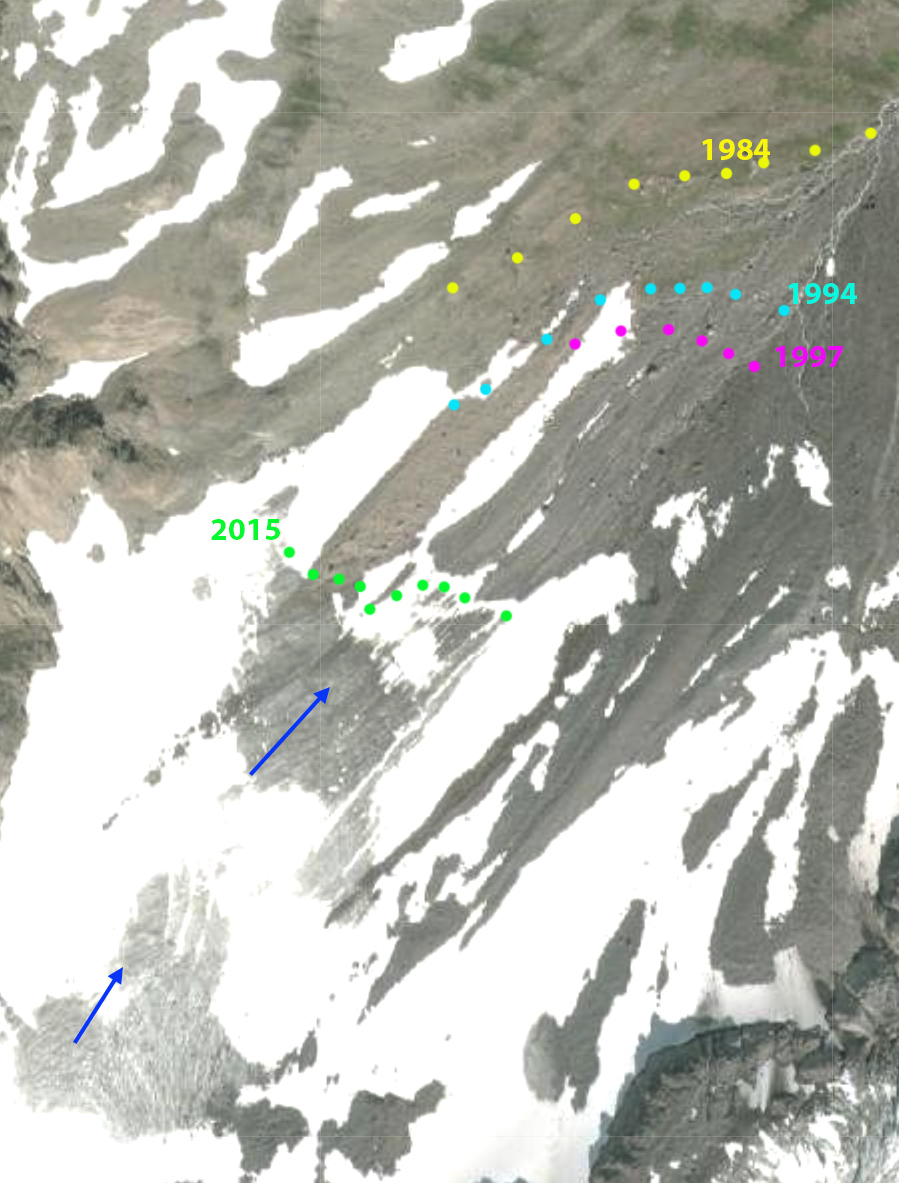
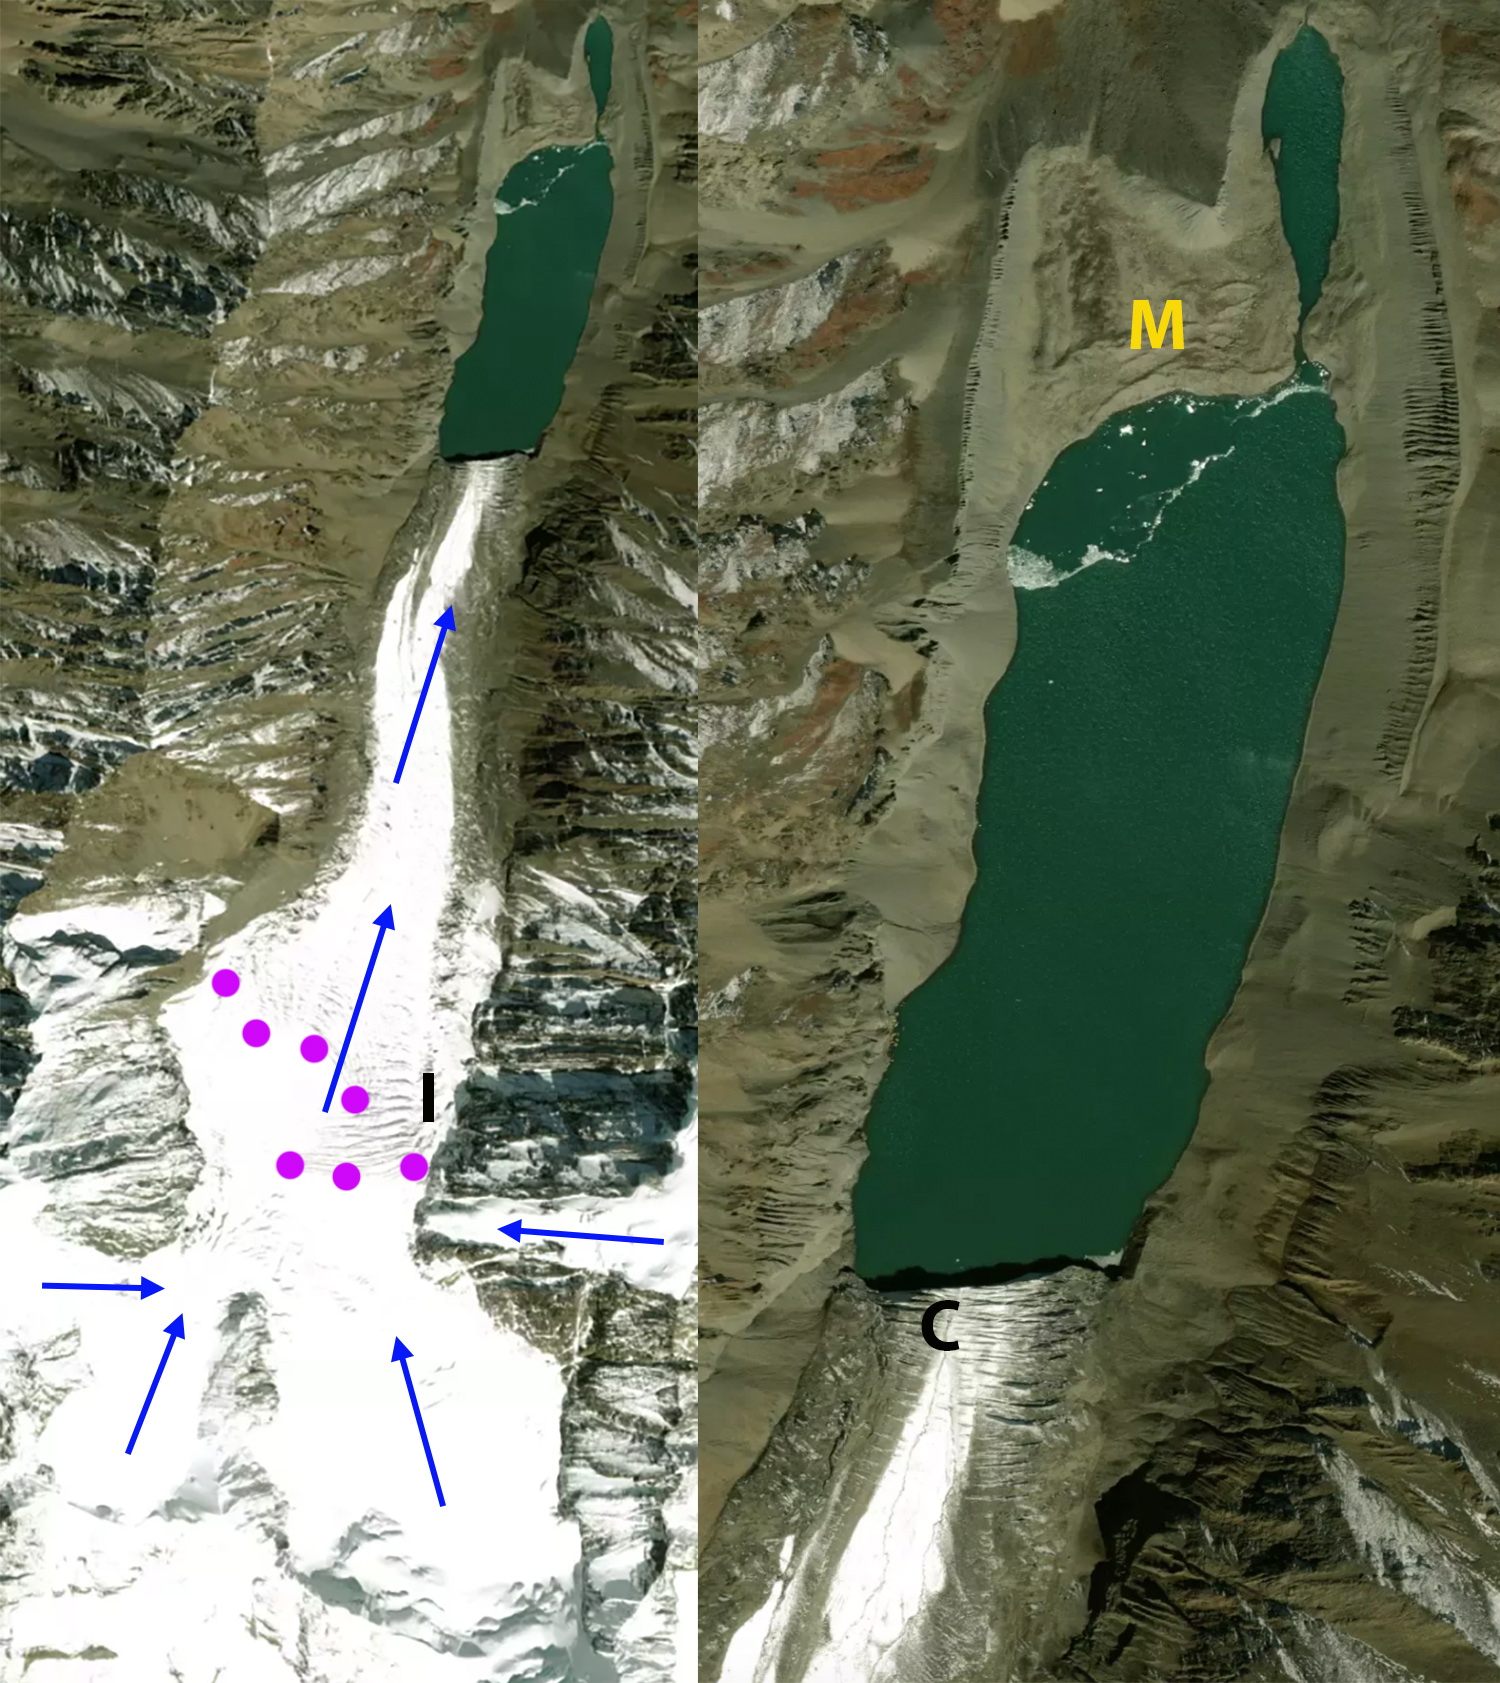
In 1987 the glacier terminated in a 1.8 km long proglacial lake at an altitude of ~1080 m . The north margin had a separate terminus in the proglacial lake at Point A. The terminus in the main proglacial lake 900 m wide. At Point B there is an icefall, but not exposed bedrock. The snowline was at 2050 m. By 1995 the glacier had retreated 500 m. The glacier was in contact with the proglacial lake at Point A. The snowline was at 2100 m. By 2000 the glacier has retreated from the proglacial lake at Point A, due to thinning. In 2016 the snowline is at 2150 m. The glacier is now separated from the proglacial lake at Point A by ~500 m. The southern tributary no longer reaches the expanding proglacial lake. In 2018 there is bedrock exposed at Point B. The snowline is at 2100 m. In 2019 the proglacial lake has expanded to a length of 3.3 km, a retreat of 1500 m from 1987-2019. The retreat and lake expansion has been 1500 m from 1987-2019, a rate of 47 m/year, only a slight change from the 1990-2000 reported rate. The snowline is at 2100 m. In May 2021 the Sentinel image indicates the medial moraine has widened to the point there is no interaction between the northern and southern tributary of Jacobsen Glacier. The terminus in the expanding lake is now 400 m wide. The lake basin likely ends before Point C, based on surface slope changes of Jacobsen Glacier.
The retreat rate during this period is less than the ~120-130 m/year at Bridge Glacier, Franklin Glacier or Klinaklini Glacier, and slightly more than at Bishop Glacier and Klippi Glacier. The combined loss in glacier area impacts glacier runoff particularly in late summer. Moore et al (2020) examining the Columbia River basin headwaters of Canada noted, “that glacier-melt contributions to August runoff have already have passed peak water, and that these reductions have exacerbated a regional climate-driven trend to decreased August streamflow contributions from unglacierized areas.”
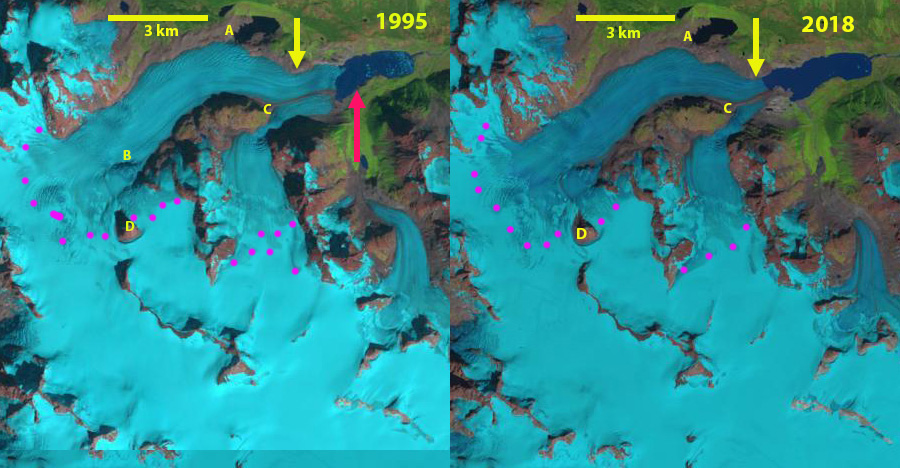
Jacobsen Glacier in Landsat images from 1995 and 2018. Red arrow 1987 terminus location, yellow arrow 2019 terminus location and pink dots the snowline. Point A indciates ice marginal lake in 1987, Point C is the glacier junction, Point B an emerging rock rib and Point D a nunatak.

Jacobsen Glacier in Landsat images from 2000 and 2016. Red arrow 1987 terminus location, yellow arrow 2019 terminus location and pink dots the snowline. Point A indciates ice marginal lake in 1987, Point C is the glacier junction, Point B an emerging rock rib and Point D a nunatak.

Sentinel Image from May 2021