Landsat images from 1989-2021 of Herz Glacier. Red arrow is 1989 terminus location, yellow arrows the 2021 terminus location. I=Iris Bay.
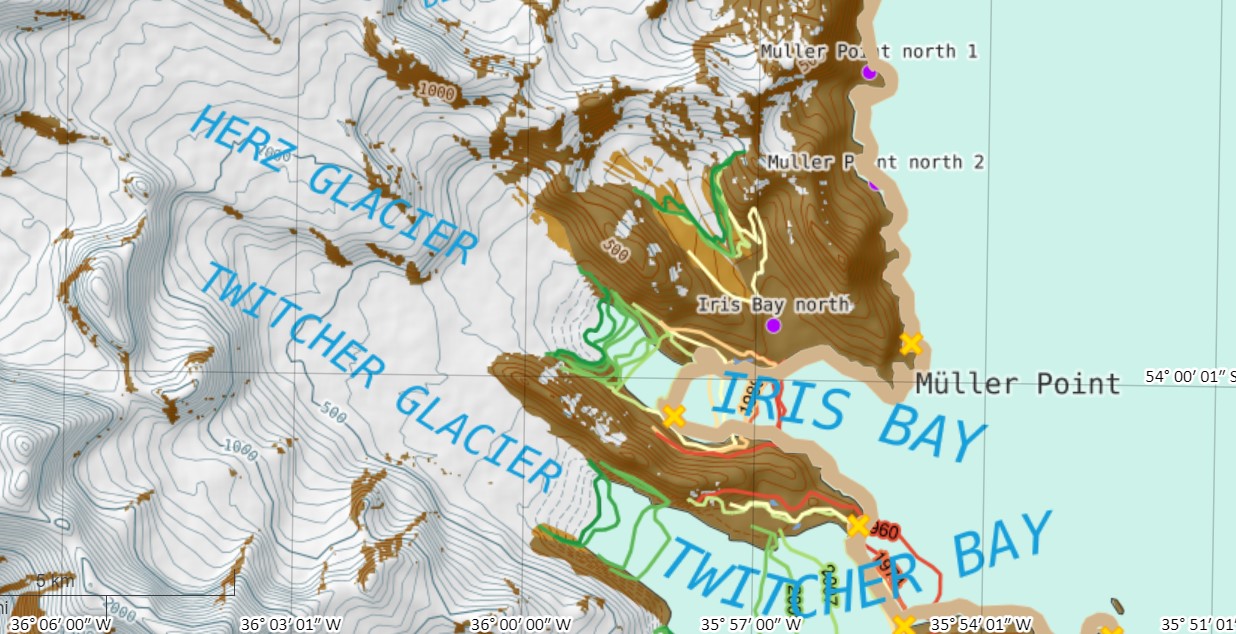
Herz Glacier is on the southeast coast of South Georgia Island, and is adjacent to the Twitcher Glacier. The terminus change of this tidewater glacier ending in Iris Bay was completed by the British Antarctic Survey for the 1960-2011 period, see map below (Gordon et al, 2008). This map indicates the slow retreat from 1960-1988 and a more rapid retreat since. Here we utilize Landsat imagery from 1989-2021 to examine terminus change.
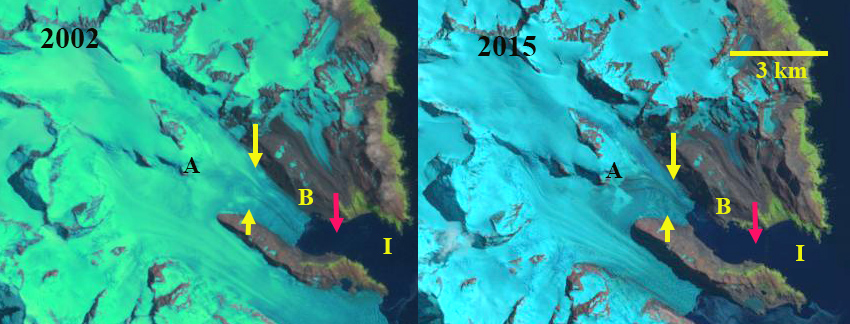
In 1989 the glacier is 10 km long with the terminus located in the east trending arm of Iris Bay at a point where it widens substantially. Point A is the midway point of the glacier. By 2002 the terminus has retreated ~1.1 km to Point B in a narrower portion of the fjord. The calving front is 0.9 km wide in 2002. By 2009 the glacier had retreated 1.8 km on the north side of the fjord and 2.2 km on the south side. The overall 2 km retreat is a rate of 100 meters/year and is 20 % of the total glacier length (Pelto, 2017). By 2015 the terminus has retreated into an even narrower portion of the fjord, which would reduce calving. The snowline in both 2002 and 2015 is ~1000 m. In 2021 the terminus has continued to recede and could be nearing the head of the fjord. The snowline in 2021 is somewhat above 1000 m in the early March landst image.
The retreat has been 2.5 km in the 32 year period from 1989-2021, a rate of 78 m/year. The glacier is nearing the inland end of the ridge separating Herz from Twitcher. As both Twitcher Bay and Iris Bay have expanded there are certainly new locations for both elephant seal and penguin colonies (BAS, 2018). The retreat of this glacier is comparable to that of other South Georgia glaciers noted by NASA Earth Observatory;Neumayer Glacier, Twitcher Glacier and Hindle Glacier.
Landsat images from 2002 and 2015 of Herz Glacier. Red arrow is 1989 terminus location, yellow arrows the 2021 terminus location. I=Iris Bay.
Map of Herz Glacier area from the British Antarctic Survey, illustraing glacier front changes 1988-2011. Yellow crosses mark elephant seal beaches and purple dots penguin colonies, which can expand to new locations in this opening fjord.
Upsala Glacier (U) in Landsat images from 1999, 2016 and 2021 illustrating both retreat and the separation from Bertacchi Glacier (B). Cono Glacier (C) is the next tributary to the north.
Upsala Glacier is a major outlet glacier of the Southern Patagonia Icefield. The glacier terminates in Lago Argentina and retreated substantially, 7.2 km from 1986-2014 (NASA, 2014). The retreat accelerated after 2008 (Sakakibara et al 2013). From 2014-2019 the rapid retreat had slowed, but given mass losses upglacier and consistent high snowlines ~1300 m in 2018-2021, not for long.
Landsat images from 1999-2021 illustrate the retreat of the glacier. In 1999 the terminus is 3 km south of the junction. By 2016 the terminus has retreated to the junction. The combined calving front has a width of 2.8 km, and there is a 1.3 km long connection zone between Bertacchi and Upsala. By April and May 2021 the separation is nearly complete with a 0.3 km long connection zone, and in increase to 3.3 km wide calving front, in a Sentinel 2 image from May 5, 2021. The glaciers that have been joined for many centuries if not millenia, provide stability to each other at the junction, as there is converging flow that buttresses both. As this buttressing is removed, the terminuses of both glaciers in the vicinity of the current terminus will be less stable.
De Angelis (2017) noted the equilibrium line for Upsala Glacier was 1170 m based on 2002 and 2004 observations, which equates to an AAR of 65%. On Feb 14, 2018 the TSL reached its highest observable elevation at 1275-1300 m. On March 14, 2019 the TSL reached 1300 m again. On April 8, 2020 the TSL reached 1325-1350 m upglacier of Point A and nearly to the Viedma Glacier divide. On April 17, 2020 the TSL had descended slightly to 1300 to 1325 m. The ELA of ~1350 m is the highest annual observation for Upsala Glacier and equates to an AAR of ~48%. On April 17, 2021 the snowline on Upsala Glacier is again at ~1300 m. The consistently high snowlines drive mass balance losses, which leads to thinning and reduced flux to the terminus. Malz et al (2018) indicated a 3.3 m thinning of Upsala glacier with significant thinning extending to the Viedma Glacier divide. Popken et al (2019) mapped the velocity at the confluence. The much slower Bertacchi has a low terminus velocity, in part due to the buttressing of Upsala.
The separation of Upsala Glacier due to rapid retreat parallels this pattern observed at other Southern Patagonia icefield outlet glaciers; Lago Onelli and Dickson Glacier
May 5, 2021 Sentinel image of terminus zone of Upsala and Bertacchi Glacier.
Snowline on Upsala Glacier in April 2020 and 2021 Landsat images-pink dots, both years above 1300 m.
Terminus of Bertacchi and Upsala glacier in Apil 2020 and March 2021, note icebergs in March of 2021 from recent calving.
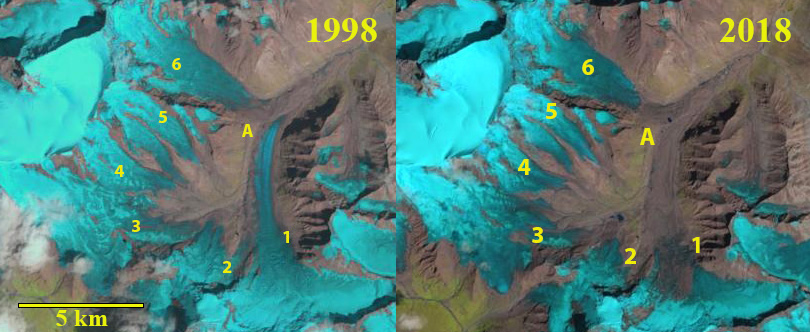
Shafat Glacier in 1997 and 2020 Landsat images. 1-6 are different tributaries with the main glacier being #1. A marks the junction of #1 and #6.
Shafat Glacier occupies the northeast flank of Nun Kun Peak in Ladakh India and drains into the Suru valley. The main valley glacier (1) has been fed by a decreasing number of tributaries. Shukla et al (2020) identified an increase in annual temperature has driven a 6% loss in regional glacier area and a 62% expansion in debris cover from 1971-2017. Here we compare Landsat imagery from 1997-2020 to identify this glaciers response to climate change.
In 1997 and 1998 tributary 2 and 3 join and then the debris covered sections connects to the main valley glacier #1. Tributary 4 terminus is the meeting point of two glacier tongues. The active non-debris covered ice of Tributary #6 reaches to the valley adjacent to Point A where it meets the main valley tongue. The active clean ice of the main tongue extends beyond Point A. In 1997-2000 the terminus is heavily debris covered with the main discharge from beneath the glacier at Point B. The active ice of Tributary 6 extends to within 1.5 km of the terminus, while the active/clean ice of the main tongue extends to within 1.3 km of the terminus. The snowline is at 4900 m in 1997 and 5100 m in 1998. By 2018-2020 the active ice area now ends 2.5 km from the terminus for Tributary 6 and 5.1 km from the terminus for the main glacier. Debris cover extends 5.3 km from the terminus up the main tongue and 2.7 km from terminus at Point B up Tributary 6. Retreat is hard to discern with the extensive stagnant debris covered area. Tributary 4 has separated into two parts, and tributary 2 and 3 have separated from each other and the main valley glacier. In 2018 the snowline is at 5200 m, while in 2020 it is 5050 m. The consistent high snowlines have led to glacier thinning, debris cover expansion, and increasing stagnation of the main glacier tongue. The stagnation is indicated by the increasingly concave cross profile and the lack of crevassing in the lower 5 km of the main glacier tongue below 4600 m. The low slope of the glacier from 4250-4400 m, of 4.8% suggests a proglacial lake could form in this reach of the main valley.
The glacier volume loss is more substantial than the area loss, with retreat less than on Kolahoi Glacier, but volume loss similar (Rashid et al 2019). Loss of glacier area leads to summer glacier runoff declines, which impacts irrigation Rashid et al 2019). The Suru River also has a 44 MW run of river Chutak Hydropower plant.
Shafat Glacier in 1998 and 2018 Landsat images. 1-6 are different tributaries with the main glacier being #1. A marks the junction of #1 and #6.
Digital Globe image of the terminus reach in 2000 and 2019. B marks the location of main river exiting from beneath the glacier. A marks the junction of the two glaciers. 1 and 6 indicate the two main glaciers that join 2 km above the Shafat Glacier terminus. Note debris cover spread particularly on main tongue.
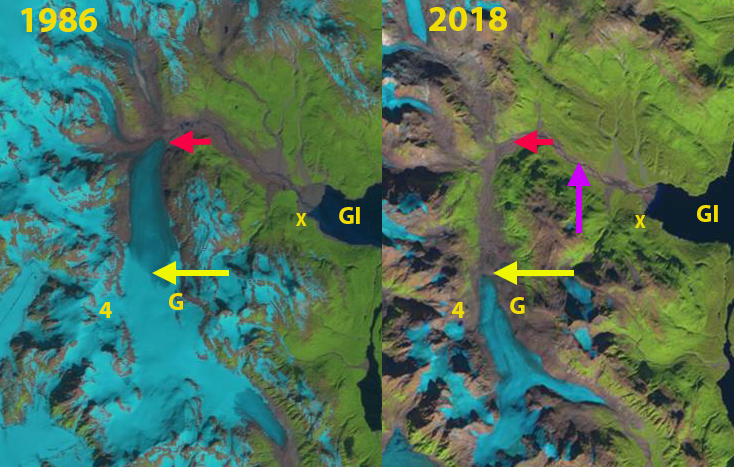
Geikie Glacier (G) in 1986 and 2018 Landsat images. Pink arrow is the 1954 terminus, red arrow the 1986 terminus and yellow arrow the 2018 terminus location. GI is Geikie Inlet which the glacier withdrew from 110 years ago.
Geikie Glacier is on the west side of Glacier Bay, Alaska. John Muir in October 1879 observed Geikie Glacier in Geikie Inlet, which had separated from Muir Glacier within the last 20 years. He wrote in John Muir Travels in Alaska, “Its lofty blue cliffs, looming through the dragged skirts of the clouds, gave a tremendous impression of savage power, while the roar of the newborn icebergs thickened and emphasized the general roar of the storm.” By 1892 when surveyed by H.F. Reid it had retreated to within several kilometers of the head of the inlet. It retreated from tidewater in ~1910 (Field, 1966), with the full inlet being 15 km in length. I had the opportunity to visit the glacier in 1982 arriving by float pane at the X at the head of the inlet. There was no glacier even in sight, where a century before was buried beneath thick glacier ice. It took us four hours to reach the terminus through what was a mixed outwash plain with developing shrubs. Today that same journey would be much more difficult as the shrubs, trees and undergrowth have thickened. William O. Field with the American Geographical Society visited Geikie Glacier in 1935, 1941, 1950 and 1958, noting limited retreat from tidewater up to 1935. though considerable frontal thinning was evident. Here we examine the changes using Landsat images from 1986, 2018 and 2019 combined with the 1961 USGS Mount Fairweather C-2 topographic map based on 1948 and 1955 photographs.
By ~1950 the glacier had retreated 2.1 km from tidewater, a rate of 50 m/year. The retreat had been interrupted by a small advance around 1920 (Field, 1966). In 1950 the glacier is fed by four tributary glaciers, with three feeding in, as the glacier makes an eastward turn. By 1986 the terminus had retreated 4.3 km from tidewater, no longer rounding the eastward bend, the retreat rate since ~1950 had been ~60 m/year. Tributaries 1-3 had separated from the glacier.
In 2014 and 2015 the glacier lost all of its snowcover (see below). In 2018 the glacier had retreated 4.1 km since 1986 and 8.3 km from the inlet. The rate had increased to ~125 m/year. Tributary 4 had separated from the glacier. The glacier shares a divide at ~600 m with a south flowing glacier and the head of the glacier is at ~1000 m. In 2014, 2015, 2018 and 2019 the entire glacier lost all of its snowcover, indicating a glacier that cannot survive, as a consistent accumulation zone is essential (Pelto, 2010). The demise of Geikie Glacier is less complete than that of nearby Burroughs Glacier, but with current climate no less certain. The glacier was ~14.5 km long when I journeyed there in 1982 and in 2018/19 is just 6.1 km long, a loss of 58% of its length in 36 years.
In 2018 and 2019 the snowlines were the highest of any year since at least 1946 on nearby Taku Glacier (Pelto, 2019) and on Brady Glacier. The rising snow lines on Brady Glacier had been observed in recent years by Pelto et al (2013). which has led to the start of a retreat. The lack of retained accumulation has also been noted at Lemon Creek Glacier and similar to Brady Glacier, Taku Glacier has now began a retreat ( McNeil et al, 2020).
Geikie Glacier (G) in 1961 USGS map and 2019 Landsat image. Red arrow the 1986 terminus and yellow arrow the 2018 terminus location. GI is Geikie Inlet which the glacier withdrew from 110 years ago.
US Navy aerial photograph of Geikie Glacier terminus in 1948, tributaries 1-3 labeled. Digital Globe Image of the glacier in 2014, Point A in both is head of eastward turn.
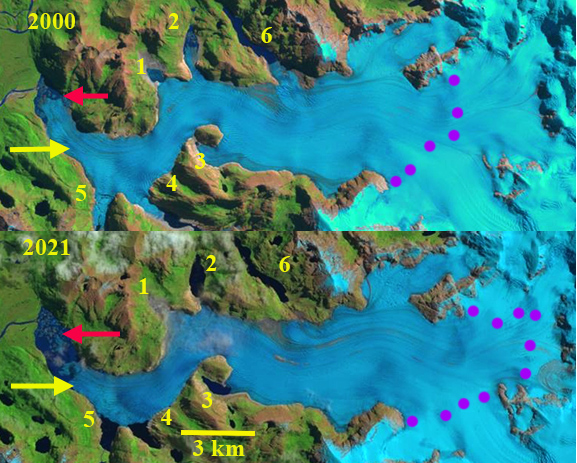
Benito Glacier in 2000 and 2021 Landsat images. Locations 1-6 are current or former distributary terminus locations. Red arrow is the 2000 terminus location and yellow arrow the 2021 terminus location. A small cloud is obscuring an iceberg near terminus. Purple dots are the snowline.
Benito Glacier is a temperate outlet glacier on the west side of the North Patagonian Icefield terminating in an expanding lake. The glacier is south of San Quintin Glacier and north of Acodado Glacier. Loriaux and Casassa (2013) examined the expansion of lakes of the Northern Patagonia Ice Cap. From 1945 to 2011 lake area expanded 65%, 66 square kilometers. Ryan et al (2018) identified thinning of 2.8 m/year in the ablation zone from 2000-2013, and that thinning of over 120 m extended from the terminus to ~750 m from 1973-2017. Mouginot and Rignot (2015) indicate that the velocity of Benito Glacier is between 200-500 m per year along the center line below the snowline. Glasser et al (2016) note the glacier has limited debris cover and that the average transient snowline in 2013-2016 is at 1000 m, substantially above the ~900 m average from earlier.
Benito Glacier in 1987 main terminus was on an outwash plain. The glacier has five distributary termini (1,2,34,5,6) two of which had open proglacial lakes in 1987. At Point 3 the glacier flows around a nunatak and reconnects. In 2000 a 1 km long proglacial has formed at the main terminus. Distributary termini 1,2 and 4 all have proglacial lakes. The snowline in 1987 and 2000 is 800-825 m. By 2015 there are five ending in lakes, with Lake 6 having retreated out of a lake basin. A lake has formed at the new distributary terminus at Lake 3. The two tributaries to the north indicated with arrows each retreat approximately 1 km from 1987 to 2015 and in both cases are no longer calving termini. The main glacier terminus has retreated into a proglacial lake, with a retreat of 2 km from 1987 to 2015. The lowest 1.5 km has a low slope and peripheral lakes suggesting the lake will expand substantially as Benito Glacier retreat continues. The transient snowline in 2015 is at 900 m. In 2021 a significant iceberg 0.4 km2 has calved off the terminus. The terminus has retreated 2900 m from 1987-2021 with the lake area expanding to 2.8 km2. The lower 1.5 km of the glacier remains low sloped suggesting significant lake expansion is ongoing. The glacier no longer reaches the former proglacial lake 2 or 6. Proglacial lake 1 has drained. Proglacial lake 2,3, and 4 continue to expand. The snowline on Feb. 6 2021 is at 875-900 m, rising to 925-950 m by March 16, 2021.
March 17, 2021 Landsat image indicating iceberg located off front of Benito Glacier
Benito Glacier comparison in Landsat images from 1987 and 2015 indicating the terminus position in 1987 red arrows, yellow arrows the 2015 terminus positions. Locations 1-6 are current or former distributary terminus locations. purple arrows where glacier thinning is expanding bedrock areas. The snowline is indicated by purple dots
Bonar Glacier in 1992 and 2021 Landsat image. Red arrow is the 1992 reconstituted terminus location, yellow arrow the 2021 terminus location and purple dots the snowline.
Bonar Glacier is on the west flank of Mount Aspiring flowing north from Mount before turning sharply west and descending towards a lake and draining into the Waipara River. The NIWA glacier monitoring program noted that 30 per cent of New Zealand’s ice that was existed in the late 1970s has been lost in the past 40 years as snowlines have been rising. The retreat has been driven by a series of increasingly warm summers (NIWA, 2019). Bonar Glacier is one of the six largest west side glaciers in the NZ Alps and has no significant debris cover (Baumman et al 2021). Here we examine Landsat imagery from 1992-2021 to identify changes.
In 1992 the glacier descends west down the steep slope to its terminus at 1150 m avlanching down the steep slope to a reconstituted glacier at the head of a 1 km long proglacial lake at ~550 m. In 2001 there is no reconstituted glacier at the lake, the terminus is at ~1200 m in elevation. By 2020 the glacier terminus has receded to ~1250 m, the snowline is at 1900 m above the first icefall in early March. In 2021 the glacier has retreated 200 m, with its overall length being reduced by 3% since 1992. The snowline in 2021 is again at the top of the 1900 m icefall.
The retreat is more limited than at either Volta Glacier which is on the east side of Mount Aspiring, or at Snow White Glacier to the southwest. The mean elevation of glaciers in New Zealand is 1950 m (Baumman et al 2021). The mean elevation of Bonar Glacier is 2075-2090 m, which has enabled the glacier to endure recent warming better.
Bonar Glacier in aerial image from 2020, with red arrow indicating 1992 terminus location, note heavily crevassed areas on the east side draining from 2500 m on the slopes of Mount Aspiring and at the three icefalls areas on the main glacier.
Bonar Glacier topographic map, blue arrows indicate glacier flow. Icefalls at 2000 m, 1800 m and from 1600 m to the terminus at 1300 m.
Bonar Glacier in 2001 and 2020 Landsat image. Red arrow is the 1992 reconstituted terminus location, yellow arrow the 2021 terminus location and purple dots the snowline.
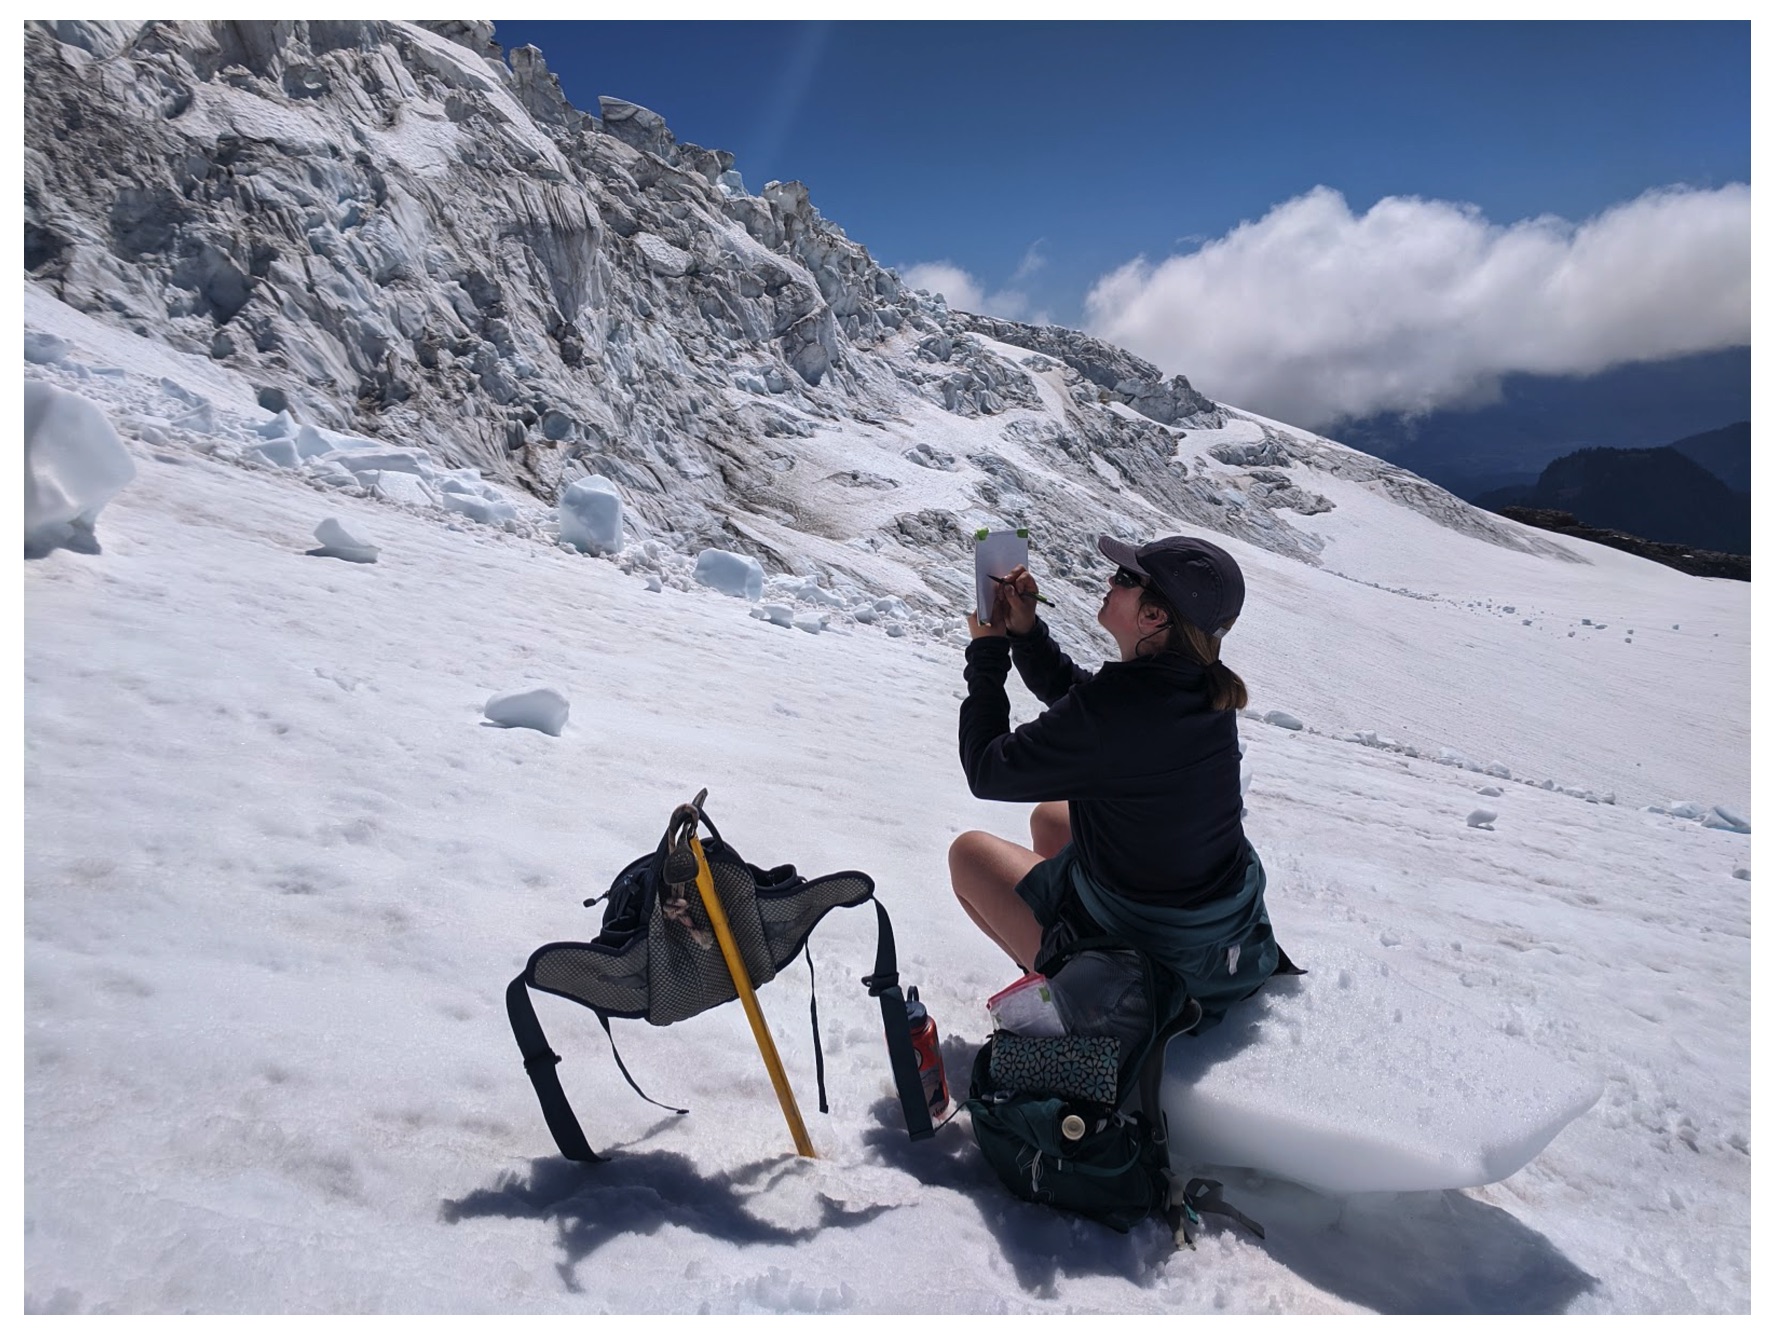
The field team at Camp discussing science communication and gazing at the Easton Glacier. Photo by Jill Pelto
By: Cal Waichler, Jill Pelto, and Mariama Dryak.
It is the evening of Aug. 9th, 2020 and six of us are camped near the terminus of Easton Glacier. The sun has dropped below the moraine ridge above camp and a chilly breeze has forced us to put on layers. We are enjoying dinner cooked on our camp stoves, discussing what we observed on the ice today. The toll of climate change on Easton Glacier, on the southern flank of Mount Baker, is impossible to escape. We are here to both measure this change and communicate what it means.
Within our team of six, four of us are trained as scientists, and all of us highly value creative science communication. This passion can manifest as art (painting, printmaking, sketching), writing, podcasting, blogging or video-making. We all appreciate that exercising creativity with others can provide us with a unique context for communicating about glaciers and climate change.
Cal creates at Columbia Glacier–sketching and taking notes to capture the power of our lunch spot that day. Photo by Mariama Dryak.Jill paints the icefall. Photo by Mariama Dryak. .
The Easton Glacier is large and stretches up to 2950 m elevation. We are here to monitor its health for the 31st consecutive year: its snow coverage, snow depth, terminus retreat, change in surface profile, and its annual mass balance (snow gain vs. snow loss). Easton Glacier is one of the forty-two World Glacier Monitoring Service reference glaciers, meaning it has 30+ consecutive year of mass balance observations, qualifying it for this select group. To learn more about this glacier over time, check out https://glaciers.nichols.edu/easton/ and a previous Easton Glacier update.
While we are at Easton Glacier to measure annual changes, we also see this landscape in the realm of both art and science. From the artistic lens we may note the same things that we do during research: the debris covering the retreating terminus, the crevasses melting down and getting shallower. But we also notice the beauty of these structures, how the crevasse patterns splay out across a knob, and the parallel lines preserved on a serac – recording five years of accumulation like rings on a tree. Observation is a theme in both art and science. We train our eyes to notice things in different ways, to pay attention to certain details. We are able to document these changes in our field notebooks, but also in sketchbooks, journals, photos, and videos.
The records of beauty stored in our sketchbooks serve as a qualitative reminder of what this landscape looks and feels like. In the process of depicting the landscape at the end of a field day, we paint our joy and exhaustion onto the page. In the moment, this act uncovers more details and allows us to reflect. Weeks later when we are off the mountain, we reopen our water-logged, dirt-streaked pages and are taken back to that place where we were. Field sketches, poems and paintings help us capture the emotion of moving through and attempting to understand sublime spaces. They are a vital link between our memories and sharing the meaning of our experience with others. They are also a deliberate recording of time and place — a kind of data in their own right.
The experience of working in this environment is memorable to us — we get to observe a plethora of crevasses, dozens of meltstreams, and strikingly beautiful colors. We can feel a range of excited, inspired, and nervous emotions throughout the day. For us, this experience is giving us the emotional context to our research: being present we can understand that “why”. That reason why the work matters not just for scientific knowledge, or the local ecosystem, but also for humanity. The science results alone can share the data that underlies that, but they might not always connect with other people in a way that elicits that comprehension. Our creative communication through writing and art can elicit that deeper, emotional understanding of why it’s important to preserve and protect these places, and why we need to understand the amount of change that will occur to the climate and ecosystem. Our collection of art shares stories about Easton Glacier in ways that connect with the science, and also go beyond it.
This summer we all felt especially fortunate to be in the North Cascades. Covid-19 has kept us all so isolated and often indoors. The chance to work on the glaciers and live at their feet for two weeks gave us back some of the breathing room we lacked in 2020 – a lucky opportunity indeed.
Snow White Glacier in Landsat images from 2002, 2016 and 2021. Point A is an alpine lake, Point B is new proglacial lake location, Point C is lower icefall and Point D the Upper Icefall. Blue arrows indicate glacier flow.
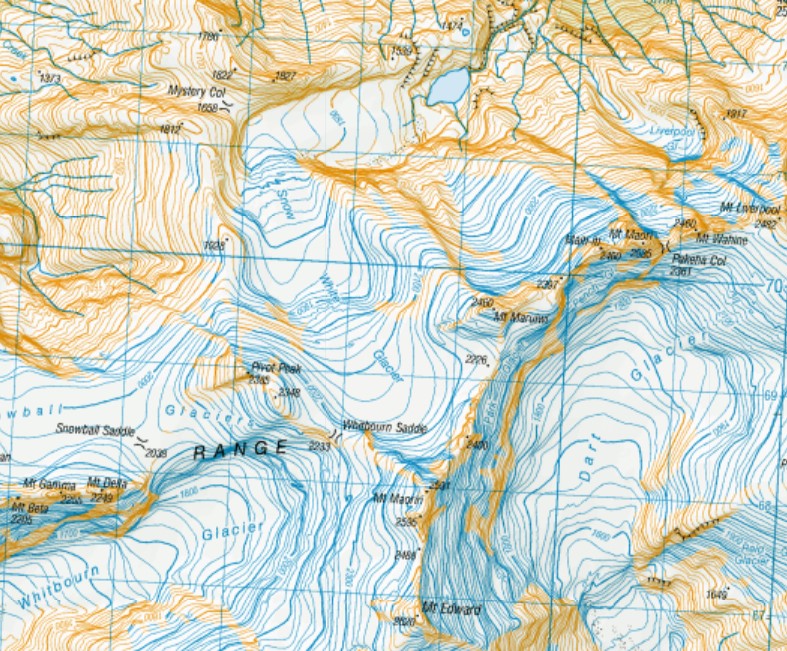
The Snow White Glacier is in the Snow Drift Range and Olivine Wilderness in Mt Aspiring National Park, New Zealand. The glacier flows north from 2400 m on the slopes of Mount Maoriri and Maruiwi through an icefall at 2000 m (D) and a second icefall (C) at 1700 m before taking a sharp eastward turn for the terminus reach and then draining into the Arawhata River. The NIWA glacier monitoring program noted that 30 per cent of New Zealand’s ice that was existed in the late 1970s has been lost in the past 40 years as snowlines have been rising. The retreat has been driven by a series of increasingly warm summers (NIWA, 2019). The NIWA 2021 snowline survey indicated near normal average end of summer snowline despite a La Nina (Drew Lorrey in NZHerald, 2021). Here we report on changes in Snow White Glacier using Landsat and Sentinel imagery from 2002-2021.
In a 2002 Landsat image Snow White Glacier had a wide terminus tongue filling a basin at Point B ~1400 m in elevation, 600 m from a small lake at Point A. The glacier is 400 m wide at the lower icefall and 600 m wide at Point B. By 2016 the lower icefall reach is down to 200 m in width, which means less ice is flowing from high on the glacier to the terminus. As a result the terminus lobe width has been reduced to 300 m and an incipient glacial lake is forming near Point B. By 2020 in a Sentinel image and Digital Globe image the lake forming at Point B is evident fringing much of the glacier. Notice the snowline reaches the upper icefall in 2020, and the icefall at Point C is too narrow to be stable. The lake in the Digital Globe image has an area of 0.1 km2. The icefall connection is less than 100 m wide and will soon disconnect the upper glacier from the terminus. In 2021 Landsat imagery indicates the terminus lake is continuing to expand and the icefall reach is even more tenuous. The glacier has retreated 450 m since 2002. The impending detachment will lead to a jump in the retreat to the new active terminus in the lower icefall, with the 1 km long stagnant tongue left behind.
This glaciers retreat parallels that of other glacier in the region such as Gunn Glacier and Donne Glacier, where new alpine lakes have recently formed also. The detachment is quite similar to that of Volta Glacier.
Digital Globe 2020 image of the terminus reach of Snow White Glacier indicating new lake near Point B.
.
Snow White Glacier in Sentinel and Digital Globe image from 2020. Point A is an alpine lake, Point B is a new proglacial lake, Point C is the lower icefall and Point D the Upper Icefall.
Topographic map of Snow White Glacier from NZTopo Map
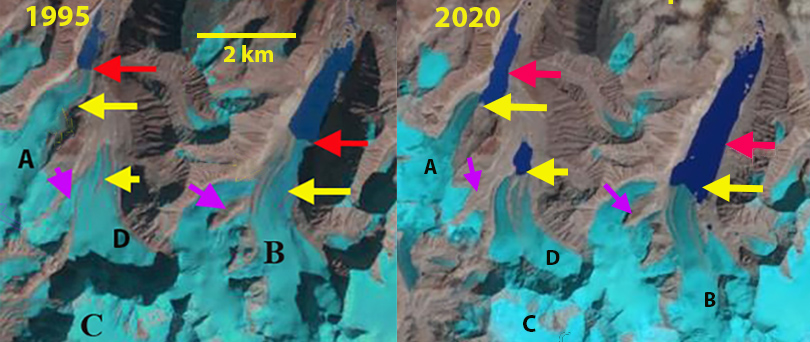
Bailang (B) and Angge Glacier (A) in 1995 and 2020 Landsat images indicating retreat and lake expansion. Red arrow is the 1995 terminus location, yellow arrow the 2020 terminus location, purple arrow rock ridges that expand separating tributaries. Chubda Glacier (C) to the south and an unnamed glacier Point D between Angge and Bailang.
Bailang Glacier and Angge Glacier, China are adjacent to the Chubda Glacier, Bhutan, They drain north from Chura Kang and are summer accumulation type glaciers that end in proglacial lakes. The glacier runoff feeds the Xung Qu River a tributary of the Kuri Chhu in Bhutan that powers the Kurichhu Hydropower plant a 60 mw run of river plant in Eastern Bhutan. Both lakes are impounded by broad moraines that show no sign of instability for glacier lake outburst flood. The number of glacier lakes in the adjacent Pumqu Basin to the west has increased from 199 to 254 since the 1970’s with less than 10% deemed dangerous (Che et al, 2014). In the Yi’ong Zangbo basin to the east Hongyu et al (2020) observed that from 1970 to 2016 total area of glaciers in the basin decreased by 35%, whereas the number of glacial lakes increased by 86. Here we compare Landsat images from 1995 and 2020 to identify their response to climate change.
Bailang Glacier in 1995 terminated in a proglacial lake that was 2.1 km long at an elevation of ~5170 m, red arrow. Angge Glacier terminated in a lake that was 1 km long at an elevation of ~5020 m. Between the two is an unnamed glacier labeled “D” here that does not end in a proglacial lake. By 2001 both glaciers experienced minor retreat of less than 250 m. By 2014 Bailang Glacier had retreated 800-900 m and the lake was now 3 km long and had no change in water level. A key tributary on the west side near the purple arrow had also detached. Angge Glacier retreat from 1995 to 2015 was 700 to 800 m, with the glacier retreating to a westward bend in the lake basin. The glacier has an icefall just above the current terminus suggesting the lake basin will soon end, which should slow retreat. The D Glacier between them has developed a proglacial lake as well. By 2020 the Bailang Glacier has retreated 1300 m since 1985 and has lost connection with tributaries on either side of the ridge on the west side of the glacier noted by the purple arrow. Angge Glacier has retreated 1100 m since 1995 and has a very narrow connection to the lake, which is now ~2 km long. The glacier in between Bailang and Angge, D Glacier, has developed a 900 m long proglacial lake which also matches the retreat during the last 25 years. This glacier has lost contact with its western tributary as well at western purple arrow.
Bailang (B) and Angge Glacier (A) in 2001 and 2014 Landsat images indicating retreat and lake expansion. Red arrow is the 1995 terminus location, yellow arrow the 2020 terminus location, purple arrow rock ridges that expand separating tributaries. Chubda Glacier (C) to the south and an unnamed glacier Point D between Angge and Bailang.
Gorra de Nieve East Glacier in 1986 and 2021 Landsat images. Red arrow is the 1986 terminus location, yellow arrow is the 2021 terminus location, orange arrows the three main tributaries.
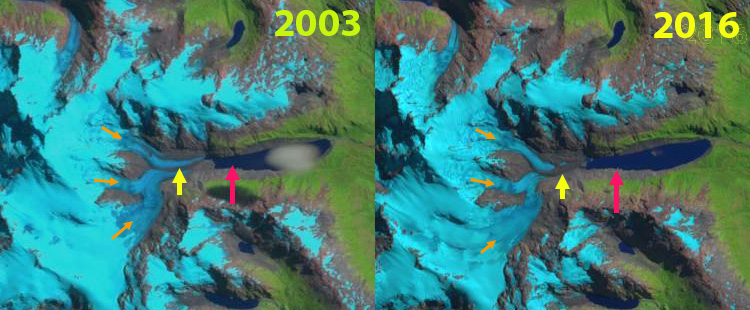
The Gorra de Nieve massif is 50 km southwest of Monte San Lorenzo, draining its eastern flank the largest glacier of this massif is unnamed and referred to here as Gorra de Nieve East Glacier. The glacier consists of three main tributaries that join shortly above the proglacial lake the glacier has terminated in, which drains into the Rio Bravo. In this region glaciers thinned by ~0.5 m/year from 2000-2012 with most of the thinning on Gorra de Nieve East Glacier occurring on the lower sloped valley section below 1100 m (Falaschi et al 2017). The glacial history of the region is detailed in a visual map that includes moraines and trimlines including around the expanding proglacial lake discussed here Davies et al (2020). Here we examine the changes of the glacier and the expanding proglacial lake from 1986 to 2020.
In 1986 the glacier terminated in a 3 km long proglacial lake, red arrow. Three primary tributaries joined ~2 km above the terminus at 900 m, orange arrows. By 2003 the glacier has retreated ~500 m and the lateral moraines have become more prominent covering a majority of the glacier width. By 2016 the glacier has retreated ~900 m from the 1986 position and lateral moraine debris covers nearly the entire lower 1 km of the glacier. In 2021 the tributaries are separating with the northern tributary the only one feeding the terminus. The glacier has retreated 1500 m since 1986 and the proglacial lake is 4.5 km long. The two southern tributaries will separate soon and the northern tributary will also retreat from the lake.
Gorra de Nieve East Glacier in 2003 and 2016 Landsat images. Red arrow is the 1986 terminus location, yellow arrow is the 2021 terminus location, orange arrows the three main tributaries.
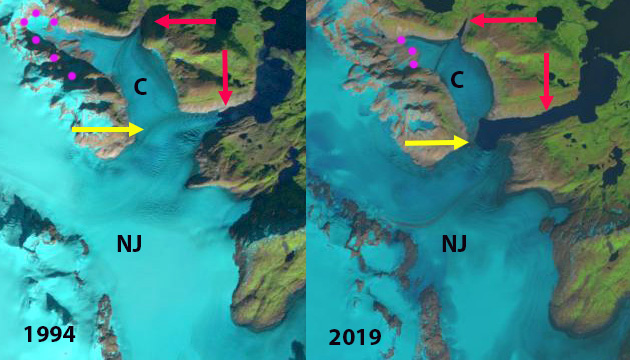
Nellie Juan Glacier (NJ) and Contact Glacier (C) in 1986 and 2020 Landsat images. Red arrow is the 1986 terminus location of both glaciers. Yellow arrow marks the terminus location in 2020 after glacier separation and purple dots mark the upper limit of Contact glacier at that time.
Nellie Juan Glacier is a tidewater outlet glacier of the Sargent Icefield, Alaska. Just after 1935 the glacier retreated from moraine shoal into deeper water of the fjord leading to a rapid calving retreat of 2250 m from 1950-2000, a rate of ~45 m/year (Barclay et al 2003). The rate of retreat increased to ~124 m/year from 2006-2018 (Maraldo, 2020). Harbor seals enjoy Port Nellie Juan and the icebergs from the glacier, with a population of ~44,000 identified in 2019 for the greater Prince William Sound region. From 1950-2018 Port Nellie Juan was fed in part by the Contact Glacier, a tributary that also had a separate terminus. Here we examine the changes of Nellie Juan and Contact Glacier using Landsat imagery from 1986-2020.
In 1986 the glacier terminated in a 0.5-km-wide calving front 1 km down fjord from the junction with Contact Glacier, which was 2 km wide. The snowline is at 500 m, the upper margin of Contact Glacier is indicated by purple dots and ranges from 400-500 m. The retreat by 1994 is ~300 m, the snowline is at 500 m and Contact Glacier has almost no snowcover. In 2000 the connection with Contact Glacier is 1.9 km wide. By 2018 terminus retreat in the center of Nellie Juan Glacier since 1986 is 2500 m. There is fringing connection of ice 300 m wide with Contact Glacier. Contact Glacier upper margin is now at 250 m, resulting in a more rapid retreat of the head of the glacier on the northern arm 1800 m since 1986, than that of the main terminus of Contact Glacier of 500 m. The snowline in 2018 is at 900 m, leaving the primary accumulation zone of Nellie Juan Glacier without snowcover. In 2019 there is still a narrow connection between Nellie Juan and Contact Glacier. In 2020 the two glaciers have separated. Contact Glacier, which had an area of 6.5 km2 in 1986, in 2020 has an area of 3.5 km2. Contact Glacier has lacked an accumulation zone during most years in this period and cannot be sustained. Nellie Juan Glacier has retreated 2800 m along the former centerline and what is now its northern margin since 1986. In 2020 the main accumulation area of Nellie Juan Glacier is again without snowcover, with a snowline above 900 m.
The glacier is terminating near a region of prominent crevassing indicating a bedrock step that may mark the head of the fjord. This will lead to an end to calving retreat and iceberg production, which will impact harbor seal haul out in the fjord (Jansen et al 2015). The retreat of Nellie Juan is less extensive than at Excelsior Glacier or Ellsworth Glacier draining the south side of the icefield. The percent loss in area of Contact Glacier is greater than other regional examples.
Nellie Juan Glacier (NJ) and Contact Glacier (C) in 1994 and 2019 Landsat images. Red arrow is the 1986 terminus location of both glaciers. Yellow arrow marks the terminus location in 2020 after glacier separation and purple dots mark the upper limit of Contact glacier at that time. In 2019 the glaciers are still connected.
Nellie Juan Glacier (NJ) and Contact Glacier (C) in 2000 and 2018 Landsat images. Red arrow is the 1986 terminus location of both glaciers. Yellow arrow marks the terminus location in 2020 after glacier separation and purple dots mark the upper limit of Contact glacier at that time. In 2018 the glaciers are still connected
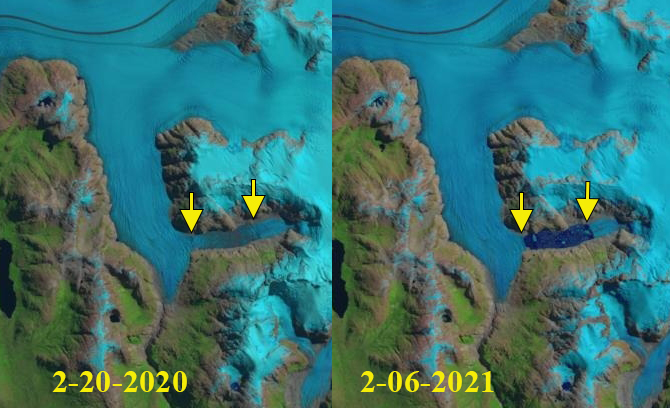
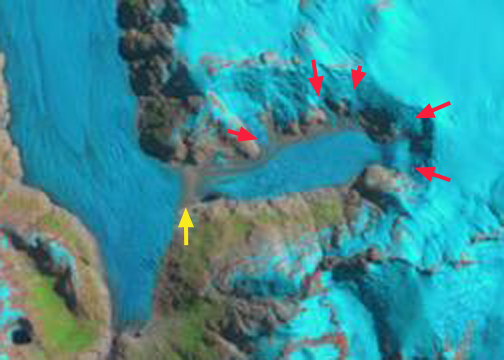
Glacier dammed lake formation at HPN4 Glacier, Chile between Landsat images of Feb. 2020 and Feb. 2021, yellow arrows indicating new calving fronts on either end of lake.
HPN4 Glacier drains the southern side of NPI just east of Steffen Glacier. The terminus retreated little from 1987-2015, see below (Pelto, 2015 and 2017). The main change is in the eastern tributary 1-2 km north of the terminus. In 1987 there were five separate feeder ice tongues descending from the ice cap into this valley. By 2015 there was just one. Further this tongue has narrow and downwasted and a new lake is developing.
In February 2020 the lake has still not formed, note yellow arrows. In February 2021 the lake has formed between the yellow arrows and is 2 km long and has an area of 1.1 km2. The drainage of this lake was reported by on Claudio Bravo Lechuga comparing PlanetLab images from 2-15-2021 and 2-23-2021.
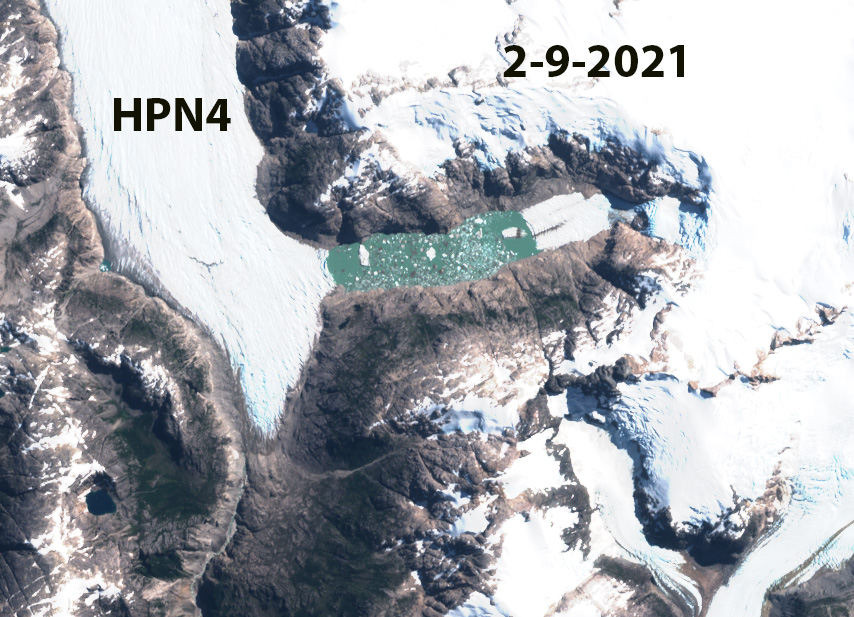
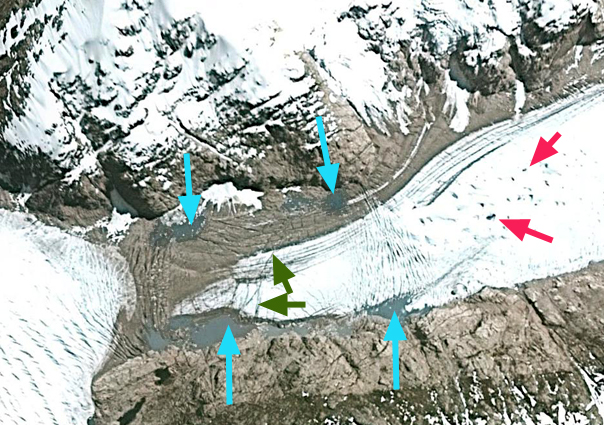
HPN4 and glacier dammed lake in Sentinel2 Image from 2-9-2021.
HPN4 Glacier in 1987 and 2015 Landsat imagery. Red arrow indicates 1987 terminus, yellow arrow 2015 terminus, purple arrows indicate medial moraines
The below is from Pelto (2015 and 2017). In 1987 and 2004 there were five contributing glacier tongues to the downwasting tributary, see below. It is like a bathtub being filled with five taps at once. The purple arrow indicates a medial moraine at the mouth of the valley, signaling the lack of current contribution of the downwasting tributary to HPN4 Glacier. The medial moraine has shifted east indicating that the main HPN4 Glacier is now flowing into the valley instead of the downwasting tributary being a contributing tributary to HPN4. By 2015 there is only one contributing glacier tongue to the downwasting tributary, only one tap for this draining bathtub, the other four contributing tongues have retreated from contact with the downwasting tributary. The medial moraine has spread eastward and some fringing proglacial/subglacial lakes are evident A closeup 2013 Digital Globe image indicates both fringing ponds-blue arrows, rifts caused by varying flotation-green arrows and expanding supraglacial ponds, red arrows. The rifts are a sign of instability and typically lead to break up of this portion of the terminus. The downwasting tributary continues to demise faster than HPN4 Glacier, which crosses the valley mouth, hence it is likely that a glacier dammed lake will form and that HPN4 Glacier will continue to flow further east up this valley.
Schaefer et al (2013) discuss the HPN4 Glacier because the main terminus has changed little given its modeled mass balance, and the modeled mass balance to the east appears too negative, which they suggest indicates wind redistribution from the HPN4 to the Pared Sud Glacier just east. Davies and Glasser, (2012) identify this region of the icefield as retreating faster from 2001-2011 than during any measured period since 1870. This has led to the formation and expansion of many lakes in the basin Loriaux and Cassasa (2013) . Glasser et al (2016) observed that proglacial and ice-proximal lakes of NPI increased from 112 to 198 km2. The largest expansion this century being at San Quintin Glacier at ~24 square kilometers.
2004 Landsat image showing five contributing tributaries