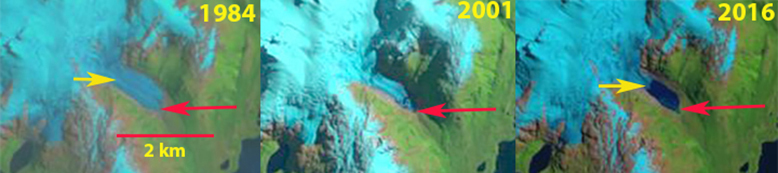
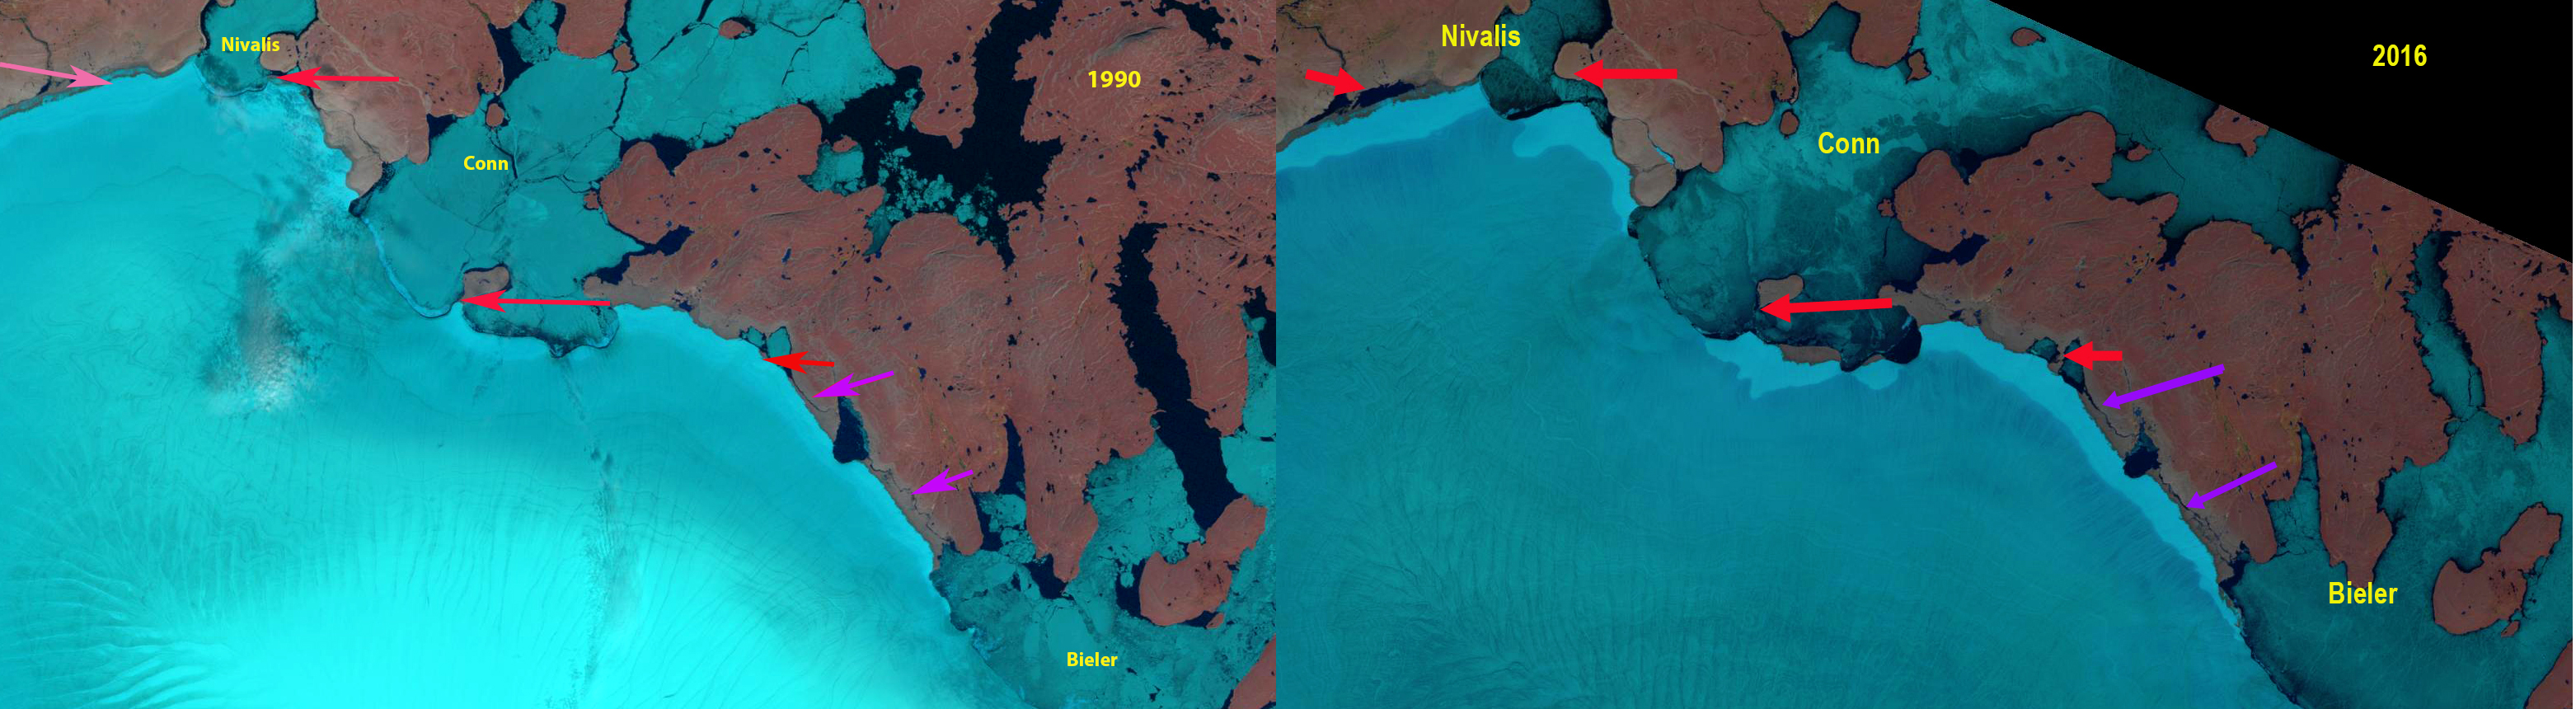
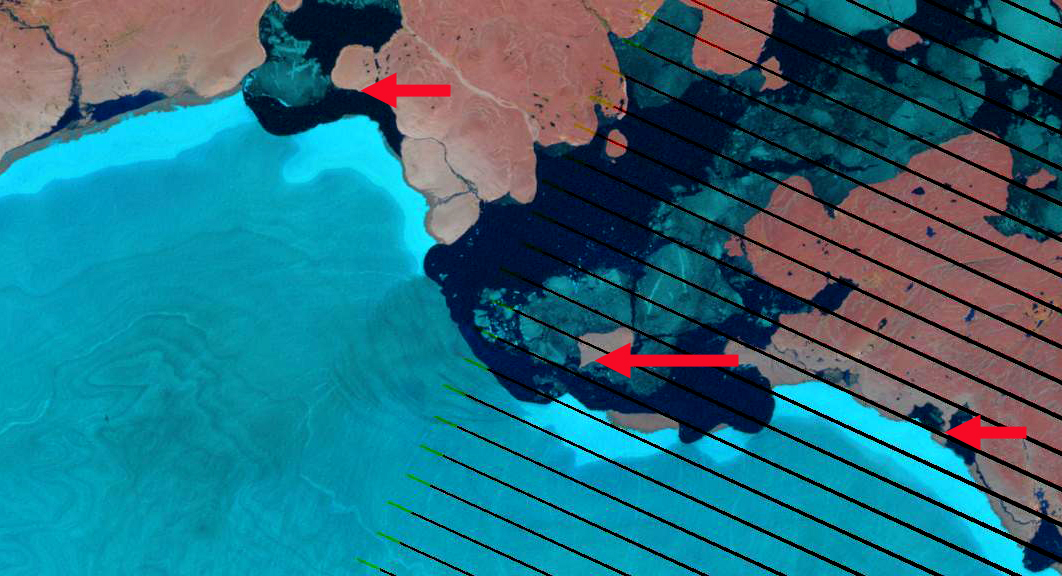
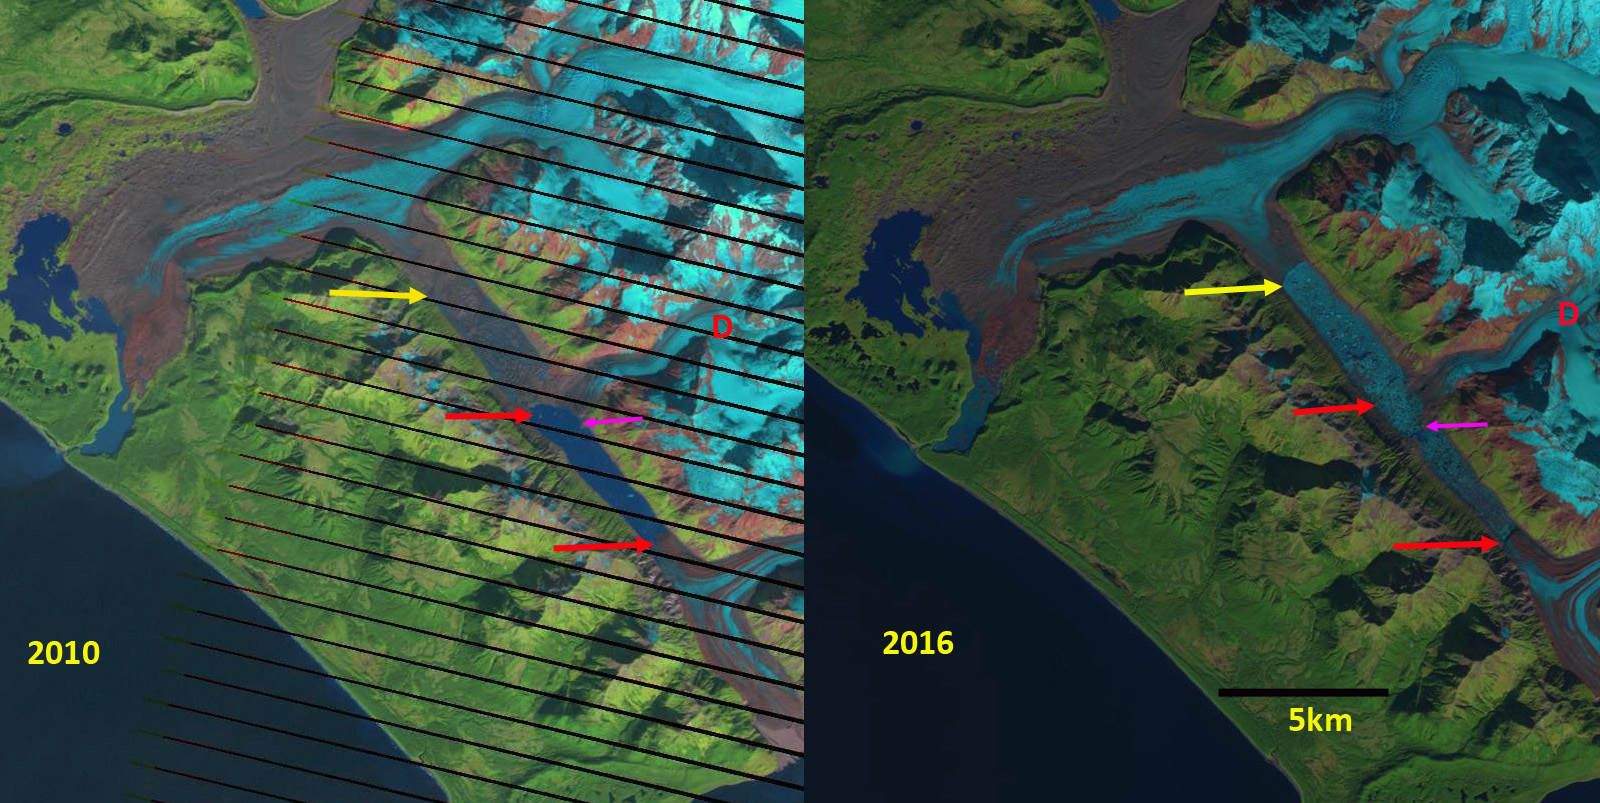
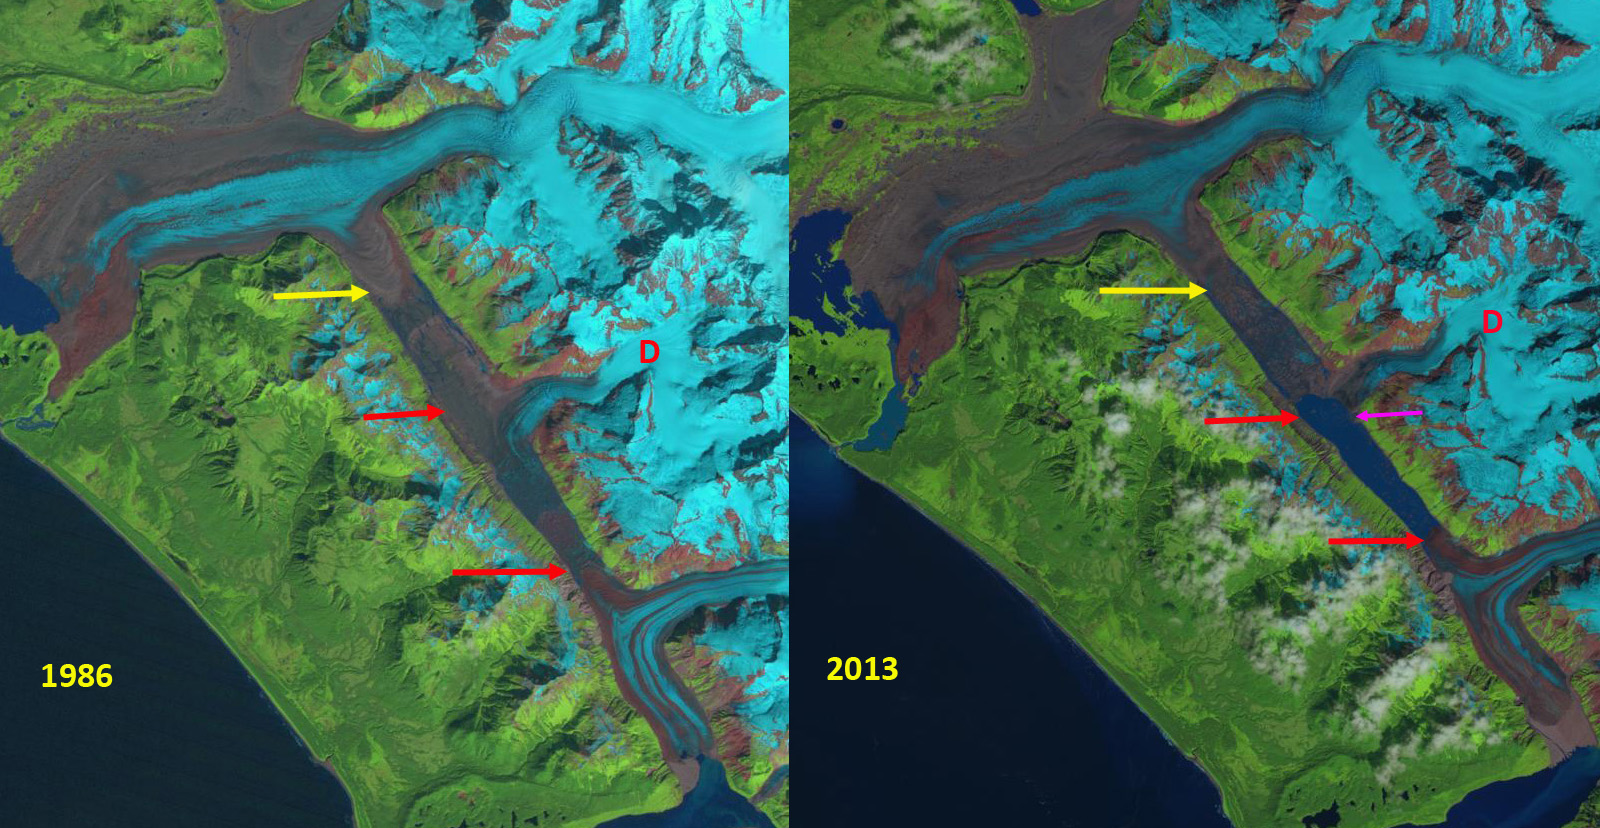
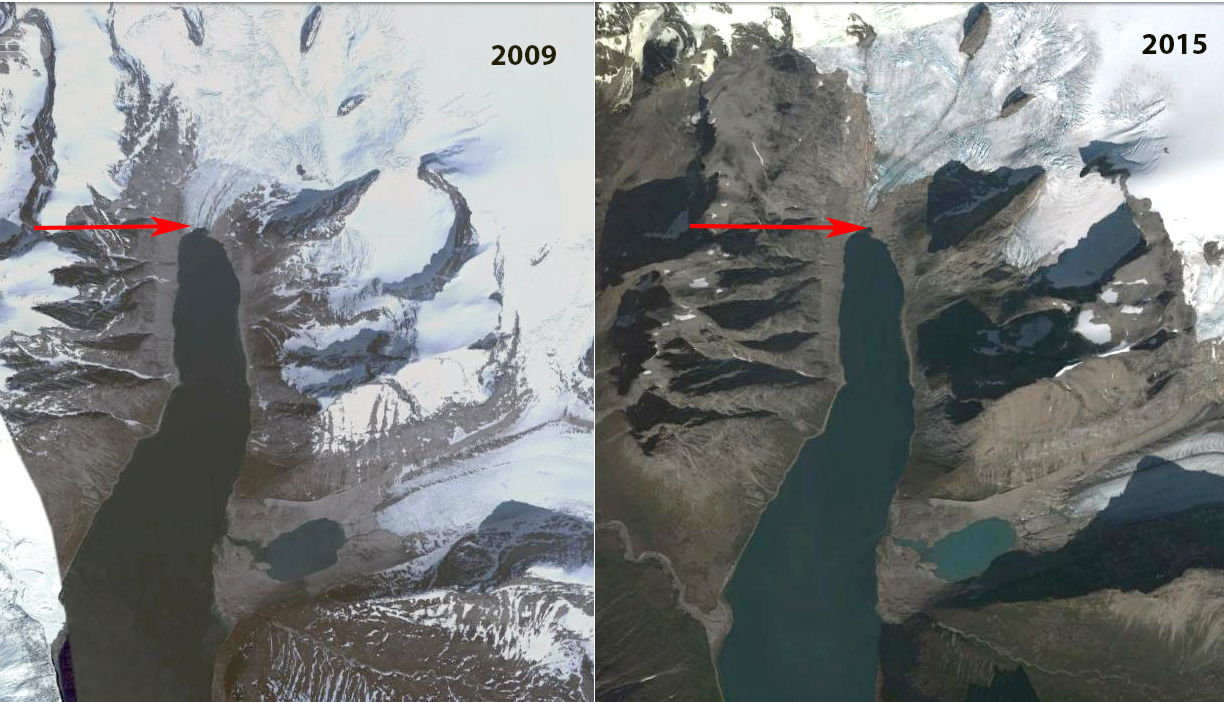
Landsat comparison of Semenova Glacier in 1998 and 2016. Red arrow is the 1998 terminus, yellow arrow is the 2016 terminus and purple are locations where tributaries are separating from each other or disconnecting from the main glacier.
Semienova Glacier is a valley glacier in the northeast corner of Kyrgyzstan draining into the Sary Dzhaz (Aksu) River which then flows into the Tarim Basin, China. Farinotti et al. (2015) used three approaches to assess glacier change in the Tien Shan from 1961 to 2012. The results converge on an overall loss of glacier area of 19-27%,a glacier spatial extent of 2960 square kilometers. They further observed that it is primarily summer melting that has driven the change. Sorg et al (2012) showed that glacier shrinkage is most pronounced in peripheral, lower-elevation ranges near the densely populated regions, where summers are dry and where snow and glacial meltwater is essential for water availability. Shifts of seasonal runoff maximum have already been observed in some rivers, and further summer runoff reductions are expected. Li et al (2014) identify a reduction in velocity of a number of large glaciers, including Semienova Glacier in the Tien Shan from 2007-2011 that is likely due to mass losses. Semienova Glacier had a peak velocity 10 km above terminus at 12 cm/day, declining to less than 2 cm day in the last 1-2 kilometers.
From 1998 to 2016 the glacier has retreated 500 m, this is a relatively modest retreat for a glacier of this size. Debris cover has expanded and supraglacial stream networks have expanded indicating an increasingly stagnant terminus tongue, supporting the low velocity observations. There are three tributaries that joined the glacier in 1998, at the 3 eastern most purple arrows, have detached from the main glacier by 2016. This indicates reduced contributions to the main glacier tongue. The two purple arrows on glaciers flowing into the valley from the south are located where two formerly joined glaciers are increasingly separated. The snowline in the glacier separating the melt zone and accumulation zone was at 4000 m in 2002, 2013 and 2016. The retreat of glaciers in the region has also been observed in the Barskoon Mountains and Petrov Glacier.

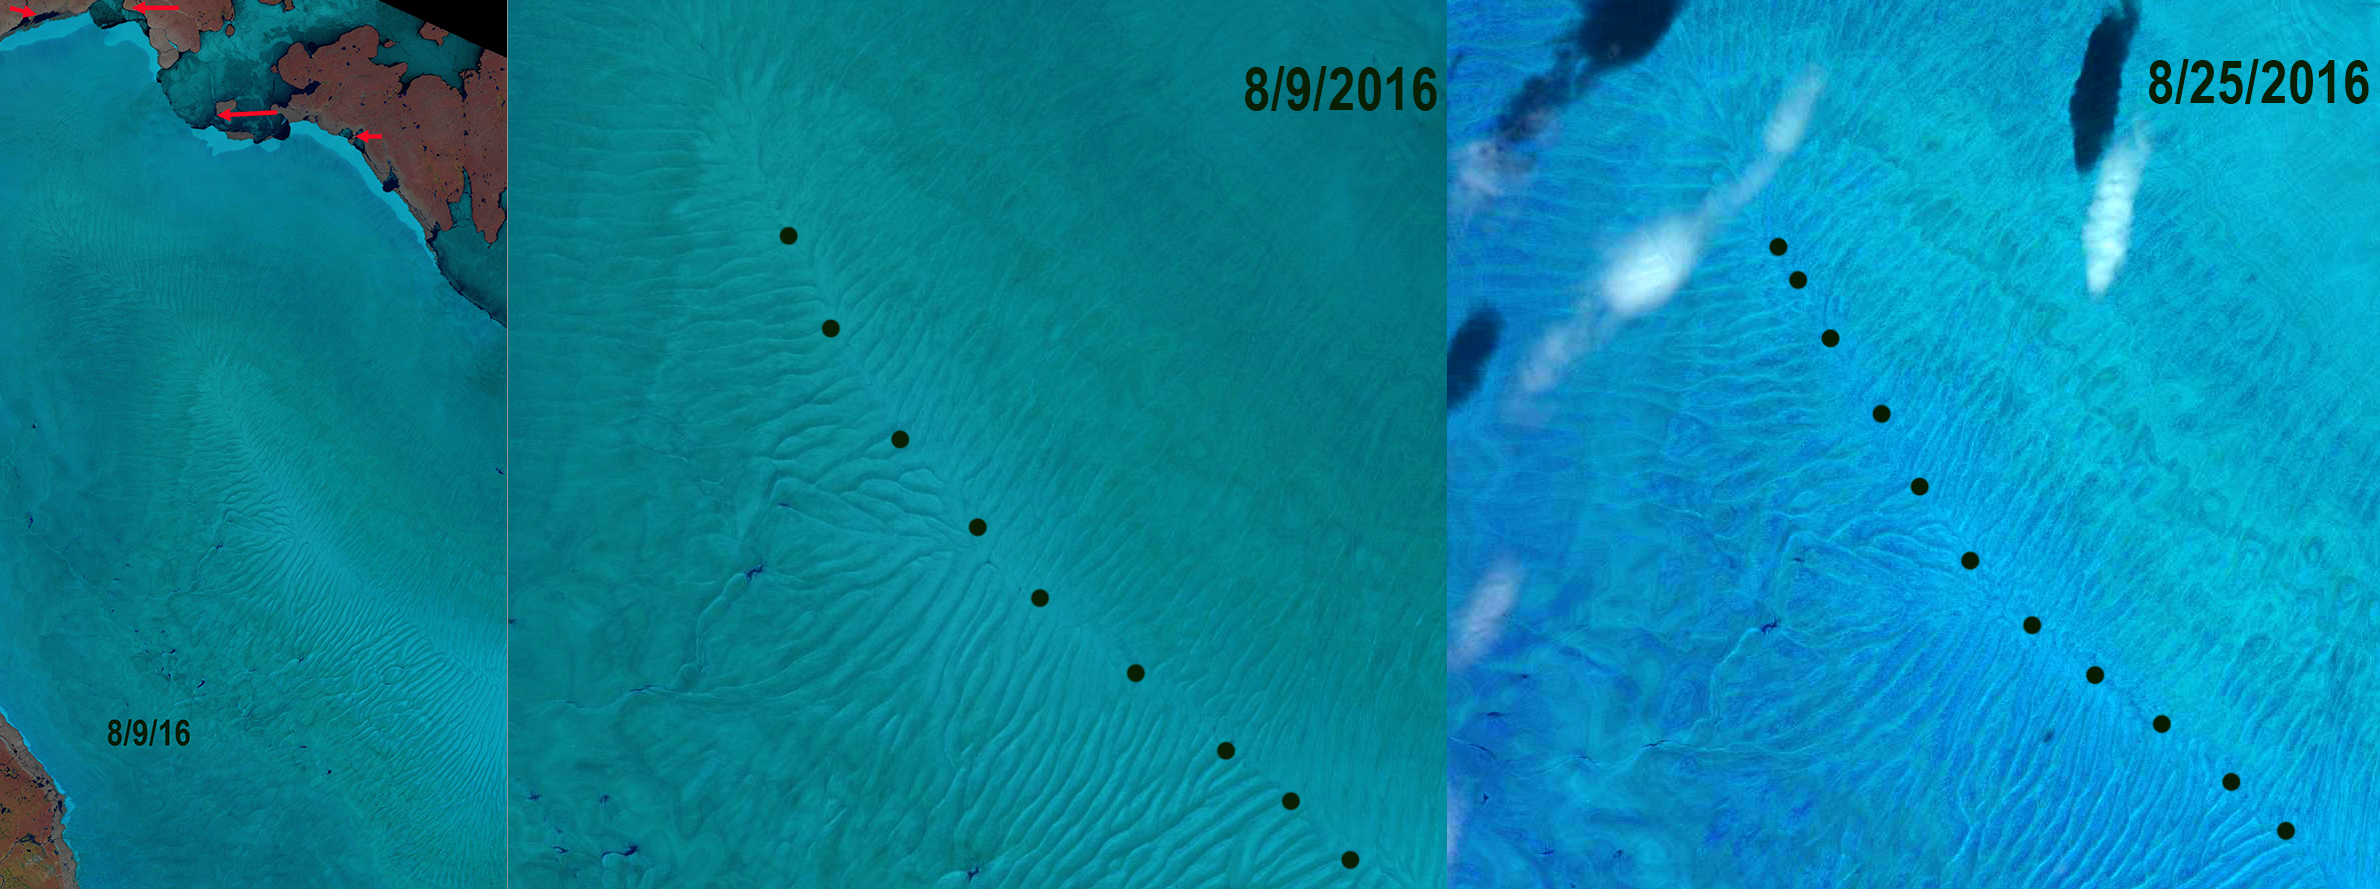
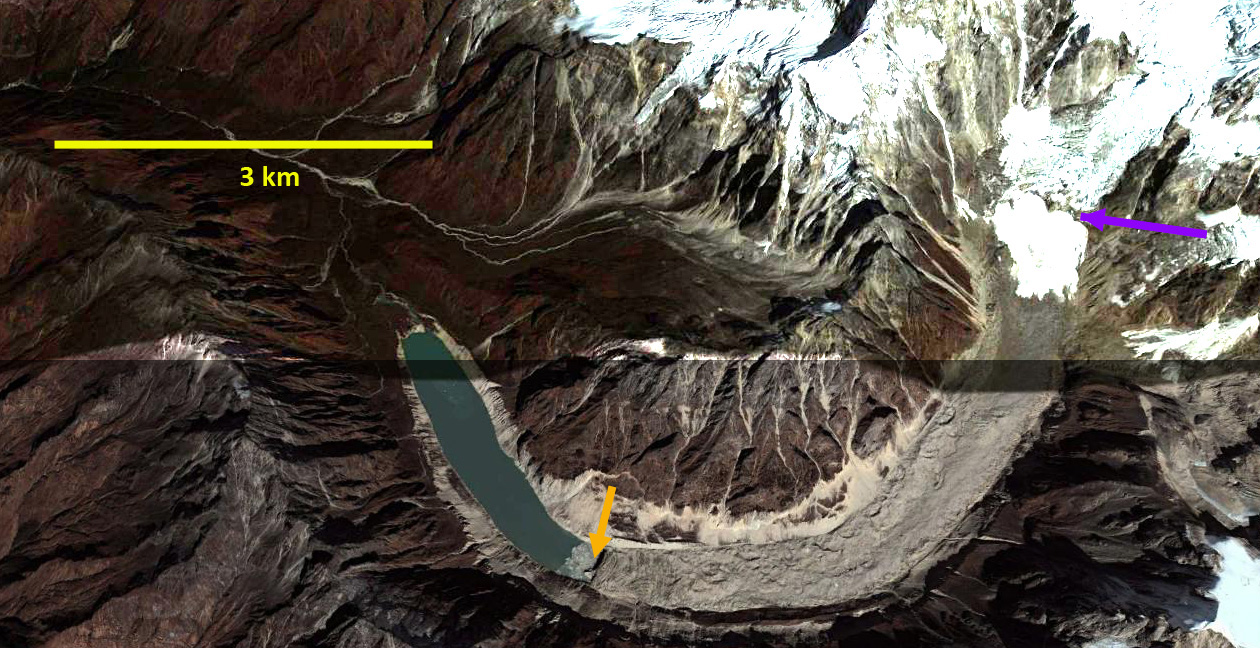
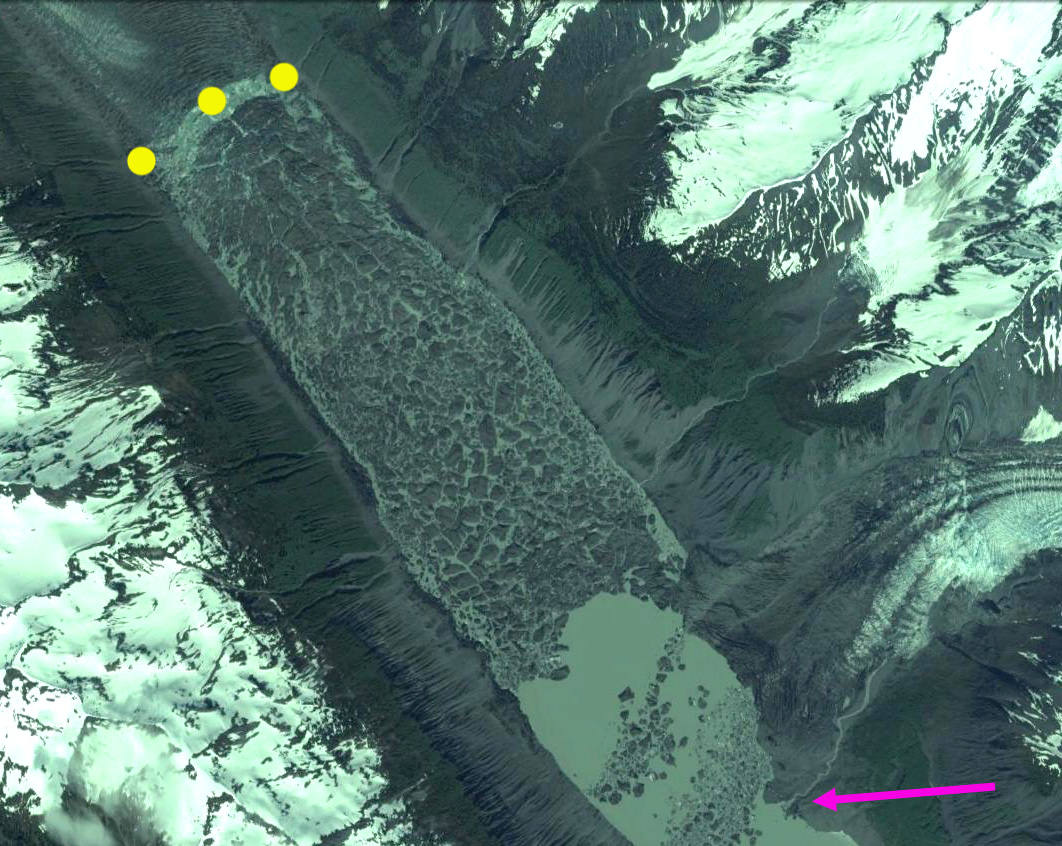
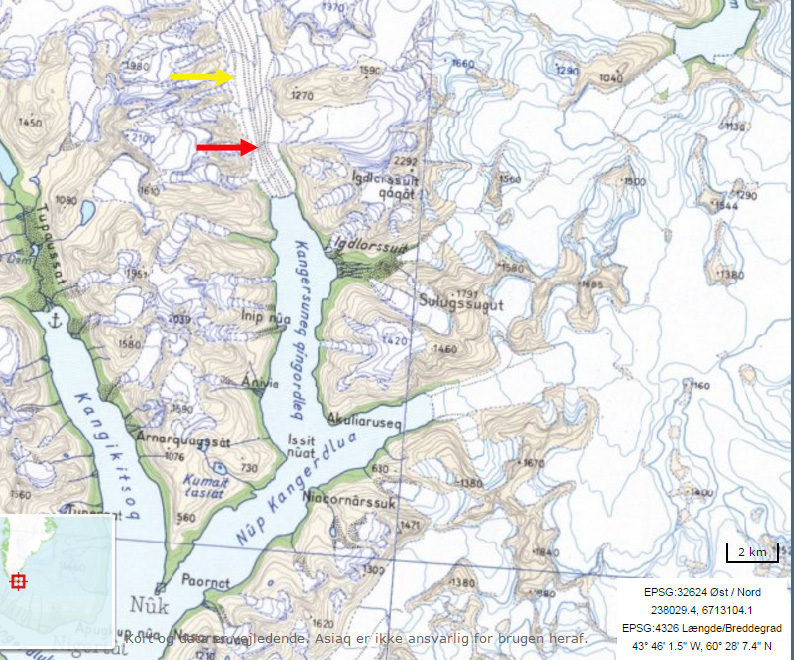
Sentinel image of Semienova Glacier in 2016. Black arrow is 1998 terminus, white arrow the 2016 terminus and black dots the snowline in 2016.

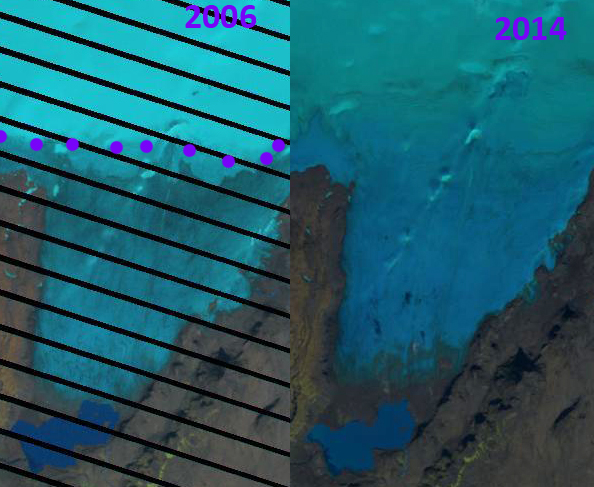
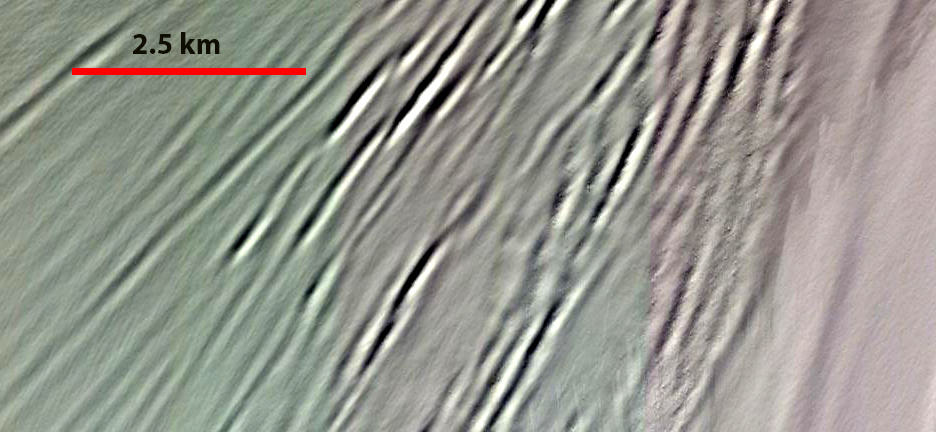
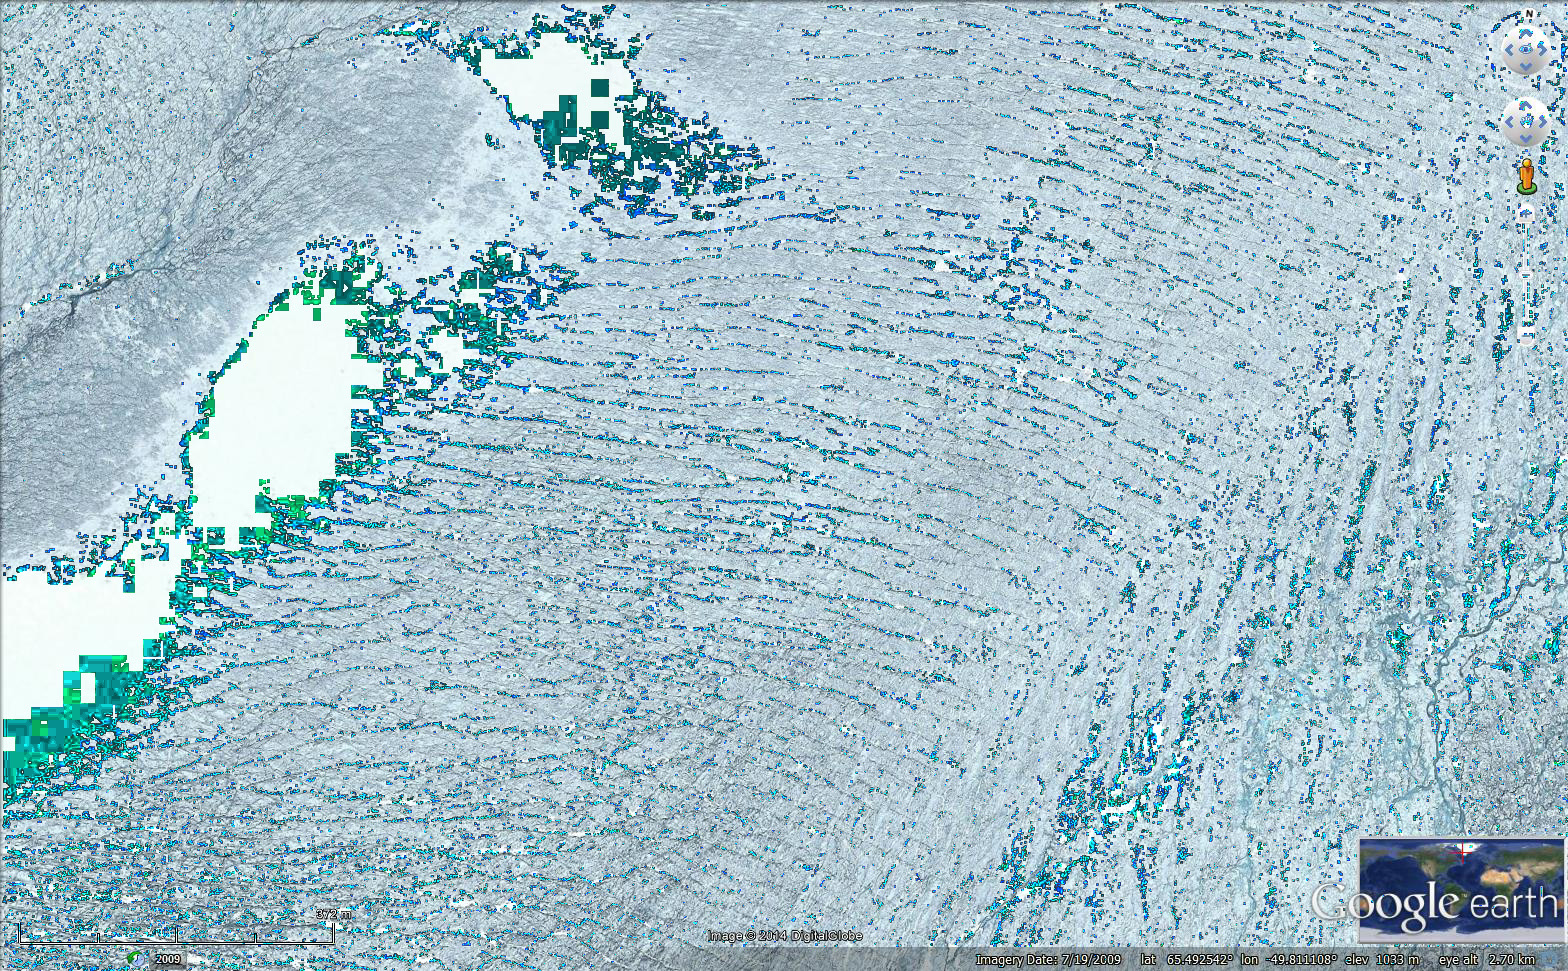
Landsat images of Semenova Glacier in 2002 above and 2013 below. Red arrow is the 1998 terminus, yellow arrow is the 2016 terminus and purple are locations where tributaries are separating from each other or disconnecting from the main glacier. Purple dots indicate the snowline.