Bailang Glacier and Angge Glacier Retreat, China 1995-2015

bailang compare

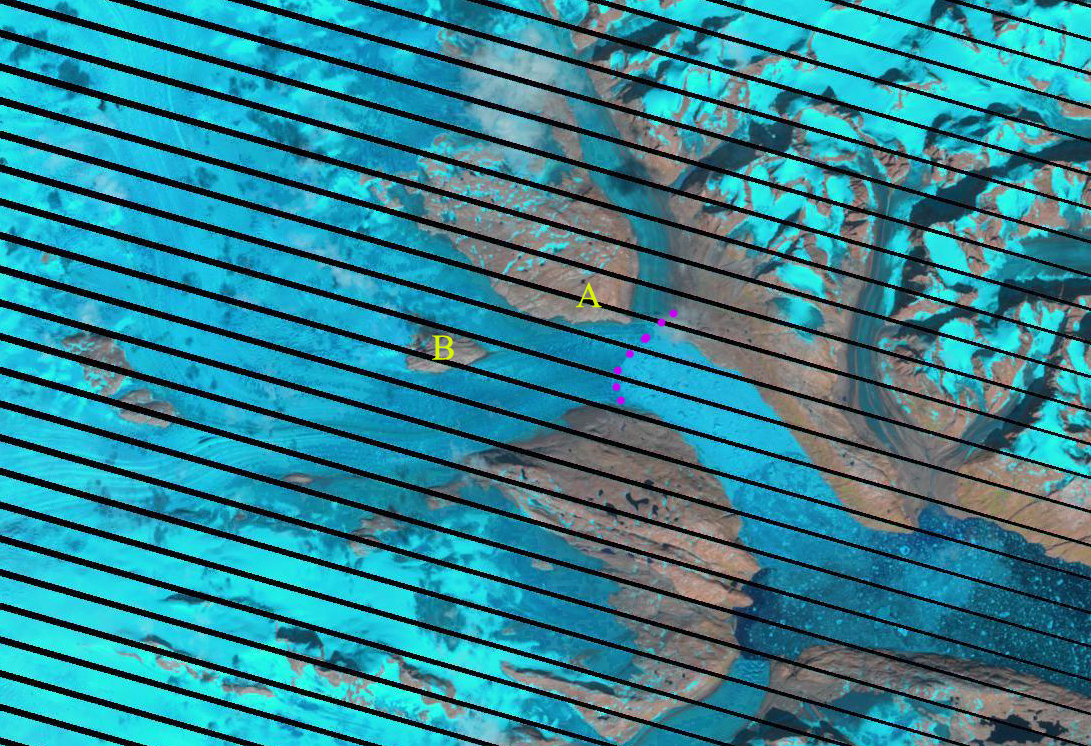
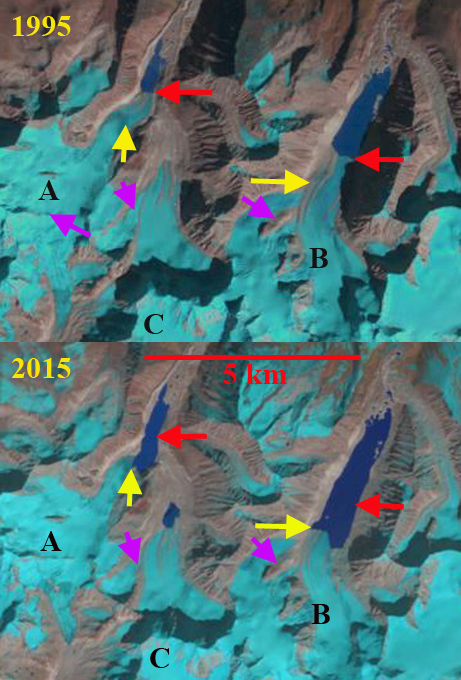
Comparison of 1995 and 2015 Landsat image illustrating 1995 (red arrows) and 2015 terminus locations (yellow arrows) of Bailang Glacier (B) and Angge Glacier (A).  Purple arrows indicate areas upglacier of expanding bedrock due to glacier thinning. Head of Chubda Glacier (C), Bhutan indicated. 

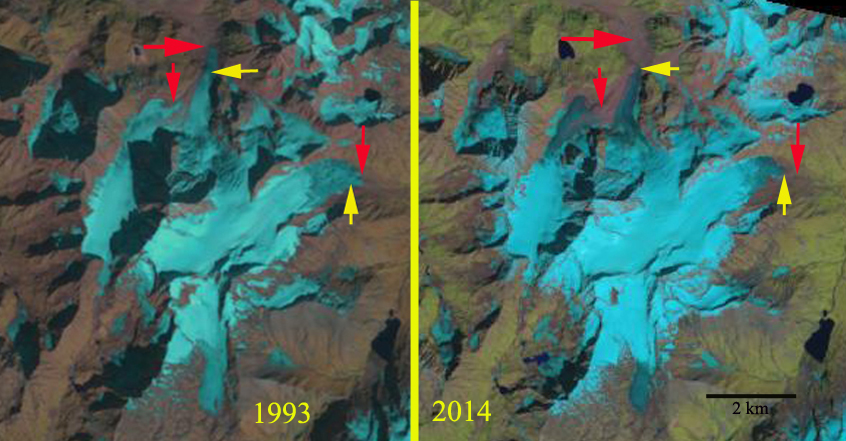
Bailang Glacier and Angge Glacier, China are adjacent to the Chubda Glacier, Bhutan.  Despite being in a different nation on a different side of the Himalaya, the behavior is the same. These are both summer accumulation type glaciers that end in proglacial lakes.  Both lakes are impounded by broad moraines that show no sign of instability for a potential glacier lake outburst flood. The number of glacier lakes in the adjacent Pumqu Basin to the west has increased from 199 to 254 since the 1970’s with less than 10% deemed dangerous  (Che et al, 2014) Here we compare Landsat images from 1995 and 2015 to identify their response to climate change.   The second Chinese Glacier inventory (Wei et al. 2014) indicated a 21% loss in glacier area in this region from 1970 to 2009.

Bailang Glacier in 1995 terminated in a proglacial lake that was 2.1 km long at an elevation of ~5170 m, red arrow. Angge Glacier terminated in a lake that was 1 km long at an elevation of ~5020 m.  By 2001 both glaciers had experienced minor retreat of less than 250 m.  By 2014 both lakes had expanded considerably due to retreat, no significant change in water level had occurred. By 2015 Bailang Glacier had retreated  800-900 m and the lake was now 3 km long.  A key tributary on the west side near the yellow arrow had also detached. There is no significant slope change in the lower 1 km of the glacier indicating retreat should continue enhanced by melting in and calving in the proglacial lake.  For Angge Glacier retreat from 1995 to 2015 was 700 to 800 m, with the glacier retreating to a westward bend in the lake basin.  The glacier has an icefall just above the current terminus suggesting the lake basin will soon end, which should slow retreat. The pattern of retreat and lake expansion is quite common as is evidence by Gelhaipuco, Thong Wuk and Longbashaba Glacier.

bailang glacier 2001

2001 Landsat image illustrating 1995 (red arrows) and 2015 terminus locations (yellow arrows) of Bailang Glacier (B) and Angge Glacier (A).  Head of Chubda Glacier (C), Bhutan indicated. 

bailang glacier 2014

2014 Landsat image illustrating 1995 (red arrows) and 2015 terminus locations (yellow arrows) of Bailang Glacier (B) and Angge Glacier (A).  Head of Chubda Glacier (C), Bhutan indicated. 
 

Chubda Glacier Retreat, Bhutan 1995-2015

chubda glacier compare

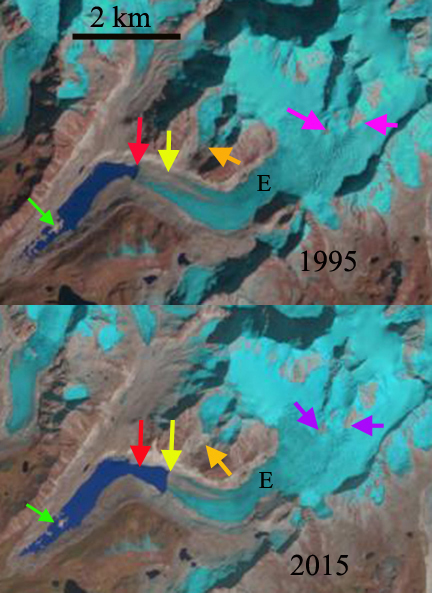
Chubda Glacier comparison in 1995 and 2015 images.  Red arrow indicates 1995 terminus location and yellow arrow is 2015 terminus location.  Pink arrows indicate areas upglacier of expanding bedrock. Green arrow indicates moraine areas amidst the lake.  The orange arrow indicates a secondary glacier.

Chubda Glacier, Bhutan drains south from Chura Kang on the Bhutan/China border.  The glacier terminates in Chubda Tsho, a glacier moraine dammed lake, Komori (2011) notes that the moraine is still stable and the lake is shallow near the moraine, suggesting it is not a threat for a glacier lake outburst flood. Mool et al, (2001) indicate the glacier was 3.4 km long and 0.3 km wide in the late 1990’s. Jain et al., (2015) noted that in the last decade the expansion rate of this lake has doubled. The glacier feeds the Chamkhar Chu basin which has a proposed 670 MW hydropower project under consideration. Here we examine changes in the Chubda Glacier from 1995 to 2015 with Landsat imagery.

In 1995 Chubda Glacier terminated at the red arrow and there was considerable ice cored moraine remaining in the southern portion of Chubda Tsho, green arrow.  The glacier is 700 m wide at Point E and has limited exposed bedrock areas just above the snowline above 2100 m, pink arrows.  A pair of secondary glacier have a joint terminus at the orange arrow In 2001 there are only minor changes from 1995.  In 2014 the snowline is at 2100 m, bedrock areas have expanded at pink arrows, and the amount of lake area at the southern end has expanded as ice cored moraine has melted out. In 2015 the glacier terminus has retreated 600 m since 1995, the lake area has expanded by ~2 square kilometers.  In 2015 the southern end of Chubda Tsho remains shallow and the wide moraine dam stable. The snowline is again at 2100 m and the glacier is only 500 m wide at Point E.  This indicates a continued decline in glacier flow into the terminus zone, which will lead to continued retreat. The secondary glaciers have now separated significantly, orange arrow.  The retreat of this glacier is similar to that of other glaciers such as Lugge and Thorthomia Glacier and just across the range in China, Zhizhai Glacier and Gelhaipuco Glacier.

chubde ge

Google Earth image of Chubda Glacier. Blue arrows indicate flow, brown arrow indicates wide moraine dam, green arrow indicates shallow moraine areas. 

chubde galcier 2001

Chubda Glacier 2001 Landsat image.  Red arrow indicates 1995 terminus location and yellow arrow is 2015 terminus location.  Pink arrows indicate areas upglacier of expanding bedrock. Green arrow indicates moraine areas amidst the lake.  

chubde glacier 2014

Chubda Glacier Landsat image in 2014.  Red arrow indicates 1995 terminus location and yellow arrow is 2015 terminus location.  Pink arrows indicate areas upglacier of expanding bedrock. Green arrow indicates moraine areas amidst the lake.  


Tingmiarmit Glacier Retreat Separates Tributaries, South East Greenland

tingmiarmit compare

Tingmiarmit Glacier comparison in 1999 and 2015 Landsat images indicating the separation of tributaries at the terminus. The red arrows indicate the 1999 terminus and the yellow arrows the 2015 terminus location.  Point A is peninsula where the tributaries joined, and Point B is a nunatak just upglacier from the 2015 terminus.

Tingmiarmit Glacier (Timmiarmiit also) ends in the Tingmiarmit Kangertivat Fjord in southeast Greenland.  The glacier is just south of Heimdal Glacier and is noted by Rignot et al (2012) as having a velocity of 1.4 to 3 km/year. Moon et al (2012) note that most glaciers in SE Greenland experienced a significant velocity increase after 2000. In 1999 the glacier terminus was beyond the junction of two main tributaries, with little variation from 1994.  Here we examine 1999-2015 imagery to identify the separation and retreat. The retreat is similar to that of nearby Thrym Glacier, which also had a tributary separation and nearby Puisortoq.

In 1999 the glacier terminates 1 km beyond the junction of the two tributaries, indicated by red arrow on each image.  The fjord is 2.2 km wide at this point.  The terminus had not changed in 2001 Landsat imagery.  By 2010 terminus is now located at the junction of the two glaciers. which still share a single calving front, though the calving front is longer with northern and western facing section.  In 2015 retreat has led to complete separation of the western and northern tributary. The western tributary is the main glacier and has retreated 2.4 km and the northern tributary has retreated 2.2 km in the sixteen year period.  The retreat of the northern tributary has been slower since 2010.  The western tributary now terminates 1.5 km from former junction.The fjord is expanding in width, which suggests the current terminus is not at a stable location. The nunatak marked B is a potential point of stability but not likely as the main arm of the glacier goes south of this location and then the fjord continues to expand.  Moon and Joughin (2008) observed an ice sheet tidewater glacier retreat rate increase from 2000-2006, coinciding with an increase here. Howat and Eddy (2010) noted a mean change for this region of -107 m per year.  Tingmiarmit Glacier’s rate of retreat was slightly higher at 120 m/year for the 1999-2010 period and . Polar Portal continues to expand the number of glaciers with updated terminus positions from satellite imagery with 20 presently.

Mountain Photographer Jack Brauer  captured an excellent image of the terminus area in late August, particularly given it was out a commercial airliner window.  This image illustrates the steeper slopes and much smaller contribution of the tributaries to the right (east) of Point A and B.  The image also indicates that Point B is likely not a significant pinning point to stabilize the terminus. The map below from the Greenland Geological Data viewer indicates the change with the tributaries now disconnected.

Aerial Greenland 6

Image from Jack Brauer, looking northwest toward Tingmiarmit. 

tingmiarmiit map

Greenland Geological Data, from the Geological Survey of Denmark and Greenland. 

tingmiarmiit 2001

2001 Landsat image

tingmiarmiit 2010

2010 Landsat image, purple dots indicate ice front. 


Eagle Glacier, Alaska Retreat Losing a Wing

eagle glacier change

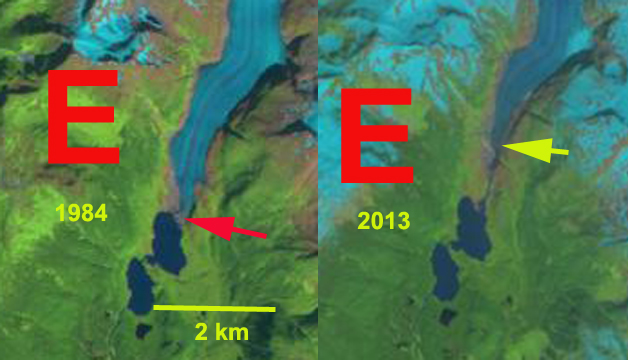
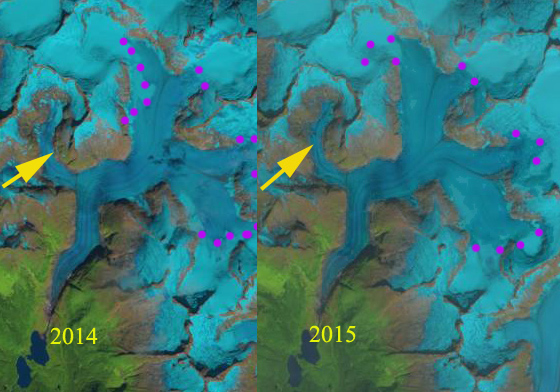
Above is a paired Landsat image from 1984 left and 2013 right indicating the 1100 m retreat during this period of Eagle Glacier.

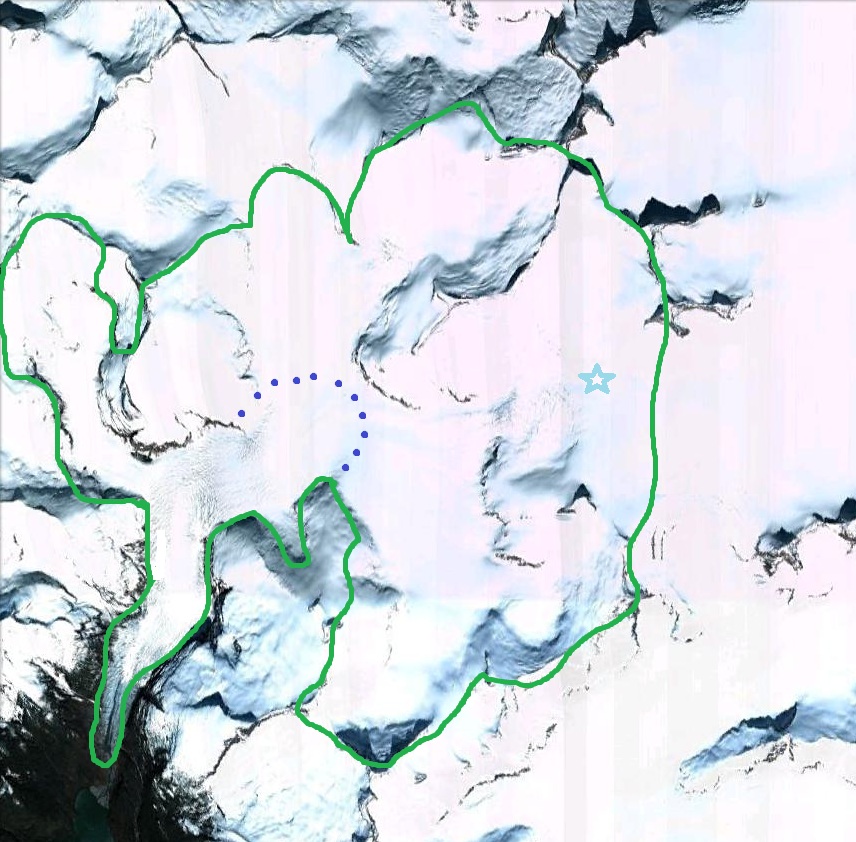
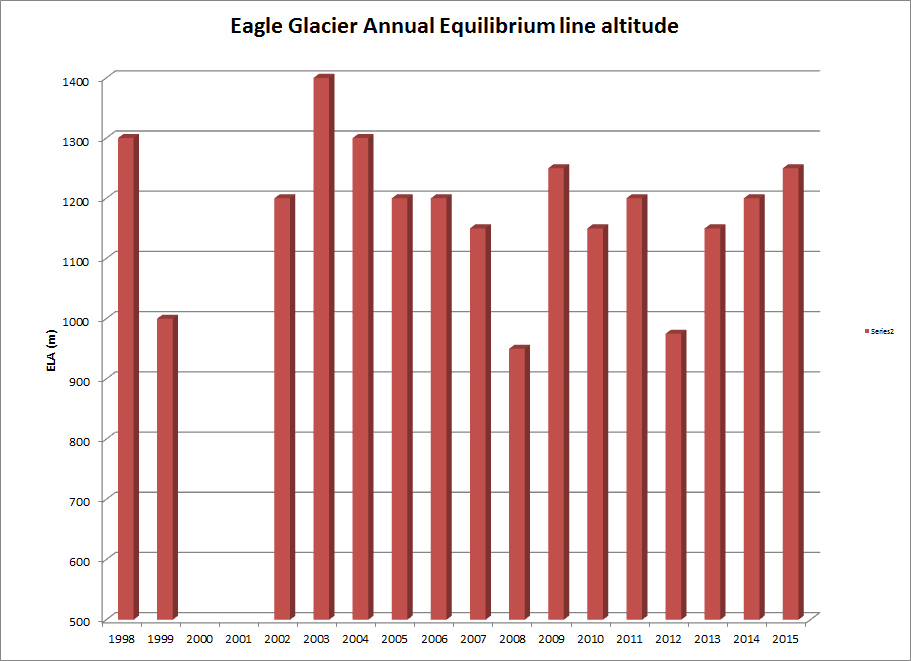
My first visit to the Eagle Glacier was in 1982 with the, ongoing and important, Juneau Icefield Research Program, that summer I just skied on the glacier. In 1984 we put a test pit at 5000 feet near the crest of the Eagle Glacier to assess the snowpack depth. This was in late July and the snowpack depth both years was 4.3 meters, checking this depth in nearby crevasses yielded a range from 4-4.5 meters.In 1984 the snowline at the end of the summer melt season in early September was at 1050 meters.The equilibrium line altitude (ELA) which marks the boundary between the accumulation and the ablation zone each year. On Eagle Glacier to be in equilibrium the glacier needs to have an ELA of 1025 meters. In the image below the glacier is outlined in green, the snowpit location is indicated by a star and the snowline that is needed for the glacier to be in equilibrium at 1025 meters is indicated. The number of years where the ELA is well above 1050 meters dominate since 2002, all but two years see chart below, leading to mass loss, thinning and glacier retreat. This follows the pattern of Lemon Creek Glacier that is monitored directly for mass balance, which has lost 26 meters of thickness on average since 1953.The more rapid retreat follows the pattern of more negative balances experienced by the glaciers of the Juneau Icefield (Pelto et al. 2013). The high snowlines have left the western most tributary with no retained snowpack in 2013, 2014 and 2015, yellow arrow in the 2014 and 2015 Landsat image.  This will lead to the rapid downwasting of this tributary.
Eagle Glacier has experienced a significant and sustained retreat since 1948 when it terminated near the northern end of a small lake.  By 1982 when I first saw the glacier and when it was mapped again by the USGS the glacier had retreated to the north end of a second and new1 kilometer long lake. In the image below the red line is the 1948 terminus, magenta line the 1982 terminus, green line 2005 terminus and orange line the 2011 terminus. From 1984 to the 2005 image the glacier retreated 550 meters, 25 meters/year. From 2005-2015 retreat increased to 60 meters/year. Going back to the 1948 map the terminus in 2011 is located where the ice was 150-175 m thick in 1948. The high snowlines in 2014 and 2015 along with extended melt season continued the rapid retreat.  Total retreat from 1984-2015 is now 1200 m. The retreat hear is less rapid than on nearby Gilkey Glacier or Antler Glacier, but the upglacier downwasting is more severe than at Gilkey Glacier.

Snowline location and snowpit location in 1984

eagle ela
ELA of Eagle Glacier from Landsat images.

eagle wing compare

2014 and 2015 Landsat image indicating snowline on Eagle Glacier, purple dots. Yellow arrow indicates tributary that lacks any retained snowpack,

Terminus change map on 2005 Google Earth image.  Red line is 1948, magenta line is 1982, green line is 2005 and orange line is 2011. 

Bernardo Glacier, Patagonia, Chile Accelerated Retreat in Expanding Lake Complex

bernardo compare

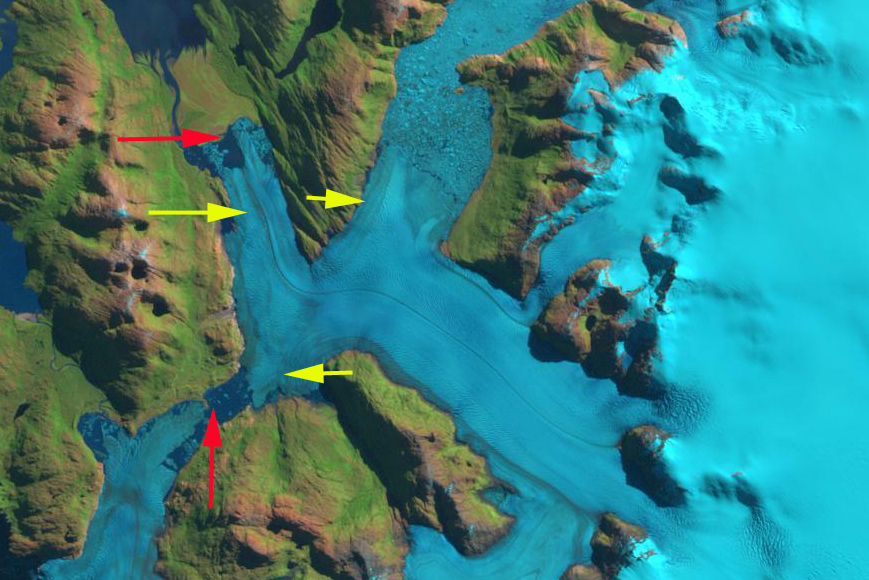
Comparison of 1986 and 2015 Landsat image of Bernardo Glaciers three termini, north, main and south. Red arrows indicate 1986 terminus location and yellow arrows the 2016 terminus location.  Indicating the substantial retreat of each terminus and lake expansion for the north and main terminus, while the lake drained at the southern terminus. 

Bernardo Glacier is a difficult to reach outlet glacier on the west side of the Southern Patagonia Icefield (SPI).  It The glacier currently ends in an expanding proglacial lake system, with three primary termini.  Here we examine changes from 1986 to 2016 using Landsat images. Willis et a (2012) quantify a rapid volume loss of the SPI from 2000-2012 of 20 giga tons per year mainly from rapid retreat of outlet glaciers. They note a thinning rate of 3.4 meters per year during this period of the Bernardo Glacier region. Mouginot and Rignot (2014) illustrate that velocity remains high from the terminus to the accumulation zone on Bernardo Glacier.  They also indicate the accumulation zone does not extend as far east toward the crest of the SPI as previously mapped. Davies and Glasser (2012) indicate that over the last century the most rapid retreat was from 2000 to 2011.

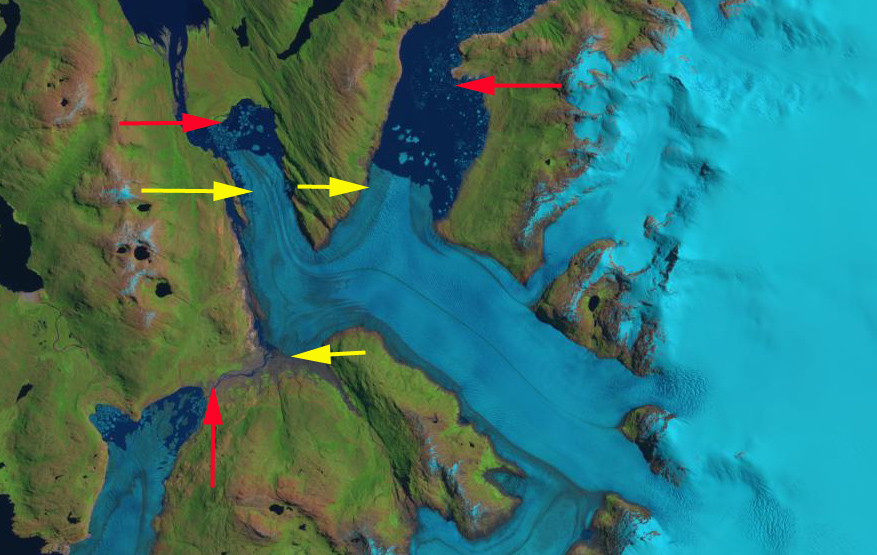
In 1986 Bernardo the southern terminus of the glacier was nearly in contact with Tempano Glacier.  The main terminus primarily ended on an outwash plain with a small proglacial lake developing.  The northern terminus had retreated a short distance south from a peninsula.  By 1998 the northern terminus had retreated into a wider, deeper lake basin, filled with icebergs. The main terminus is still mainly grounded on an outwash plain.  A small lake has developed between Bernardo Glacier and Tempano Glacier to the south. By 2003 the northern terminus had retreated 2 km from 1986, the main terminus 1.5 km and the southern terminus 1.2 km.  By 2015 the lake between Tempano and Bernardo Glacier had drained.  The main terminus had retreated 1.5 km since 1986.  In 2016 the northern terminus had retreated 3.5 km since 1986, the main terminus 2.5 km and the southern terminus 2.75 km.  The largest change is the loss of the lake between Tempano and Bernardo Glacier which slow the retreat of the southern terminus. If this terminus retreat into the another lake basin that shared with the main and north terminus, this would likely destabilize the entire confluence region.  The nearly 1 km retreat in a single year from 2015 to 2016 of the main terminus indicates the instability that will lead to further calving enhanced retreat. The retreat of this glacier fits the overall pattern of the SPI outlet glaciers, for example Chico Glacier and Lago Onelli Glaciers

.bernardo 1998

1998 Landsat image.  Red arrows indicate 1986 terminus location and yellow arrows the 2016 terminus location.

bernardo 2003

2003 Landsat image.  Red arrows indicate 1986 terminus location and yellow arrows the 2016 terminus location.  Main terminus beginning to retreat from outwash plain. 

bernardo 2015

2015 Landsat image.  Red arrows indicate 1986 terminus location and yellow arrows the 2016 terminus location.  Note the considerable difference in main terminus versus one year later in 2016.

Frostisen Ice Cap Svalbard, Ongoing Defrosting 1990-2015

frostisen compare

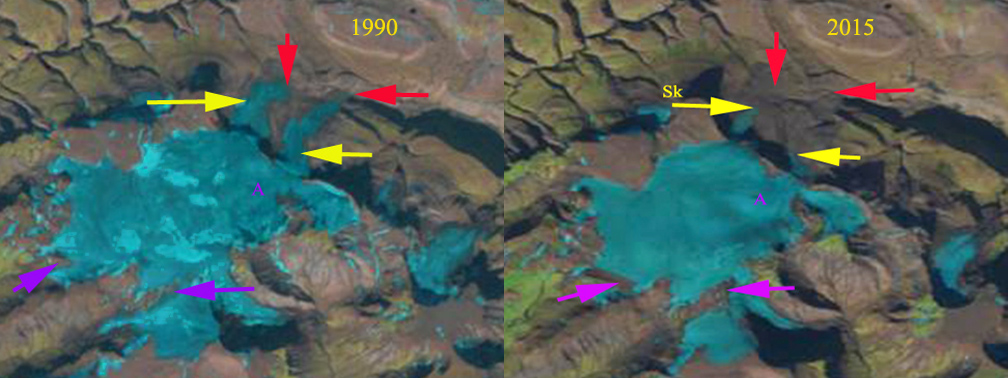
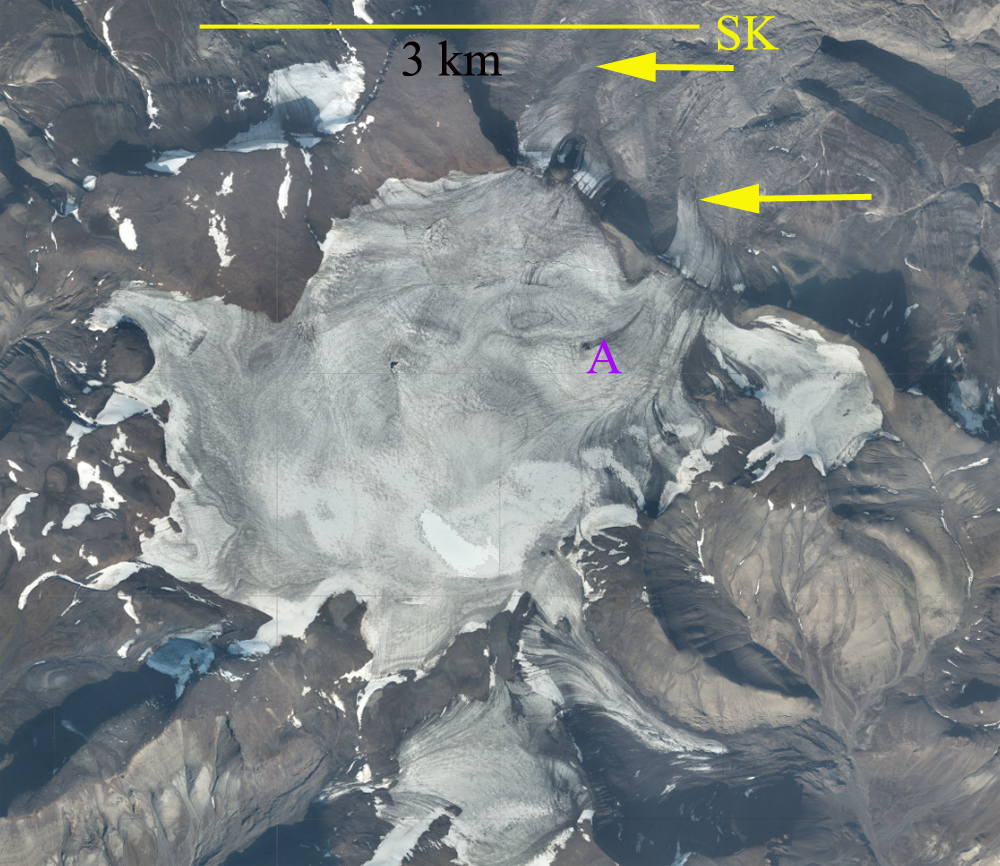
Frostisen Ice Cap in 1990 and 2015 Landsat images.  Red arrow is the 1990 terminus location, yellow arrow the 2015 terminus location.  Purple arrows indicate thinning on the upper margin of the ice cap, and the letter A indicates an outcrop of rock emerging through the ice.

Frostisen is an ice cap in Dickson Land of Central Svalbard.  The World Glacier inventory of 1960 listed the area of the ice cap at 19 square kilometers, by 2007 the Randolph Glacier Inventory indicated the ice cap area at 13.4 square kilometers.  Malecki (2013) examined seven glaciers in this region and found an acceleration in losses from 1990-2011 compared to 1960-1990 due to an increase in summer temperature post-1990 which led to higher annual equilibrium line altitudes.  The seven glacier lost 39% of their volume from 1960-2009. Here we compare 1990 and 2015 Landsat images to indicate changes in the ice cap . Malecki (2013) also noted evidence of a rapid increase in thinning rates in the upper parts of the studied glaciers, linked to decreasing albedo in former accumulation zones.

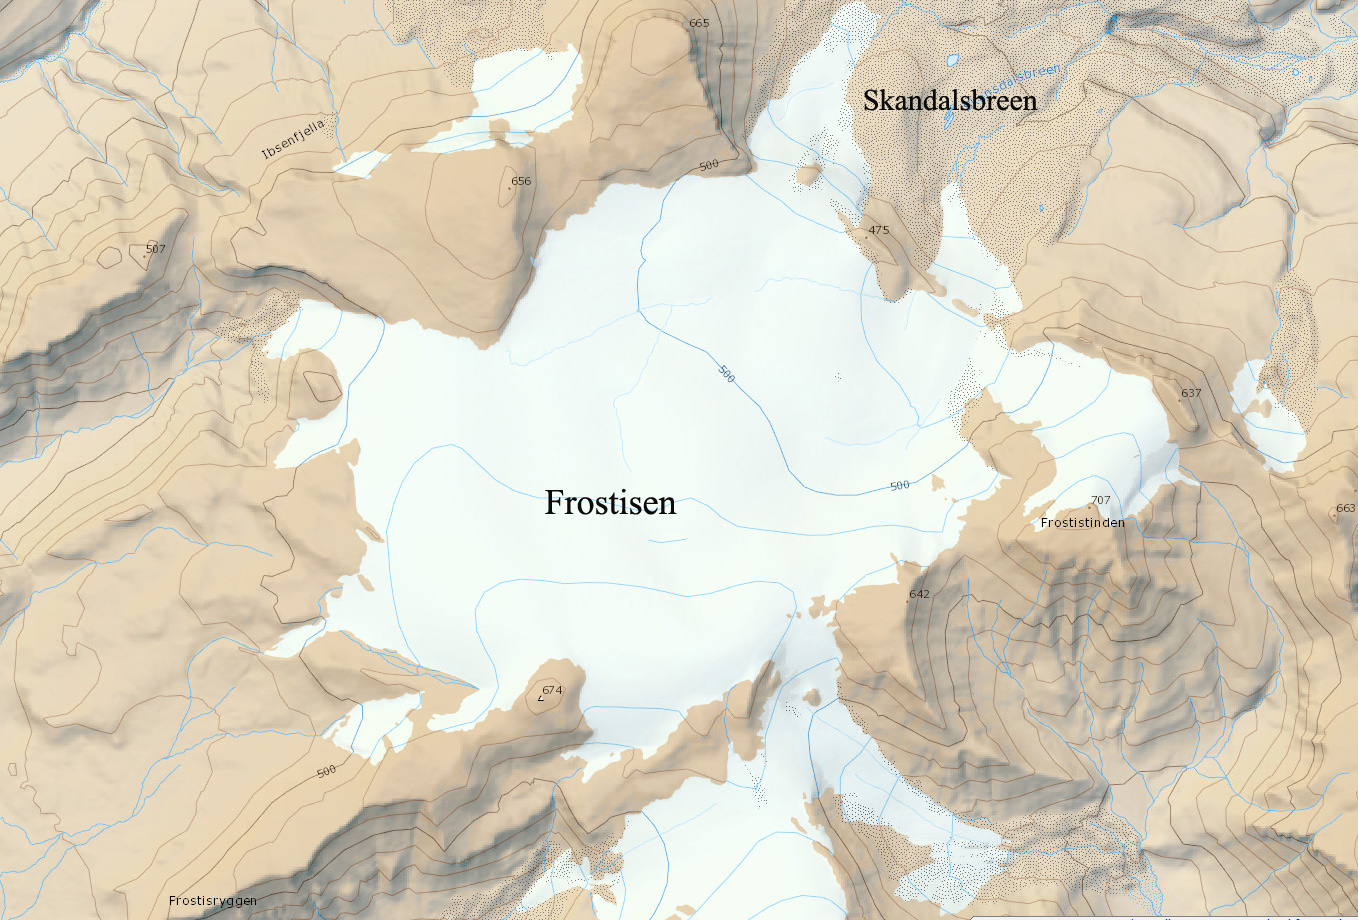
In 1990 two outlet glaciers on the east side of the icefield, Skandalsbreen and Studentbreen, after dropping over a prominent sill at 475 m extended approximately 2 km downvalley.  At Point A there is no sign of bedrock. There are limited snowpatches 10% of the ice cap with three weeks left in the melt season. In 2015 the eastern outlet glaciers have a limited extent after descending the sill, Skandalsbreen has retreated 975 m and Studentbreen 1300 m since 1990.  At Point A bedrock has emerged, this is easier seen in the image below. This is an indication of thinning in the midst of what should be the accumulation zone.  In 2013 and 2015 and many other years the ice cap has lost all of its snowcover indicating it has no accumulation zone and cannot survive (Pelto, 2010). The purple arrows indicate thinning at the upper margin of the glacier near 650 m, this would not happen if this area was acting as an accumulation zone. Nuth et al (2013) noted a 7% loss in glacier area in the last 30 years in Svalbard. The tidewater glaciers of Svalbard get most of the attention, but Frostisen like other inland terminating glaciers such as Belopolskijbreen is losing volume rapidly. .

frostisen image

TopoSvalbard satellite view above and map view below of Frostisen Ice Cap.  The maximum elevation of 650 m has been below the regional snowline many recent years. 

frostisen map

Vallelunga and Barbadorso Glacier Retreat, South Tyrol Italy

vallelunga compare

Vallelunga (above) and Barbadorso di Dentro Glacier (below) retreat from 2003 (orange line) to 2015 yellow dots.  Blue arrows indicate flow path and pink arrow the junction of main two tributaries of Vallelunga Glacier.

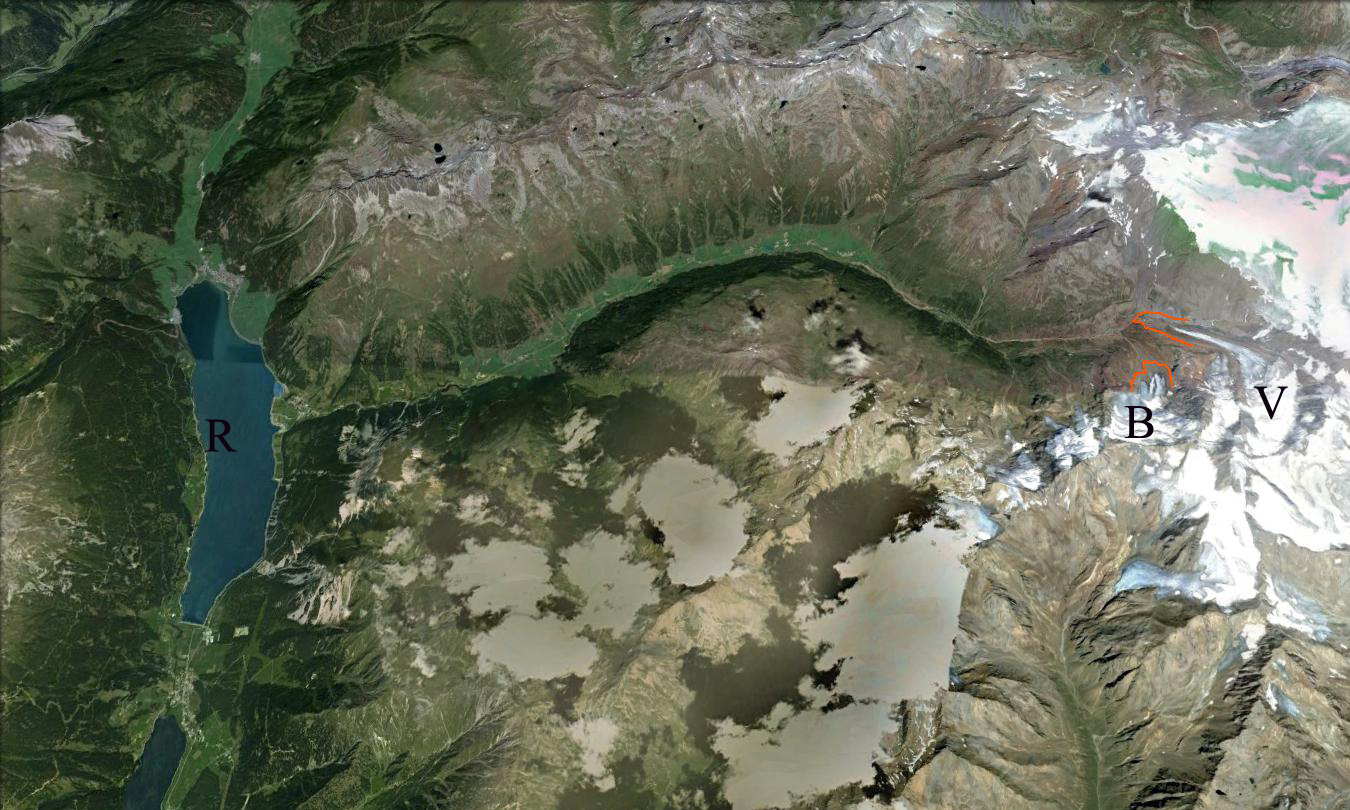
Vallelunga Glacier and Barbadorso di Dentro Glacier are at the headwaters of the Vallelunga watershed which feeds the Reschensee.  Reschensee is a reservoir famous for the church tower that emerges above its surface.  This artificial lake was completed after World War II and is the reservoir for the 105 MW Glurns Hydroproject owned by Seledison.  These two glaciers are examined as part of the annual campaign of the Italian Glacier Committee.  The annual reports for 2011-2013 indicate a retreat of 78 m for Vallelunga and 60 m for Barbadorso.  Here we examine Google Earth images from 2003 and 2015 to indicate the change in a twelve year period.

In 2003 Vallelunga Glacier terminus was at an altitude of 2500 m.  The glacier is comprised of two tributaries that join at the pink arrow. The orange line is the 2003 terminus location. By 2015 the smaller western tributary has nearly separated from the main glacier.  the terminus has retreated 460 m in the 12 year period. Barbadorso Glacier terminated at 2690 m in 2003.  By 2015 the terminus has retreated 250 m and terminates 100 m higher in elevation at nearly 2700 m. On July 31, 2015 the snowline on the two glaciers is at 3100-3200 m with 6-8 weeks left in the melt season.  This indicates another year of negative mass balance that will continue to drive retreat.

These glaciers are just across the border from Gespatcherferner one of the fastest retreating Austrian Glacier’s in recent years. Carturan et al (2016) examining long term Italian glacier mass balance series note the 2004-2013 period as particularly negative.  They further observe that this is mainly due to increased ablation and that annual balance is becoming more closely correlated with accumulation season (October-May) temperature suggesting warmer winters extending melt season and leading to an increased ratio of winter rain events. The continued reduction in glacier area reduces late summer water flow to the reservoir, which will either cause reduced power output or the need for more storage early in summer (Pelto, 2014).

reschensee ge

Vallelunga watershed feeding Reschensee (R).  Vallelunga Glacier (V) and Barbadorso Glacier (B).

vallelunga 2015 tsl

July 31, 2015 Landsat indicating a high snowline, purple dots, with nearly half the summer to go. 


Glacier Nef, Patagonia, Chile retreat 1987-2016.

nef compare

Comparison of 1987 and 2015 Landsat images of Nef Glacier at right and Cachet Glacier at left.  Indicating retreat of Nef Glacier from red arrows to yellow arrows of 1.8 km and development of a new lake at the terminus. Purple arrows indicate upglacier thinning leading to separation of glacier tributaries. 

Glacier retreat and thinning is particularly strong in the Patagonian icefields of South America. The two largest temperate ice bodies of the Southern Hemisphere are the Northern Patagonia Icefield 4,000 km2 and the Southern Patagonia Icefield, 13,000 km2. It has been estimated that the wastage of the two icefields from 1995–2000 has contributed to sea level rise by 0.105 ± 0.011 mm year,which is double the ice loss calculated for 1975-2000 (Rignot et al. 2003).   Davies and Glasser (2012) work, has an excellent figure indicating two periods of fastest recession since 1870, are 1975-1986 and 2001-2011 for NPI glaciers, which suggests that ice volume loss increased after 2000. They noted the loss was 0.07% from 1870-1986, 0.14% annually from 1986-2001 and 0.22% annually from 2001-2011. Glasser et al (2011) find the recent ice volume rate loss is an order of magnitude faster than at other time intervals since the Little Ice Age. Baker River (Rio Baker) is located to the east of the Northern Patagonia Icefield and is fed mainly by glacier melt water originating from the eastern outlet glaciers of the icefield Leones, Soler, Nef, Colonia. Rio Baker is the most important Chilean river in terms of runoff, with an annual mean discharge of about 1000 m3/s Lopez and Casassa (2009). Glacier Nef is one of the main glaciers feeding Rio Baker. Rio Baker was a proposed critical hydropower resource for Chile. Hidroaysen Project had proposed 5 dams on the Baker and Pascua River generating 2750 MW of power, all three proposed dams on the Rio Baker have been cancelled.

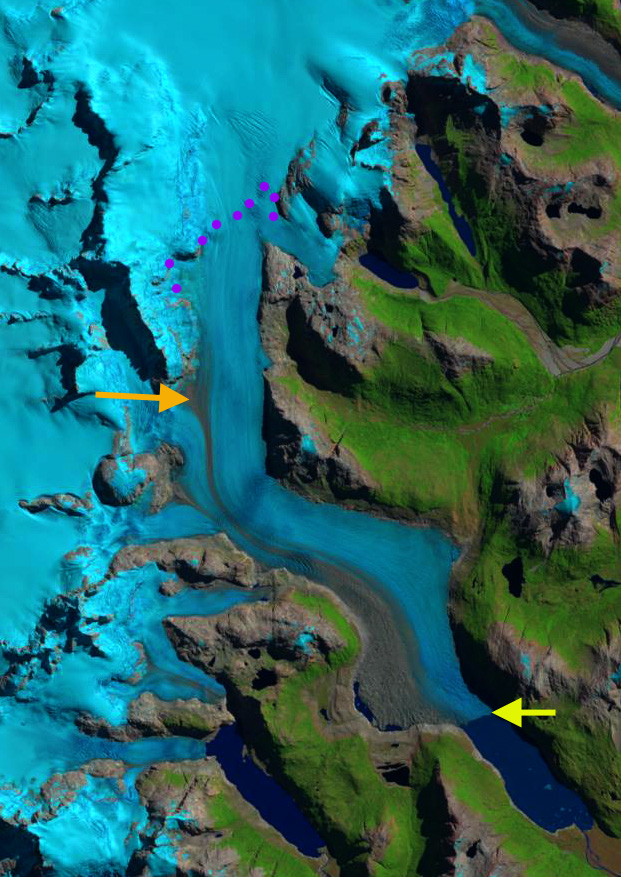
Glacier Nef began to retreat into a moraine dammed proglacial lake in 1945 (Loriaux and Casassa, 2014). By 1987 the lake remained less than 1 km long, with glacier thinning predominating over retreat. From 1987 to 2015 the glacier has retreated 1.8 km calving into the growing lake.  The lake width was essentially uniform during this phase of retreat There is not significant retreat from 2015 to 2016. The lake is currently about 5.4 square kilometers and has a mean depth of ~125 m (Loriaux and Casassa, 2014).  In 2015 Glacier Nef has not reached the head of this proglacial lake and will continue to retreat. The west side of the terminus is debris covered and has a fringing proglacial lake that has developed after 2000 and will aid in the continuing retreat. The terminus is currently at a pinning point, where the valley is constricted providing greater terminus stability. Further retreat will lead to an expansion of the embayment and calving front, leading to a further increase in glacier retreat. The lack of elevation change of the lower glacier and the isolated proglacial lake here suggests the lake will expand laterally as well as in length. The debris cover is slowing the thinning and retreat of the western margin. The purple arrows indicate thinning upglacier in a former tributary glacier. The 2016 Landsat image indicates a high snowline at 1350 m, purple dots.  Willis et al (2011) observed that the thinning rate of NPI glaciers below the equilibrium line has increased substantially from 2000-2012, partly an indication of a higher snowline indicative of greater ablation and a longer snow free period lower in the ablation zone. For example on Nef Glacier by January 8, 2016  the snowline was at 1300 m and remained high up until at least the mid-march image below. The retreat follows the pattern of enhanced calving in a proglacial lake for NPI glaciers such as Gualas Glacier, Reichert Glacier, Steffen Glacier, and Colonia Glacier.
nef 2016

2016 Landsat image of Nef Glacier indicating terminus yellow arrow and source of the debris for the debris covered terminus. 

nef terminus

Closeup of Nef Terminus from Chile Topographic Application.  Notice the widening valley just above terminus.  Debris cover is insulating ice on west side of terminus.  

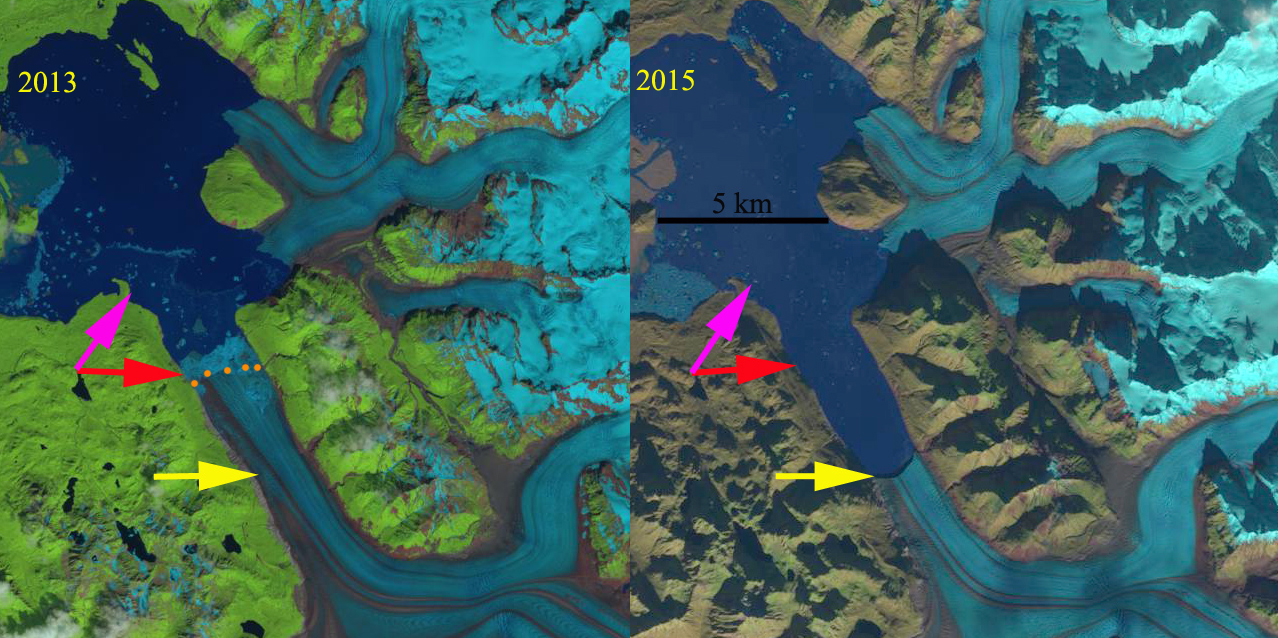
North Fork Grand Plateau Glacier, Alaska-Spectacular 3 km Retreat 2013-15

south alsek glacier compare

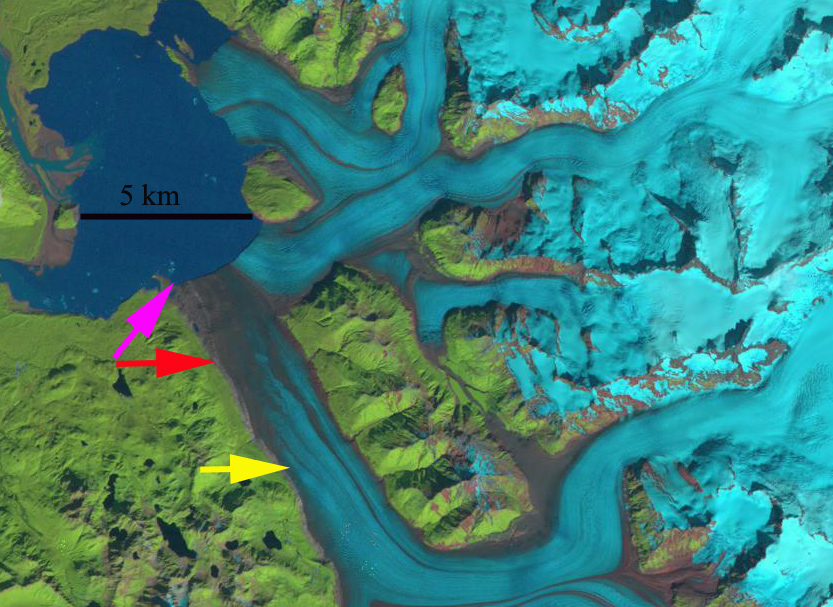
North Fork Grand Plateau Glacier comparison in 2013 and 2015 Landsat images.  Illustrating the rapid retreat and lake expansion in just two years. Pink arrow is 1984 terminus, red arrow is the 2013 terminus and yellow arrow 2015 terminus. The orange dots are the 2013 terminus. 

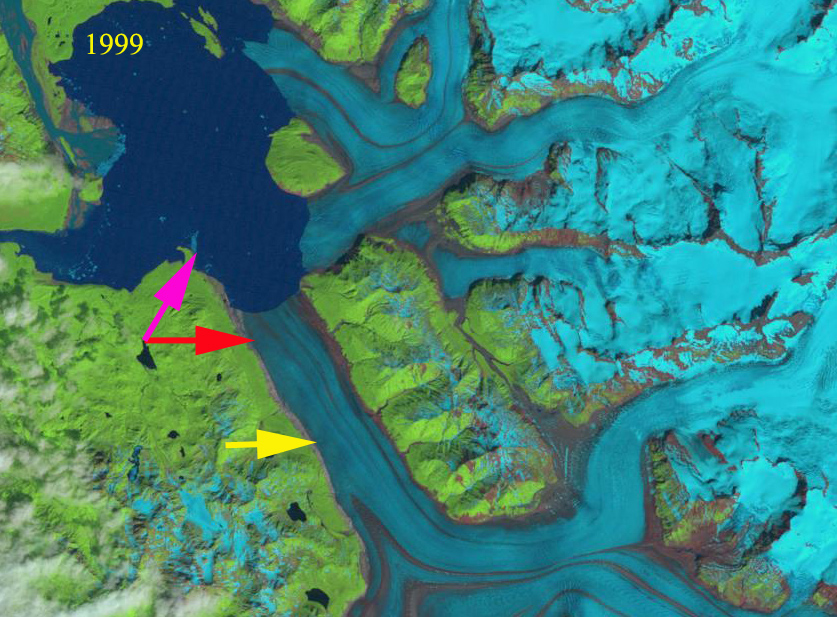
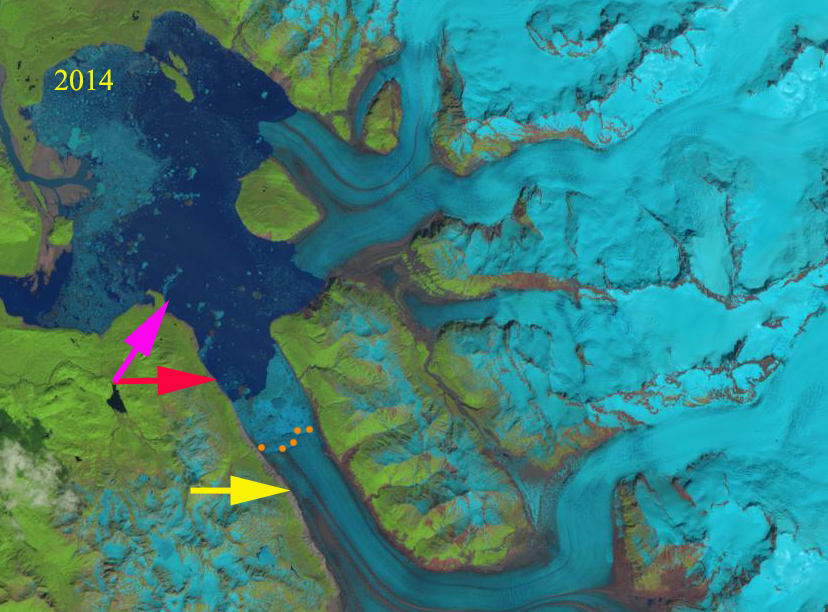
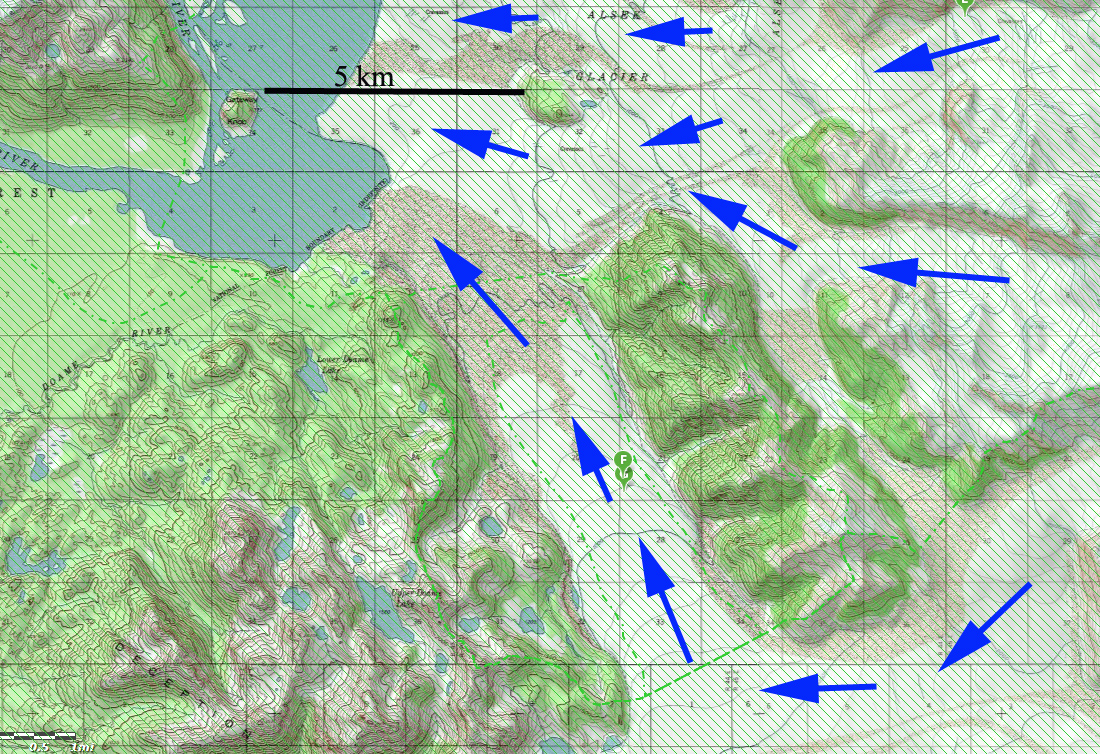
The Alsek Glacier is a large glacier draining into Alsek Lake and the Alsek River in southeast Alaska  Its neighbor the Grand Plateau Glacier has one fork  flows north and joins the Alsek Glacier terminating in Alsek Lake. The USGS topographic map compiled from a 1958 aerial image indicates a piedmont lobe spread out into a proglacial lake that is less than 3 km wide, with a combined ice front of the Alsek Glacier and North Fork Grand Plateau Glacier.. There is a 10.5 km wide calving front in the lake.  By 1984 the glacier had separated into a northern and southern calving front on either side of an island and had a 13 km wide calving front.   Here we focus on the southern lobe, which is comprised of a lobe of  the Alsek Glacier and a the North Fork Grand Plateau Glacier that merges with Alsek Glacier.  From 1984 and 1999 the two lobes separated as the North Fork retreated 2.2 km.  From 1999 to 2013 the North Fork retreated 1.5 km up a newly forming southern arm of Alsek Lake.  The retreat over the 30 period of 3.7 kilometers averaged ~120 meters/year. Landsat imagery in 2013 and 2014 indicate extensive calving from the North Fork Grand Plateau Glacier.  From 2013 to 2015 the terminus has retreated 3.0 km, 1.5 km/year.  This is likely the fastest retreat rate in recent years of any Alaskan glacier. The calving front in Alsek Lake has been reduced to 5.4 km in three separate sections.

The retreat has been similar in timing to nearby Alsek River watershed glaciers Walker Glacier, East Novatak Glacier and North Alsek Glacier..  The rapid retreat is enhanced by calving in proglacial lakes, a common issue increasing area loss of Alaskan glaciers.  Yakutat Glacier is an example of rapid lake expansion. In the case of Yakutat Glacier unlike the Alsek or Grand Plateau Glacier the glacier lacks any high elevation accumulation zone and cannot survive without an accumulation zone (Trüssel et al 2015).  Grand Plateau Glacier and Alsek Glacier both have large accumulation areas above 2000 m, that are well above the snowline at all times.  The Alsek River is a destination for sockeye salmon fishing and river rafting, see Chilkat Guides or Colorado River and Trail Expeditions.  Continued expansion of lake area as glaciers retreat in the watershed, is changing the nature of the Alsek River.

alsek map

USGS Topographic map of region from 1958 aerial images indicating merging of Alsek Glacier and North Fork Grand Plateau Glacier. 

alsek 1984

1984 Landsat image indicating terminus locations. Pink arrow is 1984 terminus, red arrow is the 2013 terminus and yellow arrow 2015 terminus.

alsek 1999

1999 Landsat image indicating terminus locations. Pink arrow is 1984 terminus, red arrow is the 2013 terminus and yellow arrow 2015 terminus.

alsek 2014

2014 Landsat image.  indicating terminus locations. Orange dots indicate the ice front. Pink arrow is 1984 terminus, red arrow is the 2013 terminus and yellow arrow 2015 terminus.

Krayniy Glacier Retreat, Novaya Zemlya

kraniy

Krayniy Glacier (Ky) comparison in 1990 and 2015 Landsat images.  Red arrow is 1990 terminus and yellow arrow is the 2015 terminus.  Purple arrows indicate upglacier thinning and green arrow a location of a glacier dammed lake.

Krayniy Glacier is an outlet glacier that drains the northern side of the Novaya Zemlya Ice Cap into the Barents Sea. This outlet glacier is just southwest of Tasija Glacier (T) and like that glacier has retreated over 1.2 km since 1988. Krayniy Glacier has been retreating like all tidewater glaciers in northern Novaya Zemlya (LEGOS, 2006). The terminus of the glacier has a pinning point on an island at present. Carr et al (2014) identified an average retreat rate of 52 meters/year for tidewater glaciers on Novaya Zemlya from 1992 to 2010 and 5 meters/year for land terminating glaciers. The increased retreat rate coincides with the depletion of ice cover in the Barents Sea region and a warming of the ocean. Both would lead to increased calving due to more frontal ablation and notch development similar to at Svalbard (Petlicki et al. 2015).  The spring of 2016 features an ice free west coast of Novaya Zemlya leading to enhanced calving front melting.

In 1990 the glacier had an east west terminus across the head of the fjord.  There was a substantial glacier dammed lake impounded by the glacier (green arrow), and there was a narrow connection with Tasija Glacier.  The glacier dammed lake persisted in Landsat images in 1999, 2000, 2003 and 2006.  In 2013 the proglacial lake had drained.  In 2014 and 2015 the lake has not reformed, an indication of glacier thinning at the outlet location. This thinning is evident at both purple arrows,where the connection with the Tasija Glacier has been severed and a substantial nunatak has emerged amidst the glacier. From 1990 to 2015 the glacier has retreated more on the eastern margin with 1250 of retreat opening up the embayment.  Retreat at the island in the glacier center has been 500 m since 1990. The western section of the glacier has retreated little. The eastern embayment will continue to drive retreat and glacier thinning that will reduce contact with the island pinning the eastern half of the glacier.  The thinning is evident at the purple arrows. The glacier will likely retreat from this island in a fashion similar to Tasija and Chernysheva, which will lead to increased rate of retreat of the entire ice front.

kraniy lake

1988, 2006 and 2014 Landsat images indicating the continued presence of glacier dammed lake from 1988-2006 and continued absence from 2014 and 2015.arctic.seaice4262016

Sea ice image from Cryosphere Today

Pacific Northwest Glaciers: Widespread early Melt Season Arrival

[ngg_images source=”galleries” container_ids=”43″ display_type=”photocrati-nextgen_basic_imagebrowser” ajax_pagination=”1″ template=”/nas/wp/www/sites/blogsorg/wp-content/plugins/nextgen-gallery/products/photocrati_nextgen/modules/ngglegacy/view/imagebrowser-caption.php” order_by=”sortorder” order_direction=”ASC” returns=”included” maximum_entity_count=”500″]


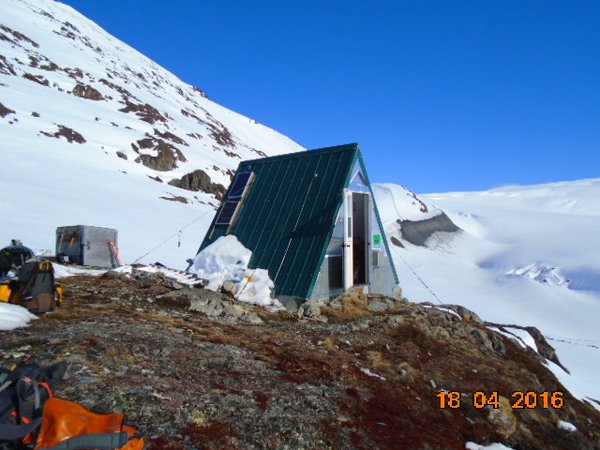
The 2016 melt season is off to an early start in Greenland, but this is not the only location.  This winter proved to be warm, but relatively wet across much of the Pacific Northwest.  A look at the average freezing level (determined by North American Freezing Level Tracker-Developed by John Abatzoglou and Kelly Redmond) from January 1 to April 20 indicates freezing levels well above average on Mount Baker North Cascades, Washington, Bugaboo Mountains British Columbia and Juneau Icefield Alaska.  Reports from the field in British Columbia, Alaska and Washington identify a peak snowpack in late March instead of early May at glacier elevations.

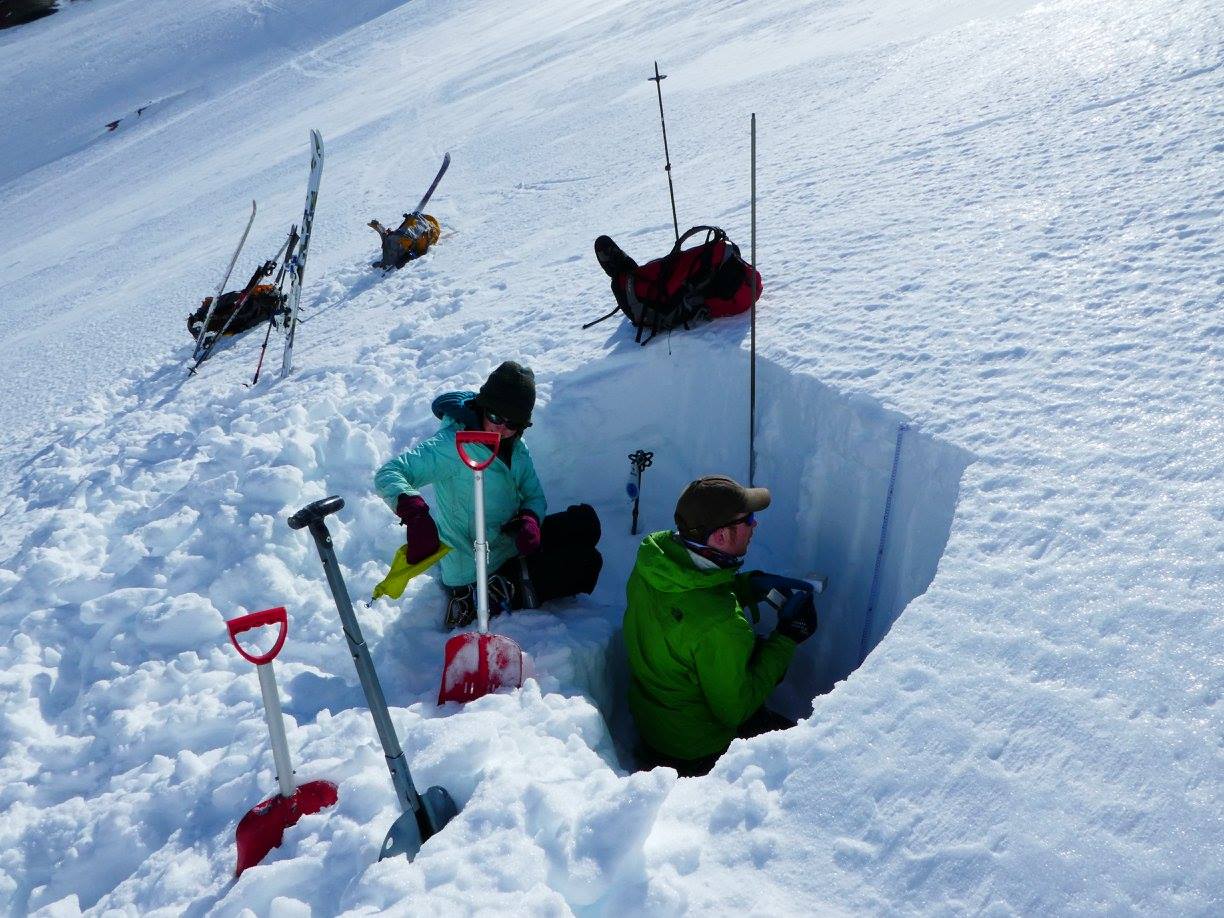
In British Columbia the University of Northern British Columbia field team is currently on Conrad Glacier in the Bugaboos, having just finished Kokanee Glacier. This is part of a five-year study led by Dr. Brian Menounos, UNBC Canada research chair in glacier change, funded by the Columbia Basin Trust. UNBC PhD student Ben Pelto heads the research team. They have found that despite snowpack observations for the region from the BC River Forecast Centre of slightly above average snowpack on April 1, the high winter freezing levels and very warm April conditions have left the Kokanee Glacier snowpack quite similar to the low 2015 snowpack, with close to 4.5 m of retained snowpack.  The snowmelt season was noted by the River Forecast Centre as starting several weeks early. The freezing level from January-April 20 was a record for the 1948-2016 period by over 100 m for the Bugaboo mountains.  The region based on the warm spring causing rapid snow melt at lower elevations is leading many, Including John Pomeroy, to expect high forest fire danger and low streamflow during the summer across the Western Canada. 

zillmer snowpit

Snowpit being excavated on Zillmer Glacier April 2016, Jill Pelto and Micah May. (Ben Pelto)

BenPelto-and-JillPelto-BCGlacierClimateProject-Kokanee-April2016-TomHammond

Jill Pelto and Ben Pelto measuring density of firn core on Kokanee Glacier. (Tom Hammond)

In Alaska  USGS-Glaciology has been completing GPR surveys of their benchmark glaciers in recent weeks.  On the Juneau Icefield Lemon Creek Glacier is a reference for the World Glacier Monitoring Service.  Mass balance records exist since 1953 for this glacier (Pelto et al, 2013). In April the glaciers are typically covered head to toe by snow.  The last four months indicate a freezing level of nearly 900 m a record for the 1948-2016 period of record. An April 19th Landsat image indicates the snowline on Herbert and Mendenhall Glacier at 600 m. This is below the terminus of Lemon Creek Glacier at 800 m.  Near the Juneau Icefield the Long Lake Snotel site at 260 m in elevation had its snowpack drop from 64 cm water equivalent to 38 cm water equivalent in the last month.

wolverine base camp

USGS Wolverine Glacier Base Camp last week with field work underway. 

juneau icefield april 2016

April 19 Landsat image of the southwest side of the Juneau Icefield.  Snowline indicated by Purple arrows. M=Mendenhall, H=Herbert, L=Lemon Creek and T=Taku Glacier.

For Mount Baker, Washington the freezing level from January-April 20 was not as high as the record from 2015, but still was 400 m above the long term mean.  Observations at the base of Easton Glacier, one of our key glaciers in the North Cascades, indicate that the snowpack has declined from a depth of 4.8 m to 3.4 m during the first three weeks of April. This is mainly due to compaction, versus snow water equivalent loss, but still represents the rapid densification that occurs as snowmelt begins in earnest.

easton 2016 snowpack april

April 2016 image from icefall on Easton Glacier at 2500 m above (Adam Dunn) and in August below same area (Jill Pelto). 

DSC07209


Goddess of Light (Kolahoi) Glacier Showing Mortality, Kashmir Retreat 1993-2015

kolahoi compare

Kolahoi Glacier comparison in Landsat images from 1993 to 2014.  Kolahoi Glacier is the northern glacier, East Kolahoi Glacier the other noted glacier.  Red arrows indicate 1993 terminus locations, and yellow arrows the 2014 terminus locations. 

The Kolahoi Glacier in Kashmir is known as the—”goddess of light”—Gwash Brani  (NatGeo, 2010). The glacier descends the north side of the mountain with two tongues of the glacier merging above the terminus in 1993. The glacier drains into the Liddar River and then the Jhelum River system.  The Jhelum River has several large operating hydropower stations and several more under construction including the Karot Hydropower Project a 720 MW run of river project.  Jeelani et al (2012) observed that the Liddar Watershed derives 60% of its runoff from snowmelt and just 2% from glacier ice melt.  They further report that the Liddar watershed has 17 glaciers covering an area of 40 km2 in 2008. The climatic warming in the region has led to mass wasting of Kolshoi Glacier and retreat.  From 1970 to 1990 there was a cooling trend of about −0.02°C per year followed by the time period from 1991 to 2010 with the highest increasing trend of 0.07°C per year (Jeelani et al 2012) .  Tayal (2011) observed the detachment of the two glacier branches and a loss of 2-3.5 m of ice thickness due to ablation in the lower reach of the glacier.

jhelum_river_basin

Hydropower Projects in Jhelum Basin.

From 1993 to 2001 there is limited retreat of Kolahoi Glacier and East Kolahoi Glacier, though both glacier fronts become narrower.  By 2006 Kolahoi Glacier has retreated to near the base of a steeper slope.  The glacier remains heavily crevassed in the region above the icefall within 1 km of the terminus, Point A. By 2014 the glacier has retreated to the top of the steeper slope between two bedrock knobs at 3650 m, total retreat from 1993 to 2014 is 700 m.  Crevassing above the slope, at Point A, that used to be an icefall has become limited since 2006 and before.  The reduction in velocity indicates retreat will continue. The western tributary of the Kolahoi has developed a separate termini from the main glacier after 2001, single vertical red arrow.. The East Kolahoi Glacier has retreated 300 m.  The lower 300 m of Kolahoi Glacier is thin and relatively uncrevassed.  This indicates the retreat will continue.  This region has its highest precipitation from January through April and highest runoff in June and July.  Hence, the glacier is not a summer accumulation type like glaciers to the east in the Himalaya. The retreat is similar to that of Samudra Tupa Glacier and Durung Drung Glacier.

kolahoi ge 2014

Google Earth image from 2014 of Mount Kolahoi and its main glaciers flow directions indicated.
kolahoi 2001

2001 Landsat image of Kolahoi Glacier

koahoi 2015

2015 Landsat image of Kolahoi Glacier

kolahoi terminus compare

Google Earth image of the terminus area outlined in blue of Kolahoi Glacier in 2006 and 2014. 

kolahoi-fig-0006

Image of the terminus of Kolahoi Glacier in 2010 from Jellani et al (2012)