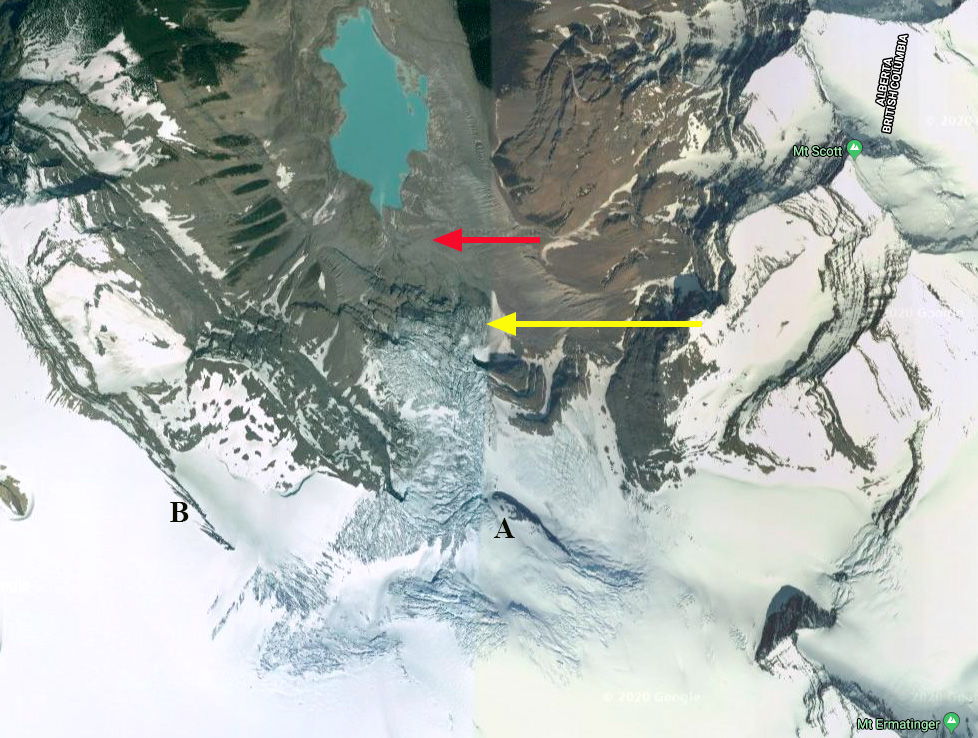
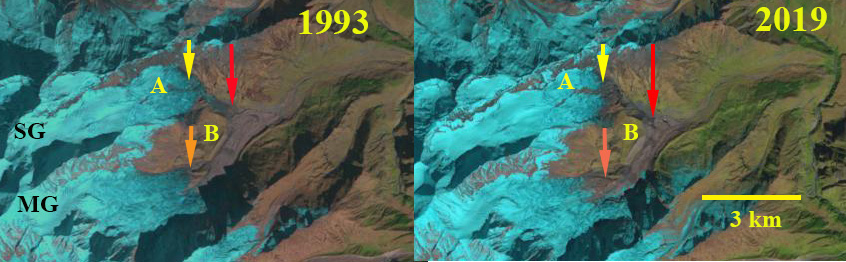
From REMA Landsat images from Feb. 2016 and Oct. 2019 indicating the front of the Cugnot Ice Piedmont (CP) and Broad Valley (BV) ice fronts in Eyrie Bay. Point A, B, and C indicate specific bedrock knobs near the ice front. Point D is just south of a side glacier entering the bay.
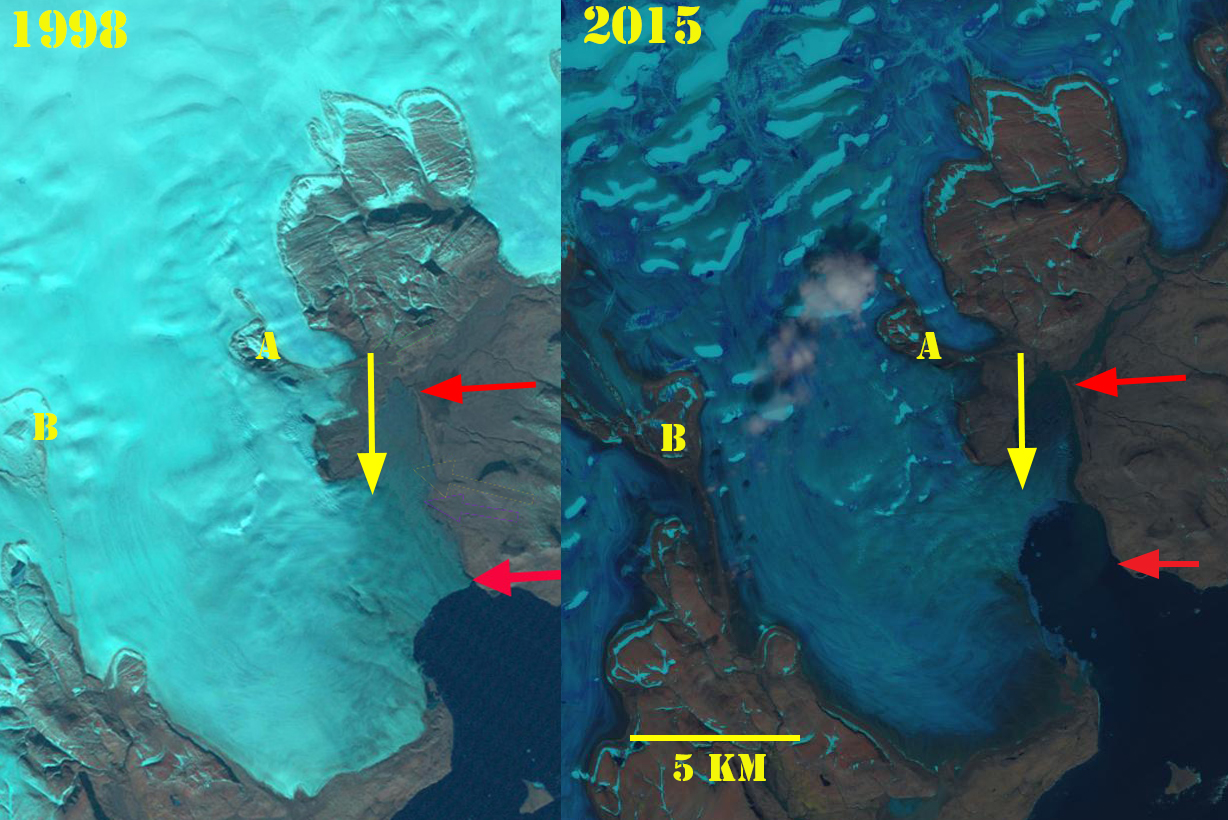
Eyrie Bay is near the tip of the Antarctic Peninsula and is rimmed by tidewater glaciers including the Cugnot Ice Piedmont. The changes of the ice front fed by the Cugnot and from Broad Valley were mapped by Ferrigno et al (2008) They noted a retreat from 1956-1977 averaging 36 m/year from 1977-1988 a retreat of 12 m/year, and 6 m/year from 1988-2000. Here we examine Landsat imagery from 2000-2020 to identify changes of the two glacier fronts. The continued significant warming air temperatures on the Antarctic Peninsula have increased surface ablation in the region (Barrand et al 2013), with 87% of glaciers around the Antarctic Peninsula now receding Davies et al (2012) . The most dramatic response has been the collapse of several ice shelves, Jones, Prince Gustav, Wordie, Larsen A and Larsen B. The nearby Prince Gustav Ice Shelf connecting James Ross Island to the Trinity Peninsula collapsed after 1995 (Glasser et al 2011).
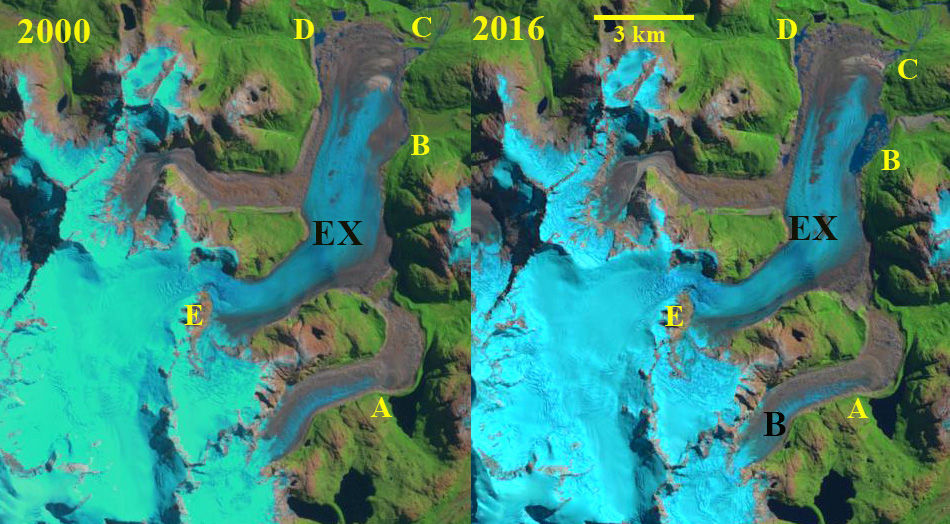
In 2000 the Broad Valley terminus (BV) extended 500 m beyond bedrock knob at Point A and 1400 m eastward beyond the bedrock knobPoint B. The Cugnot Ice Piedmont terminus (CP) extended from the northern tip of the bedrock knob at Point C. In 2016 the BV terminus in Eyrie Bay was 600 m east of the Point A bedrock knob and 1200 m east of the Point B bedrock knob. By October 2019 the BV ice front had retreated to the bedrock knob at Point B and terminated near the western end of the bedrock knob at Point A, with just a narrow band of fringing ice around Point A. At Point C a small embayment has developed along the west margin of the CP terminus and the embayment near Point D has become wider and move concave.
The surface slope upglacier of the BV terminus rises quickly indicating a rising bedrock topography too, which should slow retreat in the near future. The CP terminus has a gradual even slope suggesting there will be continued retreat. The retreat of glaciers in this region has been attributed to both atmospheric warming in the region driving surface melt increases , and in some cases increasing ocean temperatures and ice shelf bottom melting (Barrand et al 2013; Davies et al 2014).

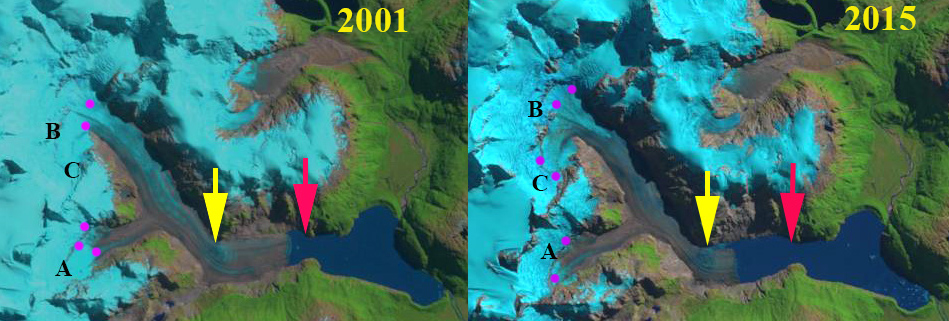
Landsat images from 2000 and 2020 indicating the front of the Cugnot Piedmont (CP) and Broad Valley (BV) ice fronts in Eyrie Bay. Point A, B, and C indicate specific bedrock knobs near the ice front. Point D is just south of a side glacier entering the bay.
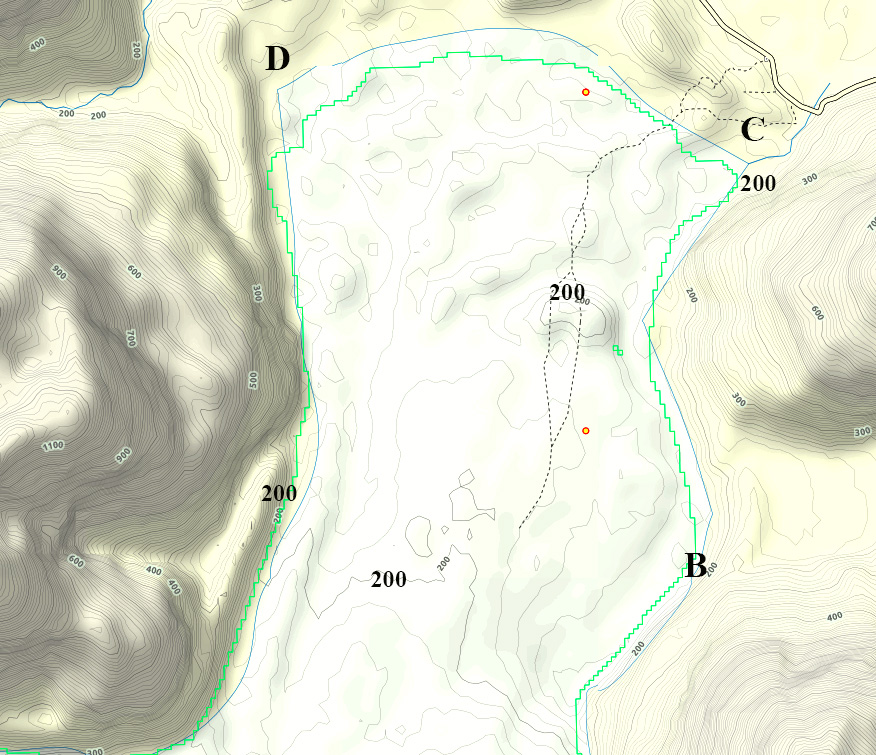
From REMA Antarctica contour of Broad Valley (BV) and Cugnot Ice Piedmont (CP), contour interval is 25 m.